movr q4 2016 report - scientiamobile - wurfl · pdf filemovr 7 top tablets by device •...
TRANSCRIPT

The first step in a great mobile experience
MOVRMobile Overview ReportOctober – December 2016
The first step in a great mobile experience
The first step in a great mobile experience2
Intro
Intro
MOVR
• Donovan Graphics
3
Executive Summary
Q4 to Q3 2016 Comparisons

MOVR5
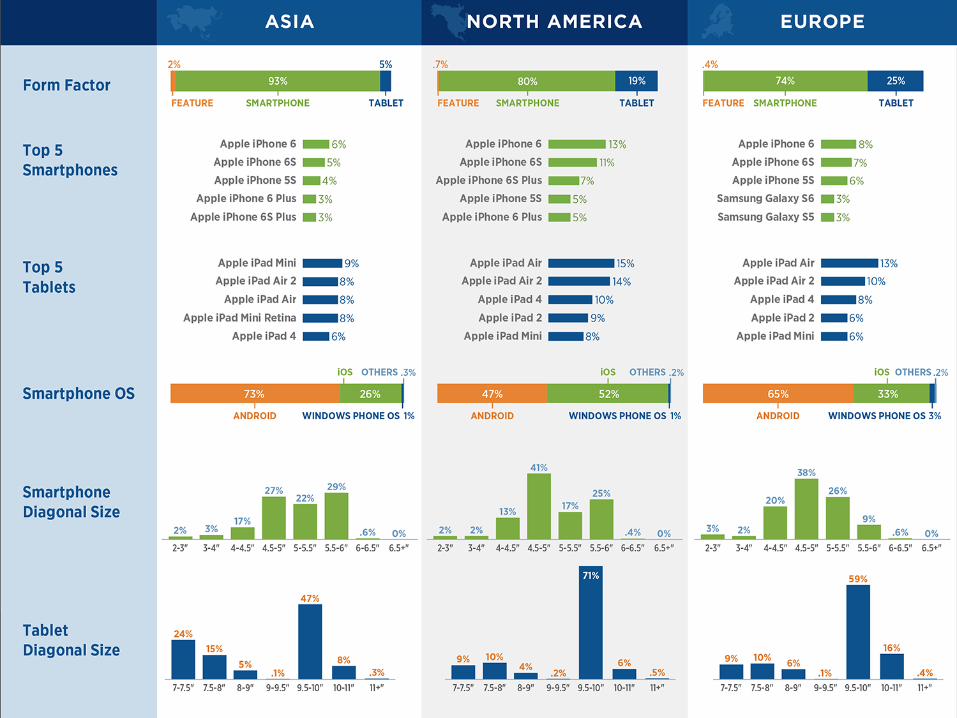
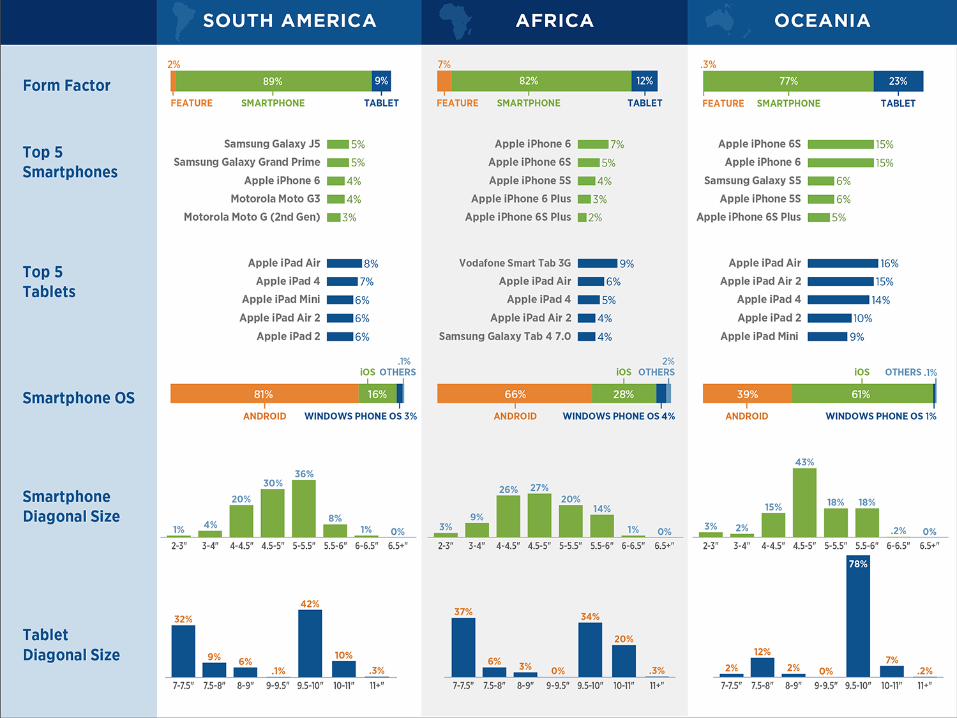
Top Smartphone by Device
• Overall, the iPhone 6 and 6S are gaining significant market share in North America and Oceania with more than 15% for both in Oceania and more than 11% for both in North America.
• In Europe and Asia, the most adoption in the last quarter of 2016 was of the iPhone 6. In 2nd place was the iPhone 6S for all these continents. The largest gain from these geographies was from Europe.
• Oceania also showed market share gain by Samsung Galaxy model, specifically S5, S7 with 6.2% and 4.3% respectively.
• South America saw the most diverse widespread market share growth by model type, including Samsung Galaxy Grand Prime (4.6%), J5 (4.8%) along with the iPhone 6 at 4.3% and several Motorola Moto models with more than 3% share gains.
Source: ScientiaMobile. Note: figures reflect percentage point change (2016Q4%-2016Q3%)
Smartphone Device Africa Asia Europe North America Oceania South America
Apple iPhone 5 2.0% 2.1% 1.7% 1.2% 2.9% 1.2%
Apple iPhone 5C 0.5% 0.4% 1.6% 2.2% 1.8% 0.9%
Apple iPhone 5S 3.9% 4.0% 5.8% 5.3% 6.0% 3.2%
Apple iPhone 6 6.7% 6.0% 8.2% 12.9% 15.0% 4.3%
Apple iPhone 6 Plus 2.5% 3.2% 1.2% 5.2% 4.9% 1.0%
Apple iPhone 6S 4.8% 4.7% 7.1% 11.5% 15.2% 2.6%
Apple iPhone 6S Plus 2.1% 2.9% 1.3% 6.8% 5.4% 0.8%
Apple iPhone 7 0.8% 1.0% 1.6% 2.8% 3.7% 0.5%
Motorola Moto G 0.0% 0.1% 0.1% 0.3% 0.1% 3.0%
Motorola Moto G (2nd Gen) 0.0% 0.1% 0.1% 0.1% 0.1% 3.4%
Motorola MotoG3 0.0% 0.1% 0.2% 0.2% 0.1% 3.6%
Samsung Galaxy A3 1.0% 0.8% 2.1% 0.1% 0.2% 0.5%
Samsung Galaxy Grand Neo 1.8% 0.9% 0.8% 0.1% 0.0% 0.8%
Samsung Galaxy Grand Prime 0.6% 1.2% 1.8% 1.2% 0.1% 4.6%
Samsung Galaxy J1 1.9% 0.7% 0.3% 0.2% 0.4% 1.0%
Samsung Galaxy J1 Ace 2.0% 0.1% 0.0% 0.0% 0.3% 0.4%
Samsung Galaxy J2 (2015) 0.9% 1.5% 0.0% 0.2% 0.4% 1.7%
Samsung Galaxy J5 2.0% 1.8% 2.2% 0.3% 0.6% 4.8%
Samsung Galaxy J7 0.8% 2.7% 0.1% 0.8% 0.1% 3.3%
Samsung Galaxy Note 3 0.8% 1.8% 0.6% 0.6% 0.7% 0.2%
Samsung Galaxy Note 4 0.8% 1.7% 0.8% 1.2% 1.0% 0.2%
Samsung Galaxy S4 1.6% 1.7% 1.9% 1.5% 1.6% 1.0%
Samsung Galaxy S5 1.8% 1.4% 3.0% 3.3% 6.2% 1.2%
Samsung Galaxy S6 1.2% 1.0% 3.3% 2.7% 3.7% 0.8%
Samsung Galaxy S6 Edge 1.0% 0.8% 2.0% 0.9% 1.6% 0.6%
Samsung Galaxy S7 0.7% 0.7% 1.7% 2.6% 4.3% 0.4%
Samsung Galaxy S7 Edge 0.9% 1.3% 2.2% 2.0% 2.6% 0.6%
others 56.9% 55.5% 48.5% 33.8% 21.2% 53.4%
MOVR6
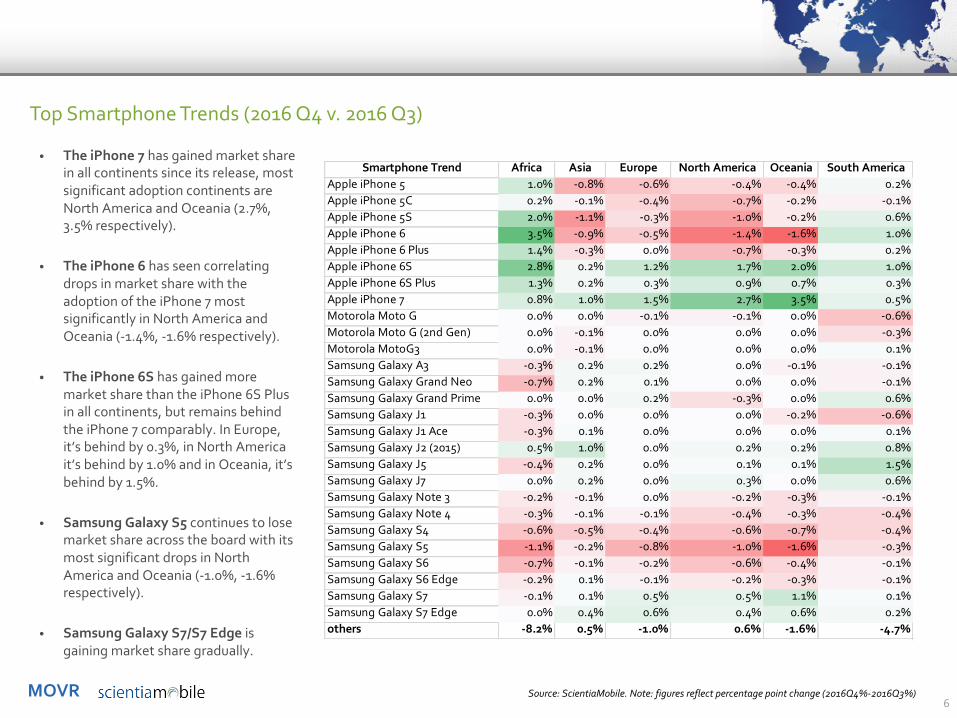
Top Smartphone Trends (2016 Q4 v. 2016 Q3)
Source: ScientiaMobile. Note: figures reflect percentage point change (2016Q4%-2016Q3%)
• The iPhone 7 has gained market share in all continents since its release, most significant adoption continents are North America and Oceania (2.7%, 3.5% respectively).
• The iPhone 6 has seen correlating drops in market share with the adoption of the iPhone 7 most significantly in North America and Oceania (-1.4%, -1.6% respectively).
• The iPhone 6S has gained more market share than the iPhone 6S Plus in all continents, but remains behind the iPhone 7 comparably. In Europe, it’s behind by 0.3%, in North America it’s behind by 1.0% and in Oceania, it’s behind by 1.5%.
• Samsung Galaxy S5 continues to lose market share across the board with its most significant drops in North America and Oceania (-1.0%, -1.6% respectively).
• Samsung Galaxy S7/S7 Edge is gaining market share gradually.
Smartphone Trend Africa Asia Europe North America Oceania South AmericaApple iPhone 5 1.0% -0.8% -0.6% -0.4% -0.4% 0.2%Apple iPhone 5C 0.2% -0.1% -0.4% -0.7% -0.2% -0.1%Apple iPhone 5S 2.0% -1.1% -0.3% -1.0% -0.2% 0.6%Apple iPhone 6 3.5% -0.9% -0.5% -1.4% -1.6% 1.0%Apple iPhone 6 Plus 1.4% -0.3% 0.0% -0.7% -0.3% 0.2%Apple iPhone 6S 2.8% 0.2% 1.2% 1.7% 2.0% 1.0%Apple iPhone 6S Plus 1.3% 0.2% 0.3% 0.9% 0.7% 0.3%Apple iPhone 7 0.8% 1.0% 1.5% 2.7% 3.5% 0.5%Motorola Moto G 0.0% 0.0% -0.1% -0.1% 0.0% -0.6%Motorola Moto G (2nd Gen) 0.0% -0.1% 0.0% 0.0% 0.0% -0.3%Motorola MotoG3 0.0% -0.1% 0.0% 0.0% 0.0% 0.1%Samsung Galaxy A3 -0.3% 0.2% 0.2% 0.0% -0.1% -0.1%Samsung Galaxy Grand Neo -0.7% 0.2% 0.1% 0.0% 0.0% -0.1%Samsung Galaxy Grand Prime 0.0% 0.0% 0.2% -0.3% 0.0% 0.6%Samsung Galaxy J1 -0.3% 0.0% 0.0% 0.0% -0.2% -0.6%Samsung Galaxy J1 Ace -0.3% 0.1% 0.0% 0.0% 0.0% 0.1%Samsung Galaxy J2 (2015) 0.5% 1.0% 0.0% 0.2% 0.2% 0.8%Samsung Galaxy J5 -0.4% 0.2% 0.0% 0.1% 0.1% 1.5%Samsung Galaxy J7 0.0% 0.2% 0.0% 0.3% 0.0% 0.6%Samsung Galaxy Note 3 -0.2% -0.1% 0.0% -0.2% -0.3% -0.1%Samsung Galaxy Note 4 -0.3% -0.1% -0.1% -0.4% -0.3% -0.4%Samsung Galaxy S4 -0.6% -0.5% -0.4% -0.6% -0.7% -0.4%Samsung Galaxy S5 -1.1% -0.2% -0.8% -1.0% -1.6% -0.3%Samsung Galaxy S6 -0.7% -0.1% -0.2% -0.6% -0.4% -0.1%Samsung Galaxy S6 Edge -0.2% 0.1% -0.1% -0.2% -0.3% -0.1%Samsung Galaxy S7 -0.1% 0.1% 0.5% 0.5% 1.1% 0.1%Samsung Galaxy S7 Edge 0.0% 0.4% 0.6% 0.4% 0.6% 0.2%others -8.2% 0.5% -1.0% 0.6% -1.6% -4.7%
MOVR7
Top Tablets by Device
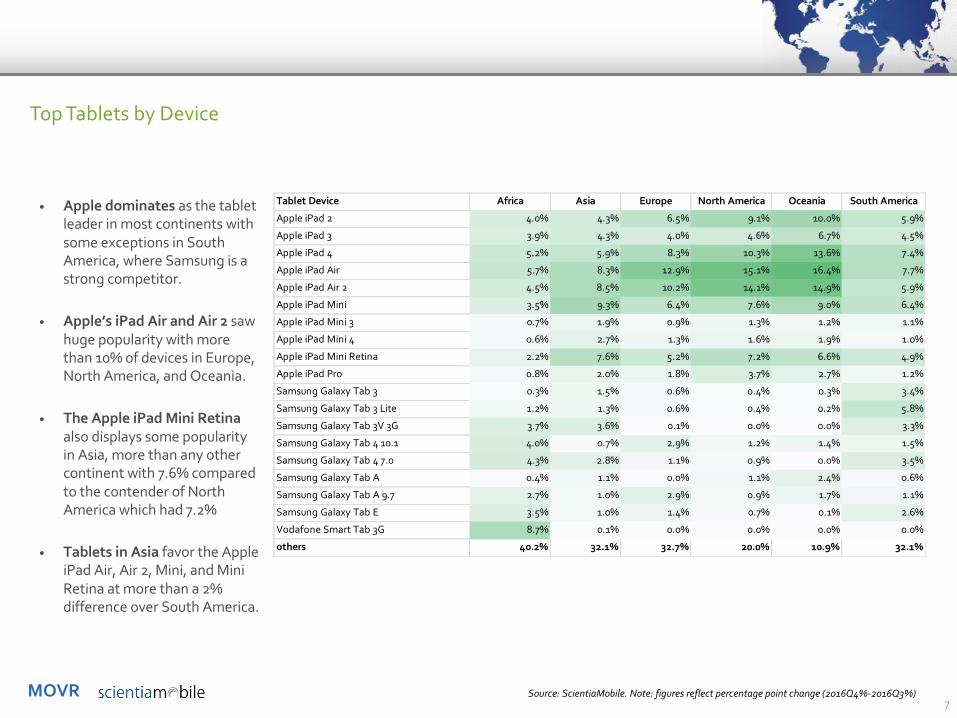
• Apple dominates as the tablet leader in most continents with some exceptions in South America, where Samsung is a strong competitor.
• Apple’s iPad Air and Air 2 saw huge popularity with more than 10% of devices in Europe, North America, and Oceania.
• The Apple iPad Mini Retina also displays some popularity in Asia, more than any other continent with 7.6% compared to the contender of North America which had 7.2%
• Tablets in Asia favor the Apple iPad Air, Air 2, Mini, and Mini Retina at more than a 2% difference over South America.
Source: ScientiaMobile. Note: figures reflect percentage point change (2016Q4%-2016Q3%)
Tablet Device Africa Asia Europe North America Oceania South America
Apple iPad 2 4.0% 4.3% 6.5% 9.1% 10.0% 5.9%
Apple iPad 3 3.9% 4.3% 4.0% 4.6% 6.7% 4.5%
Apple iPad 4 5.2% 5.9% 8.3% 10.3% 13.6% 7.4%
Apple iPad Air 5.7% 8.3% 12.9% 15.1% 16.4% 7.7%
Apple iPad Air 2 4.5% 8.5% 10.2% 14.1% 14.9% 5.9%
Apple iPad Mini 3.5% 9.3% 6.4% 7.6% 9.0% 6.4%
Apple iPad Mini 3 0.7% 1.9% 0.9% 1.3% 1.2% 1.1%
Apple iPad Mini 4 0.6% 2.7% 1.3% 1.6% 1.9% 1.0%
Apple iPad Mini Retina 2.2% 7.6% 5.2% 7.2% 6.6% 4.9%
Apple iPad Pro 0.8% 2.0% 1.8% 3.7% 2.7% 1.2%
Samsung Galaxy Tab 3 0.3% 1.5% 0.6% 0.4% 0.3% 3.4%
Samsung Galaxy Tab 3 Lite 1.2% 1.3% 0.6% 0.4% 0.2% 5.8%
Samsung Galaxy Tab 3V 3G 3.7% 3.6% 0.1% 0.0% 0.0% 3.3%
Samsung Galaxy Tab 4 10.1 4.0% 0.7% 2.9% 1.2% 1.4% 1.5%
Samsung Galaxy Tab 4 7.0 4.3% 2.8% 1.1% 0.9% 0.0% 3.5%
Samsung Galaxy Tab A 0.4% 1.1% 0.0% 1.1% 2.4% 0.6%
Samsung Galaxy Tab A 9.7 2.7% 1.0% 2.9% 0.9% 1.7% 1.1%
Samsung Galaxy Tab E 3.5% 1.0% 1.4% 0.7% 0.1% 2.6%
Vodafone Smart Tab 3G 8.7% 0.1% 0.0% 0.0% 0.0% 0.0%
others 40.2% 32.1% 32.7% 20.0% 10.9% 32.1%
MOVR8
Top Tablet Trends (2016 Q4 v. 2016 Q3)
Source: ScientiaMobile. Note: figures reflect percentage point change (2016Q4%-2016Q3%)
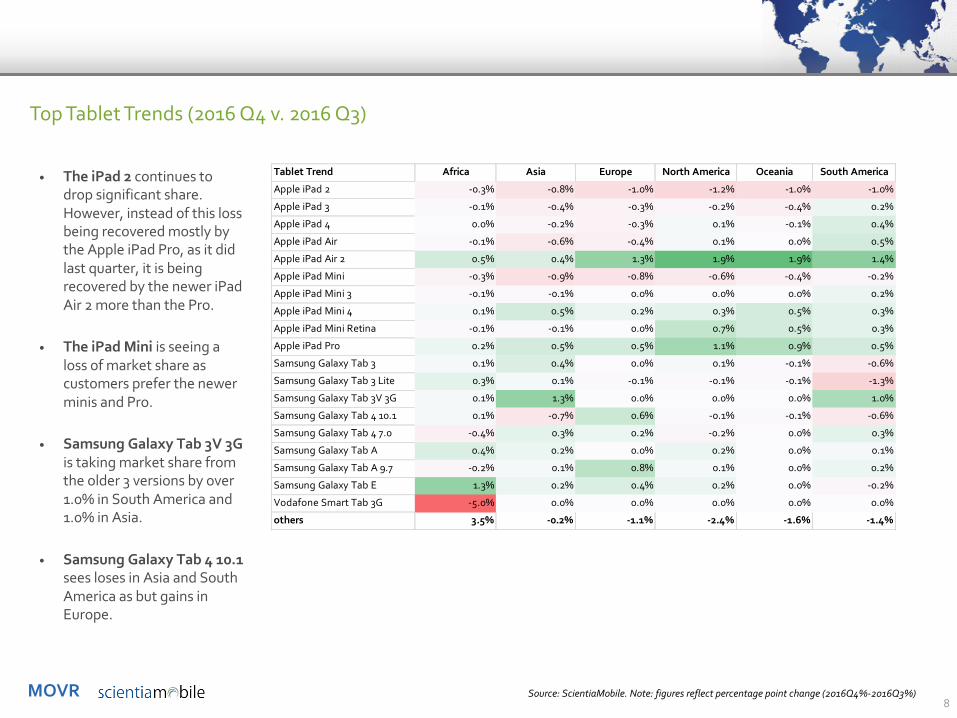
• The iPad 2 continues to drop significant share. However, instead of this loss being recovered mostly by the Apple iPad Pro, as it did last quarter, it is being recovered by the newer iPad Air 2 more than the Pro.
• The iPad Mini is seeing a loss of market share as customers prefer the newer minis and Pro.
• Samsung Galaxy Tab 3V 3G is taking market share from the older 3 versions by over 1.0% in South America and 1.0% in Asia.
• Samsung Galaxy Tab 4 10.1 sees loses in Asia and South America as but gains in Europe.
Tablet Trend Africa Asia Europe North America Oceania South America
Apple iPad 2 -0.3% -0.8% -1.0% -1.2% -1.0% -1.0%
Apple iPad 3 -0.1% -0.4% -0.3% -0.2% -0.4% 0.2%
Apple iPad 4 0.0% -0.2% -0.3% 0.1% -0.1% 0.4%
Apple iPad Air -0.1% -0.6% -0.4% 0.1% 0.0% 0.5%
Apple iPad Air 2 0.5% 0.4% 1.3% 1.9% 1.9% 1.4%
Apple iPad Mini -0.3% -0.9% -0.8% -0.6% -0.4% -0.2%
Apple iPad Mini 3 -0.1% -0.1% 0.0% 0.0% 0.0% 0.2%
Apple iPad Mini 4 0.1% 0.5% 0.2% 0.3% 0.5% 0.3%
Apple iPad Mini Retina -0.1% -0.1% 0.0% 0.7% 0.5% 0.3%
Apple iPad Pro 0.2% 0.5% 0.5% 1.1% 0.9% 0.5%
Samsung Galaxy Tab 3 0.1% 0.4% 0.0% 0.1% -0.1% -0.6%
Samsung Galaxy Tab 3 Lite 0.3% 0.1% -0.1% -0.1% -0.1% -1.3%
Samsung Galaxy Tab 3V 3G 0.1% 1.3% 0.0% 0.0% 0.0% 1.0%
Samsung Galaxy Tab 4 10.1 0.1% -0.7% 0.6% -0.1% -0.1% -0.6%
Samsung Galaxy Tab 4 7.0 -0.4% 0.3% 0.2% -0.2% 0.0% 0.3%
Samsung Galaxy Tab A 0.4% 0.2% 0.0% 0.2% 0.0% 0.1%
Samsung Galaxy Tab A 9.7 -0.2% 0.1% 0.8% 0.1% 0.0% 0.2%
Samsung Galaxy Tab E 1.3% 0.2% 0.4% 0.2% 0.0% -0.2%
Vodafone Smart Tab 3G -5.0% 0.0% 0.0% 0.0% 0.0% 0.0%
others 3.5% -0.2% -1.1% -2.4% -1.6% -1.4%

MOVR9
Smartphone OS Family – Global (2016 Q4 v. 2016 Q3)
Source: ScientiaMobile. Note: figures reflect percentage point change (2016Q4%-2016Q3%)
• The Android operating system gained 2% while iOS dropped 1%. The Windows Phone OS dropped slightly by 0.1% and the other operating systems were even less significant.
• Generally, trends are relatively similar with more gains by Android by any other OS. Some market share (1%) may have been gained by previous iOS users while it also grew (1%) in new users to account for the 2% increase.
• The slight growth of Android vs. the slight decline of iOS is something to keep an eye on over the course of the year.
60% 62%
37% 36%
0.3%0.2%
0%
10%
20%
30%
40%
50%
60%
70%
80%
90%
100%
2016Q3 2016Q4
Smartphone OS Family - Global
others
Windows Phone OS
iOS
Android
MOVR10
Top Operating Systems - Global
Source: ScientiaMobile.
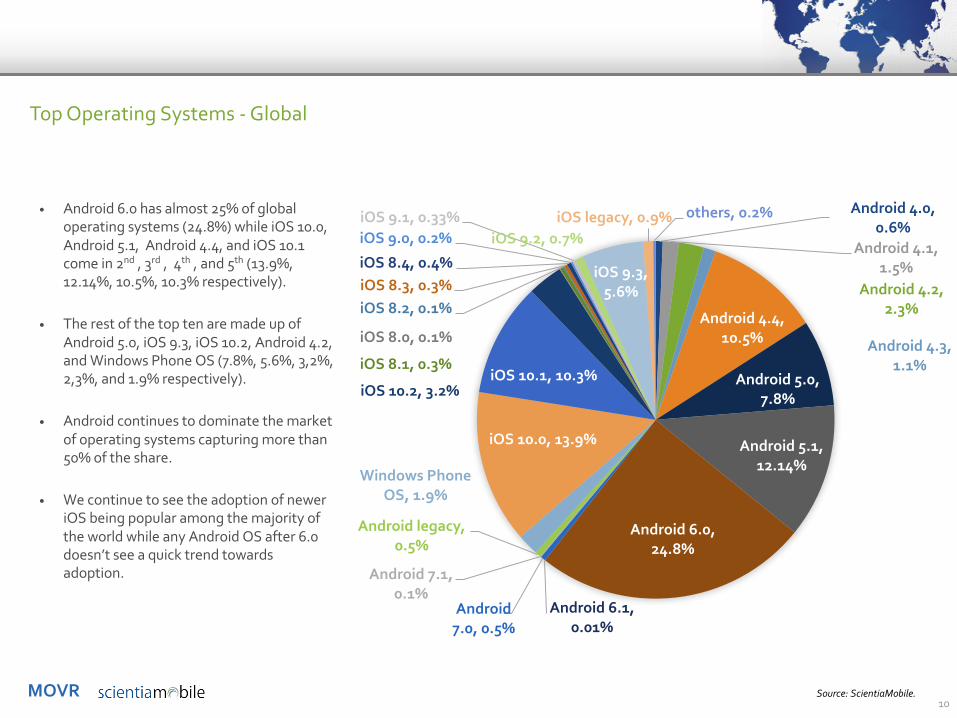
• Android 6.0 has almost 25% of global operating systems (24.8%) while iOS 10.0, Android 5.1, Android 4.4, and iOS 10.1 come in 2nd , 3rd , 4th , and 5th (13.9%, 12.14%, 10.5%, 10.3% respectively).
• The rest of the top ten are made up of Android 5.0, iOS 9.3, iOS 10.2, Android 4.2, and Windows Phone OS (7.8%, 5.6%, 3,2%, 2,3%, and 1.9% respectively).
• Android continues to dominate the market of operating systems capturing more than 50% of the share.
• We continue to see the adoption of newer iOS being popular among the majority of the world while any Android OS after 6.0 doesn’t see a quick trend towards adoption.
Android 4.0, 0.6%
Android 4.1, 1.5%
Android 4.2, 2.3%
Android 4.3, 1.1%
Android 4.4, 10.5%
Android 5.0, 7.8%
Android 5.1, 12.14%
Android 6.0, 24.8%
Android 6.1, 0.01%
Android 7.0, 0.5%
Android 7.1, 0.1%
Android legacy, 0.5%
Windows Phone OS, 1.9%
iOS 10.0, 13.9%
iOS 10.1, 10.3%iOS 10.2, 3.2%
iOS 8.0, 0.1%
iOS 8.1, 0.3%
iOS 8.2, 0.1%iOS 8.3, 0.3%iOS 8.4, 0.4%
iOS 9.0, 0.2%iOS 9.1, 0.33%
iOS 9.2, 0.7%
iOS 9.3, 5.6%
iOS legacy, 0.9% others, 0.2%
MOVR11
iOS Daily Trends - Global
Source: ScientiaMobile.
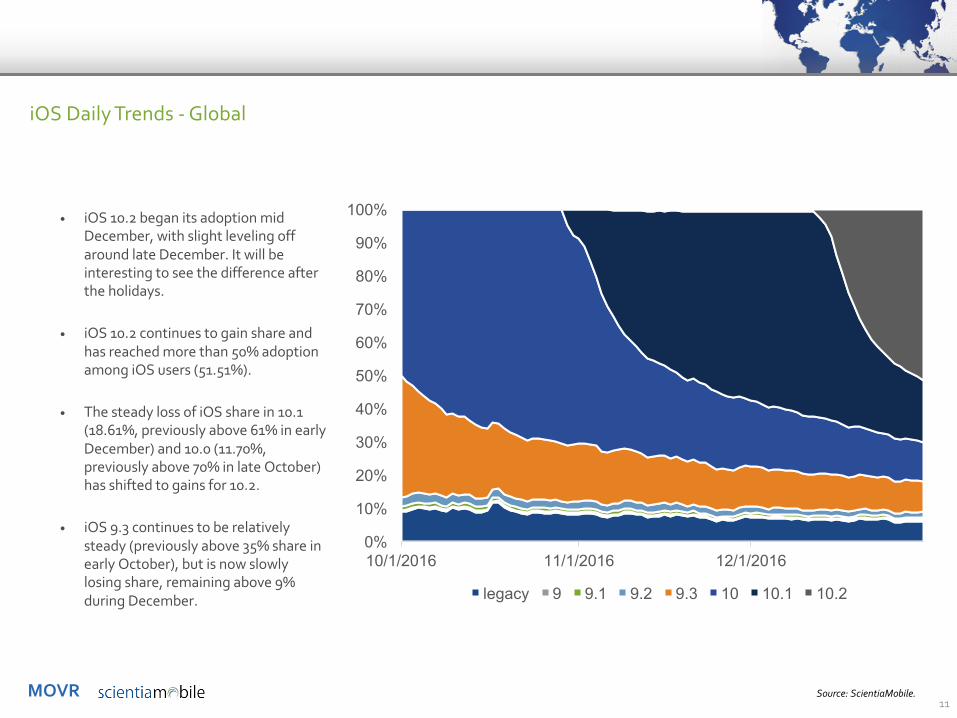
• iOS 10.2 began its adoption mid December, with slight leveling off around late December. It will be interesting to see the difference after the holidays.
• iOS 10.2 continues to gain share and has reached more than 50% adoption among iOS users (51.51%).
• The steady loss of iOS share in 10.1 (18.61%, previously above 61% in early December) and 10.0 (11.70%, previously above 70% in late October) has shifted to gains for 10.2.
• iOS 9.3 continues to be relatively steady (previously above 35% share in early October), but is now slowly losing share, remaining above 9% during December.
0%
10%
20%
30%
40%
50%
60%
70%
80%
90%
100%
10/1/2016 11/1/2016 12/1/2016
legacy 9 9.1 9.2 9.3 10 10.1 10.2
MOVR
0%
10%
20%
30%
40%
50%
60%
70%
80%
90%
100%
10/1
/201
6
10/8
/201
6
10/1
5/20
16
10/2
2/20
16
10/2
9/20
16
11/5
/201
6
11/1
2/20
16
11/1
9/20
16
11/2
6/20
16
12/3
/201
6
12/1
0/20
16
12/1
7/20
16
12/2
4/20
16
12/3
1/20
16
legacy 5 5.1 6 7 7.1
12
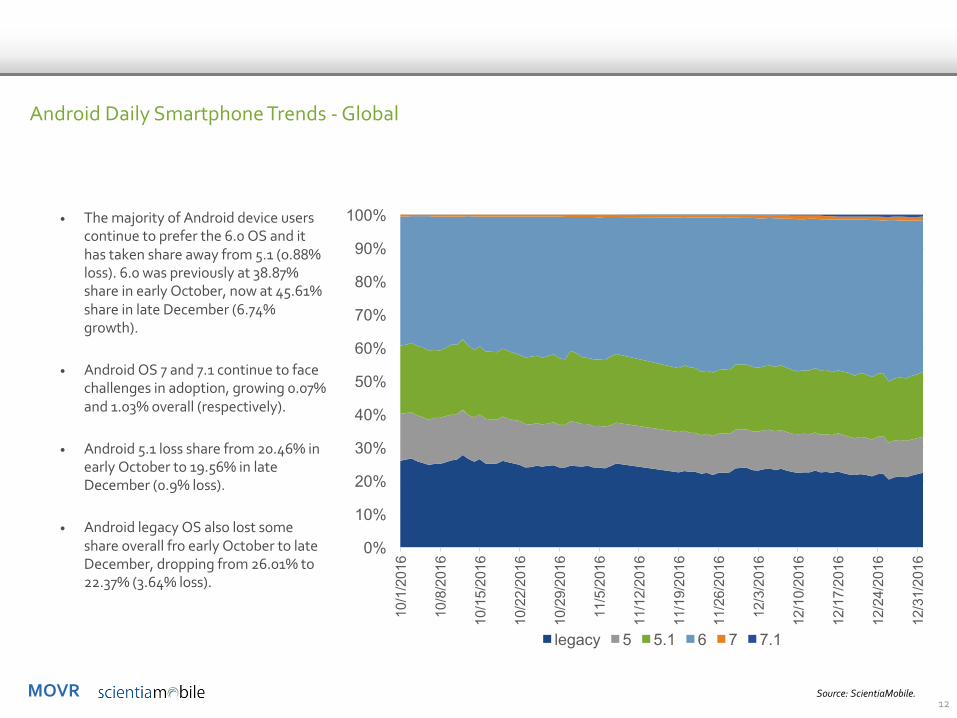
Android Daily Smartphone Trends - Global
• The majority of Android device users continue to prefer the 6.0 OS and it has taken share away from 5.1 (0.88% loss). 6.0 was previously at 38.87% share in early October, now at 45.61% share in late December (6.74% growth).
• Android OS 7 and 7.1 continue to face challenges in adoption, growing 0.07% and 1.03% overall (respectively).
• Android 5.1 loss share from 20.46% in early October to 19.56% in late December (0.9% loss).
• Android legacy OS also lost some share overall fro early October to late December, dropping from 26.01% to 22.37% (3.64% loss).
Source: ScientiaMobile.
MSRP 2016 to 2015 Comparison
MOVR14
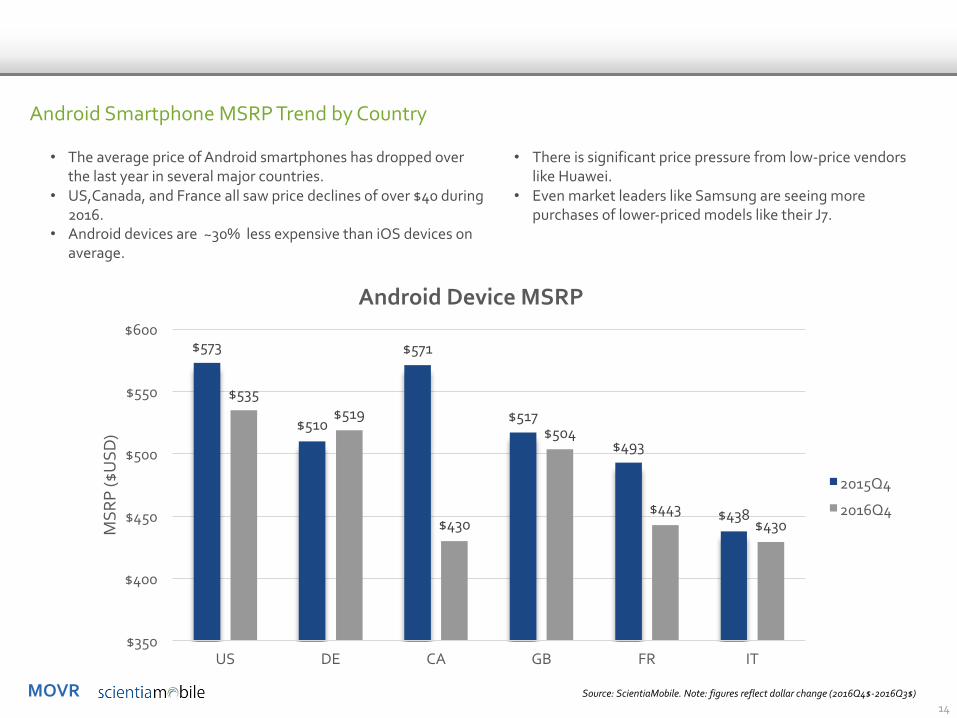
Android Smartphone MSRP Trend by Country
• There is significant price pressure from low-price vendors like Huawei.
• Even market leaders like Samsung are seeing more purchases of lower-priced models like their J7.
• The average price of Android smartphones has dropped over the last year in several major countries.
• US,Canada, and France all saw price declines of over $40 during 2016.
• Android devices are ~30% less expensive than iOS devices on average.
$573
$510
$571
$517
$493
$438
$535$519
$430
$504
$443$430
$350
$400
$450
$500
$550
$600
US DE CA GB FR IT
MSR
P ($
USD
)
Android Device MSRP
2015Q4
2016Q4
Source: ScientiaMobile. Note: figures reflect dollar change (2016Q4$-2016Q3$)

MOVR15
iOS Smartphone MSRP Trend by Country
• Over 2016, the average price has stayed constant in most countries.
• Apple has kept its pricing higher than Android, averaging over $800.
• There is limited variation in iPhone pricing, except for the iPhone 5C, which has limited market share.
$813$831
$807 $809 $809$824$828 $829
$809 $812$799
$823
$500 $525 $550 $575 $600 $625 $650 $675 $700 $725 $750 $775
$800 $825
US DE CA GB FR IT
MSR
P ($
USD
)
iOS Device MSRP
2015Q4
2016Q4
Source: ScientiaMobile. Note: figures reflect dollar change (2016Q4$-2016Q3$)

Secrets of E-Commerce:Black Friday Edition2016 to 2015 Comparison

MOVR17
Smartphone Age Impacts of Black Friday
• Perhaps more people are buying new devices and using them around Black Friday and Cyber Monday.
• People with newer devices may be comparison shopping online while also in stores during Black Friday.
• More people with newer devices are shopping on E-Commerce sites closer to Black Friday and Cyber Monday.
• The average age drops 1.2% during the Black Friday season.• This means that E-Commerce sites need to be optimized for
newer devices for Black Friday and Cyber Monday.
648
640
600
605
610
615
620
625
630
635
640
645
650
Nov 01-Nov 15 Nov 16-Nov 30
Age
(day
s)
Average Smartphone Age
1.2% decrease
MOVR18
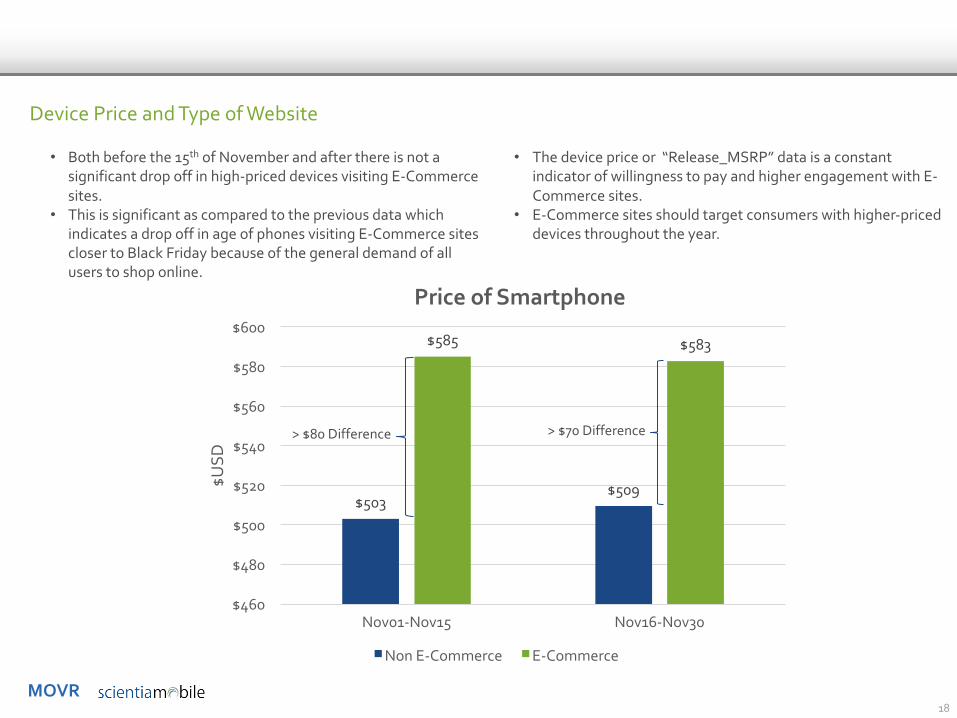
Device Price and Type of Website
• The device price or “Release_MSRP” data is a constant indicator of willingness to pay and higher engagement with E-Commerce sites.
• E-Commerce sites should target consumers with higher-priced devices throughout the year.
• Both before the 15th of November and after there is not a significant drop off in high-priced devices visiting E-Commerce sites.
• This is significant as compared to the previous data which indicates a drop off in age of phones visiting E-Commerce sites closer to Black Friday because of the general demand of all users to shop online.
$503 $509
$585 $583
$460
$480
$500
$520
$540
$560
$580
$600
Nov01-Nov15 Nov16-Nov30
$USD
Price of Smartphone
Non E-Commerce E-Commerce
> $80 Difference > $70 Difference
MOVR19
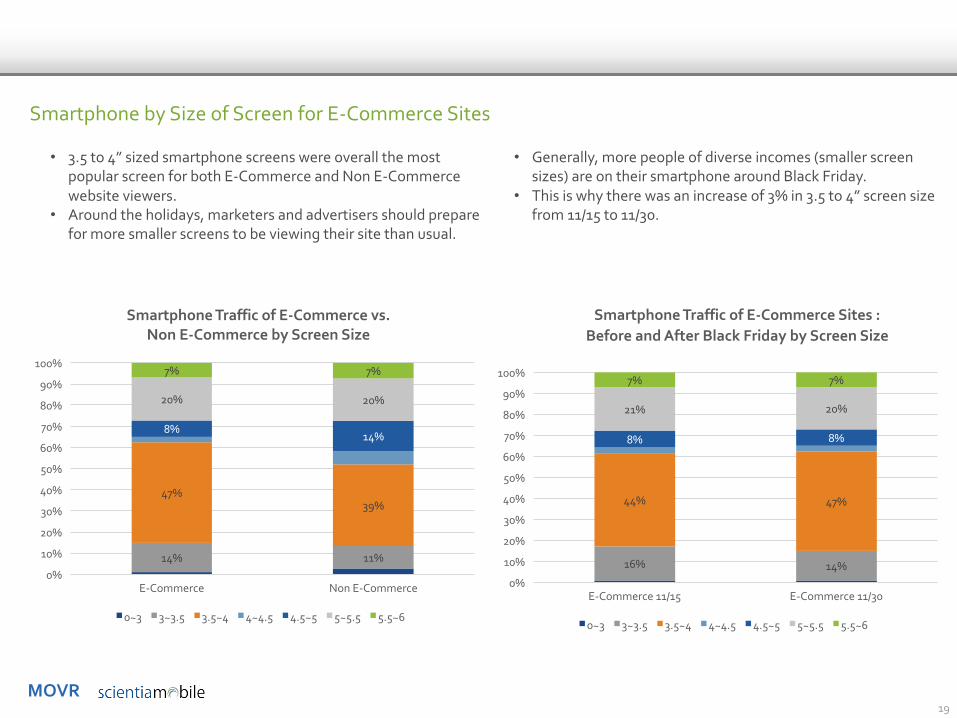
Smartphone by Size of Screen for E-Commerce Sites
• Generally, more people of diverse incomes (smaller screen sizes) are on their smartphone around Black Friday.
• This is why there was an increase of 3% in 3.5 to 4” screen size from 11/15 to 11/30.
• 3.5 to 4” sized smartphone screens were overall the most popular screen for both E-Commerce and Non E-Commerce website viewers.
• Around the holidays, marketers and advertisers should prepare for more smaller screens to be viewing their site than usual.
16% 14%
44% 47%
8% 8%
21% 20%
7% 7%
0%
10%
20%
30%
40%
50%
60%
70%
80%
90%
100%
E-Commerce 11/15 E-Commerce 11/30
Smartphone Traffic of E-Commerce Sites :Before and After Black Friday by Screen Size
0~3 3~3.5 3.5~4 4~4.5 4.5~5 5~5.5 5.5~6
14% 11%
47%39%
8%14%
20% 20%
7% 7%
0%
10%
20%
30%
40%
50%
60%
70%
80%
90%
100%
E-Commerce Non E-Commerce
Smartphone Traffic of E-Commerce vs. Non E-Commerce by Screen Size
0~3 3~3.5 3.5~4 4~4.5 4.5~5 5~5.5 5.5~6
MOVR20
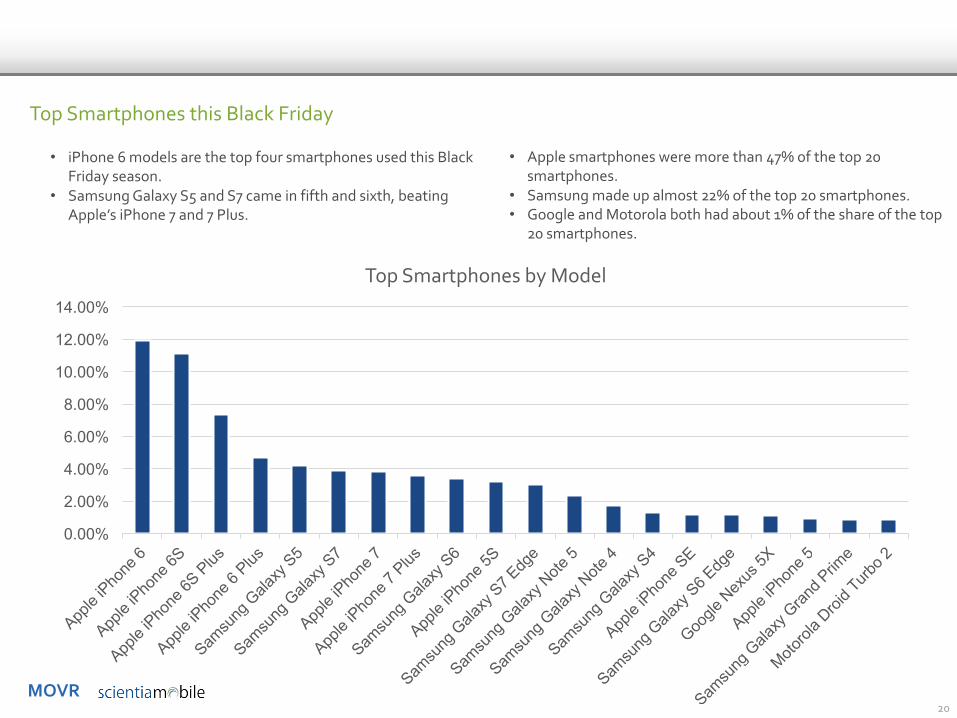
Top Smartphones this Black Friday
• Apple smartphones were more than 47% of the top 20 smartphones.
• Samsung made up almost 22% of the top 20 smartphones.• Google and Motorola both had about 1% of the share of the top
20 smartphones.
• iPhone 6 models are the top four smartphones used this Black Friday season.
• Samsung Galaxy S5 and S7 came in fifth and sixth, beating Apple’s iPhone 7 and 7 Plus.
0.00%
2.00%
4.00%
6.00%
8.00%
10.00%
12.00%
14.00%
Top Smartphones by Model

MOVR21
Top Tablets this Black Friday
• The tablet market was more diversified than the smartphone market, with Apple coming in with more than 38% of the top 20 tablets as opposed to 47% in the smartphone market..
• Samsung made up more than 18% of the top 20 tablets..• Amazon led Microsoft with almost 3% of the top 20 tablets and
Microsoft had about 1.5% of the top 20 tablets.
• iPad Airs performed well, taking the top two positions and the iPad Air 2 making up more than 10% of the share and the iPad Air making up more than 8%.
• Again, Apple devices took the top four spots as Samsung Galaxy came in 5th, 6th., and 7th with their Galaxy Tabs.
0.00%
2.00%
4.00%
6.00%
8.00%
10.00%
12.00%
Top Tablets by Model
MOVR22
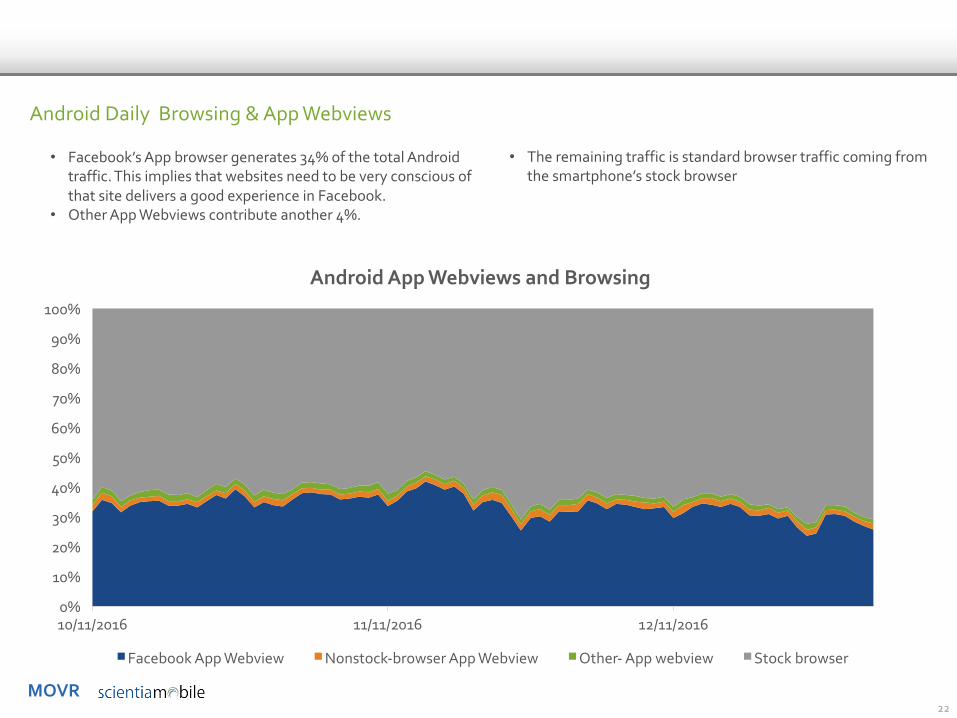
Android Daily Browsing & App Webviews
• The remaining traffic is standard browser traffic coming from the smartphone’s stock browser
• Facebook’s App browser generates 34% of the total Android traffic. This implies that websites need to be very conscious of that site delivers a good experience in Facebook.
• Other App Webviews contribute another 4%.
0%
10%
20%
30%
40%
50%
60%
70%
80%
90%
100%
10/11/2016 11/11/2016 12/11/2016
Android App Webviews and Browsing
Facebook App Webview Nonstock-browser App Webview Other- App webview Stock browser

MOVR23
iOS Daily Browsing & App Webviews
0%
10%
20%
30%
40%
50%
60%
70%
80%
90%
100%
10/11/2016 11/11/2016 12/11/2016
iOS App Webviews and Browsing
Facebook App Webviews Other Browser App Webviews Mobile Safari
• The remaining traffic is standard browser traffic coming from the iPhone’s stock Mobile Safari browser.
• Facebook’s App browser generates 48% of the total iOS traffic, 14% more than Android.
• Other App Webviews contribute another 4%.

How to:Make WURFL.js work for you

MOVR25
Add iPhone Models To Google Analytics with WURFL.js Business Edition
With Business Edition, You Get:• Accurate identification of iPhone and iPad
models • Integrate with Google Analytics• Over 20 of WURFL’s most popular capabilities
• Easy-to-use JavaScript snippet works with ScientiaMobile’s cloud-based DDR
• SLA and high reliability• Helpdesk support
About this Report & Resources

MOVR
• Purpose of Report
– ScientiaMobile publishes MOVR to provide the mobile Web community with timely information on mobile Web device usage.
– Our goal is to stimulate interest in mobile device trends, device capabilities, and tools for analyzing and managing device fragmentation.
• Sources of Data and Filtering
– The information in this report is based on a representative sample of a larger data set. The sample size is over 39.7 billion requests from April 2014 to end of December 2016.
– MOVR focuses on mobile devices, consisting of smartphones, tablets, and feature phones.
– While the data set includes desktops, laptops, smart TVs, game consoles, apps, and robots, we have excluded them, unless otherwise noted.
– We have used an Equivalent Weighted Sites (EWS) methodology that indexes the traffic at each site and assigns an equal weight to each site.
– Samples sizes for Africa and Oceania are small enough that we have a low level of confidence that these figures are representative. However, the source data from these continents continues to grow. Over time, we will improve the quality of these figures. In the meantime, we feel that more information is better than less for people looking for insights in these continents.
– To download the data files supporting MOVR, or subscribe to future publications of MOVR, please visit us at www.scientiamobile.com/movr
27
Report Specifications
Definitions
• What is a “hit”? Each time a user visits a Web page and a user agent (UA) is generated and tested by WURFL (through a number of mechanisms), a “hit” is recorded in the ScientiaMobile dataset. All data reported in MOVR reflects hits, not the count of physical devices generating the hit.
• What is a smartphone? A smartphone must meet several criteria: it must be a wireless device, have a touch screen with horizontal resolution greater than or equal to 320px, and not be considered a tablet.
• What is a tablet? Criteria for a tablet include: a wireless device, larger than 6 inch screen, and running a mobile or tablet OS. One exception is that a full version of Windows running on a tablet is considered to be a laptop.
Desktop, 42%
App, 15%Robots, 2%
SmartTV, 0.1%
Smartphone, 33%
Tablet, 7%
Feature Phone, 2%
Excluded = 5%
Included Mobile Devices =42%

MOVR
• What is a feature phone? It is a wireless device that falls into one of the three categories: classic feature phones, modern feature phones, and old smartphones.
– Classic feature phone: Typically a bar, slide, or clamshell form factor with limited possibilities to install apps and a proprietary OS. Other criteria include a physical keyboard and a low price range. Examples are Nokia Series 30 and 40 or Motorola Razr devices.
– Modern feature phone: These phones also have a low price range. They are “smartphone-like”, but targeted at the classic feature phone market. They may have a smartphone OS. They borrow features from classic feature phones, such as size or screen size. Examples are Nokia Asha series or Samsung Galaxy Pocket.
– Old smartphones: These smartphones are older. Classic Blackberry devices and Symbian-based devices fall into this category. More recent devices with a touch screen, but with older hardware or older versions of Android, iOS or Windows Phone also fall into this category.
• What is MNO Traffic? Traffic originating from Mobile Network Operators (MNO). It is defined, in our research method, as the connection type provided by the browser navigator.connection API.
28
Definitions (continued) About WURFL
• ScientiaMobile uses its WURFL products to collect and analyze the device intelligence contained in the MOVR report. WURFL is a Device Description Repository (DDR) that integrates an API and XML to provide an always-updated source for detecting devices and their capabilities. For more than 10 years, WURFL has been the industry standard for device detection. Today, ScientiaMobile offers a number of WURFL products to match a range of needs, from small developers to large enterprises.
• WURFL OnSite and WURFL InFuze provide businesses with high performance server-side device detection solutions.
• WURFL.js and WURFL.js Business Edition provide front-end developers with access to device detection through JavaScript snippets.
• WURFL InSight provides business intelligence analysts with a table-based device detection tool that will integrate easily with data analysis tools.
• ImageEngine combines mobile device detection with image resizing, image file optimization, and Content Delivery Network (CDN)-type delivery. It provides significantly faster downloads, especially on mobile devices.
MOVR
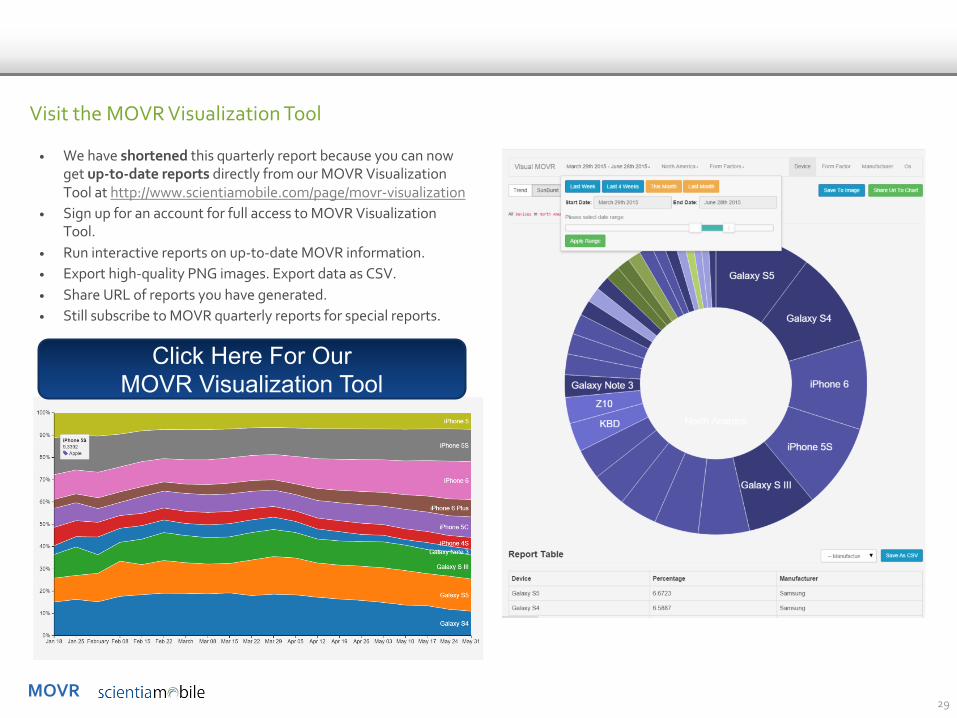
• We have shortened this quarterly report because you can now get up-to-date reports directly from our MOVR Visualization Tool at http://www.scientiamobile.com/page/movr-visualization
• Sign up for an account for full access to MOVR Visualization Tool.
• Run interactive reports on up-to-date MOVR information.• Export high-quality PNG images. Export data as CSV.• Share URL of reports you have generated.• Still subscribe to MOVR quarterly reports for special reports.
29
Visit the MOVR Visualization Tool
Click Here For OurMOVR Visualization Tool

MOVR
• ScientiaMobile provides the industry’s most accurate and flexible device detection solution, helping customers deliver great web experiences and manage the increasingly fragmented mobile device ecosystem. ScientiaMobile sells WURFL, a constantly-updated repository that catalogues thousands of devices and their capabilities and provides access to them via range of API languages. The WURFL framework enables many organizations, including Fortune 500 companies, to effectively design and analyze web experiences for an ever-growing range of smartphones, tablets, smart TVs, and game consoles.
• For more information about ScientiaMobile and its commercial products, please visit us at: www.scientiamobile.com
• WURFL.io offers a number of free tools for device detection and image tailoring.
• To subscribe to MOVR, please visit us at www.scientiamobile.com/page/movr-mobile-overview-report
• To speak to us about our products and licenses, please complete this form at www.scientiamobile.com/license
• MOVR is the Copyright of ScientiaMobile, Inc. and is made available under the terms of the Creative Commons Attribution-NonCommercial-NoDerivatives 4.0 International License.
30
About ScientiaMobile
Disclaimer• While ScientiaMobile, Inc. has used reasonable efforts
accurately to prepare this report and the other data and information here (together the "Report") from data it and its affiliates have collected, this Report is made available to the public on an "AS IS" basis without warranty of any kind. SCIENTIAMOBILE, INC. AND ITS AFFILIATES MAKE NO REPRESENTATION AND DISCLAIM ALL EXPRESS, IMPLIED AND STATUTORY WARRANTIES OF ANY KIND TO ANY RECIPIENT OF THIS REPORT OR ANY OTHER THIRD PARTY, INCLUDING ANY WARRANTIES OF ACCURACY, TIMELINESS, COMPLETENESS, MERCHANTABILITY AND FITNESS FOR A PARTICULAR PURPOSE. The Report is limited to data collected from certain services offered by ScientiaMobile, Inc. and its affiliates – a self-selected sample pool that may not reflect the greater internet user community – and consequently no conclusion should be drawn from this Report regarding the internet user base as a whole. The entire risk as to the quality (or lack thereof), completeness and your use of this Report is with you, the user of the Report. In no event will ScientiaMobile, Inc. or its affiliates be liable for any direct, indirect, incidental, special, consequential, or other damages, including loss of profit, arising out of the use of this Report, even if advised of the possibility of such damages.
• Any excerpts to, or use of this Report to reach new conclusions and/or analysis, should indicate ScientiaMobile, Inc. as its source, but derived conclusions and analyses generated from these Reports should be clearly attributed solely to their author.