moving phoenix forward
TRANSCRIPT

ANNUAL PROGRESS REPORT FY 2021
JULY 1, 2020 THROUGH JUNE 30, 2021
MOVING PHOENIX FORWARD

Councilmember Debra Stark Chair, Transportation, Infrastructure and Planning Subcommittee
Mayor Kate GallegoCommissioner Jennifer Mellor Chair, Citizens Transportation Commission
“T2050 is more than just a plan; it’s an investment in our community, to get our residents more connected. As we reemerge from the pandemic, improving our infrastructure is critical to creating jobs and connecting every resident to economic, education and social opportunities across our city. I’m proud of the work we’ve done this year to increase light rail, extend and add bus services, and pave more miles of street than ever before. Robust, inclusive transportation options for Phoenix are becoming a reality with the help of the smart, long-range planning of T2050.”
“T2050 allows Phoenix to continue investing in our growing city’s future. Among the many accomplishments in the last year, Phoenix has upgraded dozens of buses and Dial-a-Ride vehicles, added bus service to underserved areas and broken ground to expand light rail service to Northwest Phoenix. These efforts ensure reliable transit and promote connectivity for Phoenix residents, while also supporting economic development. T2050 investments not only strengthen our transportation system — they directly impact the daily life of Phoenicians.”
"Improving Phoenix’s transit system and city streets has always been a top priority for the residents of Phoenix, as proven when T2050 was approved by voters in 2015. As part of that ballot initiative, the Citizens Transportation Commission was created to provide transparency, oversight and guidance in how T2050 is implemented. The city just marked a T2050 milestone in the completion of the first five years of the plan, and now, more than ever, each of the 15 commissioners relish the opportunity to work with the public and city staff to continue to fulfill the T2050 vision."
A MESSAGE FROM LEADERSHIP
2

TABLE OF CONTENTS
Annual Progress Report — Fiscal Year 2021 Interactive features may be found throughout the document in orange.
1.0 Program Overview
2.0 Bus and Dial-a-Ride
3.0 High Capacity Transit
4.0 Street Maintenance and Improvements
5.0 Appendix
3

1.0 Program Overview
4

PROGRAM OVERVIEWTransportation 2050 (T2050) is Phoenix’s 35-year plan dedicated to improving multiple modes of transportation in Phoenix, including bus, light rail,
Dial-a-Ride (DAR), streets, bikes lanes, and active transportation. Phoenix voters made T2050 possible when they approved Proposition 104 on August 25, 2015. The measure, which replaced the previous 0.4% sales tax with a 0.7% sales tax, became effective Jan. 1, 2016, and allocates 70 cents of
each $100 spent to the city’s transportation needs. Approximately 86% of funds support public transit and 14% supplement street maintenance and improvement funds.
T2050 revenues supplement other sources of transportation funding, allowing the city to accomplish more. This report recognizes T2050 accomplishments for July 1, 2020, to June 30, 2021 (FY 2021). In addition, the report identifies cumulative progress, since the start of the program, and provides an overview of improvements planned for the next five years.
T2050 celebrated its fifth anniversary during FY 2021 by publishing the first Long-Term Performance Metrics Report and creating a video summary of key milestones.
T2050 LONG-TERMPERFORMANCE METRICS REPORT JANUARY 2016 – DECEMBER 2020
5

Lifecycle RevenuesOver the course of 35 years, Phoenix expects sales tax revenue to generate over half of the estimated $31.5 billion in overall T2050 funding. Federal, state, regional and local funding sources will provide the remaining funding. shows funding sources as established at the launch of the program.
In addition to these funds, Public Transit and Street Transportation department staff pursue opportunities to reduce costs through innovation and efficient project delivery methods.
More information on program assumptions can be found in the appendix, with projected and actual sales tax revenue shown in Table A.1. For additional information on regional and federal funding, visit phoenix.gov/T2050/Funding.
T2050 FUNDING
T2050 PROGRAM AREAS
Figure 1.1 Sources of Funds
T2050 FUNDS
FEDERAL FUNDS
REGIONAL FUNDS
FINANCING
$ $
OTHER TRANSIT
REVENUES
TRANSIT FARE
REVENUES
Total estimated revenues for
35-year program
$31.5B
$16.8BT2050SalesTax
$2.9BState/
Regional
$3.9BFederal
$5.1BTransitFares
$1.7B Financing (bonds/ loans)
$1.1B Other
T2050 FUNDS
FEDERAL FUNDS
REGIONAL FUNDS
FINANCING
$ $
OTHER TRANSIT
REVENUES
TRANSIT FARE
REVENUES
Total estimated revenues for
35-year program
$31.5B
$16.8BT2050SalesTax
$2.9BState/
Regional
$3.9BFederal
$5.1BTransitFares
$1.7B Financing (bonds/ loans)
$1.1B Other
6

$50M
$100M
$150
M
$200M
$250
M
$300M
FY 24
FY 23
FY 22
FY 21
FY 20
FY 19
FY 18
FY 17
FY 16 PROJECTED*ACTUAL
*Projected sales tax revenues reflect the initial T2050 plan.
$2.3BDebt
service and reserve
$2.3BStreets,
pavement, mobility and technology
$268MTransit
infrastructure
$6.7BNew lightrail transit
$670MBus rapid
transit $1.9BNew bus service inunserved
areas
$878MBus
frequencyfor a peak period and weekendservice
$1.8BExpanded bus and
Dial-a-Ride hours
$14.7BExisting bus,Dial-a-Ride
and light railtransit
Total estimated costs
$31.5B
Lifecycle ExpendituresAt times, projected revenue for T2050 will exceed projected expenditures for a given year. This helps to ensure that the plan has available funds in future years for large capital projects such as light rail construction, park-and-ride facilities, and to ensure a fund balance is maintained whenever possible during the life of the plan. shows planned uses of funds as established at the launch of the program.
Impact of COVID-19The COVID-19 virus resulted in a global pandemic beginning in 2020 and significantly shifted consumer demands. Ridership numbers steeply declined because social distancing requirements changed travel patterns. Ridership has been progressively increasing since the initial decline. However, it still remains below pre-pandemic levels.
This report notes the effects of changes due to the pandemic within each program area.
Public transit provided transportation for essential workers throughout the COVID-19 pandemic.
$50M
$100M
$150
M
$200M
$250
M
$300M
FY 24
FY 23
FY 22
FY 21
FY 20
FY 19
FY 18
FY 17
FY 16 PROJECTED*ACTUAL
*Projected sales tax revenues reflect the initial T2050 plan.
Figure 1.3 T2050 Sales Tax Revenue SummaryFigure 1.2 Planned Uses of Funds
$2.3BDebt
service and reserve
$2.3BStreets,
pavement, mobility and technology
$268MTransit
infrastructure
$6.7BNew light rail transit
$670MBus rapid
transit $1.9BNew bus service in unserved
areas
$878MBus
frequency for a peak period and weekend service
$1.8BExpanded bus and
Dial-a-Ride hours
$14.7BExisting bus, Dial-a-Ride
and light rail transit
Total estimated costs
$31.5B
FY 2021 Financial Summary and ProjectionThe total operating and capital budgets for FY 2021 are $1.029 billion. Table A.2 in the appendix details budgeted and actual revenues and expenditures. provides projected and actual sales tax revenue, as well as short-term projected revenue figures. Table A.3 in the appendix outlines the FY 2021–2025 five-year financial plan.
7

35-Year Goals Established at the Onset of T2050 The voter-approved 35-year sales tax became effective on January 1, 2016. The following dashboard provides an overview of T2050 progress. City leaders established these goals based on the Proposition 104 ballot language, with the expectation that goals may evolve as the program progresses. Use the interactive links included throughout this report to access additional information.
Public OutreachTo understand residents’ transportation needs, staff members engage with the public regularly at open houses and public meetings. They also attend community events to provide information and gather input on a variety of topics, including increasing transit access; planning bus routes and extensions, future light rail station locations and potential bus rapid transit routes; building and improving roads; and creating and improving bike lanes.
Due to the pandemic, staff members utilized a mixture of in-person and virtual meeting platforms to conduct outreach and receive community input throughout the year. Staff members hosted virtual public meetings, accessible by phone or computer. Virtual meetings included presentations, a variety of speakers and public question-and-answer segments.
Formal OversightThe mayor and Phoenix City Council established the Citizens Transportation Commission (CTC) in 2015 to oversee the T2050 program. The Phoenix City Council appoints a total of 15 commission members to address street and transit needs, provide oversight on the expenditure of funds and make recommendations on plan elements.
CTC members represent various facets of the community. As of June 30, 2021, CTC members include:
● Chair Jennifer Mellor ● Vice Chair Rick Naimark ● David Adame ● Sue Glawe ● Luis Heredia ● Gail Knight ● Gabriel Loyola ● David Martin ● Roy Miller ● David Moody ● Brookelynn Nisenbaum ● Phil Pangrazio ● William Smith ● Frank Steinmetz
The Phoenix City Council’s Transportation, Infrastructure and Planning subcommittee provides policy guidance on issues related to infrastructure, transportation, transit, streets, aviation/airport, water, technology, smart cities, innovation and sustainability.
The Phoenix City Council provides additional oversight, and its meetings also provide opportunities for public input.
T2050 Goals
Dashboard on next
page
Transportation, Infrastructure and Planning Subcommittee Members: (top row, left–right): Councilmember Debra Stark, Chair; Councilmember Laura Pastor; (second row, left–right): Councilmember Betty Guardado; Councilmember Ann O’Brien.
8

T2050 GOALS ESTABLISHED AT PROGRAM ONSETEXPECTED PROGRESS
AT 5.5 YEARS
35 YEARS
CONTINUE local bus, RAPID commuter bus, neighborhood circulator and Dial-a-Ride service FOR 35 YEARS
15 MIN PROVIDE 15-MINUTE FREQUENCY on half of all bus routes
RAPID EXTEND & ADD new RAPID service
PURCHASE NEW buses and Dial-a-Ride vehicles
EXTEND bus and Dial-a-Ride service hours TO MATCH LIGHT RAIL HOURS
EXTEND & ADD BUS SERVICE to unserved major streets
ADD NEW circulator service
BUILD NEW park-and-ride lots
BUILD additional bus bays
CONTINUE 17 MILES of light rail service
BRT PROVIDE 75 MILES of new bus rapid transit service
NEW ADD 42 MILES of new light rail in Phoenix
50th BUILD NEW light rail station at 50th Street (completed April 25, 2019, and operational since then)
680 MILES of new overlays on arterial/major streets
2,000 new streetlights $240 MILLION for new roads and upgraded bridges
1,080 MILES of new bike lanes
135 MILES of new sidewalks
ENHANCE technology
Approaching expected targetBelow expected target At or above expected target
This dashboard represents progress from Jan. 1, 2016, through June 30, 2021.
9

2.0 Bus and
Dial-a-Ride
10

Route 51 51st Avenue Lower Buckeye Road to Baseline Road (FY 2017)
Route 60 16th Street Bethany Home Road & 16th Street to Camelback Road & 24th Street (FY 2018)
Route 19 23rd Avenue Happy Valley Road to Pinnacle Peak Road (FY 2018)
Route 39 Shea Boulevard Dreamy Draw Park-and-Ride to 40th Street (FY 2017)
Route 122 Cactus Road ASU West Campus to 19th Avenue/Dunlap Avenue Light Rail (FY 2017)
INCREASED FREQUENCY*off-peak to 15 MIN on five routes:
1919th
Avenue(FY 2018)
3Van Buren
Street(FY 2018)
50Camelback
Road(FY 2018)
29Thomas
Road(FY 2018)
41Indian School
Road(FY 2019)
RAPID service frequency increases
Weekdays and weekends to 30 MIN or better
Weekday service levels on five holidays reinstated
(previously on a Sunday schedule)
ORDERED403 Local Buses
44 Rapid Buses
122 Dial-a-Ride Vehicles
6 Circulator Buses
RAPID
DAR
INSTALLED6 Bus Bays
49 Bus Stops
349 Bus Shelter Shade Structures
BUS AND DIAL-A-RIDECUMULATIVE PROGRESS Jan. 1, 2016–June 30, 2021
DAREXTENDED SERVICE HOURSfor bus and Dial-a-Ride to MATCH LIGHT RAIL HOURS (FY 2017)
DAR
EXTENDED BUS ROUTES51
60
19
39
122
ADDED BUS ROUTESRoute32 32nd Street Camelback Road to Baseline Road &
Priest Drive (FY 2017)
Route140 Ray Road 48th Street to Gilbert Road (FY 2018)
32
140
R* On May 4, 2020, service was temporarily reduced due to the COVID-19 pandemic and its impact on transit demand.11

OTHER IMPROVEMENTS COMPLETED
$250MILLION RECEIVEDin Federal Transit Administration (FTA) formula grants for Phoenix transit (5.5-year total)
>> << TRIPSPARK customer web portal for Dial-a-Ride reservations (FY 2018)
$16 MILLION RECEIVED in competitive grant funding to purchase buses (5.5-year total)
SECURITYK-9 Security Unit Grant (FY 2017)
LIQUEFIED NATURAL GAS contract saves $2 million in fuel costs each year (FY 2018)
DAR REGIONAL DIAL-A-RIDE IMPLEMENTEDeliminating transfers (FY 2017)
WEST TRANSIT FACILITYawarded contract (FY 2019)
SOUTH TRANSIT FACILITYrefurbished (FY 2019)
NORTH AND SOUTH FACILITIES awarded contract (FY 2020)
COMPUTER-AIDED DISPATCH/AUTOMATED VEHICLE LOCATION upgrades installed (FY 2020)
ALTERNATIVE TRANSPORTATION SERVICES technology enhancements include: ADA Ride, Senior Ride and Senior Center Shuttle, Employment Transportation and Medical Trip (FY 2019)
AUDIO ON DIGITAL BUS SIGNS (FY 2018)
FARE COLLECTION SYSTEM awarded contract (FY 2020)
OPERATIONS CONTROL CENTERawarded contract (FY 2020)
BUS AND DIAL-A-RIDECUMULATIVE PROGRESS Jan. 1, 2016–June 30, 2021
12

BUS AND DIAL-A-RIDEPublic transportation options available to Phoenix residents include fixed route bus and light rail service, neighborhood circulators, express commuter
buses and alternative transportation services such as DAR for people who are unable to utilize local bus service due to a disability.
The department focuses on operating services that allow riders to have a safe ride while knowing there is much value in physically connecting our communities. With the available services, riders are able to get to schools, health facilities, jobs, grocery stores, pharmacies and many other critical connections. The Phoenix Public Transit Department (PTD) works in partnership with Valley Metro, the regional public transportation agency that provides coordinated transit services to riders in the metro area. For
additional transit information, visit phoenix.gov/publictransit.
Funding and BudgetBus and DAR receive T2050 sales tax revenues, funding from federal grants, fare revenues, transit advertising and the Regional Public Transportation Fund.
PTD used $240.0 million in FY 2021 to support ongoing operations and system improvements, which included greater bus frequency, additional and extended bus routes, new vehicles, shaded bus stops and security and technology enhancements. Phoenix plans to use $1.5 billion in the next five years to continue bus and DAR operations, make capital investments to ensure that the system remains in a state of good repair and further expand and enhance the system.
Since T2050’s inception, Phoenix has ordered 122 DAR vehicles. By the end of FY 2026, the city expects to order an additional 240 buses.
13

COVID-19 ResponseIn May 2020, previous Executive Order 2020-18, issued on March 30, 2020 was rescinded. The order limited the use of public transportation to only when necessary to conduct or participate in essential activities or attend work in an essential function. In February 2021, the Centers for Disease Control and Prevention (CDC) issued an order requiring all travelers on public transit wear a face covering. This federal mandate remains in place until at least January 18, 2022. Valley Metro encourages riders to wear face coverings while at stops to communicate with operators that they are ready to board, and operators may ask a rider to deboard at the next stop due to non-compliance with the mask mandate. PTD regularly updates staff members and contractors about health and safety protocols as CDC guidelines change.
In addition to face coverings, PTD, Valley Metro and other transit partners maintain a variety of safety measures designed to protect passengers and employees, including:
● Limiting seating on buses to accommodate social distancing measures recommended by national and local health agencies.
● Making face masks available for riders at the Central Station; the Ed Pastor, Metrocenter and Sunnyslope transit centers; and the Burton Barr, Cesar Chavez, Desert Sage, Harmon, Palo Verde, Saguaro and Yucca libraries.
● Installing barriers between the operator and passengers on buses.
● Promoting social distancing by placing signs on buses and at bus stops, and posting messages on websites and social media platforms that provide information on passenger limits and the use of rear-door boarding procedures.
Additional preventive measures include providing hand sanitizer on buses, using visual fare inspections, and employing enhanced cleaning procedures in transit vehicles and on assets throughout the transit system.
Phoenix ridership fell due to the pandemic and increased teleworking. As a result, PTD implemented bus service reductions and partial restorations approved by the Phoenix City Council. City leaders continuously monitor ridership and expect to adjust service hours as ridership patterns change.
Local Fixed RouteLocal fixed route bus service is the cornerstone of the public transportation network. Riders can easily navigate to desired locations across the Valley using the grid system on which buses operate. Bus services were available nearly 24 hours per day prior to reductions in service due to the pandemic.
In FY 2021, more than 14 million bus boardings occured in Phoenix. Throughout the pandemic, riders continued to use public transit for essential trips. PTD communicated with passengers about safety measures put in place throughout the transit environment.
Dial-a-Ride and Alternative Transportation Services Phoenix’s alternative transportation options include DAR, ADA Ride, Senior Ride and Senior Center Shuttle, Employment Transportation and Medical Trip.
DAR provides federally required paratransit service to individuals unable to ride the bus or light rail. This service complements fixed route bus service by operating during the same service hours. DAR passengers can schedule a ride by phone or TripSpark, an online reservation tool launched in 2018.
Phoenix operates around 397,689 miles of bus service weekly. That’s enough service to go around the world 16 times.
14

Table 2.1 T2050 Bus and Dial-a-Ride
Completed FY 2021 (July 1, 2020–June 30, 2021)Fund existing bus, RAPID commuter bus, neighborhood circulator and Dial-a-Ride service for 35 years
y Continue to provide safe and reliable services. y Maintain bus and DAR service hours to match light rail
hours. (Note: Valley Metro adjusted light rail hours in response to the COVID-19 pandemic.)
Improve bus frequency y Partially restored transit services that had been cut
due to the COVID-19 pandemic and its impact on transit demand and the transit workforce.
New buses and Dial-a-Ride vehicles y Ordered 91 buses, three circulator buses and
25 DAR vehicles.Extend and add bus service to unserved major streets
y Split Route 0A from Route 0 in response to continued light rail construction on Central Avenue.
y Completed outreach on proposed service change that would increase frequency to Route 7.
y Completed outreach on proposed service change that would extend Route 8 to Central Avenue, which would connect it to Route 0A.
Bus bays y Bus bay installation paused due to COVID-19
Bus stops y Installed 92 new shade structures at existing bus
stops. Incorporate technology
y Finalized implementation of the Computer-Aided Dispatch/Automated Vehicle Location (CAD/AVL) upgrade on entire fleet.
y Kicked off Regional Fare Collection System (FCS) Improvement Project on August 31, 2020.
Increase security y Modified security hours at transit centers due to the
pandemic and related decreased bus service hours.Other progress
y New contractor agreements commenced at North and South facilities on July 1, 2020.
y New contractor agreements commenced at Operations Control Center on July 1, 2020.
Bus Stops and Shelters PTD added 92 shade structures to existing bus stops during the past fiscal year. Over the next five fiscal years, Phoenix plans to install 80 additional shade structures at existing bus stops each year, totaling 400 new shade structures by FY 2026.
Circulator ServiceFour circulator routes connect local area residents with key neighborhood destinations, including libraries, grocery stores and community centers. Phoenix’s routes are ALEX (Ahwatukee Local Explorer), DASH (Downtown Area Shuttle), MARY (Maryvale Area Ride for You) and SMART (Sunnyslope Multi-Access Residential Transit).
RAPID CommuterSix RAPID routes provide residents in suburban areas with an alternative to driving to downtown Phoenix.
Park-and-Ride Park-and-ride facilities provide free parking for transit users. PTD maintains and operates nine park-and-ride facilities, including the Sunnyslope, Metrocenter and Desert Sky transit centers. In addition, Valley Metro manages five light rail park-and-ride locations along the Phoenix portion of the light rail alignment. Bus shelter shade structures at stops provide
protection from common local environmental elements, such as extreme heat and seasonal monsoons.
15

Table 2.3 T2050 Bus and Dial-a-Ride
Planned for FY 2023–2026
Fund existing bus, RAPID commuter bus, neighborhood circulator and Dial-a-Ride service for 35 years
y Continue to provide safe and reliable services. y Maintain bus and DAR service hours to match light
rail hours.New buses and Dial-a-Ride vehicles
y Order buses: 40 (FY 2022), 40 (FY 2023), 40 (FY 2024), 60 (FY 2025), 60 (FY 2026).
y Order circulator buses: 5 (FY 2022), 3 (FY 2023), 3 (FY 2024), 3 (FY 2025), 3 (FY 2026).
y Order 25 DAR vehicles each fiscal year. Extend and add bus service to unserved major streets
y FY 2023: Add peak hour frequency on at least three local routes.
y FY 2023: Extend bus service to Lower Buckeye Road.Circulator Service
y FY 2023: Improve MARY and ALEX service to every 30 minutes.
Bus stops y Install 400 new shade structures at existing bus
stops.Increase security
y Increase security as service expands.Incorporate technology
y FY 2022: Launch FCS mobile application. y FY 2023: Launch reloadable smart cards and reduced
fare registration program.
Table 2.2 T2050 Bus and Dial-a-Ride
Planned for FY 2022
Fund existing bus, RAPID commuter bus, neighborhood circulator and Dial-a-Ride service for 35 years
y Continue to provide safe and reliable services. y Maintain bus and DAR service hours to match light
rail hours.Improve bus frequency
y Restore transit services that had been cut due to the COVID-19 pandemic.
New buses and Dial-a-Ride vehicles y Order 40 buses, five circulator buses and 25
DAR vehicles. Extend and add bus service to unserved major streets
y Implement service change that would increase frequency to Route 7.
y Implement service change that would extend Route 8 to Central Ave., which would connect it to Route 0A.
Bus stops y Install 80 new shade structures at existing bus stops.
Increase security y Increase security as service expands.
Incorporate technology y Continue work on the future launch of FCS mobile
application.
TechnologyPhoenix finalized the conversion of its regional transit fleet to the new Computer-Aided Dispatch/Automated Vehicle Location (CAD/AVL) system supplied by Clever Devices Ltd. The conversion helped in updating the bus system technology and added new features to optimize transit system operations, dispatching and asset tracking.
The Regional Fare Collection System (FCS) Improvement Project kicked off in August 2020 and will offer transit customers increased fare flexibility options such as the ability to store value and use mobile passes. Additional innovative FCS options include fare capping, mobile ticketing and time- and location-based fare products.
Operations and MaintenancePhoenix uses three facilities for bus maintenance, fueling and cleaning: the West, North and South Transit Facilities. First Transit, Inc., began providing transit services from the West Facility under a new agreement beginning July 1, 2018. Transdev began providing transit services from the North and South facilities under a new agreement beginning July 1, 2020. Transdev also began providing services at the Operations Control Center on July 1, 2020, adding three new controllers to provide increased system support and oversight.
16

3.0 High Capacity
Transit
17
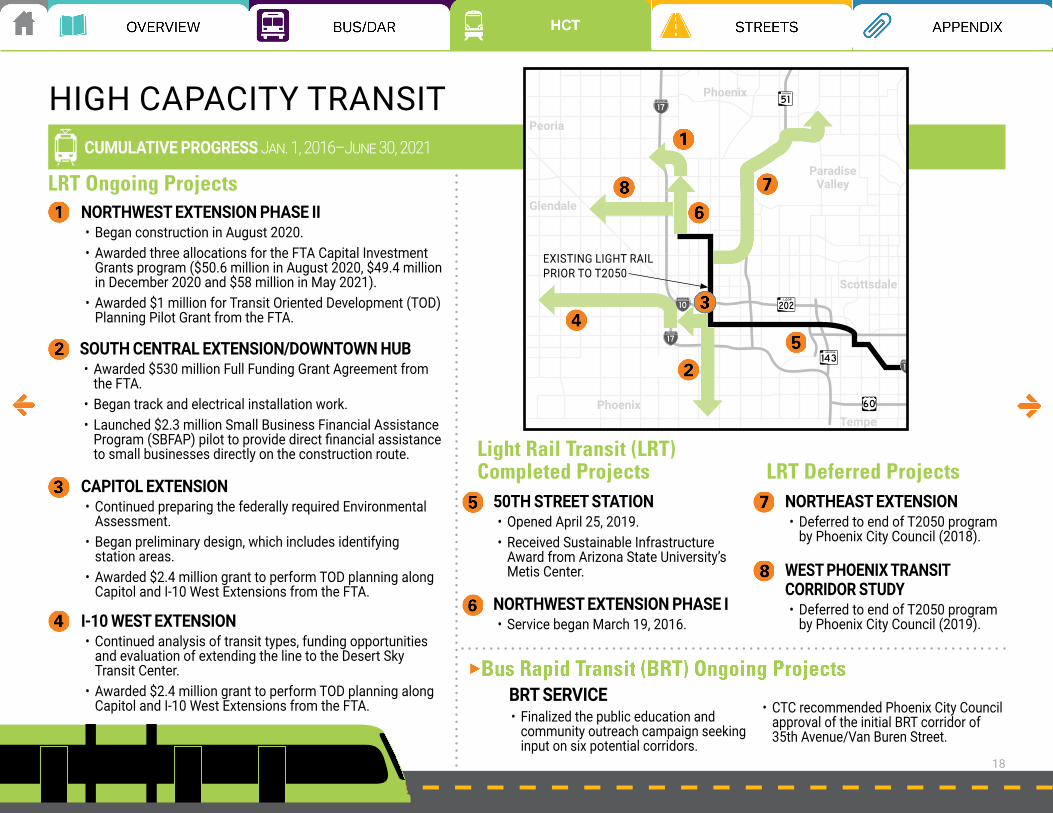
HIGH CAPACITY TRANSITCUMULATIVE PROGRESS Jan. 1, 2016–June 30, 2021
Glendale
Peoria
Paradise Valley
Scottsdale
TempePhoenix
Phoenix
NORTHWEST EXTENSION PHASE II• Began construction in August 2020.• Awarded three allocations for the FTA Capital Investment
Grants program ($50.6 million in August 2020, $49.4 million in December 2020 and $58 million in May 2021).
• Awarded $1 million for Transit Oriented Development (TOD) Planning Pilot Grant from the FTA.
EXISTING LIGHT RAIL PRIOR TO T2050
NORTHEAST EXTENSION• Deferred to end of T2050 program
by Phoenix City Council (2018).
LRT Deferred Projects
BRT SERVICE • Finalized the public education and
community outreach campaign seeking input on six potential corridors.
LRT Ongoing Projects
50TH STREET STATION • Opened April 25, 2019.• Received Sustainable Infrastructure
Award from Arizona State University’s Metis Center.
Light Rail Transit (LRT) Completed Projects
NORTHWEST EXTENSION PHASE I• Service began March 19, 2016.
• CTC recommended Phoenix City Council approval of the initial BRT corridor of 35th Avenue/Van Buren Street.
WEST PHOENIX TRANSIT CORRIDOR STUDY• Deferred to end of T2050 program
by Phoenix City Council (2019).
SOUTH CENTRAL EXTENSION/DOWNTOWN HUB• Awarded $530 million Full Funding Grant Agreement from
the FTA.• Began track and electrical installation work.• Launched $2.3 million Small Business Financial Assistance
Program (SBFAP) pilot to provide direct financial assistance to small businesses directly on the construction route.
CAPITOL EXTENSION• Continued preparing the federally required Environmental
Assessment.• Began preliminary design, which includes identifying
station areas.• Awarded $2.4 million grant to perform TOD planning along
Capitol and I-10 West Extensions from the FTA.
I-10 WEST EXTENSION• Continued analysis of transit types, funding opportunities
and evaluation of extending the line to the Desert Sky Transit Center.
• Awarded $2.4 million grant to perform TOD planning along Capitol and I-10 West Extensions from the FTA.
18

HIGH CAPACITY TRANSITHigh capacity transit (HCT) serves more customers than traditional bus service because it uses larger-capacity vehicles. HCT also offers faster travel
because it bypasses vehicular traffic.
For instance, Phoenix’s light rail service is able to operate at faster travel speeds because it runs in an exclusive guideway with prioritized traffic signaling. The 16.5 miles of light rail service within the city of Phoenix is a substantial portion of the existing 28.2-mile Valley Metro Rail light rail system. Residents use the system to connect between the downtown areas of Phoenix, Tempe and Mesa, as well as Sky Harbor Airport and many other key destinations in between.
In addition to light rail, bus rapid transit (BRT) is a key component of continuing to expand the city’s HCT network. The BRT program completed an 11-month public education and community outreach campaign, which ran from February to December 2020. The information from this outreach effort, in addition to the transit analysis, was used to identify the recommended initial BRT corridor, which will offer improved speed, reliability and convenience. To accomplish this, BRT potential plans include transit signal priority and queue jump lanes, which give buses a “head start” at intersections. BRT will also use the input gathered to evaluate dedicated bus lanes throughout the corridor or in selected areas.
The Community Engagement Summary identifies outreach tools and materials used to engage and educate the public and solicit feedback about BRT.
19

Light Rail ServiceNorthwest Extension Phase II Phase II of the Northwest Extension will bring light rail nearly to Metrocenter. The extension will run west on Dunlap Avenue from 19th Avenue, north on 25th Avenue and west on Mountain View across I-17, terminating near Metrocenter.
Construction began in August 2020 and the extension is currently scheduled to open in 2024, which is three years earlier than originally anticipated.
The project has received three budget allocations from Capital Investment Grants from the FTA ($50.6 million in August 2020, $49.4 million in December 2020 and $58 million in May 2021). These funds signify ongoing federal support for Phoenix’s projects, and the importance of transit to the growing metro Phoenix area.
Table 3.1 T2050 High Capacity Transit
Completed FY 2021 (July 1, 2020–June 30, 2021)
Increase light rail in Phoenix Northwest Extension Phase II
y Began construction in August 2020. y Awarded two budget allocations from Capital
Investment Grants from the FTA ($50.6 million in August 2020 and $49.4 million in December 2020).
y Awarded $1 million for Transit Oriented Development (TOD) Planning Pilot Grant from the FTA.
South Central Extension/Downtown Hub y Awarded $530 million full funding grant agreement
from the FTA. y Track and electrical installation work began. y Launched $2.3 million Small Business Financial
Assistance Program (SBFAP) pilot to provide direct financial assistance to small businesses directly on the construction route.
Capitol Extension y Began preliminary design, which includes identifying
station areas. y Continued preparing the federally required
Environmental Assessment. y Awarded $2.4 million FTA grant to conduct TOD and
affordable housing planning around the light rail stations along the Capitol and I-10 West Extensions.
I-10 West Extension y Continued analysis of transit types, funding
opportunities and evaluation of extending the line to the Desert Sky Transit Center.
y Awarded $2.4 million FTA grant to conduct TOD and affordable housing planning around the light rail stations along the Capitol and I-10 West Extensions.
Begin Bus Rapid Transit Program y Finalized the public education and community
outreach campaign seeking input on six potential corridors.
y CTC recommended Phoenix City Council approval of the initial BRT corridor of 35th Avenue/Van Buren Street.
Funding and BudgetThe cities of Phoenix, Tempe and Mesa share the funding obligations for the ongoing operations and maintenance of light rail. Expenses include vehicle operations, security and fare collection, and vehicle and system maintenance and administration.
Phoenix allocated $231.1 in FY 2021 to support ongoing light rail operations and expansion. T2050 includes an investment of more than $2 billion to expand and improve the city’s HCT network over the next five years. The plan includes light rail improvements and expansion and development of BRT. In addition to revenues generated by the city’s T2050 sales tax, other funding sources include federal grants, the Regional Public Transportation Fund, fares and advertising.
COVID-19 ResponseIn FY 2020, Valley Metro modified light rail hours in response to the COVID-19 pandemic, and these modifications remained in place through FY 2021. The first full trip on light rail began at approximately 4:45 a.m. with the last trip starting at 11 p.m. Adjustments included a 15-minute frequency from 5 a.m.–6 p.m. with no late-night service on Friday or Saturday. Sunday service remained the same.
Construction activities continued as planned.
20
I-10 West ExtensionThe I-10 West light rail extension will connect downtown Phoenix and the state capitol to the 79th Avenue Park-and-Ride in Maryvale. The project is expected to be completed in 2030.
The project analysis, which began in 2020, includes an analysis of transit types and funding opportunities, and an evaluation of extending the line to the Desert Sky Transit Center.
In March 2021, the project team had completed outreach to West Valley communities, gaining valuable input about project plans.
Next steps will include finalizing the project analysis and continuing community outreach.
Capitol ExtensionThe 1.4-mile Capitol Extension, originally known as Capitol/I-10 West Phase I, will connect the existing light rail system in downtown Phoenix to the Arizona state capitol.
In November 2020, the project’s Environmental Assessment (EA) and preliminary design began. The EA evaluates the environmental aspects of the project and provides a detailed analysis of how light rail would operate along the route.
Next steps will include continued design work, identification of station locations and continued community outreach. The project is currently scheduled to be completed in 2026.
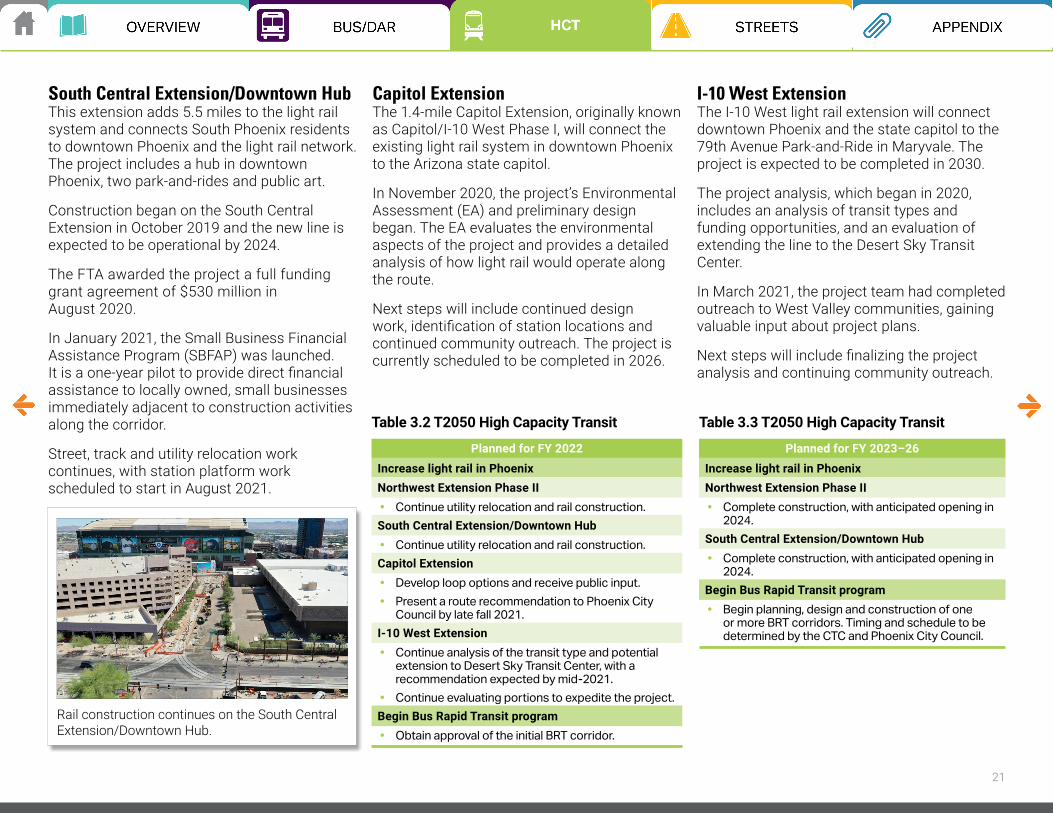
South Central Extension/Downtown Hub This extension adds 5.5 miles to the light rail system and connects South Phoenix residents to downtown Phoenix and the light rail network. The project includes a hub in downtown Phoenix, two park-and-rides and public art.
Construction began on the South Central Extension in October 2019 and the new line is expected to be operational by 2024.
The FTA awarded the project a full funding grant agreement of $530 million in August 2020.
In January 2021, the Small Business Financial Assistance Program (SBFAP) was launched. It is a one-year pilot to provide direct financial assistance to locally owned, small businesses immediately adjacent to construction activities along the corridor.
Street, track and utility relocation work continues, with station platform work scheduled to start in August 2021.
Rail construction continues on the South Central Extension/Downtown Hub.
Table 3.2 T2050 High Capacity Transit
Planned for FY 2022
Increase light rail in Phoenix Northwest Extension Phase II
y Continue utility relocation and rail construction.South Central Extension/Downtown Hub
y Continue utility relocation and rail construction.Capitol Extension
y Develop loop options and receive public input. y Present a route recommendation to Phoenix City
Council by late fall 2021.I-10 West Extension
y Continue analysis of the transit type and potential extension to Desert Sky Transit Center, with a recommendation expected by mid-2021.
y Continue evaluating portions to expedite the project. Begin Bus Rapid Transit program
y Obtain approval of the initial BRT corridor.
Table 3.3 T2050 High Capacity Transit
Planned for FY 2023–26
Increase light rail in Phoenix Northwest Extension Phase II
y Complete construction, with anticipated opening in 2024.
South Central Extension/Downtown Hub y Complete construction, with anticipated opening in
2024. Begin Bus Rapid Transit program
y Begin planning, design and construction of one or more BRT corridors. Timing and schedule to be determined by the CTC and Phoenix City Council.
21

Some tools the Phoenix BRT team used to gather this input included:
● Shape Your BRT survey, which ran from June 2020 through December 2020
● Online meeting at meetphoenixbrt.com ● Two live virtual meetings, one in English on
Nov. 10, 2020, and one in Spanish on Nov. 17, 2020
On May 27, 2021, the CTC recommended the Phoenix City Council approve the initial BRT corridor of 35th Avenue and Van Buren Street. The next step is to present the results from community engagement efforts and technical
Bus Rapid TransitPhoenix will develop the BRT program based on where current and future transit riders need service most. The project team identified the following six potential BRT corridors based on three factors — demographic and socioeconomic data, transit performance and forecasted ridership:
● Camelback Road and 24th Street ● Indian School Road and 24th Street ● Thomas Road and 44th Street ● McDowell Road and 44th Street ● 19th Avenue and Van Buren Street ● 35th Avenue and Van Buren Street
In February 2020, the Phoenix BRT team launched an 11-month community outreach campaign to educate and engage the public on the program. The goal was to solicit input on the six potential BRT corridors and four potential network scenarios. During this time, the team held 26 in-person or virtual meetings, connected with more than 1,200 people and fielded/answered nearly 600 questions and comments.
analysis to the Phoenix City Council for consideration in fall 2021.
In FY 2022, the Phoenix BRT Program will focus on obtaining approval of the initial corridor. The BRT Program will then advance this corridor into detailed planning, conceptual design and corridor-specific outreach. The primary efforts will include the identification of the BRT alignments and stations, development of the operating plan, completion of the funding plan and selection of the BRT vehicle. The BRT webpage, Phoenix.gov/BRT, provides information about the new program, including frequently asked questions.
BRT vs. RAPID/ExpressBRT takes the capacity and speed of light rail and combines it with the flexibility and simplicity of a bus system.
Users
specifically for commuters
all users
Areas served
major roads
Park-and-Ride service to downtown
PHX
Operating hrs
during peak “rush” hour
all day
12HDAILY
AM&PMRUSH HOUR
BRT
RAPID/ Express Bus
Capacity
passengers per bus
passengers per bus
60–80
100–150
Frequency
approximately every
10 minutes
during the day
approximately every
10 to 30 minduring peak “rush” hour
depending on routes
22

4.0 Street
Maintenance and Improvements
23

IMPROVED/INSTALLED
20,693ADA RAMPS
CUMULATIVE PROGRESS Jan. 1, 2016–June 30, 2021
STREET MAINTENANCE AND IMPROVEMENTS
69 MILES OF NEW SIDEWALKS
24
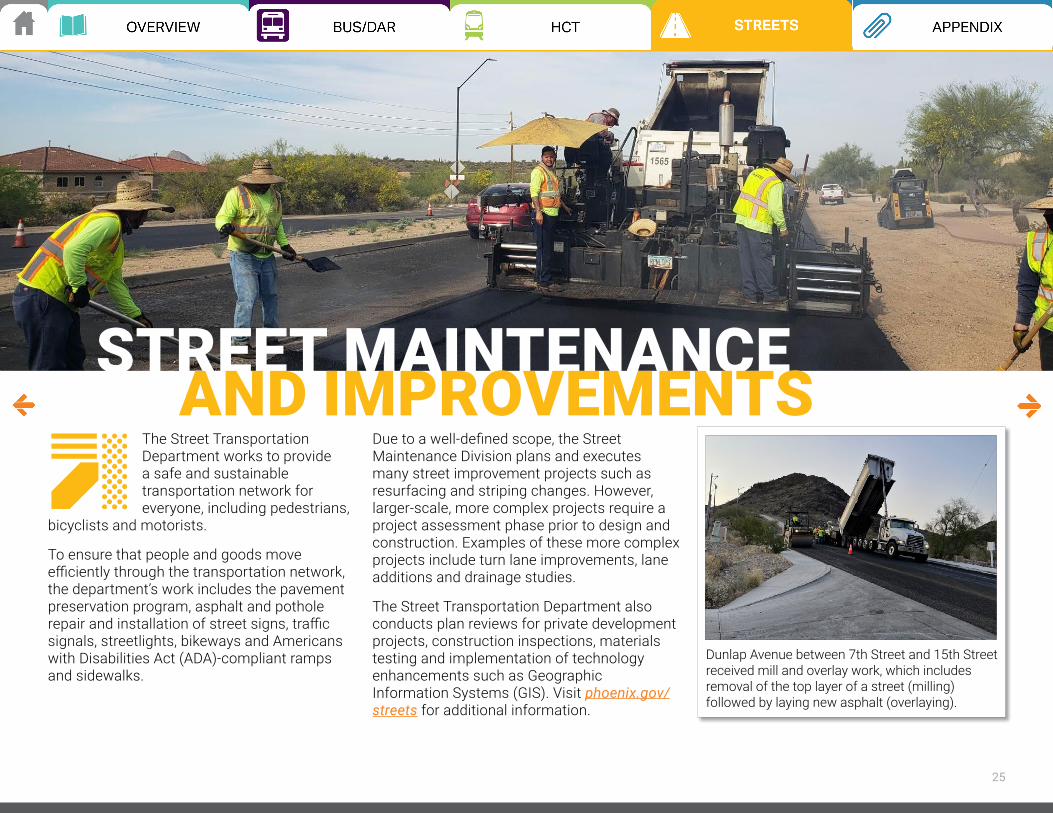
Due to a well-defined scope, the Street Maintenance Division plans and executes many street improvement projects such as resurfacing and striping changes. However, larger-scale, more complex projects require a project assessment phase prior to design and construction. Examples of these more complex projects include turn lane improvements, lane additions and drainage studies.
The Street Transportation Department also conducts plan reviews for private development projects, construction inspections, materials testing and implementation of technology enhancements such as Geographic Information Systems (GIS). Visit phoenix.gov/streets for additional information.
The Street Transportation Department works to provide a safe and sustainable transportation network for everyone, including pedestrians,
bicyclists and motorists.
To ensure that people and goods move efficiently through the transportation network, the department’s work includes the pavement preservation program, asphalt and pothole repair and installation of street signs, traffic signals, streetlights, bikeways and Americans with Disabilities Act (ADA)-compliant ramps and sidewalks.
STREET MAINTENANCE AND IMPROVEMENTS
Dunlap Avenue between 7th Street and 15th Street received mill and overlay work, which includes removal of the top layer of a street (milling) followed by laying new asphalt (overlaying).
25

Funding and BudgetPhoenix streets receive funding from a variety of sources, including 13.8% of T2050 sales tax, the state-collected motor fuel tax, city’s general fund, regional/Maricopa Association of Governments (MAG) funds, federal funds, grants and impact fees. shows the distribution of T2050 funds within the Street Transportation Department.
In FY 2021, Phoenix budgeted approximately $118.3 million in T2050 funding for street construction and maintenance projects. Phoenix’s T2050 plan for the next five years includes nearly $285 million to improve traffic system infrastructure, make ADA improvements, assess and address mobility needs and continue maintenance of city streets.
CITYWIDE TOTALS
T2050 PAVEMENT MAINTENANCE
JULY 1, 2018 THROUGH JUNE 30, 2021
529.2 MILESOF MILL AND OVERLAY WORK
828.1 MILESOF PRESERVATION TREATMENTS
1037.0 MILESOF CRACK SEAL
11,981ADA RAMPS
5%Technology
enhancements15%
Mobilityimprovements
50%Street
maintenance
30% New and expanded
streets
Figure 4.1 T2050 Funds for Street Improvement
Accelerated Pavement Maintenance ProgramIn 2018, the Phoenix City Council created the Accelerated Pavement Maintenance Program (APMP) and allocated $200 million of additional funding over five years.
In June 2021, APMP celebrated passing the 500 mile mark of mill and overlay in just three years. In FY 2021 alone, the department performed mill and overlay treatment on 128 miles of streets, 436 miles of pavement preservation and 220 miles of crack seal in preparation for future work. The 2021 paving season currently has 79 miles of overlay planned.
The annual Pavement Condition Report details the paving assessment process, pavement treatments and current conditions. The reports are available on the city’s website.
COVID-19 ResponseStreet paving, pothole patching, sign replacement, lane striping, traffic signal servicing and installation and streetlight repair continued through COVID-19 because they were considered essential city services. During weeks with fewer people driving, crews were able to work on major roads.
Throughout this fiscal year, planning and design continued with community engagement occurring on virtual platforms. The shift to virtual engagement has resulted in high levels of engagement and valuable input for the project teams.
Updates about health and safety protocols were regularly distributed to project teams and road crews, allowing schedules to be updated accordingly. Health and safety remain a top priority for the department.
26

Cool Pavement In October 2020, the Street Transportation Department applied cool pavement coating to selected streets in eight neighborhoods and one city park. The coating, which is lighter in color than traditional asphalt coatings, reflects sunlight and retains less heat compared to traditional asphalt coatings. Therefore, cool pavement has the potential to offset rising nighttime temperatures in Phoenix. The pilot program will study the effectiveness and durability of the material and the ability of the coating to extend the life of the existing pavement. The Street Transportation Department expects to announce initial study results in early FY 2022. For more information about the pilot program, visit phoenix.gov/streets/coolpavement.
To improve safety, convenience and quality of life, the studies’ recommendations have included opportunities for constructing new sidewalks, installing or improving ADA curb ramps and installing streetlights, bicycle facilities, traffic signals, shade trees and connections to transit stops.
In FY 2022, the Street Transportation Department will partner with the Neighborhood Services Department to use Phoenix’s federal Community Development Block Grant to install 305 ADA ramps recommended by the mobility studies.
Pilot ProgramsRecycled Asphalt Program The City of Phoenix Recycled Asphalt Pavement (RAP) Program launched in March 2020. Asphalt millings generated from mill and overlay projects are crushed and screened to an engineered specification for reuse. By using RAP, the city reduces the use of mined materials. The project team also expects to realize cost savings through these sustainable practices.
Phoenix is currently replacing virgin aggregate with 100% RAP in slurry seal and microsurfacing projects, and 20% RAP in overlay projects.
RAP Program Summary
Project Type
Number of Locations
Percentage of RAP Used
Tons of RAP Used
Miles Paved
with RAP
Slurry Seal 17 100% 6,500 41
Microsurfacing 7 100% 2,500 5
Overlay 5 20% 2,500 4.5
Since the program began, approximately 11,500 tons of aggregate have been recycled.
Active Transportation Program The Active Transportation Program (ATP) strives to connect, improve and expand the city’s pedestrian and bicycle network. Active transportation and transit are highly interconnected because users depend on active transportation to navigate between light rail, BRT and bus routes.
As the Street Transportation Department repaves streets, the ATP identifies opportunities to update striping plans to add or widen bike lanes, add buffers to existing bike lanes and add markings in the intersections on major bikeways. Buffered bike lanes and protected bike lanes create more space between sidewalks and vehicle travel lanes, improving the walking experience.
The ATP also advocates for multi-use paths and street crossings. Projects along canals and other off-street trails strengthen the active transportation network and create a better quality of life for everyone.
The Active Transportation Plan, which includes a Bicycle Master Plan update, will launch its public outreach process in fall 2021. The ATP looks forward to hearing residents’ priorities for enhancing the active transportation network.
Mobility StudiesThe Street Transportation Department conducts mobility studies to identify barriers for pedestrians and bicyclists as they travel to neighborhood destinations. Phoenix identified 39 locations for study at the inception of T2050 and has completed 12 studies.
Cool pavement is a water-based asphalt treatment that is applied on top of the existing asphalt pavement.
27

HAWKs enhance pedestrian safety at busy intersections and mid-block locations.
The city leveraged T2050 funding as a match for federal funding for fiber optic cable installation projects. The FY 2022 project will install 12 miles of fiber along Indian School Road and will provide connections between the Maricopa County Department of Transportation, the City of Glendale and the City of Phoenix. The FY 2023 project will install 12 miles of fiber along Baseline Road and will provide connections for: the Arizona Department of Transportation between State Route 202 and Interstate 10; the City of Tempe for three signals west of Interstate 10; and the City of Phoenix for all Phoenix-managed signals on Baseline Road.
These projects augment the city’s fiber backbone. The traveling public benefits because the Traffic Management Center (TMC) can better monitor traffic with cameras that send full streaming video back to the TMC. In addition, intelligent devices installed at intersections transmit traffic performance metrics to the TMC, allowing the TMC to adjust traffic signal timing to improve traffic flow and better serve the public. Similarly, the expanded fiber backbone provides for improved, integrated connections between stations for emergency responders such as fire and police.
Intersection and Technology EnhancementsPhoenix uses a variety of technology enhancements, ranging from rapid flashing beacons and enhanced illumination to installing High-intensity Activated crossWalKs (HAWKs). Other T2050 technology enhancements include improving and maintaining traffic control equipment, adding left-turn arrows at warranted intersections, replacing street name signs with retroreflective signs that feature light-emitting diode (LED) lighting and installing updated signals, signage, detection equipment and traffic management and monitoring systems.
Table 4.1 T2050 Street Maintenance and Improvements
Completed FY 2021 (July 1, 2020–June 30, 2021)Street projects
y 30 major street projects in the project assessment phase, with two assessments completed.
y 12 major street projects in design. y 28 major street projects in construction. y 31 major street projects completed.
Street pavement and overlays y Continued the Accelerated Pavement Maintenance
Program, for which the Phoenix City Council authorized an additional $200 million to fast-track pavement maintenance through FY 2024.
y 74.3 miles of new asphalt pavement on major streets. y 146.5 miles of other pavement treatments, such as
crack and fog sealing, on major collector streets. y 53.5 miles of local street paving. y 509.9 miles of other pavement treatments, such as
crack and fog sealing, on local streets.Bicycle lanes
y Installed 32.2 miles of lanes. y Upgraded 1 mile of existing bike lane miles to
protected bike lanes. y Upgraded 34.5 miles of existing bike lanes to buffered
bike lanes. y Installed 6 linear miles of new multi-use paths.
Streetlights y Installed 999 new streetlights.
Sidewalks y Constructed 12.2 miles of sidewalks.
Mobility studies y Completed one mobility study.
Intersection technology enhancements y Replaced 230 street signs at major intersections with
illuminated signs. y Repainted all signal poles at 97 major intersections to
extend their lifecycles. y Installed 74 new left-turn arrows at warranted
intersections. y Installed two pedestrian High-intensity Activated
crossWalKs (HAWKs).
28

Internal and external applications allow staff and, in many cases, residents to access map services and applications with this GIS information. Some of these include a live active HAWK traffic signal web map, the pavement maintenance dashboard, bikeways map services and e-scooter facilities mapping.
As staff members in the field make live updates, the accumulated data and analysis tools provide for a more efficient workflow and near-real-time analysis and reporting.
Information Technology and GISThe Management Services Division digitizes, validates and reports on assets. The division uses GIS technology to catalogue location data and maintenance records on bikeways, pavement, lighted street signs and ADA curb ramps. Ultimately, the data allow for more efficient planning, analysis and reporting.
Recent improvements in these processes have included:
● Creating field staff applications for reporting condition and improvement needs related to assets such as traffic signals, pavement, curb ramps, sidewalks and streetlights.
● Improving the accuracy, usefulness and availability of existing traffic signal data for the entire department.
● Leveraging pavement condition data, with underlying soil condition data, to provide engineers with a broader understanding of problematic areas.
● Using data sources from the city, county and Arizona State University to identify and map tree and shade prioritization areas.
● Updating bikeways, Key Corridors Master Plan and Mobility Studies data to give the ATP team accurate information for planning and implementing improvements.
● Researching and editing thousands of ADA ramp records to build and update the database.
Table 4.3 T2050 Street Maintenance and Improvements
Planned for FY 2023–2026
Street projects y Conduct one major street project assessment. y Design 11 major street projects. y Continue construction on 20 major street projects.
Street pavement and overlays y Pave at least 77 miles of new pavement on major
streets.Bicycle lanes
y Install 123 miles of bike lanes and low-stress bikeways.
Streetlights y Install 400 new streetlights.
Sidewalks y Construct 15 miles of new sidewalks.
Intersection technology enhancements y Replace 960 street signs at major intersections with
illuminated signs. y Repaint all signal poles at 320 major intersections to
extend their lifecycles. y Install 25 pedestrian HAWKs.
Table 4.2 T2050 Street Maintenance and Improvements
Planned for FY 2022
Street projects y Design 10 major street projects. y Continue construction on 24 major street projects.
Street pavement and overlays y Pave 19 miles on major streets.
Bicycle lanes y Install 30 miles of bike lanes and low-stress bikeways.
Streetlights y Install 100 new streetlights.
Sidewalks y Construct 4 miles of new sidewalks.
Mobility studies
y Install 305 ADA ramps based on mobility studies. Intersection technology enhancements
y Replace 240 street signs at major intersections with illuminated signs.
y Repaint all signal poles at 80 major intersections to extend their lifecycles.
y Install 15 pedestrian HAWKs.
Crews install curb ramps to provide a safe route that people with disabilities can use to transition from a curbed sidewalk to roadway and vice versa.
29

5.0Appendix
30

Lifecycle Programming Assumptions As with any long-term plan, preparation of the financial model for the T2050 program required many assumptions for estimated costs, revenues and timing of projects and new services. Key assumptions of the T2050 program include:
z The implementation of projects and new services is projected to occur over the course of the 35-year plan as funding allows and service demand dictates.
z Capital and operating costs are estimated to grow at average inflation rates of 3–4% annually over the life of the plan. These inflation rates are somewhat higher than the typical annual increases the city has experienced in the large transit contracts, and provide for more conservative cost estimates.
z T2050 sales tax revenues are estimated to grow at an average annual rate of 4.75%, which is slightly lower than the 5.2% average annual growth rate in the Arizona Department of Transportation’s most recent forecast prepared in September 2020 for the Proposition 400 Maricopa County Transportation Excise Tax.
z The existing 0.5% Proposition 400 regional tax, currently in place through Dec. 31, 2025, is assumed to be extended for at least 20 years.
z Federal transit formula funds are assumed to continue through the life of the plan, with very modest increases over time, and are consistent with MAG’s long-term Regional Transportation Plan.
z The financial model is consistent with Valley Metro assumptions, ranging from 0% to 39%, for the funding level from discretionary federal Capital Investment Grants for light rail capital costs. Discretionary federal Capital Investment Grants, on average, fund more than 40% of total project costs for current rail projects across the country.
z Transit fares are assumed to continue to be lower than the regional fare policy goal of 25% recovery of direct transit operations costs, reflecting the current fare recovery rate. Decreased fare revenues due to the COVID-19 pandemic are assumed to recover very slowly over 20 years.
z Some capital funding is assumed to be provided through financing, as needed, with the corresponding costs estimated using typical municipal bond offerings. Less expensive and more flexible types of financing will be explored to minimize financing costs.
z Other revenues, such as transit advertising and interest earnings on fund balance, are forecasted using very low growth rates.
z An operating reserve equivalent to 15% of annual public transit operating costs is assumed to be maintained throughout the life of the plan.
APPENDIX
In FY 2021, Phoenix allocated $240.0 million to support bus and DAR operations and $231.1 million to support ongoing light rail operations and expansion.
Impact of COVID-19Phoenix had expected that the global pandemic, which began in 2020 as a result of the contagious COVID-19 virus, would reduce revenue projections for the coming years because ridership numbers fell significantly in 2020. However, there were some economic drivers that had a positive impact on revenue projection, which city leaders continue to monitor.
This report notes the changes experienced due to the pandemic within each program area.
31

Table A.1 T2050 Sales Tax Projected Revenue Stream
Fiscal Year Overall T2050 (2015 Forecast) Actual Overall Forecasted Public Transit
(86.2%) Actual Public Transit Forecasted Street Transportation (13.8%)
Actual Street Transportation
2016 $89,125,000 $98,593,240 $76,826,000 $85,095,392 $12,299,000 $13,497,8482017 $204,006,000 $203,352,480 $175,853,000 $175,430,201 $28,153,000 $27,922,2792018 $213,696,000 $215,805,685 $184,206,000 $185,998,894 $29,490,000 $29,806,7912019 $224,401,000 $239,179,006 $193,434,000 $206,200,341 $30,967,000 $32,978,6652020 $235,642,000 $247,592,555 $203,123,000 $213,437,765 $32,519,000 $34,154,7902021 $246,835,000 $279,348,428 $212,772,000 $240,800,097 $34,063,000 $38,548,3312022 $258,559,000 blank $222,878,000 blank $35,681,000 blank2023 $270,841,000 blank $233,465,000 blank $37,376,000 blank2024 $283,706,000 blank $244,555,000 blank $39,151,000 blank2025 $297,182,000 blank $256,171,000 blank $41,011,000 blank2026 $311,298,000 blank $268,339,000 blank $42,959,000 blank2027 $326,085,000 blank $281,085,000 blank $45,000,000 blank2028 $341,574,000 blank $294,437,000 blank $47,137,000 blank2029 $357,799,000 blank $308,423,000 blank $49,377,000 blank2030 $374,794,000 blank $323,072,000 blank $51,722,000 blank2031 $392,597,000 blank $338,419,000 blank $54,178,000 blank2032 $411,245,000 blank $354,493,000 blank $56,752,000 blank2033 $430,779,000 blank $371,331,000 blank $59,448,000 blank2034 $451,241,000 blank $388,970,000 blank $62,271,000 blank2035 $472,675,000 blank $407,446,000 blank $65,229,000 blank2036 $495,127,000 blank $426,799,000 blank $68,328,000 blank2037 $518,646,000 blank $447,073,000 blank $71,573,000 blank2038 $543,281,000 blank $468,308,000 blank $74,973,000 blank2039 $569,087,000 blank $490,553,000 blank $78,534,000 blank2040 $596,119,000 blank $513,855,000 blank $82,264,000 blank2041 $624,435,000 blank $538,263,000 blank $86,172,000 blank2042 $654,095,000 blank $563,830,000 blank $90,265,000 blank2043 $685,165,000 blank $590,612,000 blank $94,553,000 blank2044 $717,710,000 blank $618,666,000 blank $99,044,000 blank2045 $751,801,000 blank $648,052,000 blank $103,749,000 blank2046 $787,512,000 blank $678,835,000 blank $108,677,000 blank2047 $824,919,000 blank $711,080,000 blank $113,839,000 blank2048 $864,102,000 blank $744,856,000 blank $119,246,000 blank2049 $905,147,000 blank $780,237,000 $124,910,000
2050 $948,142,000 blank $817,299,000 blank $130,844,000 blankTotal $16,679,368,000 blank $14,377,615,000 blank $2,301,753,000 blank
T2050 Sales Tax Projected Revenue StreamThe following table includes the projected sales tax revenue for each year of the T2050 plan. Additionally, the table shows the anticipated allocation to the Public Transit and Street Transportation departments.
32
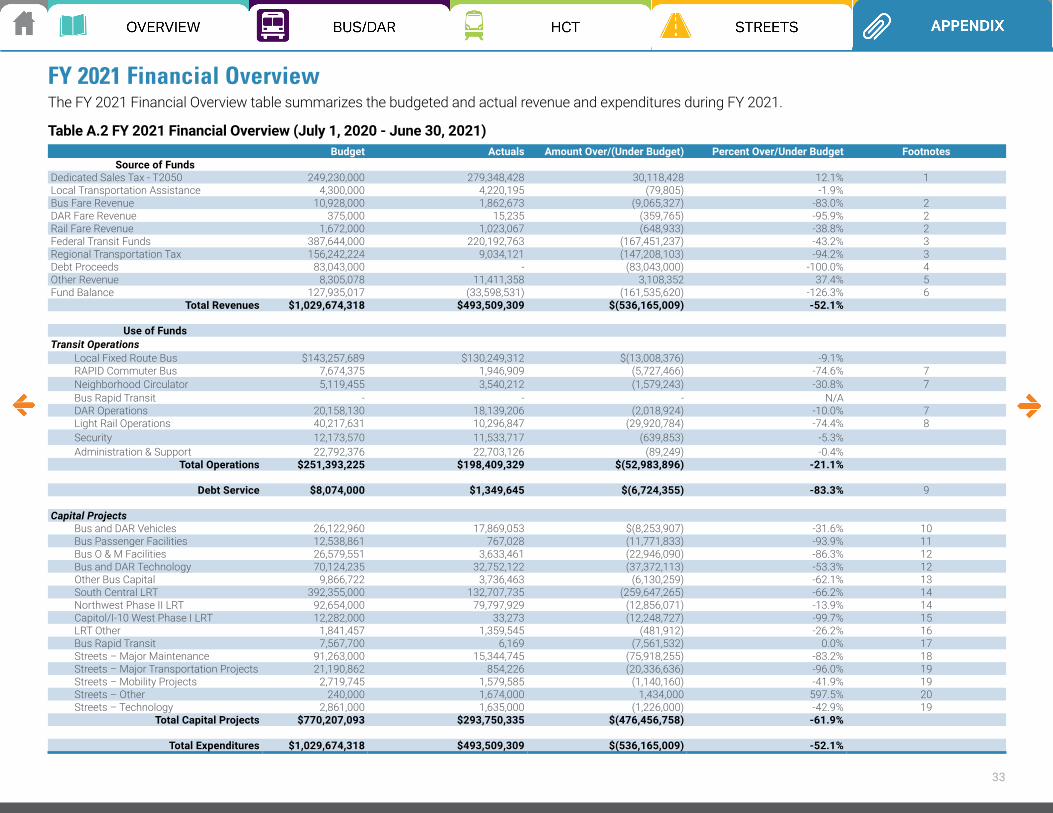
Budget Actuals Amount Over/(Under Budget) Percent Over/Under Budget FootnotesSource of Funds
Dedicated Sales Tax - T2050 249,230,000 279,348,428 30,118,428 12.1% 1Local Transportation Assistance 4,300,000 4,220,195 (79,805) -1.9%Bus Fare Revenue 10,928,000 1,862,673 (9,065,327) -83.0% 2DAR Fare Revenue 375,000 15,235 (359,765) -95.9% 2Rail Fare Revenue 1,672,000 1,023,067 (648,933) -38.8% 2Federal Transit Funds 387,644,000 220,192,763 (167,451,237) -43.2% 3Regional Transportation Tax 156,242,224 9,034,121 (147,208,103) -94.2% 3Debt Proceeds 83,043,000 - (83,043,000) -100.0% 4Other Revenue 8,305,078 11,411,358 3,108,352 37.4% 5Fund Balance 127,935,017 (33,598,531) (161,535,620) -126.3% 6
Total Revenues $1,029,674,318 $493,509,309 $(536,165,009) -52.1%
Use of FundsTransit Operations
Local Fixed Route Bus $143,257,689 $130,249,312 $(13,008,376) -9.1% RAPID Commuter Bus 7,674,375 1,946,909 (5,727,466) -74.6% 7 Neighborhood Circulator 5,119,455 3,540,212 (1,579,243) -30.8% 7 Bus Rapid Transit - - - N/A DAR Operations 20,158,130 18,139,206 (2,018,924) -10.0% 7 Light Rail Operations 40,217,631 10,296,847 (29,920,784) -74.4% 8 Security 12,173,570 11,533,717 (639,853) -5.3% Administration & Support 22,792,376 22,703,126 (89,249) -0.4%
Total Operations $251,393,225 $198,409,329 $(52,983,896) -21.1%
Debt Service $8,074,000 $1,349,645 $(6,724,355) -83.3% 9
Capital Projects Bus and DAR Vehicles 26,122,960 17,869,053 $(8,253,907) -31.6% 10 Bus Passenger Facilities 12,538,861 767,028 (11,771,833) -93.9% 11 Bus O & M Facilities 26,579,551 3,633,461 (22,946,090) -86.3% 12 Bus and DAR Technology 70,124,235 32,752,122 (37,372,113) -53.3% 12 Other Bus Capital 9,866,722 3,736,463 (6,130,259) -62.1% 13 South Central LRT 392,355,000 132,707,735 (259,647,265) -66.2% 14 Northwest Phase II LRT 92,654,000 79,797,929 (12,856,071) -13.9% 14 Capitol/I-10 West Phase I LRT 12,282,000 33,273 (12,248,727) -99.7% 15 LRT Other 1,841,457 1,359,545 (481,912) -26.2% 16 Bus Rapid Transit 7,567,700 6,169 (7,561,532) 0.0% 17 Streets – Major Maintenance 91,263,000 15,344,745 (75,918,255) -83.2% 18 Streets – Major Transportation Projects 21,190,862 854,226 (20,336,636) -96.0% 19 Streets – Mobility Projects 2,719,745 1,579,585 (1,140,160) -41.9% 19 Streets – Other 240,000 1,674,000 1,434,000 597.5% 20 Streets – Technology 2,861,000 1,635,000 (1,226,000) -42.9% 19
Total Capital Projects $770,207,093 $293,750,335 $(476,456,758) -61.9%
Total Expenditures $1,029,674,318 $493,509,309 $(536,165,009) -52.1%
Table A.2 FY 2021 Financial Overview (July 1, 2020 - June 30, 2021)
FY 2021 Financial OverviewThe FY 2021 Financial Overview table summarizes the budgeted and actual revenue and expenditures during FY 2021.
33

Footnotes detailing the FY 2021 Financial Overview table found on the preceding page include:
1. Better than expected local economic activity resulted in higher sales tax revenues.
2. Rear door boarding’s and no fareboxes being used.
3. Decrease due to Capital Project delays.
4. Transit did not need to finance due to federal pandemic relief funds received from FTA and higher than expecyed sales tax revenues.
5. Higher than expected interest earnigs due to federal pandemic relief funds received from FTA and higher than expecyed sales tax revenues.
6. Fund balance increased due to federal pandemic relief funds received from FTA and higher than expecyed sales tax revenues.
7. Reduction in revenue miles due to pandemic.
8. Reduction in payments to Valley Metro Rail due to lower service levels and federal pandemic relief funds received from FTA.
9. Transit did not need to finance due to federal pandemic relief funds received from FTA and higher than expecyed sales tax revenues.
10. Fleet manufacturers’ production delays.
11. Laveen Park-and-Ride delayed and no expenditures for bus pullouts.
12. Projects delayed.
13. Unused contingency.
14. Project funding and costs to be budgeted and expended over multiple years.
15. Project delays.
16. Over programmed budget for disposal of remnant properties, Business Assistance Program, McDowell & Central and City Core Staff - West Phx/Central Glendale. Adjusted at Prelim.
17. Longer than expected public/stakeholder involvement process.
18. Bond program was priority, funds were carried over.
19. Unused capacity for contracted services. Funds were carried over.
20. Includes 5 projects that were not initially budgeted under this category.
34

FY 2021-2022 FY 2022-2023 FY 2023-2024 FY 2024-2025 FY 2025-2026Source of Funds
Dedicated Sales Tax – T2050 $274,395,000 $290,825,000 $306,254,000 $323,172,000 $340,952,000 Local Transportation Assistance 4,300,000 4,300,000 4,300,000 4,300,000 4,300,000 Bus Fare Revenue 17,708,957 22,741,511 31,014,395 36,914,095 39,476,367 DAR Fare Revenue 889,066 889,066 941,364 1,035,216 1,150,240 Rail Fare Revenue 4,794,716 5,960,202 8,026,405 12,063,290 12,183,923 Federal Transit Funds 518,867,287 204,800,688 241,076,926 169,589,687 108,930,469 Regional Transportation Tax 64,266,816 78,386,316 66,025,576 68,363,533 67,468,850 Debt Proceeds - - 305,500,000 130,627,305 385,000,000 Other Revenue 8,202,649 8,325,689 8,450,574 8,577,333 8,705,993 Fund Balance (27,685,940) 156,981,049 (115,056,824) 154,201,843 (322,371,200)
Total Revenues $865,738,551 $773,209,521 $856,532,415 $908,844,301 $645,796,641
Use of FundsTransit Operations
Local Fixed Route Bus $150,471,083 $159,633,300 $165,816,949 $172,651,191 $177,572,890 RAPID Commuter Bus 2,444,566 5,652,065 6,273,594 6,533,127 6,713,734 Neighborhood Circulator 3,748,622 6,888,185 7,159,505 7,463,073 7,676,824 Bus Rapid Transit - - 2,101,600 7,188,480 7,406,880 DAR Operations 21,231,800 21,868,754 22,524,817 23,200,561 23,896,578 Light Rail Operations 42,484,798 44,142,582 45,865,442 62,143,766 64,583,539 Security 13,060,602 13,452,500 13,856,145 14,271,739 14,700,492 Administration & Support 27,180,000 27,995,400 28,835,262 29,700,320 30,591,329
Total Operations $260,621,472 $279,632,786 $292,433,314 $323,152,258 $333,142,266 Debt Service $21,124,625 $21,122,375 $21,122,500 $22,726,250 $27,952,467
Capital ProjectsBus and DAR Vehicles $46,712,943 $46,871,000 $46,964,000 $59,975,000 $49,402,904 Bus Passenger Facilities 14,182,195 5,875,000 3,830,000 3,830,000 3,830,000 Bus O&M Facilities 28,246,735 2,200,000 1,850,000 1,850,000 1,850,000 Bus and DAR Technology 39,712,074 1,020,000 2,620,000 8,250,000 2,520,000 Other Bus Capital 12,056,676 3,906,000 3,941,000 3,876,000 3,622,000 South Central Light Rail 266,474,000 256,946,000 267,891,000 176,289,000 46,625,000 Northwest Phase II Light Rail 103,849,000 79,642,000 10,776,000 7,814,000 - Capitol/I-10 West Phase I Light Rail 9,970,000 30,360,000 97,440,000 136,230,000 71,870,000 Capitol/I-10 West Phase II Light Rail - - 5,573,788 11,482,004 Other Light Rail 2,032,000 - - - - Bus Rapid Transit 6,004,282 18,250,000 79,750,000 123,750,000 61,500,000
Total Public Transit T2050 Capital Projects $529,239,905 $445,070,000 $515,062,000 $527,437,788 $252,701,908
Streets – Major Maintenance $17,053,000 $18,130,000 $19,790,000 $19,790,000 $19,790,000 Streets – Major Transportation Projects $21,510,252 $1,707,000 $2,247,000 $13,221,678 $10,485,000 Streets – Mobility Projects $9,308,797 $3,895,360 $3,697,601 $336,327 $95,000 Streets – Other $2,639,500 $1,470,000 $1,470,000 $1,470,000 $870,000 Streets – Technology $4,241,000 $2,182,000 $710,000 $710,000 $760,000
Total Streets T2050 Capital Projects $54,752,549 $27,384,360 $27,914,601 $35,528,005 $32,000,000 Total Capital Projects $583,992,454 $472,454,360 $542,976,601 $562,965,793 $284,701,908
Total Expenditures $865,738,551 $773,209,521 $856,532,415 $908,844,301 $645,796,641
Year End Fund Balance: Public Transit $204,623,433 $52,695,268 $171,206,141 $25,738,317 $350,863,016 Year End Fund Balance: Streets 55,384,351 50,331,466 46,877,417 38,143,398 35,389,899
Total Fund Balance $260,007,784 $103,026,735 $218,083,559 $63,881,716 $386,252,916
Table A.3 Five-Year Implementation Plan (FY 2022–2026)
Five-Year Implementation PlanThe Five-Year Implementation Plan table summarizes the projected distribution of funds collected over the next five years. The table does not include actual collections. Note: BRT capital and operations expenditures are planned to be incurred during this five-year plan, and the amounts reflected are preliminary, pending the results of the BRT study.
35