moving forward 2050
TRANSCRIPT

1Moving Forward 2050

2Moving Forward 2050
CTP DEVELOPMENT PROCESS
Develop and implement public engagement strategy
Update Vision and Goals
Inventory transportation systems & update trends
Update project list and test performance
Actions needed to achieve the CTP goals

Introduction
A Transportation Plan for the FutureAddressing EquityCommunity VoicesVision and Goals
1

4Moving Forward 2050
A HISTORY OF LONG RANGE PLANNING
Twenty years ago, SCTA produced the first CTP.It called for:
• expanded bus transit;• commuter rail and a rail-ferry connection; • strategic expansion of Highway 101; • and a more robust bicycle lane network;• safe local roads, free of potholes

5Moving Forward 2050
EQUITYSCTA is committed to equitable transportation planning. To encourage investment in disadvantaged communities, SCTA identified targeted areas for prioritizing funding to provide safe, accessible, and affordable mobility.
Now we have a flexible approach that includes:
• A fine-tune the technical analysis to get a better understanding of geographic spaces that serve Equity Priority Communities and;
• Addressing the whole population of disadvantaged people with means based fares on transit and for other modes.
6Moving Forward 2050
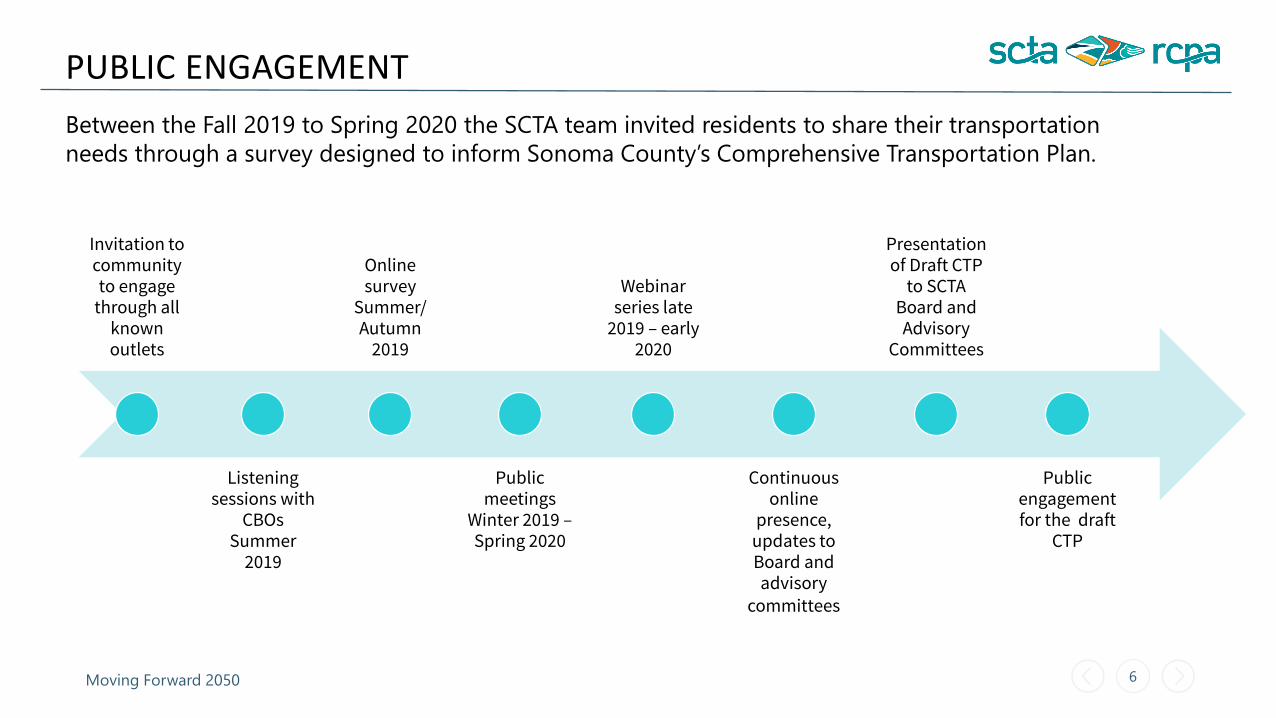
PUBLIC ENGAGEMENTBetween the Fall 2019 to Spring 2020 the SCTA team invited residents to share their transportation needs through a survey designed to inform Sonoma County’s Comprehensive Transportation Plan.
Invitation to community to engage
through all known outlets
Listening sessions with
CBOs Summer
2019
Online survey
Summer/Autumn
2019
Public meetings
Winter 2019 –Spring 2020
Webinar series late
2019 – early 2020
Continuous online
presence, updates to Board and advisory
committees
Presentation of Draft CTP
to SCTA Board and Advisory
Committees
Public engagement for the draft
CTP

7Moving Forward 2050
WHAT WE HEARD

8Moving Forward 2050
Repair potholes
7 - Very important
52%
44%
43%
41%
40%
39%
39%
6
13%
15%
17%
18%
14%
16%
5 Total Importance
16% 15% 83%
13% 69%
18% 76%
17% 75%
16% 74%
17% 71%
18% 73%
Reduce greenhouse gas emissions
Reduce traffic congestion on local roads and highways
Make local roads and highways safer
Improve evacuation and emergency road access
Enhance
Make walking and biking safer
transportation for seniors, veterans, and people with disabilities
Everyday commuter issues like potholes, traffic, and road safety are of the highest importance to voters, along with reducing greenhouse gasses and improving evacuation routes.
GO SONOMA POLLING

9Moving Forward 2050
GO SONOMA POLLING
Other more specific projects do not resonate as widely.
7 - Very important
Protect transportation infrastructure from floods, fires,32%earthquakes, and other impacts of climate change
Support new housing near transit hubs 28% 14%
Expand the reach and frequency of local bus service 25% 13%
Improve connections between East and West County 21% 16%
Make it easier to get to and from public transit with options like 20% 13%electric scooters, bike shares, employee shuttles, and ride hailing
Support installation of electric vehicle charging stations 20% 11%
Eliminate fares for taking the bus 16% 10% 13%
6 5
18% 18%
20% 61%
21% 59%
19% 56%
19% 53%
18% 49%
38%
Total Importance
68%

10Moving Forward 2050
Connecting people, places and goods as we transition our transportation network to zero-emissions by 2050. Our guiding principles are to improve safety, equity and quality of life.
The goals are that our transportation system should be:
1. Connected and Reliable: Deliver a seamless network that allows people to use a variety of transportation types easily, affordably and dependably.
2. Safe and Well Maintained: Provide safe and well-maintained transportation infrastructure.
3. Community Oriented and Place-Based: Implement place-based (or context sensitive) transportation projects, tailored to urban, suburban and rural communities that will improve local mobility.
4. Zero Emissions: Provide zero-emission transportation opportunities that meet diverse community needs, improve health and enhance quality of life.
VISION AND GOALS

11Moving Forward 2050
25 year Total Project Costs
PROJECT TYPE $M
Transit Improvements - Non Capital $4,220
Roadway Improvements (including maintenance) $2,914
Transit Capital Projects $876
Bicycle and Pedestrian Facilities $846
Highway Improvements $785
Multimodal Streetscape Improvements $162
Intersection Improvements $123
ITS & New Technologies $80
Emission Reduction Technologies $6
Travel Demand Management $3
Total needs $10,015
SUMMARY OF CTP PROJECTS
Bicycle & Pedestrian Facilities 8%
Highway Improvements
8%Roadway Improvements
including maintenance
29%
Transit Capital
Projects9%
Transit Improvements -Non Capital
42%
Multimodal Streetscape Improvements 2%
Tech & TDM 1%
Intersection Improvements 1%
All project details are online at: https://scta.ca.gov/planning/comprehensive-transportation-plan/#projects

12Moving Forward 2050
Sonoma County Today
Travel Behavior
Sonoma County in 2050
Our Community2

13Moving Forward 2050
SONOMA COUNTY TODAY AND IN 205013
Ethnicity 2010 - 2050
100%
90% Latino
80%Multirace
70%
Pacific60% Islander
50% Asian
40% NativeAmerican30%
Black20%
10% White
0%2020 2050
Aging Population 2010 - 2050
31%14% 21% 28% 30%
54%50%
48% 48% 48%
10% 10% 9% 8% 8%22% 19% 15% 14% 14%
2010 2020 2030 2040 205017 and under College Age (18-24)
Working Age (25-64) Seniors (65+)
Source: CA Dept. of Finance

700,000
600,000
500,000
400,000
300,000
200,000
100,000
0
Moving Forward 2050
Population2019 Development
Occupied Pipeline
Housing UnitsLocal Plans Maxed
EmploymentPBA 2050
14
PROJECTED POPULATION, HOUSING, AND EMPLOYMENT GROWTH

15Moving Forward 2050
SHARE OF INCOME SPENT ON HOUSING AND TRANSPORTATION
34%42%
24
Housing
Remaining Income
Transportation
2017 Sonoma County
32%
17%
51%
Housing
Transportation
Remaining Income
2017 Bay Area
Source – The Center for Neighborhood Technology, H + T Index, 2017
24%

16Moving Forward 2050
• Text here.
TRIPS ORIGINS AND DESTINATIONS - WEEKDAYS
Travel Behavior Study https://scta.ca.gov/wp-content/uploads/2020/02/Sonoma_TBS_2-7-2020_web.pdf

17Moving Forward 2050
re.
60% OF TRIPS ARE SHORTER THAN 5 M•ILESText he
TRAVEL CHARACTERISTICS
TRIPS THAT CROSS THE COUNTY LINE ACCOUNT FOR ONLY 10% OF DAILY TRIPS BUT GENERATE 45% OF
DAILY VMT
Travel into or out of Sonoma County Internal Sonoma County Travel
55%
90%
45%
10%
TRIPS VMT

18Moving Forward 2050
OPPORTUNITIES & CHALLENGES
OPPORTUNITIES
60% of trips under 5 miles Shift to non-motorized or other non-auto modes
Almost 90% of trips stay in the county Continue to develop job centers in-county and connect them to appropriate housing
Continued focus on city-centered growth Improved accessibility and safety and efficiency of walking, biking, transit, and other emerging travel modes
Telecommuting and avoiding trips has shown to reduce VMT or shift travel to less congested time periods
CHALLENGES
Emergencies impact travel conditions and patterns.
Travel in the county continues to be focused on single occupant vehicle travel.
Even though most travel stays in the county, trips leaving or entering the county contribute 45% of VMT.

19Moving Forward 2050
Existing conditionsProjects and visionTrends and innovation
TransportationSystem

20Moving Forward 2050
ROADS AND HIGHWAYS2,600 miles of public roadway countywide
$2B over the next 3 years to maintain a state of good repair on all roads in Sonoma County
1,648,000 trips are taken in or through Sonoma County on an average weekday
89 percent of trips are intra-county
Largest trip generators in Sonoma County:
1. Rohnert Park West Side Commercial
2. Downtown Santa Rosa and Plaza Mall
3. City of Sonoma
4. Santa Rosa Airway Industrial Area
5. Rohnert Park Expressway Commercial

21Moving Forward 2050
ROAD AND HIGHWAY PROJECTS
Project Type Cost in $MRoadway Improvements (including maintenance)* $2,914
Highway Improvements $835
Multimodal Streetscape Improvements $162
Intersection Improvements $124
Total ($M) $4,035 *Maintenance accounts for $2B of Roadway improvements
Highway 37 Protection & Enhancement Project1. Highway 37 Improvements and Sea Level Rise
Mitigation Environmental Only ($10 M)2. Interim Segment B Project at Current Elevation
($149 M; 2023-2025)3. Near-Term Operational Improvements: SR 121
intersection reconfiguration & eastbound lane drop extension.

22Moving Forward 2050
Intelligent Transportation Systems can improve safety and efficiency through mechanisms ranging from optimizing operations through signal timing to automated driving systems
The introduction and adoption of autonomous vehicles is expected to be gradual due to the complexity of cost of these new systems
Any congestion reduction from autonomous vehicles may also require dedicated lanes that allow for platooning or the early retirement of non-autonomous vehicles
Land use, transit, parking, curb management, pricing, electric vehicle policies and planning are necessary to avoid increased VMT and GHG from AVs
TRENDS AND INNOVATION
Jaguar MENA

23Moving Forward 2050
BICYCLE AND PEDESTRIAN INFRASTRUCTURE
8% of all trips in Sonoma County are taken bicycle or walking
4.1% of commute to work trips bicycle or walking
60% of trips in Sonoma County are 5-miles or shorter
30% percent are less than 2-miles (12- minute bike ride)
208 built miles of bikeways
1,013 planned miles of new bicycle and pedestrian facilities

24Moving Forward 2050
Bicycle and Pedestrian
Projects
*All projects under $1M are combined into one project for each jurisdiction.
BICYCLE AND PEDESTRIAN PROJECTS
BICYCLE AND PEDESTRIAN $M
Implementation of all 111 projects* $859.91
Example projects
Countywide Expansion of Micromobility $90
SMART Pathway $40
North Santa Rosa Station Area Bike/Ped Connector over Hwy 101 $24
Southeast Greenway Multi-Use Path and Crossings $20
Hwy 1 – 34 miles of class 2 bike lanes along the Sonoma coastline $18
Hwy 128 – 24 miles of class 2 bike lanes from Napa to Mendocino $18

25Moving Forward 2050
Class I282.4
Class II/IIB432.3
Class III/IIIB261.7
Class IV2.2
Class I Class II/IIB Class III/IIIB Class IV
PLANNED MILES OF BIKE FACILITIES BY CLASSClass IV*
Class III Boulevard*
Class III**
Class II
Class I
Class II Buffered*
*National Association of City Transportation Officials, Urban Bikeway Design Guide**Los Angeles County, Model Design Manual for Living Streets

26Moving Forward 2050
The pandemic provoked a “bike boom” and slow streets movement
20% increase in bicycling
1 in 10 American adults rode a bike for the first time in a year (or longer)
145% increase in electric bicycle sales
65% increase in pedal bicycle sales
Cities temporarily closed streets to traffic or encroached on parking areas to allow space for physical distancing, recreation, and open-air dining
Demonstration bicycle and pedestrian projects were installed as demand increased and lower traffic provided opportunities to dedicate space for bicyclists and pedestrians
TRENDS AND INNOVATION
LADOT Bike Blog, Cycletrack at CicLAvia: The Valley

27Moving Forward 2050
Over 4.4 million rides on public transit in Sonoma County
84 percent by bus
16 percent by rail
70 percent of bus transit riders and 26 percent of train riders in Sonoma County are very low-income
Large percentage of riders do not have access to a vehicle
High school and college students make up a significant portion of transit riders
PUBLIC TRANSIT SERVICES

28Moving Forward 2050
Transit Projects
TRANSIT PROJECTS
TRANSIT $M
Transit Improvements Non-Capital –includes operating costs for serviceenhancement, first/last miles operations, fare free programs, paratransit operations and more.
$4,220
Transit Capital Projects – new buses, bus stops and shelters, SMART operations to Cloverdale, facilities and maintenance
$876
ITS & New Technologies – traffic signal technology, fare payment tech and marketing
$80
Total ($M) $5,176

29Moving Forward 2050
TRENDS AND INNOVATION
Micro-transit – dynamic trip routing based on demand may increase efficiencies in lower ridership areas
Trip planning and fare payment apps –improvements to apps and integration if single app for multiple providers and fare payments can make transit more convenient and comfortable for users
Transit priority projects – queue jump lanes, bus only lanes, high-occupancy vehicle lanes, transit signal priority, etc. allow transit vehicles to bypass traffic congestion and reduce travel times
Automation – could reduce costs of operations

30Moving Forward 2050
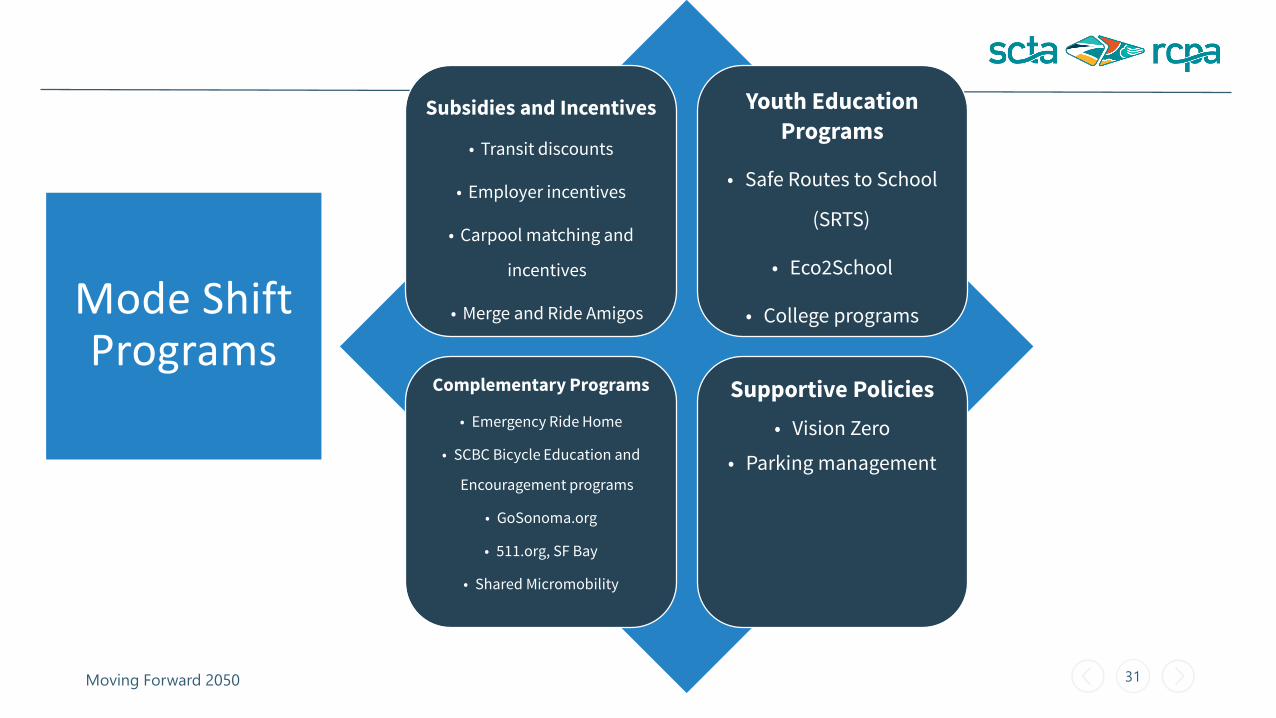
Mode shift Programs are a collection of methods and actions intended to improve the efficiency of the existing transportation system by reducing the demand for single occupancy vehicle travel, especially during congested peak commute hours
MODE SHIFT Projects $M
GreenTRIP Sonoma County $0.50
Transportation Management Association $40
Total ($M) $40.50
MODE SHIFT PROGRAMS AND PROJECTS
31Moving Forward 2050
Subsidies and Incentives
• Transit discounts
• Employer incentives
• Carpool matching and
incentives
• Merge and Ride Amigos
Youth Education Programs
• Safe Routes to School
(SRTS)
• Eco2School
• College programs
Complementary Programs
• Emergency Ride Home
• SCBC Bicycle Education and
Encouragement programs
• GoSonoma.org
• 511.org, SF Bay
• Shared Micromobility
Supportive Policies• Vision Zero
• Parking management
Mode Shift Programs

32Moving Forward 2050
Performance
Reaching Our Goals
Moving Forward

33Moving Forward 2050
What are current conditions?
How will CTP projects move us towards
achieving the plan goals and objectives?
What else can be done to make progress towards achieving CTP goals?
MEETING OUR GOALS

34Moving Forward 2050
PERFORMANCE MEASURES FOR 2050 GOALS
Performance Measure Connected & Reliable
Safe and Well-
Maintained
Community Oriented and Place-
BasedZero Emissions
System Condition and SafetyPavement Condition Index xTransit Vehicle Revenue Hours x xCollision Rates xTravel EfficiencyPerson Hours of Delay xPeak Period Travel Time xTravel Time x xTransit Use and Active TransportationMode Share (Non-motorized) x xBicycle Facilities - Miles x x xTransit Revenue Hours x xTransit Ridership/Capita x xEquity and the EnvironmentAverage Household Travel Costs xGHG Emissions xVMT x xVMT/capita x xVMT/job x x

35Moving Forward 2050
PERFORMANCE RESULTS
• Transit vehicle revenue hours (transit availability) increase from 760 hours to 1,365 hours.
• Transit ridership increases from 16,000 riders/day to 21,000 riders/day.• Transit ridership/capita increases from 11.75 rides/year to 12.25
rides/year
Improved transit service
coverage and transit
ridership
• Bicycle/pedestrian facility mileage planned to increase from 208 miles to 1,066 miles.
Expanded bicycle and
pedestrian system and
connectivity
• Average travel time predicted to decrease from 14.43 minutes per trip to 14.01 minutes per trip. Average travel time for work trips predicted to decrease from 22.13 minutes per trip to 21.27 minutes per trip.
• Average trip length predicted to decrease from 8.12 miles per trip to 7.84 per trip. Average trip length for work trips predicted to decrease from 13.83 miles per trip to 13.28 miles per trip
Shorter travel times and trips,
or better access to employment
and destinations

36Moving Forward 2050
Average percentage of household income spent on transportation predicted to decrease from 22.1% to 21.6%
Lower household travel costs
• VMT/capita predicted to decrease from 28.69 to 27.65
• Total GHG emissions (CO2E annual tons/year) predicted to decrease from
2,600,000 to 1,750,000.
• GHG/capita predicted to decrease from 5.27 to 2.85
VMT and GHG emissions trend downward on a per
capita basis
PERFORMANCE RESULTS CONTINUED

37Moving Forward 2050
Local safety
improvements
Improved experience
for transit riders
Increased
neighborhood mobility
Better environment for
pedestrians and
bicyclists
Enhancements to
existing infrastructureADA improvements
Local Operational
Improvements
BENEFITS NOT MEASURED IN PERFORMANCE ASSESSMENT

38Moving Forward 2050
REMAINING CHALLENGES
• The percentage of trips made using non-auto modes (8.5% of all trips) is predicted to stay the same in the future.
Continued reliance on automobiles
• Daily hours lost due to congestion expected to increase by roughly 1/3 in the future.• Hours lost due to congestion for each person each month is predicted to increase from 1.4
hours to 1.7 hours.
Increased traffic congestion and delay
• Countywide pavement condition in the “at risk” category• Historic budget shortfalls for transit• Many CTP projects are currently unfunded
Significant maintenance needs and funding shortfalls
• Daily crashes expected to increase from 6.4 to 7.6 in the absence of specific safety measures and policies. The countywide Vision Zero project and many other local projects are specifically intended to improve safety in Sonoma County.
No countywide reduction in collision rates

39Moving Forward 2050
HOW TO ACHIEVE CTP VISION AND GOALS

40Moving Forward 2050
SUPPORTING PLANNING EFFORTS

41Moving Forward 2050
SHIFT SONOMA COUNTY
• GOALS• Reduce VMT• Shift single occupant vehicle trips to
biking or walking• Increase transit ridership• Reduce average household travel
costs• STRATEGIES
• Transportation demand management / trip reductions
• Bike share• Car share
Mode Shift
• GOALS• Reduce countywide petroleum use
by 50%• 100,000 EVs by 2030• 11,000 charging stations by 2030• Increase access to clean
transportation for low income households
• Electrify municipal fleets• STRATEGIES
• Increased EV adoption• Expanded EV charging
infrastructure
Fuel Shift

42Moving Forward 2050
SONOMA COUNTY CLIMATE MOBILIZATION STRATEGY
• Build a network that makes it safe to bike and walk.• Implement Vision Zero Action Plan to make walking and biking safer.• Develop a “next generation” transit system for Sonoma County.• Implement the SCTA Comprehensive Transportation Plan.
Drive Less Sonoma County
Campaign
• Develop over 10,000 public and workplace charging stations in Sonoma County.• Address barriers for installing charging equipment and limiting fossil fuel
infrastructure.• Support the use of electric bicycles and other lightweight electric utility vehicles.• Increase the use of heavy-duty EVs through infrastructure planning and
incentives.• Create an accessible and affordable EV assistance service.
EV Access for All Partnership
• Develop a VMT mitigation banking structure for new development to fund transportation demand management (TDM) and VMT reducing projects and programs
Vehicle Miles Traveled Mitigation Bank

43Moving Forward 2050
TRANSPORTATION FUNDING NEED
$10 billion needfor 25 years
$2.1 billion in road maintenance$5 billion for transit

44Moving Forward 2050
Task Name June July August September
Advisory Committee Presentations
Draft CTP Presentation to SCTA/RCPA Board
Public Comment
Board Approval
SCHEDULE OF NEXT STEPS

45Moving Forward 2050
SCTA.CA.GOV/2050Moving Forward 2050 Plan
QUESTIONS?
THANK YOU