mount auburn hospital / maps / macipa one is journey to an integrated database october 2014 1
TRANSCRIPT

Mount Auburn Hospital / MAPS / MACIPAOne IS
Journey to an Integrated Database
October 2014
1

2
Journey to an Integrated Database Phase I –Assessment FY13-15
Assessment of various information systems: Surveys, Demos, System Reviews
Market Assessment Total Cost of Ownership Scope of Project Evaluate options for financing Approvals
Phase II Planning and Preparation FY 14-15 Phase III Implementation FY 16-17 Phase IV Optimization FY 17-
2

3
Journey to an Integrated Database Phase I –Assessment FY13-15 Phase II Planning and Preparation FY 14-15
Contracts for software (Epic and 3rd party) Determine hosting Determine staffing needs Determine legacy system strategy 3rd Party Application implementation Determine data conversion/archiving strategy Begin hiring/training
Phase III Implementation FY 16-17 Phase IV Optimization FY 17-
2

4
Journey to an Integrated Database Phase I –Assessment FY13-15 Phase II Planning and Preparation FY 14-15 Phase III Implementation FY 16-17
Data conversion, archiving “Big bang” go-live Implement practices in several waves Legacy Strategy
Phase IV Optimization FY 17-
2

IS Assessment Process
Press Ganey – 2011 CMIO Hire – Feb 2013 User Survey – March 2013 RFP – May-July 2013 Demo Evaluations – August 2013 One IS Summit – September 2013 Epic Visits – November 2013 TCO Development – September –
December 2013 ROI Development – February 2014 Private Practice Assessment – July
– September 2014 End-to-end Functional Assessment
– July – September 2014
3

IS Assessment
Multiple systems, multiple instances, multiple data sources Currently 130 software applications in MAH 50+ instances of eCW
3

IS Assessment

IS Assessment
Strong Dissatisfaction with current systems
Strong Desire to share records more efficiently
Many systems need immediate replacement
3

IS Assessment
Strong desire for integration
Strong willingness to switch to a new platform
3

IS Assessment
Epic Clear winner in RFPs in every category
3

IS Assessment Fragmented Network Complex IS Service
Delivery System Multiple Helpdesk Communication challenges
Limited training Desire for more physician
involvement Excitement for a new IS
system
3
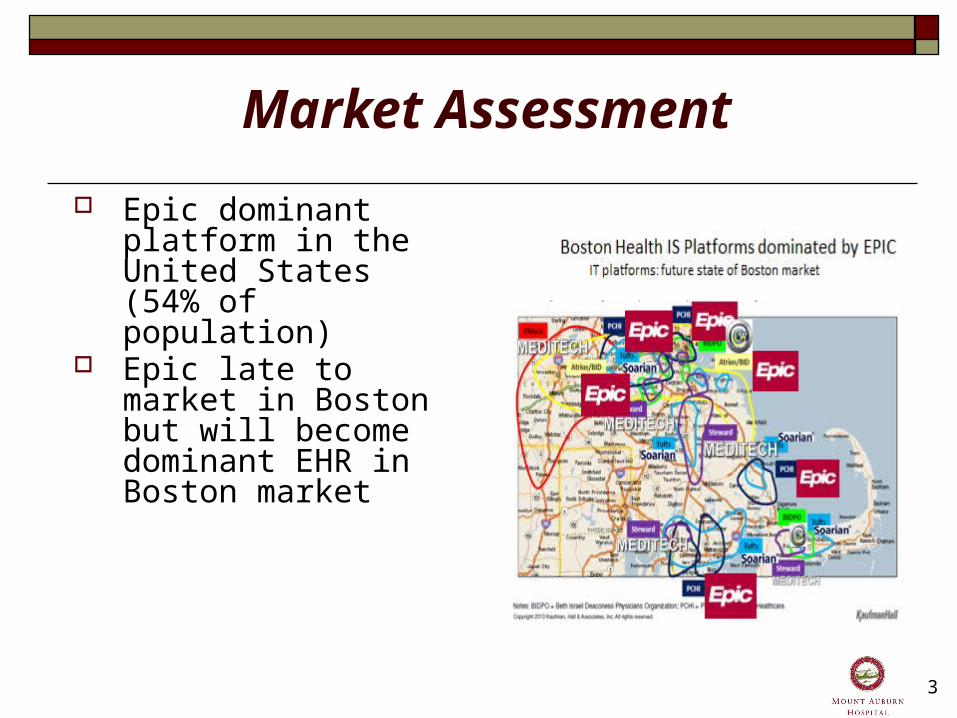
Market Assessment
Epic dominant platform in the United States (54% of population)
Epic late to market in Boston but will become dominant EHR in Boston market
3

Market Assessment
Epic interoperability capabilities has become standard of health information interchange Care Elsewhere -
Information can come from a non-Epic EMR that complies with industry standards, or directly from the patient.
Care Epic - Epic system is on both sides of the exchange, a richer data set is exchanged and additional connectivity options, such as cross-organization referral management, are available.
3

Physician referrals to MAH
MACIPA, Atrius, CHA, etc.

276,500 EHR physicians158M-188M patients,
50% to 59%
54% of the U.S. population 173M people will be cared for by EpicCare
RED > 40% of patients are
or willbe covered by
EpicCare
PINK 1-40% of patients are
or willbe covered by
EpicCare
GREYNon-Clinical Customers

TCO Modeling
Examining true IT costs of combined costs at MAH, MACIPA, Caregroup and non-IT departments
Software licensing, hardware, labor, etc. Includes back-end replacement and 3rd party software associated with
Epic, legacy costs EVERY department analyzed 5 year modeling Does not account for possible discounts from negotiating Does not include potential revenue and expense improvements Examined:
Status Quo: Meditech 5.66 + eCW v9 Meditech 6.1 eCW v10 Epic (hosted by self) Epic (hosted by Epic) Epic (hosted by 3rd party)
3

5 Year CostScenario 1:Status Quo
(MEDITECH Magic +
eCW + Athena)
Scenario 2:MEDITECH 6.x +
eCW.v10
Scenario 3a:Epic
(on-premise)
Scenario 3b:Epic
(partner-hosted)
Scenario 3c:Epic
(vendor-hosted)
Total Capital Expenses $6,377,978.65 $39,396,731.49 $63,080,705.22 $69,361,254.12 $61,151,382.62
Total Operating Expenses $62,266,165.72 $74,294,253.95 $65,584,337.49 $64,794,816.29 $70,697,311.29
TOTAL $68,644,144.37 $113,690,985.44 $128,665,042.71 $134,156,070.41 $131,848,693.91
15% Contingency $78,940,766.03 $130,744,633.26 $147,964,799.11 $154,279,480.97 $151,625,997.99
Back-end Financials $0.00 $0.00 $9,195,222.07 $9,195,222.07 $9,195,222.07
Legacy System Support & Sunsetting $0.00 $25,433,439.28 $25,433,439.28 $25,433,439.28 $25,433,439.28
GRAND TOTAL $78,940,766.03 $156,178,072.54 $182,593,460.46 $188,908,142.32 $186,254,659.34

TCO Findings
Continuing current state non-sustainable—high degree of dissatisfaction with current systems, does not meet future needs for population management, quality, reporting, coordination of care
Costs to maintain status quo with no improvements is expensive ($80M) Costs to upgrade to Meditech 6.1 are very expensive and new platform
brings risks Costs to implement Epic similar to Meditech but will be implementing
top rated product ROI not included in TCO modeling
3

Why Epic? Alignment with business
strategy/improve communications Within MAH/MACIPA With other providers
Atrius (22% of volume) CHA Lahey Partners
Best strategic product for MAH/MACIPA needs
RFP/demo winner Best product by KLAS ratings Superior Performance/Quality
reporting
Superior Patient Engagement (Patient portal)
Integrated Data for business/clinical intelligence and data mining
Standardize workflows Superior Clinical Decision Support Superior Population Management
Capabilities Improve Efficiencies Platform for Performance/Quality
Improvement Other expense/revenue
improvement

Questions?