morro bay national estuary program’s implementation ... · implementation effectiveness program ....
TRANSCRIPT

2012-2013 Sediment Report Final 1 10/16/2013
Morro Bay National Estuary Program’s
Implementation Effectiveness Program
For the Morro Bay Watershed
Sediment Monitoring Report
2013
Prepared for State Water Resources Control Board
1001 I St, 16th Floor Sacramento, CA 95814
Prepared by
Morro Bay National Estuary Program 601 Embarcadero, Suite 11
Morro Bay, CA 93442
October 16, 2013

2012-2013 Sediment Report Final 2 10/16/2013
Acknowledgements
The Morro Bay National Estuary Program would like to recognize and thank the following volunteers and partners who contributed their time and expertise to the successful implementation of this project. For their partnership and technical assistance in this effort: Debra Stakes, Physical Sciences, Cuesta College Kathy Jimison, Physical Sciences, Cuesta College Sylas Cranor and Kim Hubbs, San Luis Obispo County Flood Control and Water Conservation District Russ White, Department of Natural Resources, California Polytechnic State University Adrienne Greve, Department of City and Regional Planning, California Polytechnic State University Charles Burt, Irrigation Training and Research Center, California Polytechnic State University Mark Barnett, Natural Resources Conservation Service Annie Gillespie, Morro Bay National Estuary Program Anna Halligan, Morro Bay National Estuary Program And for their tireless, good-humored help in the field and the lab: Craig Jacobson Mike Weddige Kelly Church Alexander Remar Jacob Smith Dylan Theobald Erich Kast
This report should be cited as follows: Sanford, T. & Kitajima, A. Morro Bay National Estuary Program’s Implementation Effectiveness Program Suspended Sediment Monitoring Report 2013. Morro Bay National Estuary Program. Oct. 2013.

2012-2013 Sediment Report Final 3 10/16/2013
CONTENTS
Acknowledgements ................................................................................................................................................................ 2
Executive Summary ................................................................................................................................................................ 5
Introduction ............................................................................................................................................................................... 6
Project Background ................................................................................................................................................................ 7
TABLE 1: MORRO BAY SEDIMENT TMDL NUMERIC TARGETS ................................................................. 7
Suspended Sediment Monitoring Effort ......................................................................................................................... 8
Site Location ....................................................................................................................................................................... 10
FIGURE 1: MORRO BAY SUSPENDED SEDIMENT STUDY AREA .............................................................. 10
FIGURE 2: SAN LUISITO CREEK SUBWATERSHED MONITORING AREA ............................................. 11
FIGURE 3: SAN LUISITO CREEK STAGE AND FLOW RATE CORRELATION ......................................... 12
San Luisito Creek SSC Monitoring .............................................................................................................................. 13
December 22, 2010 Monitoring event ................................................................................................................ 13
FIGURE 4: 2010-2011 PEAK HYDROGRAPH .................................................................................................... 13
FIGURE 5: EVENT HYDROGRAPH AND RAINFALL RATE ........................................................................... 14
FIGURE 6: EVENT SSC AND DISCHARGE REGRESSION ............................................................................... 15
TABLE 2: EVENT SAMPLING ................................................................................................................................... 15
FIGURE 7: EVENT HYDROGRAPH AND SSC VALUES .................................................................................... 16
FIGURE 8: TURBIDITY AND DISCHARGE REGRESSION ............................................................................... 16
FIGURE 9: SEDIMENT LOAD AND HYDROGRAPH ......................................................................................... 17
TABLE 3: EVENT DATA SUMMARY ...................................................................................................................... 17
February 18 – 20, 2011 Monitoring event......................................................................................................... 18
FIGURE 10: HYDROGRAPH AND RAINFALL RATE ........................................................................................ 18
FIGURE 11: SSC AND DISCHARGE REGRESSION ............................................................................................ 19
TABLE 4: EVENT SAMPLING ................................................................................................................................... 19
FIGURE 12: EVENT HYDROGRAPH AND SSC VALUES.................................................................................. 20
FIGURE 13: TURBIDITY AND DISCHARGE REGRESSION ............................................................................ 20
FIGURE 14: SEDIMENT LOAD AND HYDROGRAPH ....................................................................................... 21
TABLE 4: EVENT DATA SUMMARY ...................................................................................................................... 21
San Luisito Creek SSC Analysis ............................................................................................................................... 22
FIGURE 15: TURBIDITY AND SSC CORRELATION ......................................................................................... 22
San Luisito Creek SSC Analysis Conclusions ..................................................................................................... 22
SSC Quality Assurance Measures ........................................................................................................................... 23

2012-2013 Sediment Report Final 4 10/16/2013
TABLE 5: ESTUARY PROGRAM RESULTS FOR SLQA PROGRAM, FALL 2012 AND SPRING 2013 ............................................................................................................................................................................................. 23
Streambed Sediment Impairment Indicators ............................................................................................................ 24
TABLE 6: SEDIMENT AND BIOLOGICAL INDICATOR CRITERIA.............................................................. 26
FIGURE 16: BIOASSESSMENT SITE MAP ........................................................................................................... 27
TABLE 7: MORRO BAY SEDIMENT IMPAIRMENT INDICATOR METRICS ............................................ 28
Streambed Sediment Impairment Indicators Analysis ..................................................................................... 29
USGS Estuary Sediment Accretion Rate Study .......................................................................................................... 29
References ................................................................................................................................................................................ 30
Appendex A: USGS SLQA Results..................................................................................................................................... 31

2012-2013 Sediment Report Final 5 10/16/2013
EXECUTIVE SUMMARY
In 1998, Chorro Creek, Los Osos Creek and the Morro Bay estuary were determined to be impaired by accelerated sedimentation. Through Section 303(d) of the Clean Water Act, a Total Maximum Daily Load (TMDL) was developed by the Central Coast Regional Water Quality Control Board (Water Board) and was formally adopted in 2003. The Morro Bay National Estuary Program (Estuary Program) has been a lead partner in monitoring and implementation efforts to reduce erosion in the watershed and prevent excessive sedimentation of Morro Bay. The Morro Bay Sediment Loading Study, completed by Tetra Tech in 1998, has served as the framework for the TMDL and the resulting implementation and monitoring efforts of the Estuary Program. The Tetra Tech report estimated that the Morro Bay watershed delivers an average of approximately 70,000 tons per year of sediment into the Morro Bay estuary and that the Chorro Creek sub-watershed contributes 86 percent of the total sediment delivered to Morro Bay, approximately 60,689 tons. Since the approval of the TMDL, numerous monitoring efforts have better characterized sediment transport dynamics, accumulation rates, and impairment severities throughout the watershed and estuary. As the majority of the sediment load is attributed to storm event loads from the Chorro Creek subwatershed, implementation and monitoring efforts have been focused predominately in that subwatershed.
Ambient (dry weather or baseflow) water quality conditions throughout the Los Osos and Chorro subwatersheds indicate only rare exceedances of turbidity thresholds of concern. A large dataset dating back to 2002 strengthens the assertion that the majority of sediment transport and elevated turbidity occurs during large runoff events and that ambient water quality conditions do not reflect chronic impairment by sediment.
A suite of new criteria have recently been developed for determining physical sediment impairment, and initial analysis shows that the indicators are applicable in Central Coast streams. Seven physical streambed indicators and six biological indicators were compared against data collected from five monitoring sites in the Morro Bay watershed in 2008, 2010 and 2012. The data indicate only moderate impairment at three sites and no impairment at two sites.
In 2004, surface elevation tables (SETs) were installed throughout the Morro Bay salt marsh and mudflats to measure sediment accretion rates. While these sites have not been re-monitored since 2010, a similar effort is underway by the United States Geological Survey (USGS) to study impacts of sea level rise on marshes. Data was collected by USGS in the spring of 2013, and a report of findings is pending.
In 2007, the Estuary Program incorporated additional storm event monitoring to quantify suspended sediment loads at three stations in the Chorro Creek watershed. Through the use of stage gauges and automated samplers, sediment concentrations and flows were measured. Due to lack of precipitation, suspended sediment monitoring did not take place in the 2011 to 2012 and 2012 to 2013 water years. Thus, for this report, sediment analysis focused on data from San Luisito Creek during two storm events in December 2010 and February 2011. Data from these two storms had not been analyzed previously due to lack of resources. In the portions of these two storms that were monitored, a total of 125.1 acre-feet of water was discharged, and the estimated sediment load was 95.3 short tons. While this information does not allow for estimation of the total sediment loading for the year, the compiled data in combination with modeling allows for this analysis and is expected to be undertaken in the future as additional data becomes available.

2012-2013 Sediment Report Final 6 10/16/2013
Similar modeling conducted for Chorro Creek from 2008 through 2011 indicates that there is tremendous variability in annual loads, owing largely to a high degree of variability in peak flows and the duration of elevated discharge from storm events. Analysis of three water years with variable rainfall totals illustrated that significant resolution may be lost by averaging annual sediment loads across several years. In the 2008 to 2009 water year, which was a year with a lower than average rainfall total, 20,220 acre-feet of discharge on Chorro Creek transported a sediment load of 146 short tons. For comparison, for the 2010 to 2011 water year, a year with above average rainfall, a total discharge of 38,357 acre-feet was measured for the year on Chorro Creek with a corresponding sediment load of 136,043 short tons.
The work conducted to date in the Morro Bay watershed spanned years with a highly variable hydrologic record, illustrating the variability in annual sediment loads. This variability is important to consider in assessing progress towards achievement of the sediment TMDL.
While physical indicators of sedimentation do not currently indicate severe biological impairment across the watershed and estuary, further data collection is necessary to capture the potential for variability across a range of hydrologic conditions.
INTRODUCTION
The Central Coast Regional Water Quality Control Board adopted the Central Coast Basin Plan (Basin Plan) on March 14th, 1975. The Basin Plan included a broad array of water quality objectives, beneficial use designations, discharger implementation plans, and incorporated statewide plans and policies. Section 303(d) of the Clean Water Act requires that states create a list of water bodies that do not meet water quality objectives and establish load and waste load allocations. Total Maximum Daily Load (TMDL) documents detail the impairment of the listed water bodies and are incorporated into the Basin Plan upon approval. In California, this action is the responsibility of the Regional Water Quality Control Boards. In 1998, the Central Coast Regional Water Quality Control Board (Water Board) identified Chorro Creek, Los Osos Creek and the Morro Bay Estuary as impaired by sediment and listed the water bodies under Clean Water Act Section 303(d). The TMDL identified accelerated sedimentation due to anthropogenic disturbance as the primary cause for listing. Water Board documentation cited a 1998 Tetra Tech report that estimated the Chorro and Los Osos Creeks sub-watersheds deliver an average of approximately 70,000 tons per year of sediment into the Morro Bay estuary. The report indicated that the Chorro Creek watershed was estimated to contribute 86 percent of the total sediment delivered to Morro Bay, approximately 60,689 tons. The TMDL identified three numeric targets for monitoring and plans to track the progress of voluntary and required implementation actions. The Morro Bay National Estuary Program (Estuary Program) was identified as the lead monitoring and reporting agency. The Morro Bay Total Maximum Daily Load for Sediment (including Chorro Creek, Los Osos Creek and the Morro Bay Estuary) was formally adopted by the Environmental Protection Agency on December 3, 2003. This report details the monitoring of indicators adopted by the Estuary Program. The monitoring efforts and results are presented for the following indicators:
• Suspended Sediment Concentration on San Luisito Creek from the 2010 to 2011 water year

2012-2013 Sediment Report Final 7 10/16/2013
• Streambed Sediment Impairment Indicators • USGS Estuary Sediment Accretion Rate Study
PROJECT BACKGROUND
The TMDL established three numeric targets for the streams in the Morro Bay watershed: pool volume, median gravel size diameter (D50), and percent fines in substrate. The TMDL identified tidal prism volume as the primary numeric target for Morro Bay. The Three-Year Implementation Tracking Progress Report of the Morro Bay Sediment TMDL recommended reconsidering the numeric targets during future evaluations. The numeric targets are detailed in the TMDL table shown on the next page.
TABLE 1: MORRO BAY SEDIMENT TMDL NUMERIC TARGETS
Parameter Numeric Target Chorro and Los Osos Creeks and Tributaries Streambed Sediment
Residual Pool Volume v*= (a ratio) Mean values ≤ 0.21 (mean of at least 6 pools per sampling reach) Max values ≤ 0.45
Median Diameter (D50) of sediment Particles in Spawning Gravels
D50= Mean values ≥ 69 mm Minimum values ≥ 37 mm
Percent of Fine Fines (< 0.85 mm) in Spawning Gravels Percent fine fines ≤ 21%
Percent of Course Fines (all fines < 6.0 mm) in Spawning Gravels Percent course fine ≤ 30%
Morro Bay Estuary Tidal Prism Volume 4,200 acre-ft
In 2007, the Estuary Program launched an expanded monitoring effort to generate detailed measurements of suspended sediment and turbidity in the Chorro Creek watershed. While suspended sediment concentration (SSC) is not required in the Morro Bay Sediment TMDL, many of the TMDLs adopted more recently include this type of monitoring, and it is one of the most effective ways to quantify instantaneous sediment loading. The findings can be used to characterize instantaneous and storm event suspended sediment loads and potentially assess the effectiveness of best management practices (BMPs) implemented throughout the Morro Bay watershed. Additionally, the Estuary Program’s expanded effort investigated the relationship between turbidity and SSC at each monitoring site.
The relationships developed by this project may enable the monitoring of turbidity as a surrogate for SSC under certain conditions. Multiple studies have analyzed the accuracy of measuring turbidity as a surrogate for monitoring total suspended solids (TSS) or SSC. Turbidity monitoring is significantly faster and less expensive than monitoring SSC or TSS. Although turbidity data has generally proven to be more accurate than other surrogate measures such as discharge, there are

2012-2013 Sediment Report Final 8 10/16/2013
limitations to its usefulness in quantifying suspended sediment load in surface waters (Ankcorn, 2003). Typically at the conclusion of each rain year, the SSC, turbidity, stage height and rainfall data are gathered and analyzed to determine the suspended sediment load for the year. Due to lack of precipitation, suspended sediment monitoring did not take place in the 2011to 2012 and 2012 to 2013 water years. Thus, for this report, SSC analysis focused on data from San Luisito Creek during two storm events that took place on December 2010 and February 2011. Data from these storms had not been analyzed previously due to lack of resources. For information on the suspended sediment monitoring efforts that took place on Chorro Creek and Walters Creek during the 2010 to 2011 water year, please refer to the 2011 Morro Bay Sediment Loading Update.
SUSPENDED SEDIMENT MONITORING EFFORT
Event SSC monitoring required the deployment of automated sampling equipment programmed to collect water samples on an even-timed interval during storm events. The Estuary Program utilized ISCO 6712 automated samplers housed in shelters at each monitoring site. Samples were drawn into ½-inch diameter polyvinyl tubing, sheltered by 1-inch electrical conduit and a 4-inch perforated PVC intake guard at the intake end. All samples were drawn from a fixed intake location near the low flow centroid of the channel. Due to budget and equipment constraints, equal width increment sampling and depth distributed sampling were not feasible. The representativeness of these fixed intake locations remains unverified.
Samplers were programmed manually by staff members and were not automatically activated by specified event conditions. Each sampler contained a set of 24 bottles that was manually retrieved and replaced at the conclusion of each sampling program. Sampling regimes varied by storm event and among field sites due to rapidly changing site conditions. In most cases, samples were collected at either 30 or 60-minute intervals.
Samples were retrieved from the field and processed at the Estuary Program’s Morro Bay Water Science Lab (MBWSL) located at Cuesta College. Due to the limitations associated with sample analysis by an outside laboratory, the Estuary Program established its own laboratory facility in 2007 through a cooperative agreement with Cuesta College. The school donated space in their newly-renovated physical sciences building to establish the Morro Bay Water Sciences Lab under the guidance of the Estuary Program. The MBWSL opened in January 2008 and is operated by the Estuary Program’s Monitoring Program.
The MBWSL conducts analysis for SSC according to ASTM method 3977 D. This method calls for the analysis of the entire sample rather than an aliquot of a specified volume as allowed when monitoring for TSS. USGS conducted extensive studies comparing the differences between TSS and SSC laboratory methods and found that the TSS methodology consistently under-sampled the sediment concentration in surface waters (Gray, Glysson et al., 2000). The results from the two methods can differ significantly when the sample is comprised of a significant fraction of sand-sized particles.
Samples were weighed upon arrival at the lab, labeled and then stored in a refrigerator until analysis. There is no specified hold time for SSC, however most samples were analyzed within 60 days of collection. Samples were vacuum filtered through tared glass fiber filters (47 mm, Whatman

2012-2013 Sediment Report Final 9 10/16/2013
934-AH) on a six position vacuum manifold and placed into a convection oven for drying. Samples with turbidity in excess of 500 NTU or with noticeable sand or sediment accumulation were partially filtered and then dehydrated in tared glass crucibles. When fully dried, sample filters and crucibles were removed from the oven and stored in dessicators until they were sufficiently cool for final weighing, yielding a sediment concentration value of mg/L for each sample.
Turbidity data was collected in the laboratory using a HACH 2100AN turbidimeter compliant with USEPA Method 180.1. Samples were mixed, decanted to sample cells and returned to sample bottles following measurement. Measurements were taken with the multidetector ratio mode activated and with signal averaging to minimize noise.
The MBWSL is a volunteer participant in the USGS Sediment Lab Quality Assurance (SLQA) program, which supplies single-blind quality assurance samples to participating laboratories twice a year. The MBWSL receives nine samples of an unknown concentration, conducts SSC analysis and submits results electronically to the SLQA program. The program successfully participated in six years of biannial SLQA testing with the USGS. These quality assurance activities assess accuracy and precision of laboratory processes. See the report section titled “SSC Quality Assurance Measures” as well as Appendix A for 2012 to 2013 SLQA results.
The MBWSL conducts ongoing accuracy checks of equipment and procedures throughout the year. Balances are routinely checked with calibration weights and re-calibrated annually by a certified technician. The MBWSL operating procedures, protocols, and quality assurance measures are documented in detail as part of the Estuary Program’s Quality Assurance Project Plan which is updated annually and undergoes review by the Environmental Protection Agency and Water Board. The MBWSL is a ‘paperless’ lab, and all incoming sample information and analytical results are recorded in an Access database. The database was designed specifically for operations at the MBWSL. The Access database is queried and printed out quarterly for off-site storage to prevent electronic data loss. Accurate discharge data is critical in order to determine storm event suspended sediment loading estimates. In order to avoid ongoing labor-intensive discharge monitoring, stage-discharge relationships were developed for each site. Stage height (the height of the water surface) was correlated to the discharge (volume of water) to develop a rating curve. Discharge and stage data were collected over a wide range of conditions to develop the rating curve. Although discharge values had been periodically collected at the site on Chorro Creek at Canet Road (site code CAN) and San Luisito Creek (site code SLU) sites throughout the last ten years, most of the monitoring had taken place at base-flow wadeable conditions. While this data was important for characterizing dry season conditions, there remained a need for data collected during storm events when streams were no longer wadeable. Collecting discharge measurements during non-wadeable flows required specialized equipment and training. These limitations prevented the Estuary Program or SLO County FC&WCD staff from collecting data during these events. To obtain this crucial high-stage data, the Estuary Program contracted with the Irrigation Training and Research Center (ITRC) at Cal Poly. Engineering staff at ITRC conducted high stage discharge monitoring throughout the project. ITRC targeted flows greater than 50 cubic feet per second(cfs) at San Luisito Creek and flows greater than 200 cfs at Chorro Creek. Engineers utilized either a Marsh-McBirney Flo-Mate unit or a Sontek flow tracker mounted on the end of a specially designed stabilizing/measuring pole that was constructed for the project. The velocities at the San Luisito Creek site were especially high (greater

2012-2013 Sediment Report Final 10 10/16/2013
than 10 feet/second at 180 cfs) and required that equipment be modified to provide stable readings and positioning under those conditions.
At each site, velocity readings were taken at the 0.6 depth of flow point. Due to high velocities and turbulence, two measurements (at the 0.2 and 0.8 depths), were not feasible. Further, the hydrographs for these creeks were subject to rapid changes, mandating the need for fast measurement techniques. All measurements were completed by a two person field team. At the conclusion of the 2009 to 2010 water year, ITRC provided a final report that included a best-fit equation of flow rate versus upstream water depth for each site that incorporated the data that was collected throughout the previous three years.
SITE LOCATION
The Chorro Creek subwatershed drains runoff from approximately 43.4 square miles into Morro Bay and is estimated to contribute 86% of the total sediment load to Morro Bay (Tetra Tech, 1998). Three SSC monitoring sites in the Chorro Creek watershed were established that encompass a total watershed area of approximately 30 square miles. Monitoring sites are shown in Figure 1 below.
As mentioned previously, the SSC analysis in this report focuses on data from San Luisito Creek in the 2010 to 2011 water year.
FIGURE 1: MORRO BAY SUSPENDED SEDIMENT STUDY AREA

2012-2013 Sediment Report Final 11 10/16/2013
The site located on San Luisito Creek at Adobe Road (site code SLU) includes drainage from approximately 8.28 square miles dominated by rangeland with light residential use (Tetra Tech, 1998). San Luisito Creek is a major tributary to Chorro Creek and joins at a confluence downstream of the Canet Road station. The Adobe Road bridge over San Luisito Creek was constructed in 1951, and the gauging station was established by SLO County Engineering Department in 1985 (Station 775). The site is an active San Luis Obispo County gauging station and is equipped with an H-500 XL data logger and potentiometer. In 2007, ALERT capability (radio with antenna) was added to the site, providing real-time data acquisition via the existing County ALERT network. In 2007, the Estuary Program installed an ISCO 6712 automated sampler and an Esterline KPSI pressure transducer to facilitate SSC monitoring. A rain gauge was installed at the nearby CAN station. Due to site conditions and close proximity to the Canet Road station, an additional rain gauge was not installed at SLU. The site was fully operational starting at the 2007-2008 water year.
FIGURE 2: SAN LUISITO CREEK SUBWATERSHED MONITORING AREA
The design of the Adobe Road bridge crossing made the positioning of the sampler and sampling intake difficult. Sampling equipment was housed in a fiberglass shelter located on top of the bridge crossing. To instrument this configuration, the sampler intake line covered approximately 35 lateral feet with a 15 foot elevation gain. During low flows, San Luisito Creek flows through only one side of the double barrel bridge at a mean depth of about 0.02 feet. Positioning the intake along the center wall of the bridge would have prevented monitoring any events under approximately 7 cfs. Due to culvert sizing concerns and anadromous fish habitat regulations, construction of a flume or weir at the site was infeasible. After prolonged examination of all sampling intake options, a location was selected on the leading edge of one side of the concrete apron upstream of the crossing. This selection was made with acknowledgment of the risk of intake burial and the

2012-2013 Sediment Report Final 12 10/16/2013
possibility of bedload sampling during major storm events. Bedload is commonly defined as sediment that is transported by sliding, rolling or bouncing along the stream bed. Depending on the size of particles comprising the stream bed, the bedload may resist scour by stream velocities during higher frequency storm events (Edwards & Glysson, 1999). The development of a rating curve was conducted by ITRC engineers from 2007 to 2010. High volume discharge measurements were conducted during storm events in December 2007, January 2008 and January 2010. The San Luisito Creek measurements were collected from atop the Adobe Road bridge over the creek. The creek flows through a 25 foot wide rectangular concrete channel under the bridge with a center wall. The 25 feet were divided into ten slices horizontally, and velocities were measured at relative 0.6 depths (rather than both 0.2 and 0.8) in each slice to be able to capture flows before they changed. At high flows, velocities were measured at relative 0.6 depths upstream of the center of each culvert. The velocity reading at the center of the culvert was assumed to be the average velocity in the culvert. All measurements were taken with either a SonTek Flow Tracker or a Marsh McBirney Flo-Mate (depending upon the flow condition and availability of devices). During a storm event at San Luisito Creek, the flow rate, in cfs, can be approximated by the equation Q (cfs) = 50Y2 where Y is the depth of water (in feet, measured via stage height readings) minus channel bottom elevation (0.12 ft) above the reference datum. This equation was used to estimate discharge volumes during the storm events detailed in this report. The stage discharge relationship for San Luisito Creek is shown below in Figure 3.
FIGURE 3: SAN LUISITO CREEK STAGE AND FLOW RATE CORRELATION
0.0
100.0
200.0
300.0
400.0
500.0
600.0
0 0.5 1 1.5 2 2.5 3 3.5
Flow
Rat
e (c
fs)
Staff Gauge (feet)
San Luisito - Flow Rate (cfs) vs. Staff Gauge Height (ft)
2012-2013 Sediment Report Final 13 10/16/2013
SAN LUISITO CREEK SSC MONITORING
The SSC analysis in this report focuses on two storm events on San Luisito Creek during the 2010 to 2011 water year. Data from these storms had not been analyzed previously due to lack of resources. For information on the suspended sediment monitoring efforts that took place on Chorro Creek and Walters Creek during the 2010 to 2011 water year, please refer to the 2011 Morro Bay Sediment Loading Update.
DECEMBER 22, 2010 MONITORING EVENT
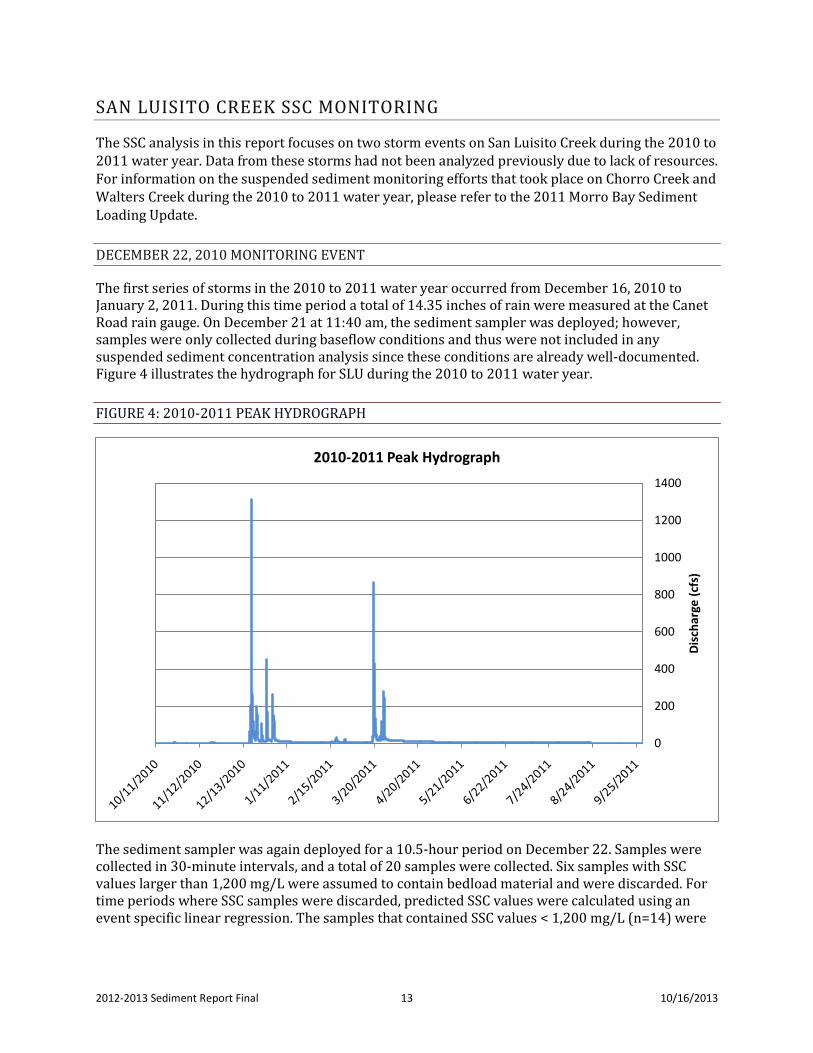
The first series of storms in the 2010 to 2011 water year occurred from December 16, 2010 to January 2, 2011. During this time period a total of 14.35 inches of rain were measured at the Canet Road rain gauge. On December 21 at 11:40 am, the sediment sampler was deployed; however, samples were only collected during baseflow conditions and thus were not included in any suspended sediment concentration analysis since these conditions are already well-documented. Figure 4 illustrates the hydrograph for SLU during the 2010 to 2011 water year.
FIGURE 4: 2010-2011 PEAK HYDROGRAPH
The sediment sampler was again deployed for a 10.5-hour period on December 22. Samples were collected in 30-minute intervals, and a total of 20 samples were collected. Six samples with SSC values larger than 1,200 mg/L were assumed to contain bedload material and were discarded. For time periods where SSC samples were discarded, predicted SSC values were calculated using an event specific linear regression. The samples that contained SSC values < 1,200 mg/L (n=14) were
0
200
400
600
800
1000
1200
1400
Disc
harg
e (c
fs)
2010-2011 Peak Hydrograph

2012-2013 Sediment Report Final 14 10/16/2013
regressed against discharge values for each time period to generate the equation: SSCpredicted =8.532x − 59.148. Predicted instantaneous discharge values were determined using the equation: 𝑄(𝑐𝑓𝑠) =50(𝑌 − 0.12)2 where Y is the staff gauge height. Values for staff gauge heights are requested from the San Luis Obispo County Department of Public Works. See Figure 3 for flow rate and gauge height relationship.
FIGURE 5: EVENT HYDROGRAPH AND RAINFALL RATE
Figure 5 illustrates the rainfall measured at the Canet Road rain gauge over 1-hour intervals and the discharge of San Luisito Creek during the storm event. Approximately 1.40 inches of rain was measured at the Canet Road rain gauge on December 22. No rainfall was observed during the SSC sampling period.
0.00
50.00
100.00
150.00
200.00
250.00
0
0.05
0.1
0.15
0.2
0.25
0.3
0.35
0:11 6:26 12:40 16:52 20:56
Disc
harg
e (c
fs)
Rain
fall
(in/h
r)
San Luisito Creek, December 22, 2010
rain (in/hr) Discharge

2012-2013 Sediment Report Final 15 10/16/2013
FIGURE 6: EVENT SSC AND DISCHARGE REGRESSION
The SSC and discharge correlation (shown in Figure 6) was utilized to generate estimated SSC values during time periods that were not monitored. A summary of n values for measured SSC samples and estimated SSC samples is shown in Table 2. The equation: SSCpredicted = 8.532x −59.148 was used to calculate predicted SSC values.
TABLE 2: EVENT SAMPLING
y = 8.532x - 59.148 R² = 0.7692
n=14
0.00
200.00
400.00
600.00
800.00
1000.00
0.00 20.00 40.00 60.00 80.00 100.00 120.00 140.00
SSC
(mg/
l)
Discharge (cfs)
SSC and Discharge Regression
SSC Samples Analyzed
SSC Samples Estimated Turbidity Samples
December 22, 2010 14 9 7 Totals 14 9 7

2012-2013 Sediment Report Final 16 10/16/2013
FIGURE 7: EVENT HYDROGRAPH AND SSC VALUES
Figure 7 illustrates discharge and measured/predicted SSC values.
FIGURE 8: TURBIDITY AND DISCHARGE REGRESSION
Figure 8 illustrates the turbidity and SSC correlation.
0.00
50.00
100.00
150.00
200.00
250.00
0
200
400
600
800
1000
1200
1400
1600
1800
4:48 7:12 9:36 12:00 14:24 16:48 19:12 21:36 0:00 2:24
Disc
harg
e (c
fs)
SSC
(mg/
L)
San Luisito Creek, December 22, 2010
Measured SSC Predicted SSC Discharge
y = 2.3692x - 131.57 R² = 0.9365
n=7
0.00
100.00
200.00
300.00
400.00
500.00
600.00
700.00
800.00
900.00
0.00 50.00 100.00 150.00 200.00 250.00 300.00 350.00 400.00
SSC
(mg/
L)
Turbidity (ntu)

2012-2013 Sediment Report Final 17 10/16/2013
FIGURE 9: SEDIMENT LOAD AND HYDROGRAPH
Figure 9 illustrates the sediment loading rate during the monitoring period and discharge.
TABLE 3: EVENT DATA SUMMARY
Rainfall (inches)
Total Estimated Discharge (acre-
feet) Estimated Sediment
Load (short tons) December 22, 2011 1.40 68.81 76.61
Totals 1.40 68.81 76.61 Data for 30-minute intervals was compiled and summed to generate daily discharge and suspended sediment load estimates. For each time interval, the stage height measurement was used to calculate the discharge at the beginning of the interval. The SSC value at the beginning of the interval was applied to the discharge volume to generate a value for suspended sediment load for that interval.
During the December 22 monitoring event, the total discharge was estimated to be 68.81 acre-feet. The total estimated sediment load was 76.61 short tons.
0.00
50.00
100.00
150.00
200.00
250.00
0:11 6:26 12:40 16:52 20:560
5
10
15
20
25
30
35
Disc
harg
e (c
fs)
Sedi
men
t (to
ns/h
r)
San Luisito Creek, December 22, 2010
sediment (tons/hr) Discharge

2012-2013 Sediment Report Final 18 10/16/2013
FEBRUARY 18 – 20, 2011 MONITORING EVENT
The second monitoring event occurred from February 18 to February 20, 2011. During this time period, a total of 43 samples were collected and processed for SSC. Samples were collected in 30-minute and 1-hour intervals. Every other sample was measured for turbidity, and no samples were observed to contain coarse particles; therefore, no samples were discarded due to impacts from bedload.
FIGURE 10: HYDROGRAPH AND RAINFALL RATE
Figure 10 illustrates the rainfall measured at the Canet Road rain gauge over 1-hour intervals and the discharge of San Luisito Creek during the storm event. Approximately 1.81 inches of rain was measured at the Canet Road rain gauge on February 18 and 19.
0.00
5.00
10.00
15.00
20.00
25.00
30.00
35.00
40.00
0.00
0.05
0.10
0.15
0.20
0.25
0:002/18/11
12:302/18/11
1:002/19/11
13:302/19/11
2:002/20/11
Disc
harg
e (ft
/sec
)
Rain
(in/
hr)
San Luisito Creek, Feburary 18 - 20, 2011
Rain (in)/hr. Discharge

2012-2013 Sediment Report Final 19 10/16/2013
FIGURE 11: SSC AND DISCHARGE REGRESSION
The SSC and discharge correlation (shown in Figure 11) was utilized to generate estimated SSC values during time periods that were not monitored. A summary of n values for measured SSC samples and estimated SSC samples is shown in Table 4. The equation: SSCpredicted = 20.26x −128.65 was used to calculate predicted SSC values.
TABLE 4: EVENT SAMPLING
SSC Samples Analyzed
SSC Samples Estimated Turbidity Samples
February 18, 2011 17 7 8 February 19, 2011 18 14 9 February 20, 2011 8 0 4
Totals 43 21 21 Table 4 illustrates all of the data collected and generated for San Luisito Creek during the February 2011 storm event.
y = 20.26x - 128.65 R² = 0.7972
n=43
0.000
100.000
200.000
300.000
400.000
500.000
600.000
0.00 5.00 10.00 15.00 20.00 25.00 30.00 35.00
SSC
(mg/
l)
Discharge (cfs)
SSC and Discharge Regression

2012-2013 Sediment Report Final 20 10/16/2013
FIGURE 12: EVENT HYDROGRAPH AND SSC VALUES
Figure 12 illustrates discharge and measured/predicted SSC values.
FIGURE 13: TURBIDITY AND DISCHARGE REGRESSION
0
100
200
300
400
500
600
4.00
9.00
14.00
19.00
24.00
29.00
34.00
39.00
12:002/18/11
0:302/19/11
13:002/19/11
1:302/20/11
SSC
(mg/
l)
Disc
harg
e (c
fs)
San Luisito Creek, Feburary 18 - 20, 2011
Discharge SSC (mg/L) Predicted SSC (mg/l)
y = 1.9322x - 30.421 R² = 0.9278
n=21
0.000
50.000
100.000
150.000
200.000
250.000
300.000
350.000
400.000
0 50 100 150 200
SSC
(mg/
l)
Turbidity (ntu)
San Luisito Creek, Feburary 18 -20, 2011

2012-2013 Sediment Report Final 21 10/16/2013
Figure 13 illustrates the correlation between SSC and turbidity.
FIGURE 14: SEDIMENT LOAD AND HYDROGRAPH
Figure 14 illustrates the sediment loading rate during the monitoring period and discharge.
TABLE 4: EVENT DATA SUMMARY
Rainfall (inches)
Total Estimated Discharge (acre-feet)
Estimated Sediment Load (short tons)
February 18, 2011 0.21 10.42 1.97 February 19, 2011 1.66 36.26 15.47 February 20, 2011 0 15.65 1.28
Totals 1.81 56.3 18.7 Data for 30-minute and one-hour intervals was compiled and summed to generate daily discharge and suspended sediment load estimates. For each time interval, the stage height measurement was used to calculated the discharge at the beginning of the interval. The SSC measurement or estimate from the beginning of the interval was applied to the discharge volume to generate a value for suspended sediment load for the interval.
During the February 2011 monitoring event, the total discharge was estimated to be 56.3 acre-feet. The total estimated sediment load was 18.7 short tons.
0.00
5.00
10.00
15.00
20.00
25.00
30.00
35.00
40.00
12:002/18/11
0:302/19/11
13:002/19/11
1:302/20/11
0.00
0.50
1.00
1.50
2.00
2.50
Disc
harg
e (c
fs)
Sedi
men
t (to
ns/h
r.)
San Luisito Creek, Feburary 18 - 20, 2011
sediment load (tons/1 hr.) Discharge

2012-2013 Sediment Report Final 22 10/16/2013
SAN LUISITO CREEK SSC ANALYSIS
The correlation between measured turbidity and SSC at San Luisito Creek during the 2010-2011 water year is statistically significant, as illustrated in Figure 15. However, this correlation only includes turbidity and SSC values collected during time periods in the 2010-2011 rain year when the maximum discharge was 190 cfs. Peak discharge can be highly variable, and during the 2010 to 2011 water year, the peak discharge was 1,316 cfs. While discharge values this high are rare, episodic events such as these contribute the vast majority of the sediment load into the system. Additional data from higher peak discharges are needed to more completely define the relationship between SSC and turbidity.
Collecting accurate SSC samples from larger flows would require re-positioning of the sediment sampler intake. The highest intake from the channel bottom is at an approximate elevation of 0.45 feet from the channel bottom. Using the stage height – flow rate correlation (Figure 3), this stage height corresponds to flows of approximately 12.5 cfs. In order to rule out the influence of bedload, it would be advisable to install an additional intake at 1.5 to 2.5 feet above the channel bottom to capture samples during high flows without the impact of bedload.
FIGURE 15: TURBIDITY AND SSC CORRELATION
SAN LUISITO CREEK SSC ANALYSIS CONCLUSIONS
Due to the logistical challenges of running multiple sampling stations, the full season of storms were not monitored at the San Luisito Creek site during the 2010 to 2011 water year. During the two storms monitored in the 2010 to 2011 water year, 125.1 acre-feet of discharge were monitored for SSC. The estimated SSC load was 95.3 short tons during these two storms. In total, 1,660 acre-feet of water were measured at the San Luisito Creek gauge for the year. In the 2009 to 2010 rain year, two major storms were monitored. The total discharge monitored for SSC was 716.4 acre-feet,
y = 0.4652x + 27.28 R² = 0.9303
0.00
50.00
100.00
150.00
200.00
250.00
300.00
350.00
400.00
450.00
0.00 100.00 200.00 300.00 400.00 500.00 600.00 700.00 800.00 900.00
Turb
idity
(NTU
)
SSC (mg/L)

2012-2013 Sediment Report Final 23 10/16/2013
with a total of 2,063 tons of suspended sediment load estimated. In that year, a total annual discharge of 1,991 acre-feet of water was estimated (using data from December 2009 through May 2010 and estimating typical base flow rates for the remainder of the year). For context, note that the estimated annual average sediment load documented in the TMDL for San Luisito Creek was 14,630 tons/year. Following best management plan implementation, the goal for annual average sediment loading was 9,664 tons/year.
Analysis conducted at Chorro Creek over three years indicates that most of the sediment transport occurs during bigger storms. Specifically on Chorro Creek, a water year with 20,220 acre-feet of flow had 146 short tons/year of sediment load, while a water year with 38,357 acre-feet had 136,043 short tons/year of sediment loading. A similar relationship is expected on San Luisito Creek. In order to further explore this relationship, additional data is needed, as well as modeling that incorporates San Luisito Creek stage height, estimated flow, SSC and estimated SSC in order to determine annual loading.
SSC QUALITY ASSURANCE MEASURES
As part of efforts to ensure the quality of SSC data, the Estuary Program participates in the Sediment Lab Quality Assurance (SLQA) Project with the USGS Branch of Quality Systems. The USGS lab creates single-blind samples for SSC analysis by labs across the country. USGS provides triplicate samples from three ranges of sediment concentrations, one of which needs to be analyzed using a sand/fine split procedure. The individual labs analyze the samples and send the results to the USGS, which then compiles a summary report with all labs’ results. This biannual quality control check provides an opportunity to verify that lab protocols, techniques, supplies and equipment are not introducing errors into the sample analysis process. The results from the fall of 2012 and the spring 2013 rounds of SLQA testing are provided in Appendix A.
USGS presents the results as a sediment concentration percent difference, which is a measure of the difference between the known concentration of sediment in the prepared sample compared to the amount of sediment recovered by the individual lab. The results are usually negative percentages because typically sample is lost in the measurement process, rather than contamination being added to the sample. The results also provide a median percent difference value of all of the results as compared to the known sediment concentrations.
TABLE 5: ESTUARY PROGRAM RESULTS FOR SLQA PROGRAM, FALL 2012 AND SPRING 2013
SLQA Effort
SSC Target of QA
Sample (mg/L)
Sample Replicate
#
SSC Percent Difference for
Estuary Program Analysis
Compared to Known
Concentration (%)
Average SSC Percent
Difference for Estuary
Program Analysis (%)
Median SSC Percent
Difference for Results from All
Labs (%)
Fall 2012 217 1 -7.31 -10.22 -5.91 2 -7.74 3 -15.61

2012-2013 Sediment Report Final 24 10/16/2013
SLQA Effort
SSC Target of QA
Sample (mg/L)
Sample Replicate
#
SSC Percent Difference for
Estuary Program Analysis
Compared to Known
Concentration (%)
Average SSC Percent
Difference for Estuary
Program Analysis (%)
Median SSC Percent
Difference for Results from All
Labs (%)
4,000 1 -1.53 -2.69 -1.42 2 -1.55 3 -5.0 10,389 1 -1.27 -0.71 -1.03 2 -0.68 3 -1.13
Spring 2013
236 1 -5.25 -5.09 -6.43
2 -6.09 3 -3.93 3,200 1 -2.65 -2.44 -1.06 2 -2.36 3 -2.31 10,606 1 0.29 -0.34 -0.46 2 -0.32 3 -0.41 No numeric targets are in place for assessing program accuracy. As demonstrated by the values in the above table, Estuary Program results were on par with the results from other labs across the country that participated in the SLQA Program.
STREAMBED SEDIMENT IMPAIRMENT INDICATORS
The relationship between aquatic health in a watershed and impacts due to sediment loading is of great interest in the regulation of sediment. Over a three-year period, researchers from the Sierra Nevada Aquatic Research Laboratory (SNARL) (associated with the University of California) and UC Santa Cruz conducted research to develop numeric targets for sediment impairment and biological thresholds in riverine systems in the Central Coast region. Although these criteria were not specifically developed for the Morro Bay watershed, they are being evaluated for assessments throughout the Central Coast region. Initial analysis shows that the indicators are applicable in the Central Coast region.
An extensive number of indices were tested across a gradient of test sites. The final outcome included 16 indicators of sediment impairment on aquatic habitat. The indicators cover both the physical characteristics (sediment) and the biological community.
A significant data collection effort is required to determine the status of all 16 sediment and biological indicators for a study reach. The current SWAMP Bioassessment Protocol (SWAMP, 2007) metrics can be used to generate seven of the nine (in bold) sediment indicators, and six of the

2012-2013 Sediment Report Final 25 10/16/2013
seven biological indicators (in bold). Since Estuary Program monitoring is conducted per the SWAMP protocol, only the indicators in bold in the list below are available for analysis. There are three threshold criteria for comparison of each of these indicators, shown in Table 6.
Sediment Indicators:
1. Percent of Fines (F) on transects 2. Percent of Sand (S) on transects 3. Percent of Fines (F) + Percent of Sands (S) on transects 4. Percent of Fines, Sands and Gravels < 8mm on transects 5. D50 Median particle size 6. Percent patch-scale grid Fines and Sands 7. Log Relative Bed Stability 8. Percent of Fines (Steelhead) 9. Percent Cover of Fines and Sands (BMI Limits)
Biological Indicators
1. Total Richness 2. EPT Richness 3. %EPT 4. Biotic Index 5. Percent Tolerant 6. Sensitive Number 7. Crayfish Number and Size

2012-2013 Sediment Report Final 26 10/16/2013
TABLE 6: SEDIMENT AND BIOLOGICAL INDICATOR CRITERIA
Recommended Numeric Targets
To Support Beneficial Uses
Recommended Numeric Targets to Support
Preliminary
Recommended Numeric Targets
To Support 303(d) Listing 303(d) Listing
(lower priority) (high priority) Sediment Indicators 75/25 90/10
Percent Fines on transects <8.5% 8.5 to 15.2% >15.2%
Percent Sands on transects <27.5% 27.5 to 35.3% >35.3%
Percent Fines + Sands on transects <35.5% 35.5 to 42.0% >42.0%
Percent Fines, Sands, Gravel <8mm on
transects <40.0% 40.0 to 50.2% >50.2%
D50 median particle size >15 mm 7.7 to 15 mm <7.7 mm
Percent Fines
(steelhead) <6% 6 to 10% >10%
Percent cover of FS (BMI limits) <30% 30 to 40% >40%
Biological Indicators 75/25 90/10
Total Richness >50.0 <50.0 <44.2
EPT Richness >16.5 <16.5 <11.6
Biotic Index <5.48 >5.48 >5.92
Percent Tolerant <26.3% >26.3% >37.7
Sensitive Number >9.5 <9.5 <5.8
The Estuary Program has conducted SWAMP Bioassessment on an annual basis since 2007. Sites are selected for monitoring based on program data needs and hydrologic conditions. Thus, many sites are monitored on a rotating basis, and data is not available across all sites each year.
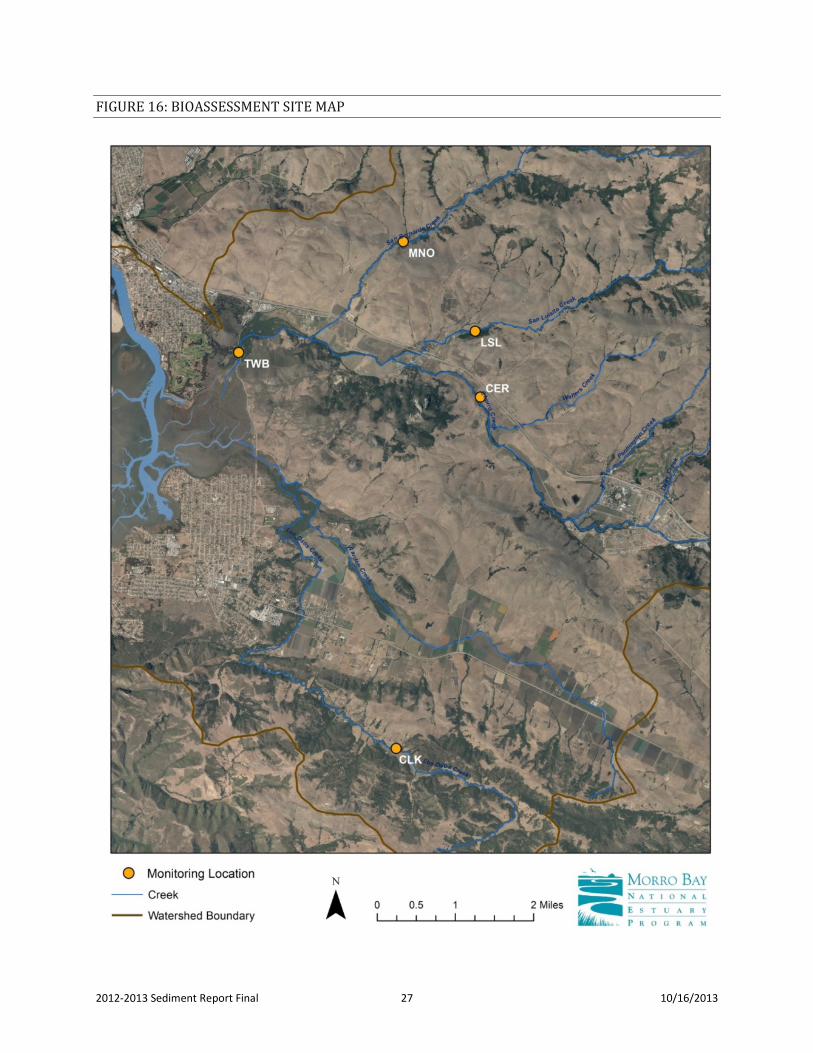
Five bioassessment monitoring sites were selected to be included in this analysis. These monitoring sites are located on Los Osos Creek (site code 310CLK), San Luisito Creek (site code 310LSL), San Bernardo Creek (site code 310MNO), Chorro Creek, lower (site code 310TWB), and Chorro Creek, middle (site code 310CER). See Figure 16 for a map of the monitoring locations. The scores for three years were averaged (2008, 2010, and 2012) for the analysis for 310CLK, 310LSL, and 310MNO. Two years of data (2008 and 2012) was used for the analysis for 310TWB and 310CER since neither site was monitored in 2010.
2012-2013 Sediment Report Final 27 10/16/2013
FIGURE 16: BIOASSESSMENT SITE MAP

2012-2013 Sediment Report Final 28 10/16/2013
TABLE 7: MORRO BAY SEDIMENT IMPAIRMENT INDICATOR METRICS
Site CodePercent
FinesPercent Sands
Percent <8FS Sum
Percentage
D50 Median particle
Percent Fines
(steelhead
Percent cover of FS
(BMI
Total Richness
EPT Richness
Percent EPT
Biotic Index
Percent Tolerant
Sensitive Number
310CLK 7.94 17.46 31.11 25.40 15.17 7.94 25.40 41.33 13.33 37.71 4.59 10.30 7.67310LSL 6.66 17.56 30.47 24.12 13.00 6.66 24.12 54.67 18.00 31.39 4.51 9.61 11.33
310MNO 1.27 19.05 22.86 20.32 32.33 1.27 20.32 58.33 18.67 51.68 4.72 8.41 8.33310TWB 12.86 17.62 32.86 30.00 11.25 12.86 30.00 50.50 11.00 17.04 6.02 18.15 5.00310CER 14.77 12.86 27.62 27.62 22.00 14.77 27.62 45.00 9.00 25.11 5.85 15.63 1.50
Sediment Indicators Biological Indicators

2012-2013 Sediment Report Final 29 10/16/2013
STREAMBED SEDIMENT IMPAIRMENT INDICATORS ANALYSIS
Of the seven sediment indicators tested across the five monitoring sites, no site indicated a high priority for 303(d) listing (Table 7). 310MNO met all of the sediment numeric targets that support beneficial use. One or two sediment indicators met the lower priority criteria for 303(d) listing at 310CLK, 310LSL, 310TWB, and 310CER. All sites but 310LSL and 310MNO met at least one biological indicator that supports 303(d) listing.
This preliminary analysis indicates that physical characteristics are variable across sites in the Morro Bay watershed and that some sites may indicate greater levels of impairment than others. It is important to consider that these results do not include the full suite of sixteen metrics that comprise the analytical approach.
These indicator criteria are still being assessed for incorporation in the TMDL establishment and assessment process in the Central Coast region. These criteria differ greatly from the D50 and percent sands/percent fines criteria listed in the approved sediment TMDL for Morro Bay. Further guidance is needed from the Water Board for future assessments of the status of the Morro Bay Sediment TMDL.
USGS ESTUARY SEDIMENT ACCRETION RATE STUDY
Currently, the USGS is undertaking a study within the Morro Bay Estuary that will address marshland vulnerability to global climate change. This study will assess marsh accretion rates and plant community change as a result of sea-level rise.
In April 2013, USGS installed four surface elevation tables (SETs) on the Morro Bay marsh platform. The effort involves collecting data on sedimentation including elevational changes using SETs and sediment cores. USGS collected 3,115 elevation points and 667 vegetation plots. The data is currently under analysis. Unfortunately, due to the federal government shutdown, additional information was not available.

2012-2013 Sediment Report Final 30 10/8/2013
REFERENCES
Ankcorn, P. 2003. Clarifying Turbidity- The Potential and Limitations of Turbidity as a Surrogate for Water Quality Monitoring. Proceedings of the 2003 Georgia Water Resources Conference, held April 23-24, 2003.
ASTM, 1999. Standard Test Method for Determining Sediment Concentration in Water Samples: American Society of Testing and Materials, D 3977-97, Vol. 11.02, pp. 389-394.
Edwards, T.K. and Glysson, G.D., 1999. Field Methods for Measurement of Fluvial Sediment: U.S. Geological Survey Techniques of Water-Resource Investigations, Book 3, Chapter C2, 89p.
Gray, John R., Glysson, G. Douglas, Turcios, Lisa M., Schwarz, Gregory E., 2000. Comparability of Suspended Sediment Concentration and Total Suspended Solids Data, U.S. Geological Survey Water-Reources Investigations Report 00-4191, 14 p. (http://water.usgs.gov/osw/pubs/WRIR00-4191.pdf).
Herbst, David, et al. Sediment Deposition Relations to Watershed Land Use and Sediment Load Models Using a Reference Stream Approach to Develop Sediment TMDL Numeric Targets for the San Lorenzo River and Central Coast California Streams. January 2011.
Herbst, David, et al. Development of Biological Indicators and Targets to Guide Sediment TMDLs for Streams of the Central Coast Region of California and the San Lorenzo River. January 2011.
Morro Bay National Estuary Program’s Implementation Effectiveness Program for the Morro Bay Watershed, Suspended Sediment Monitoring Report, 2009-2010. Morro Bay National Estuary Program. September 2010.
Morro Bay National Monitoring Program: Nonpoint Source Pollution and Treatment Measure Evaluation for the Morro Bay Watershed Final Report. Central Coast Regional Water Quality Control Board. August 2003.
Morro Bay Sediment Loading Update, December 2011. Morro Bay National Estuary Program. December 2011.
Morro Bay Total Maximum Daily Load for Sediment (including Chorro Creek, Los Osos Creek and the Morro Bay Estuary). Central Coast Regional Water Quality Control Board. 2003.
Ode, Peter. California Department of Fish and Game Aquatic Bioassessment Laboratory. Standard Operating Procedure for Collecting Benthic Macroinvertebrate Samples and Associated Physical and Chemical Data for Ambient Bioassessments in California. February 2007.
Paustian, S. and Beschta, R. 1979. The Suspended Sediment Regime of An Oregon Coast Range Stream. Water Resources Bulletin, American Water Resources Association. 15 (1) pp.144-154.
Three-Year Implementation Tracking Progress Report of the Morro Bay Sediment Total Maximum Daily Load. Central Coast Regional Water Quality Control Board. April 2007.
Tetra Tech, Inc. 1998. Morro Bay Estuary Program Sediment Loading Study.

2012-2013 Sediment Report Final 31 10/8/2013
APPENDEX A: USGS SLQA RESULTS
Note: MBNEP’s results are labeled as “35-Volunteer.”
-40
-35
-30
-25
-20
-15
-10
-5
0
5
10
15
20
Sed
imen
t Con
cent
ratio
n P
erce
nt D
iffer
ence
Lab ID#
USGS Sediment Laboratory Quality Assurance Project - Study 1, 2013 Suspended Sediment Concentration Percent Difference Results
Class 1 Target SSC = 236 mg/L
Results Median (-6.43%) Median +/- 5% Median +/- 3 F-pseudosigma
-15
-10
-5
0
5
10
Sed
imen
t Con
cent
ratio
n P
erce
nt D
iffer
ence
Lab ID#
USGS Sediment Laboratory Quality Assurance Project - Study 1, 2013 Suspended Sediment Concentration Percent Difference Results
Class 2 Target SSC = 3200 mg/L
Results Median (-1.06%)

2012-2013 Sediment Report Final 32 10/8/2013
-10
-5
0
5
10
Sed
imen
t Con
cent
ratio
n P
erce
nt D
iffer
ence
Lab ID#
USGS Sediment Laboratory Quality Assurance Project - Study 1, 2013 Suspended Sediment Concentration Percent Difference Results
Class 3 Target SSC = 10606 mg/L
Results Median (-0.46%)
-40-35-30-25-20-15-10-505
1015202530
Sed
imen
t Con
cent
ratio
n P
erce
nt D
iffer
ence
Lab ID#
USGS Sediment Laboratory Quality Assurance Project - Study 2, 2012 Suspended Sediment Concentration Percent Difference Results
Class 1 Target SSC = 217 mg/L
Results Median (-5.91%)

2012-2013 Sediment Report Final 33 10/8/2013
-15
-10
-5
0
5
10
Sed
imen
t Con
cent
ratio
n P
erce
nt D
iffer
ence
Lab ID#
USGS Sediment Laboratory Quality Assurance Project - Study 2, 2012 Suspended Sediment Concentration Percent Difference Results
Class 2 Target SSC = 4000 mg/L
Results Median (-1.42%)
-10
-5
0
5
10
Sed
imen
t Con
cent
ratio
n P
erce
nt D
iffer
ence
Lab ID#
USGS Sediment Laboratory Quality Assurance Project - Study 2, 2012 Suspended Sediment Concentration Percent Difference Results
Class 3 Target SSC = 10389 mg/L
Results Median (-0.71%)