morro bay national estuary program’s implementation ... · 2015 sediment report 1 october 2015 ....
TRANSCRIPT

2015 Sediment Report 1 October 2015
Morro Bay National Estuary Program’s
Implementation Effectiveness Program
For the Morro Bay Watershed
Sediment Monitoring Report
2015
Prepared for State Water Resources Control Board
1001 I St, 16th Floor Sacramento, CA 95814
Project # C-06-6701-110, Task 3.5
Prepared by
Morro Bay National Estuary Program 601 Embarcadero, Suite 11
Morro Bay, CA 93442
October 27, 2015
2015 Sediment Report 2 October 2015
TABLE OF CONTENTS Executive Summary ................................................................................................................................................................ 4
Introduction ............................................................................................................................................................................... 4
Project Background ................................................................................................................................................................ 5
Table 1: Morro Bay Sediment TMDL Numeric Targets .................................................................................. 5
Suspended Sediment Monitoring Effort ......................................................................................................................... 7
Site Locations ....................................................................................................................................................................... 9
Figure 1: Morro Bay Suspended Sediment Study Area .................................................................................. 9
San Luisito Creek at Adobe Road ................................................................................................................................. 9
Figure 2: San Luisito Creek Subwatershed Monitoring Area ..................................................................... 10
Figure 3: San Luisito Creek Stage and Flow Rate Correlation ................................................................... 11
Walters Creek ..................................................................................................................................................................... 12
Figure 4: Walters Creek Study Area ..................................................................................................................... 12
Chorro Creek at Canet Road ......................................................................................................................................... 13
Figure 5: Chorro Creek, Canet Road Sub Watershed Area .......................................................................... 13
Figure 6: Original Chorro Creek Stage Discharge Relationship ................................................................ 15
Figure 7: Amended Chorro Creek Rating Curve .............................................................................................. 16
2014 Rain Year Hydrograph ........................................................................................................................................ 16
Figure 8: 2014 Rain Year Hydrograph-San Luisito Creek ........................................................................... 17
Figure 9: 2014 Rain Year Hydrograph-Chorro Creek ................................................................................... 18
Cross Section Profiling ........................................................................................................................................................ 19
Figure 10: Cross Section Locations ....................................................................................................................... 19
Chorro Flats Floodplain Reserve ................................................................................................................................ 20
Results ................................................................................................................................................................................... 20
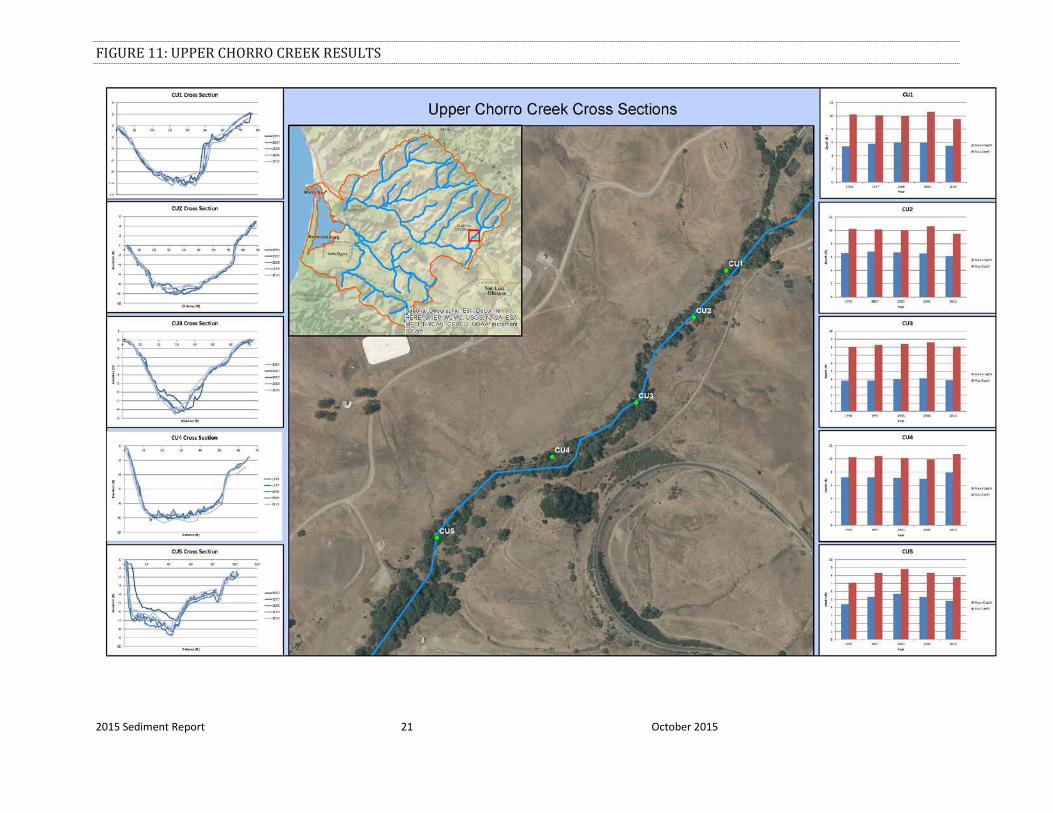
Figure 11: Upper Chorro Creek Results .............................................................................................................. 21
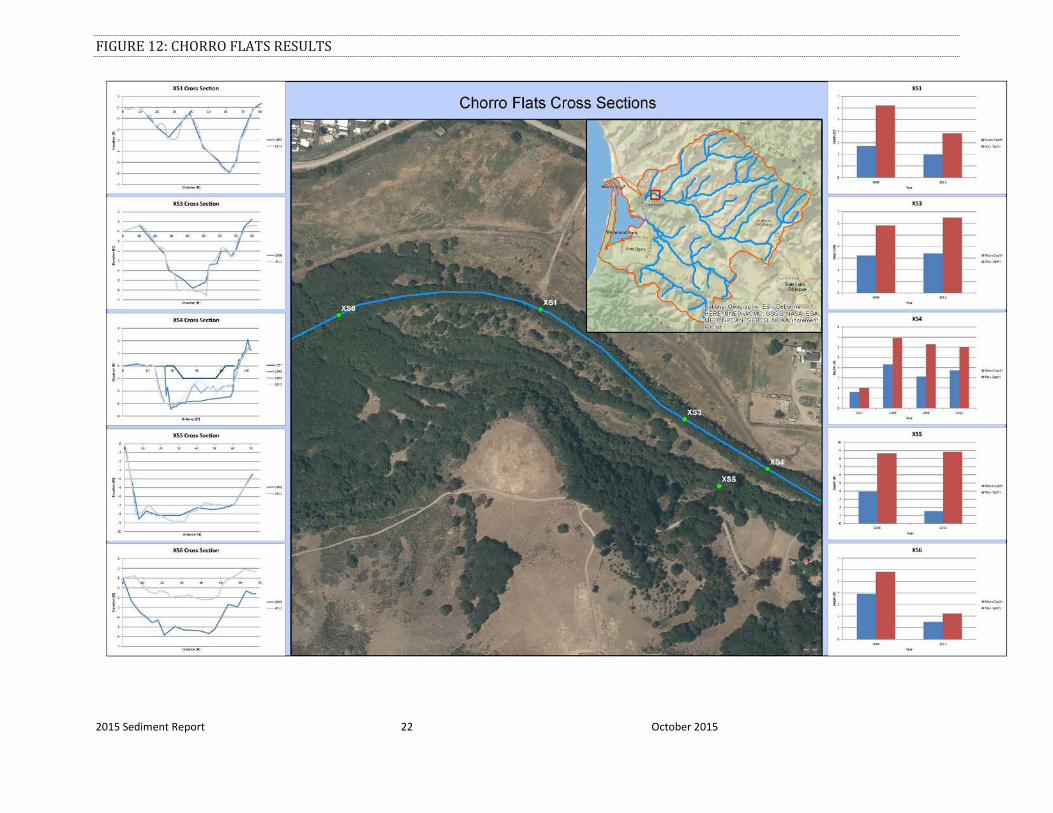
Figure 12: Chorro Flats Results .............................................................................................................................. 22
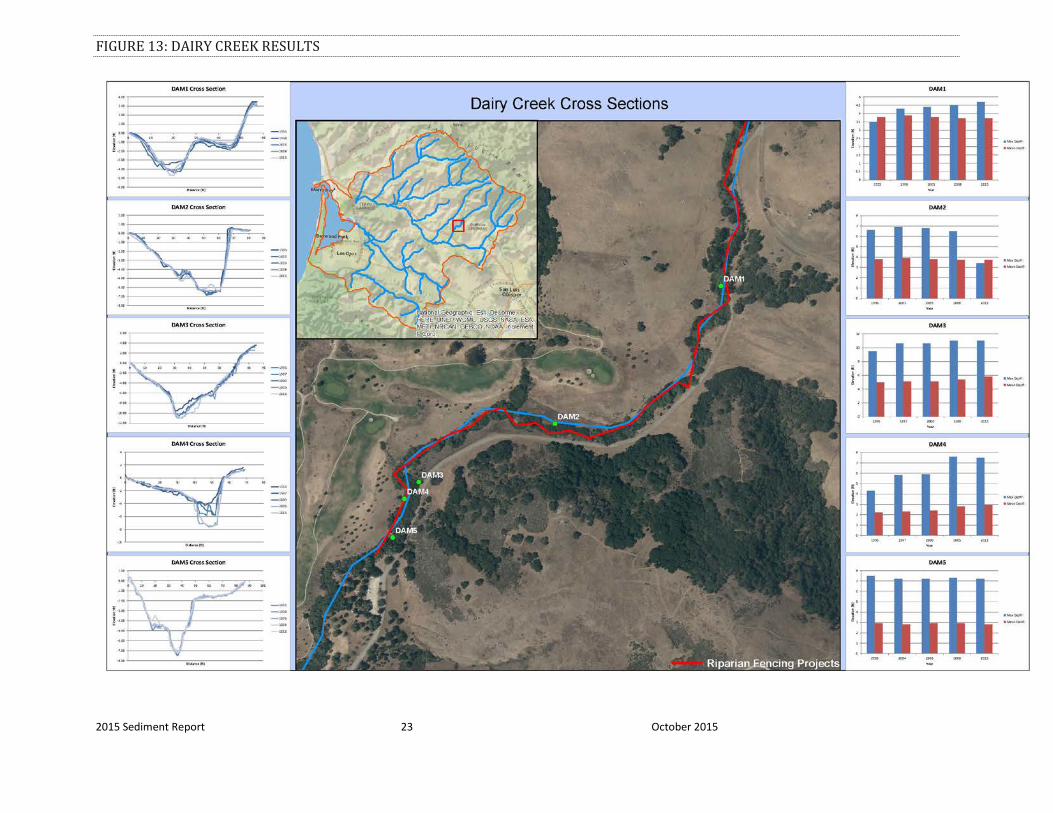
Figure 13: Dairy Creek Results ............................................................................................................................... 23
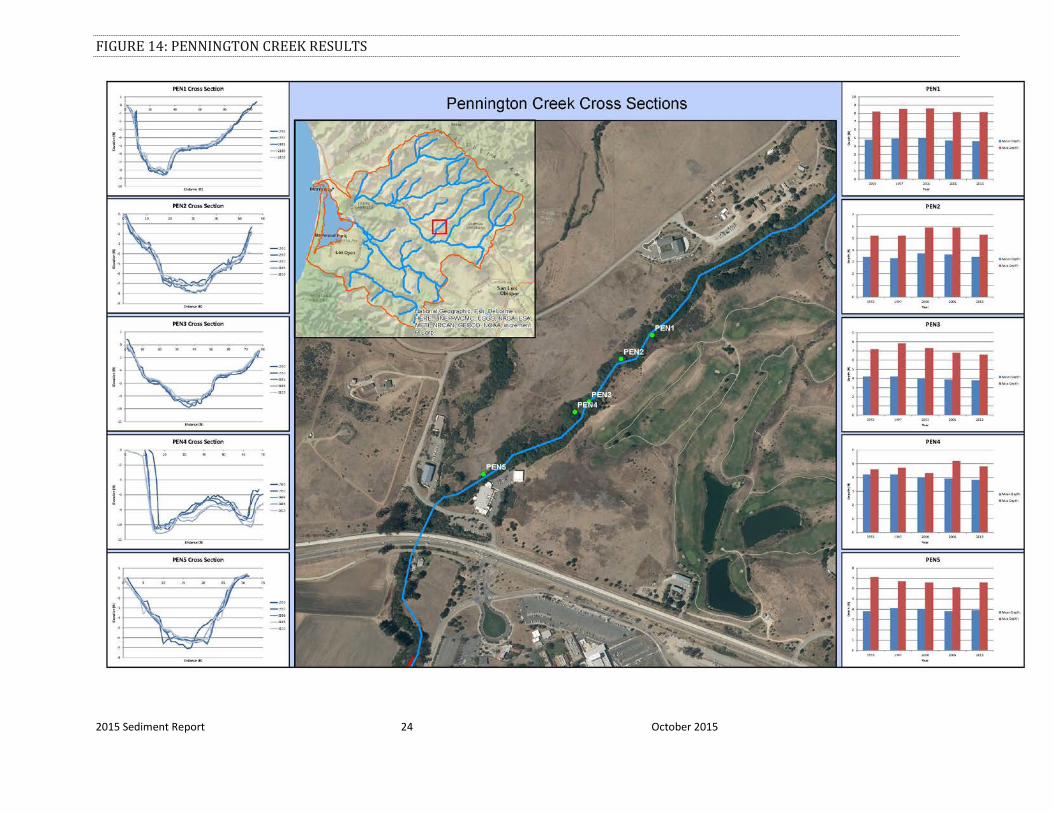
Figure 14: Pennington Creek Results .................................................................................................................. 24
Figure 15: Lower Chorro Creek Results ............................................................................................................. 25
Analysis of Data ................................................................................................................................................................. 26
Table 2: Dairy Creek Cross Section Percent Change ...................................................................................... 26
Table 3: Pennington Creek Cross Section Percent Change ......................................................................... 26
Table 4: Upper Chorro Creek Cross Section Percent Change..................................................................... 26
Table 5: Chorro Creek at Chorro Flats Cross Section Percent Change ................................................... 27
2015 Sediment Report 3 October 2015
Table 6: Lower Chorro Creek Cross Section Percent Change .................................................................... 27
Figure 16: Mean Depth Values for Lower Chorro Creek .............................................................................. 28
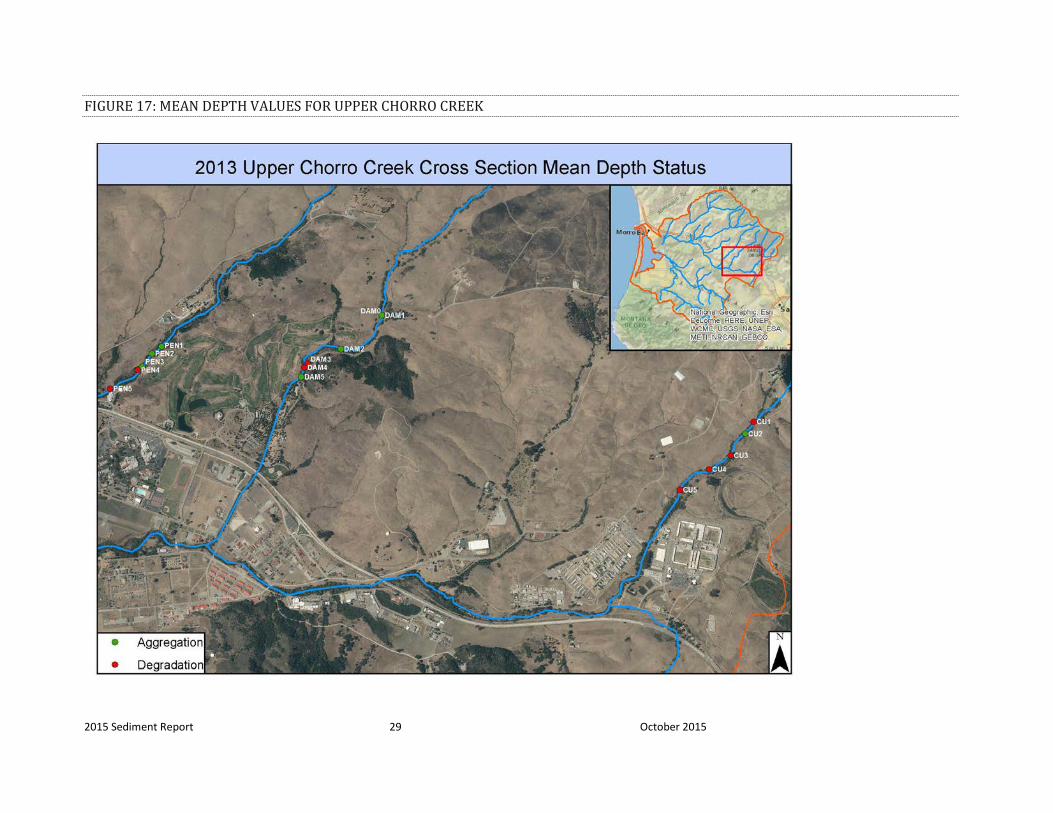
Figure 17: Mean Depth Values for Upper Chorro Creek .............................................................................. 29
Discussion ............................................................................................................................................................................ 30
Streambed Sediment Impairment Indicators ............................................................................................................ 31
Table 7: Sediment and Biological Indicator Criteria ..................................................................................... 32
Figure 18: Bioassessment Site Map ...................................................................................................................... 33
Table 8: Morro Bay Sediment Impairment Indcator Metrics By Year.................................................... 34
Table 9: Morro Bay Sediment Impairment Indicator Metrics Averages ............................................... 34
Streambed Sediment Impairment Indicators Analysis ..................................................................................... 36
Sediment Elevation Tables ................................................................................................................................................ 37
Figure 19: Map of All Morro Bay SETs & Horizon Markers ........................................................................ 37
SSC Quality Assurance Measures .................................................................................................................................... 38
Table 10: Results for SLQA Program, Fall 2014 and Spring 2015 ........................................................... 39
References ................................................................................................................................................................................ 40
Appendex A: USGS SLQA Results..................................................................................................................................... 41
2015 Sediment Report 4 October 2015
EXECUTIVE SUMMARY
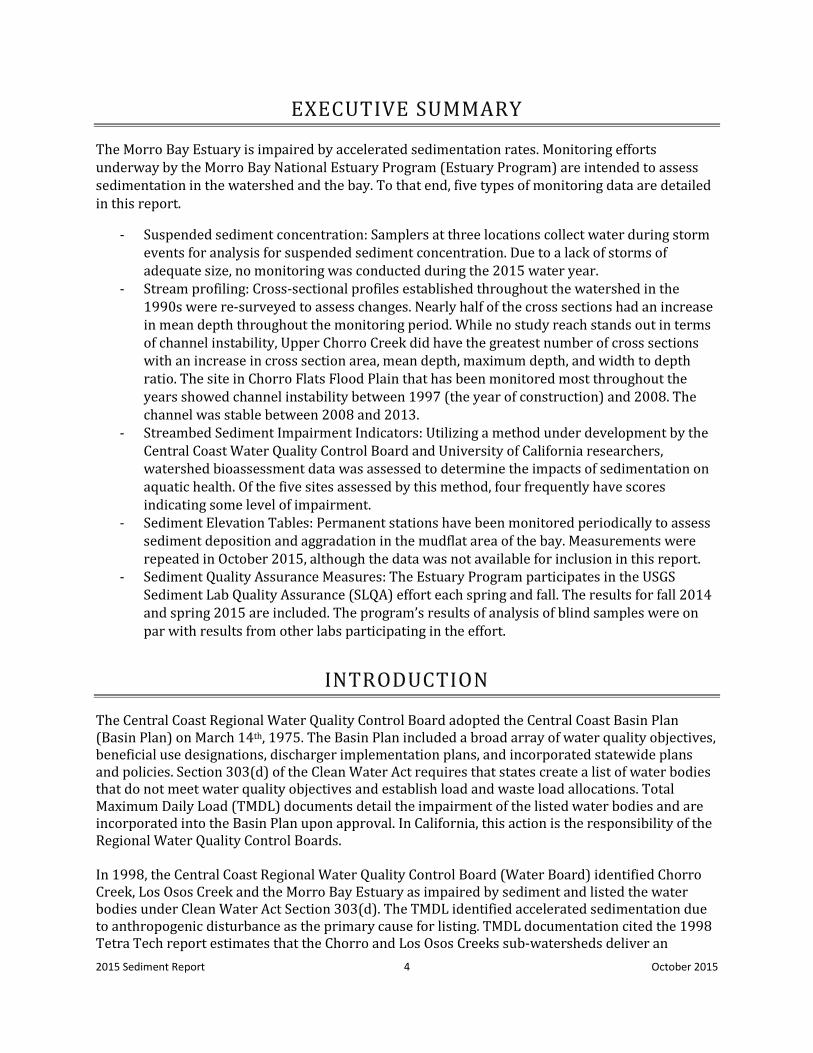
The Morro Bay Estuary is impaired by accelerated sedimentation rates. Monitoring efforts underway by the Morro Bay National Estuary Program (Estuary Program) are intended to assess sedimentation in the watershed and the bay. To that end, five types of monitoring data are detailed in this report.
- Suspended sediment concentration: Samplers at three locations collect water during storm events for analysis for suspended sediment concentration. Due to a lack of storms of adequate size, no monitoring was conducted during the 2015 water year.
- Stream profiling: Cross-sectional profiles established throughout the watershed in the 1990s were re-surveyed to assess changes. Nearly half of the cross sections had an increase in mean depth throughout the monitoring period. While no study reach stands out in terms of channel instability, Upper Chorro Creek did have the greatest number of cross sections with an increase in cross section area, mean depth, maximum depth, and width to depth ratio. The site in Chorro Flats Flood Plain that has been monitored most throughout the years showed channel instability between 1997 (the year of construction) and 2008. The channel was stable between 2008 and 2013.
- Streambed Sediment Impairment Indicators: Utilizing a method under development by the Central Coast Water Quality Control Board and University of California researchers, watershed bioassessment data was assessed to determine the impacts of sedimentation on aquatic health. Of the five sites assessed by this method, four frequently have scores indicating some level of impairment.
- Sediment Elevation Tables: Permanent stations have been monitored periodically to assess sediment deposition and aggradation in the mudflat area of the bay. Measurements were repeated in October 2015, although the data was not available for inclusion in this report.
- Sediment Quality Assurance Measures: The Estuary Program participates in the USGS Sediment Lab Quality Assurance (SLQA) effort each spring and fall. The results for fall 2014 and spring 2015 are included. The program’s results of analysis of blind samples were on par with results from other labs participating in the effort.
INTRODUCTION
The Central Coast Regional Water Quality Control Board adopted the Central Coast Basin Plan (Basin Plan) on March 14th, 1975. The Basin Plan included a broad array of water quality objectives, beneficial use designations, discharger implementation plans, and incorporated statewide plans and policies. Section 303(d) of the Clean Water Act requires that states create a list of water bodies that do not meet water quality objectives and establish load and waste load allocations. Total Maximum Daily Load (TMDL) documents detail the impairment of the listed water bodies and are incorporated into the Basin Plan upon approval. In California, this action is the responsibility of the Regional Water Quality Control Boards. In 1998, the Central Coast Regional Water Quality Control Board (Water Board) identified Chorro Creek, Los Osos Creek and the Morro Bay Estuary as impaired by sediment and listed the water bodies under Clean Water Act Section 303(d). The TMDL identified accelerated sedimentation due to anthropogenic disturbance as the primary cause for listing. TMDL documentation cited the 1998 Tetra Tech report estimates that the Chorro and Los Osos Creeks sub-watersheds deliver an
2015 Sediment Report 5 October 2015
average of approximately 70,000 tons per year of sediment into the Morro Bay estuary. The report indicated that the Chorro Creek watershed was estimated to contribute 86 percent of the total sediment delivered to Morro Bay, approximately 60,689 tons. The TMDL identified five numeric targets for monitoring and plans to track the progress of voluntary and required implementation actions. The Morro Bay National Estuary Program (Estuary Program) was identified as the lead monitoring and reporting agency. The Morro Bay Total Maximum Daily Load for Sediment (including Chorro Creek, Los Osos Creek and the Morro Bay Estuary) was formally adopted by the Environmental Protection Agency on December 3, 2003. This report details progress on monitoring to assess sediment conditions in the Morro Bay watershed and estuary.
PROJECT BACKGROUND
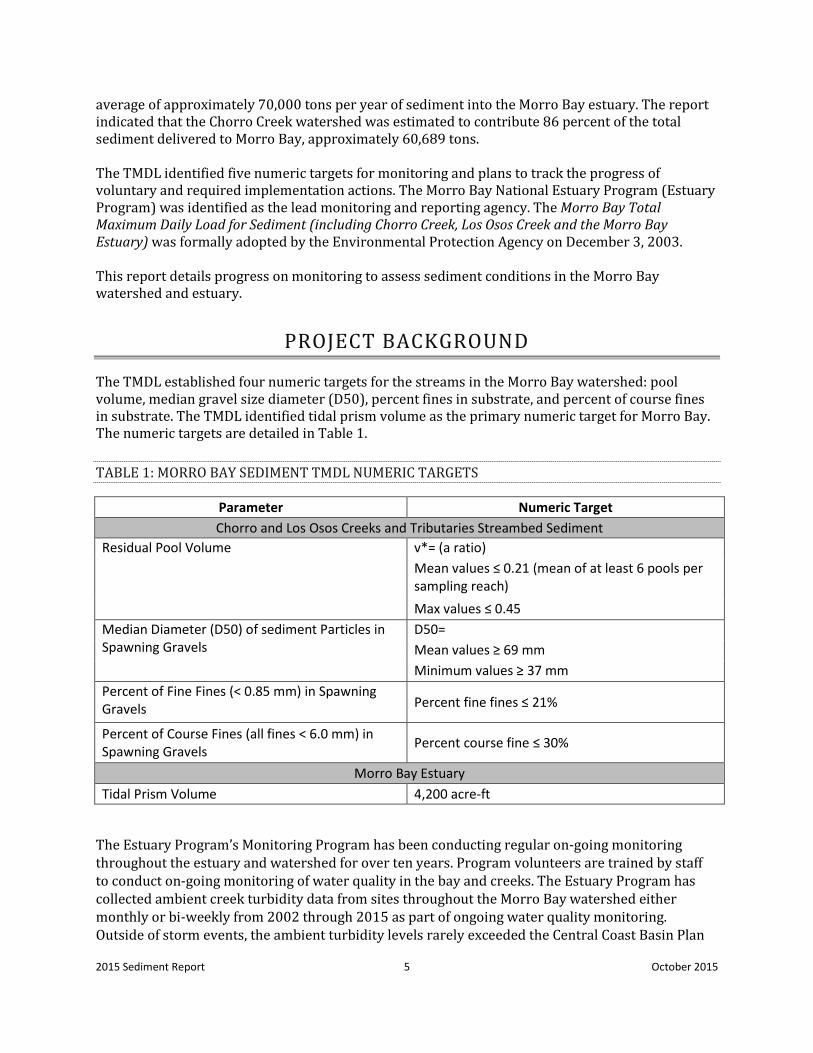
The TMDL established four numeric targets for the streams in the Morro Bay watershed: pool volume, median gravel size diameter (D50), percent fines in substrate, and percent of course fines in substrate. The TMDL identified tidal prism volume as the primary numeric target for Morro Bay. The numeric targets are detailed in Table 1.
TABLE 1: MORRO BAY SEDIMENT TMDL NUMERIC TARGETS
Parameter Numeric Target Chorro and Los Osos Creeks and Tributaries Streambed Sediment
Residual Pool Volume v*= (a ratio) Mean values ≤ 0.21 (mean of at least 6 pools per sampling reach) Max values ≤ 0.45
Median Diameter (D50) of sediment Particles in Spawning Gravels
D50= Mean values ≥ 69 mm Minimum values ≥ 37 mm
Percent of Fine Fines (< 0.85 mm) in Spawning Gravels Percent fine fines ≤ 21%
Percent of Course Fines (all fines < 6.0 mm) in Spawning Gravels Percent course fine ≤ 30%
Morro Bay Estuary Tidal Prism Volume 4,200 acre-ft
The Estuary Program’s Monitoring Program has been conducting regular on-going monitoring throughout the estuary and watershed for over ten years. Program volunteers are trained by staff to conduct on-going monitoring of water quality in the bay and creeks. The Estuary Program has collected ambient creek turbidity data from sites throughout the Morro Bay watershed either monthly or bi-weekly from 2002 through 2015 as part of ongoing water quality monitoring. Outside of storm events, the ambient turbidity levels rarely exceeded the Central Coast Basin Plan

2015 Sediment Report 6 October 2015
levels of concern of 25 NTU for protection of aquatic life in cold water (beneficial use COLD) and 40 NTU in warm waters (beneficial use WARM). Of 2,875 turbidity readings since 2002, 2.4% exceeded 25 NTU and 1.2% exceeded 40 NTU. The Estuary Program has not conducted monitoring of the other TMDL targets due to the cost and expertise required.
Multiple studies have analyzed the accuracy of measuring turbidity as a surrogate for monitoring total suspended solids (TSS) or suspended sediment concentration (SSC). Turbidity monitoring is significantly faster and less expensive than monitoring SSC or TSS. However, although turbidity data has generally proven to be more accurate than other surrogate measures (such as discharge), there are limitations to its usefulness in quantifying suspended sediment load in surface waters (Ankcorn, 2003). In 2007, the Estuary Program launched an expanded monitoring effort to generate detailed measurements of suspended sediment and turbidity in the Chorro Creek watershed at three sites. The expanded monitoring generated a new dataset of SSC data using updated United States Geological Survey (USGS) approved laboratory methods. Turbidity was measured in the laboratory on a subset of samples analyzed for SSC. The findings can be used to characterize instantaneous and storm event suspended sediment loads and potentially assess the effectiveness of best management practices (BMPs) implemented throughout the Morro Bay watershed. This project built on total suspended solids (TSS) data collected during the National Monitoring Program (NMP) paired watershed study during the 1990s and early 2000s.
While suspended sediment concentration is not required in the Morro Bay Sediment TMDL, many recently adopted TMDLs include this type of monitoring, and it is one of the most effective ways to quantify instantaneous sediment loading. Additionally, this expanded effort investigated the relationship between turbidity and suspended sediment concentration at each monitoring site. The relationships developed by this project may enable the monitoring of turbidity as a surrogate for SSC under certain conditions. Further, this dataset illustrates a more comprehensive assessment of ‘Wet Season’ turbidity levels in the Chorro Creek watershed.
While substantial data has been collected throughout this effort, there were no storm events during the 2015 rain year that produced sufficient elevated stage to monitor for SSC. Future monitoring will be done on storms expected to generate SSC of 300 mg/L or greater at San Luisito Creek and 1,000 mg/L or greater at Chorro Creek.
As SSC data is not available for assessing sediment impacts in the 2015 rain year, this report will instead focus on other areas of the program that address sedimentation. Stream profiling cross sections surveyed throughout the Chorro Creek watershed between 1998 and 2013 were plotted and analyzed. This information provides a site specific look at erosion and aggradation at sites throughout the watershed. Analysis was also conducted of streambed sediment impairment indicators from 2014 and 2015 utilizing data collected during Surface Water Ambient Monitoring Program (SWAMP) Bioassessment surveys. Methods under development by the Water Board and UC Davis researchers incorporate bioassessment and habitat survey scores to assess the impacts of sedimentation.
2015 Sediment Report 7 October 2015
SUSPENDED SEDIMENT MONITORING EFFORT
Although no new SSC data was collected during the 2015 rain year, this portion of the report was retained to provide background on the monitoring effort. The hydrographs for 2015 are included at the end of the section, demonstrating the lack of storms meriting monitoring during the year.
Event SSC monitoring required the deployment of automated sampling equipment programmed to collect water samples on an even-timed interval during storm events. The Estuary Program utilized ISCO 6712 automated samplers housed in shelters at each monitoring site. Samples were drawn into ½-inch diameter polyvinyl tubing, sheltered by 1-inch electrical conduit and a 4-inch perforated PVC intake guard at the intake end. All samples were drawn from a fixed intake location near the low flow centroid of the channel. Due to budget and equipment constraints, equal width increment sampling and depth distributed sampling were not feasible. The representativeness of these fixed intake locations remains unverified.
Samplers were programmed manually by staff members and were not automatically activated by specified event conditions. Each sampler contained a set of 24 bottles that was manually retrieved and replaced at the conclusion of each sampling program. Sampling regimes varied by storm event and among field sites due to rapidly changing site conditions. In most cases, samples were collected at either 30 or 60-minute intervals.
Samples were retrieved from the field and processed at the Estuary Program’s Morro Bay Water Science Lab (MBWSL) located at Cuesta College. Due to the limitations associated with sample analysis by an outside laboratory, the Estuary Program established its own laboratory facility in 2007 through a cooperative agreement with Cuesta College. The school donated space in their newly-renovated physical sciences building to establish the Morro Bay Water Sciences Lab under the guidance of the Estuary Program. The MBWSL opened in January 2008 and is operated by the Estuary Program’s Monitoring Program.
The MBWSL conducts analysis for SSC according to ASTM method 3977 D. This method calls for the analysis of the entire sample rather than an aliquot of a specified volume as allowed when monitoring for TSS. USGS conducted extensive studies comparing the differences between TSS and SSC laboratory methods and found that the TSS methodology consistently under-sampled the sediment concentration in surface waters (Gray, Glysson et al., 2000). The results from the two methods can differ significantly when the sample is comprised of a significant fraction of sand-sized particles.
Samples were weighed upon arrival at the lab, labeled and then stored in a refrigerator until analysis. There is no specified hold time for SSC, however most samples were analyzed within 60 days of collection. Samples were vacuum filtered through tared glass fiber filters (47 mm, Whatman 934-AH) on a six position vacuum manifold and placed into a convection oven for drying. Samples with turbidity in excess of 500 NTU or with noticeable sand or sediment accumulation were partially filtered and then dehydrated in tared glass crucibles. When fully dried, sample filters and crucibles were removed from the oven and stored in dessicators until they were sufficiently cool for final weighing, yielding a sediment concentration value of mg/L for each sample.
Turbidity data was collected in the laboratory using a HACH 2100AN turbidimeter compliant with USEPA Method 180.1. Samples were mixed, decanted to sample cells and returned to sample bottles
2015 Sediment Report 8 October 2015
following measurement. Measurements were taken with the multidetector ratio mode activated and with signal averaging to minimize noise.
The MBWSL is a volunteer participant in the USGS Sediment Lab Quality Assurance (SLQA) program, which supplies single-blind quality assurance samples to participating laboratories twice a year. The MBWSL receives nine samples of an unknown concentration, conducts SSC analysis, and submits results electronically to the SLQA program. The program has participated in biannual SLQA testing with the USGS since 2008. These quality assurance activities assess accuracy and precision of laboratory processes. See the report section titled “SSC Quality Assurance Measures” as well as Appendix A for 2014 and 2015 SLQA results.
The MBWSL conducts ongoing accuracy checks of equipment and procedures throughout the year. Balances are routinely checked with calibration weights and re-calibrated annually by a certified technician. The MBWSL operating procedures, protocols, and quality assurance measures are documented in detail as part of the Estuary Program’s Quality Assurance Project Plan which is updated annually and undergoes review by the Environmental Protection Agency and Water Board. The MBWSL is a ‘paperless’ lab, and all incoming sample information and analytical results are recorded in an Access database. The database was designed specifically for operations at the MBWSL. The Access database is queried and printed out quarterly for off-site storage to prevent electronic data loss. Accurate discharge data is critical in order to determine storm event suspended sediment loading estimates. In order to avoid ongoing labor-intensive discharge monitoring, stage-discharge relationships were developed for each site. Stage height (the height of the water surface) was correlated to the discharge (volume of water) to develop a rating curve. Discharge and stage data were collected over a wide range of conditions to develop the rating curve. Although discharge values had been periodically collected at the site on Chorro Creek at Canet Road (site code 310CAN) and San Luisito Creek (site code 310SLU) sites throughout the last twelve years, most of the monitoring had taken place at base-flow wadeable conditions. While this data was important for characterizing dry season conditions, there remained a need for data collected during storm events when streams were no longer wadeable. Collecting discharge measurements during non-wadeable flows required specialized equipment and training. These limitations prevented the Estuary Program or San Luis Obispo County Flood Control and Water Conservation District (SLO County FC&WCD) staff from collecting data during these events. To obtain this crucial high-stage data, the Estuary Program contracted with the Irrigation Training and Research Center (ITRC) at California Polytechnic State University, San Luis Obispo (Cal Poly). Engineering staff at ITRC conducted high stage discharge monitoring throughout the project. ITRC targeted flows greater than 50 cubic feet per second (cfs) at San Luisito Creek and flows greater than 200 cfs at Chorro Creek. Engineers utilized either a Marsh-McBirney Flo-Mate unit or a Sontek flow tracker mounted on the end of a specially designed stabilizing/measuring pole that was constructed for the project. The velocities at the San Luisito Creek site were especially high (greater than 10 feet/second at 180 cfs) and required that equipment be modified to provide stable readings and positioning under those conditions.
At each site, velocity readings were taken at the 0.6 depth of flow point (measured from the surface at 60% of total flow depth). Due to high velocities and turbulence, two measurements (at the 0.2 and 0.8 depths), were not feasible. Further, the hydrographs for these creeks were subject to rapid changes, mandating the need for fast measurement techniques. All measurements were completed by a two person field team. At the conclusion of the 2009 to 2010 water year, ITRC provided a final
2015 Sediment Report 9 October 2015
report that included a best-fit equation of flow rate versus upstream water depth for each site that incorporated the data that was collected throughout the previous three years.
SITE LOCATIONS
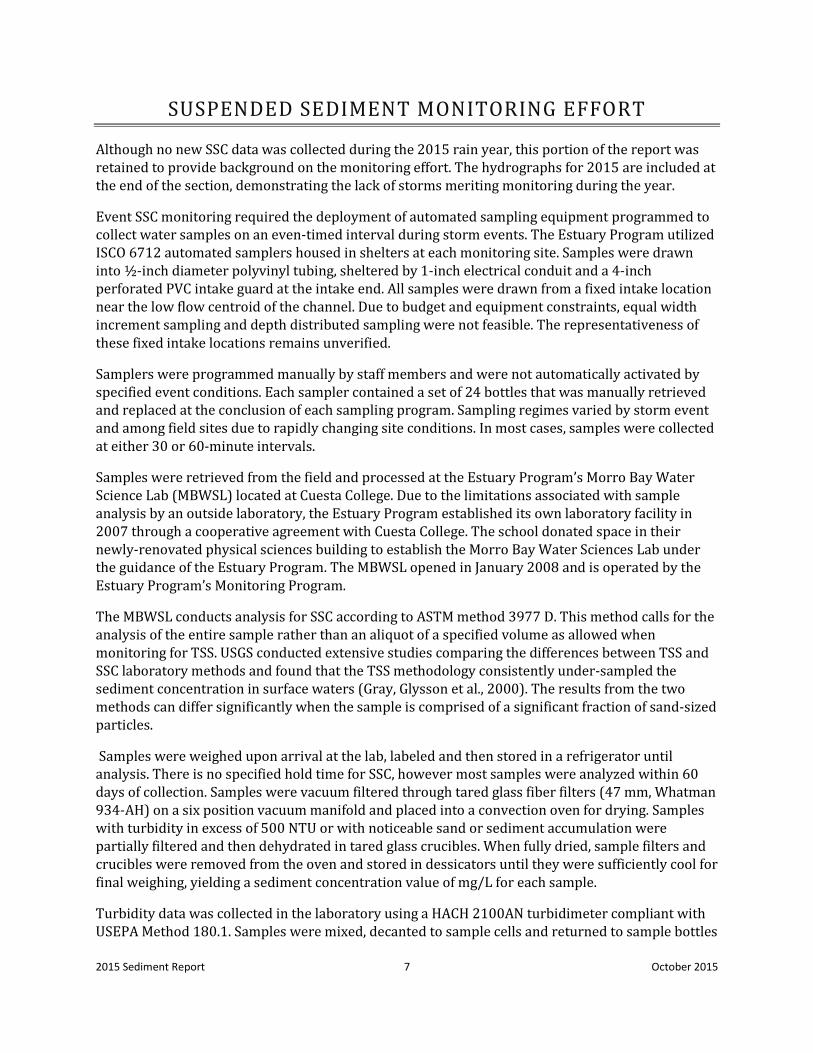
The Chorro Creek subwatershed drains runoff from approximately 43.4 square miles into Morro Bay and is estimated to contribute 86% of the total sediment load to Morro Bay (Tetra Tech, 1998). Three SSC monitoring sites in the Chorro Creek watershed were established that encompass a total watershed area of approximately 30 square miles. Monitoring sites are shown in Figure 1 below.
FIGURE 1: MORRO BAY SUSPENDED SEDIMENT STUDY AREA
SAN LUISITO CREEK AT ADOBE ROAD
The site located on San Luisito Creek at Adobe Road includes drainage from approximately 8.28 square miles dominated by rangeland with light residential use (Tetra Tech, 1998). San Luisito Creek is a major tributary to Chorro Creek and joins at a confluence downstream of the Canet Road station. The Adobe Road bridge over San Luisito Creek was constructed in 1951, and the gauging station was established by SLO County Engineering Department in 1985 (Station 775). The site is an active San Luis Obispo County gauging station and is equipped with an H-500 XL data logger and potentiometer. In 2007, ALERT capability (radio with antenna) was added to the site, providing real-time data acquisition via the existing County ALERT network. In 2007, the Estuary Program
2015 Sediment Report 10 October 2015
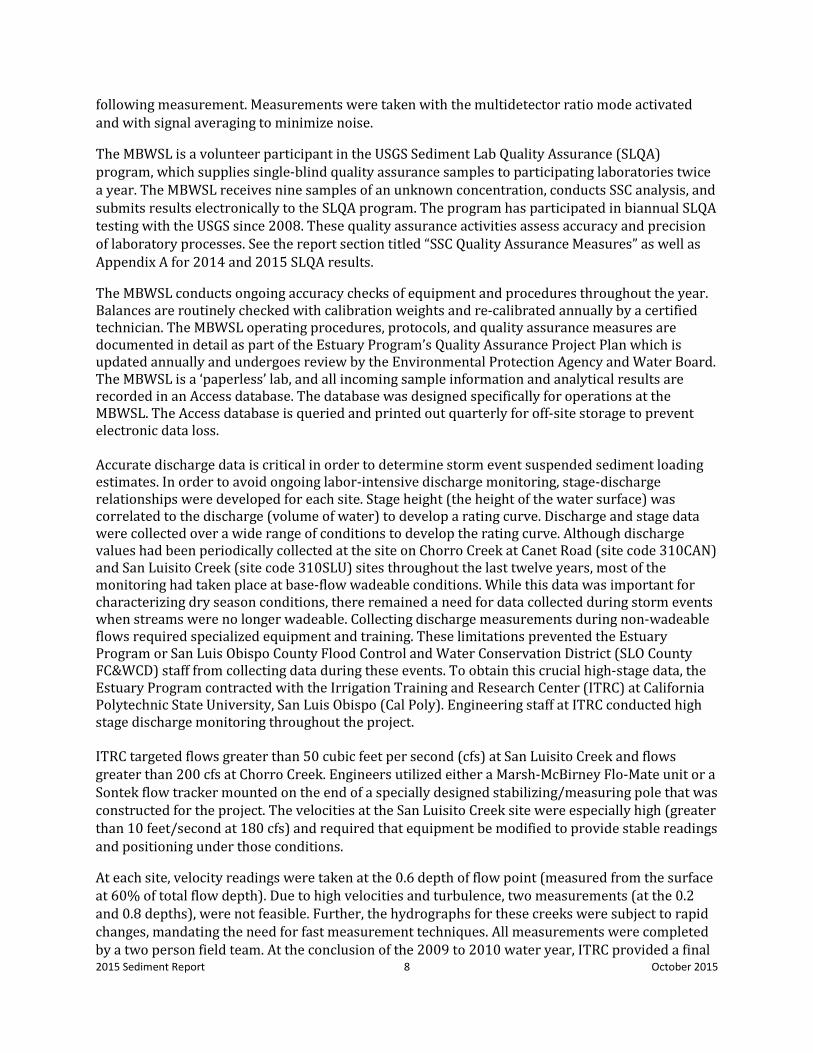
installed an ISCO 6712 automated sampler and an Esterline KPSI pressure transducer to facilitate SSC monitoring. A rain gauge was installed at the nearby 310CAN station. Due to site conditions and close proximity to the Canet Road station, an additional rain gauge was not installed at 310SLU. The site was fully operational starting at the 2007-2008 water year.
FIGURE 2: SAN LUISITO CREEK SUBWATERSHED MONITORING AREA
The design of the Adobe Road bridge crossing made the positioning of the sampler and sampling intake difficult. Sampling equipment was housed in a fiberglass shelter located on top of the bridge crossing. To instrument this configuration, the sampler intake line covered approximately 35 lateral feet with a 15 foot elevation gain. During low flows, San Luisito Creek flows through only one side of the double barrel bridge at a mean depth of about 0.02 feet. Positioning the intake along the center wall of the bridge would have prevented monitoring any events under approximately 7 cfs. Due to culvert sizing concerns and anadromous fish habitat regulations, construction of a flume or weir at the site was infeasible. After prolonged examination of all sampling intake options, a location was selected on the leading edge of one side of the concrete apron upstream of the crossing. This selection was made with acknowledgment of the risk of intake burial and the possibility of bedload sampling during major storm events. In order to reduce the amount of bedload being sampled in high flow events, another intake was installed directly on the culvert wall. This intake is approximately 0.45 feet from the channel bottom. Using the stage height – flow rate correlation (Figure 3), this stage height corresponds to flows of approximately 12.5 cfs. Bedload is commonly defined as sediment that is transported by sliding, rolling or bouncing along the stream bed. Depending on the size of particles comprising the stream bed, the bedload may resist scour by stream velocities during higher frequency storm events (Edwards & Glysson, 1999).

2015 Sediment Report 11 October 2015
The development of a rating curve was conducted by ITRC engineers from 2007 to 2010. High volume discharge measurements were conducted during storm events in December 2007, January 2008 and January 2010. The San Luisito Creek measurements were collected from atop the Adobe Road bridge over the creek. The creek flows through a 25 foot wide rectangular concrete channel under the bridge with a center wall. The 25 feet were divided into ten slices horizontally, and velocities were measured at relative 0.6 depths (rather than both 0.2 and 0.8) in each slice to be able to capture flows before they changed. At high flows, velocities were measured at relative 0.6 depths upstream of the center of each culvert. The velocity reading at the center of the culvert was assumed to be the average velocity in the culvert. All measurements were taken with either a SonTek Flow Tracker or a Marsh McBirney Flo-Mate (depending upon the flow condition and availability of devices). During a storm event at San Luisito Creek, the flow rate, in cfs, can be approximated by the equation
Q (cfs) = 50Y2
where Y is the depth of water (in feet, measured via stage height readings) minus channel bottom elevation (0.12 ft) above the reference datum. This equation was used to estimate discharge volumes during the storm events detailed in this report. The stage discharge relationship for San Luisito Creek is shown below in Figure 3. This equation was used in the San Luisito Creek hydrograph in this report (Figure 8).
FIGURE 3: SAN LUISITO CREEK STAGE AND FLOW RATE CORRELATION
0.0
100.0
200.0
300.0
400.0
500.0
600.0
0 0.5 1 1.5 2 2.5 3 3.5
Disc
harg
e (c
fs)
Stage (ft)
San Luisito Creek at 310SLU Rating Curve
2015 Sediment Report 12 October 2015
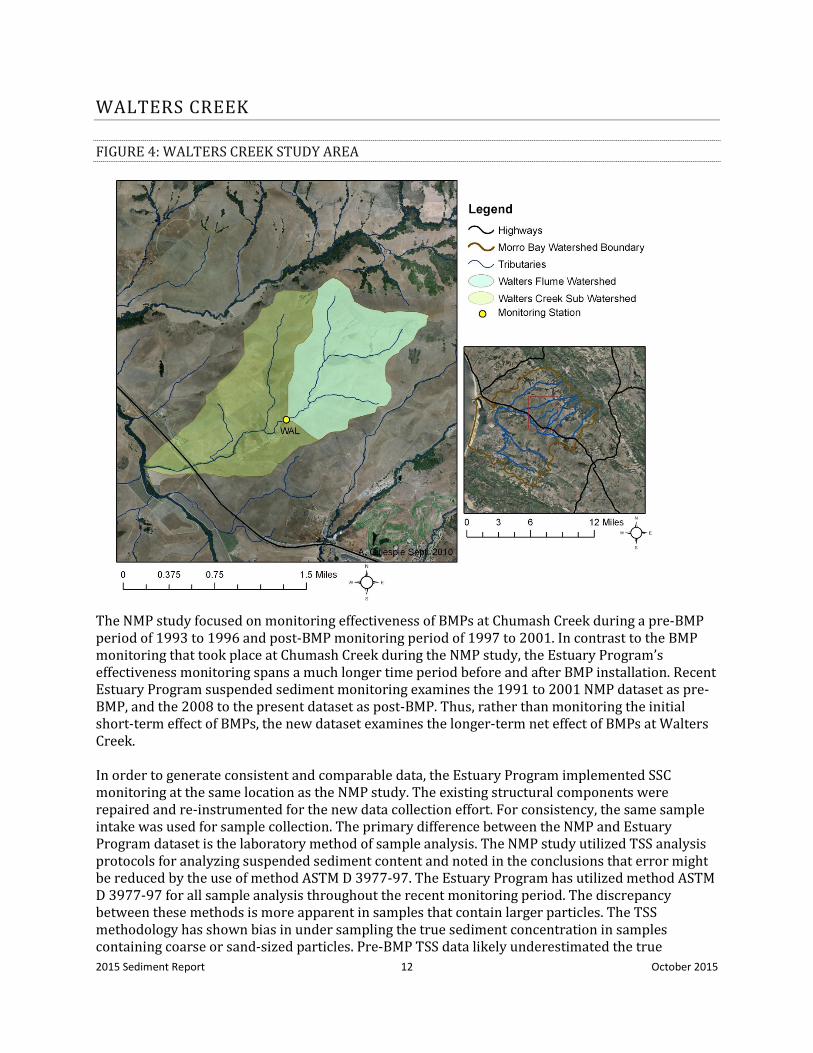
WALTERS CREEK
FIGURE 4: WALTERS CREEK STUDY AREA
The NMP study focused on monitoring effectiveness of BMPs at Chumash Creek during a pre-BMP period of 1993 to 1996 and post-BMP monitoring period of 1997 to 2001. In contrast to the BMP monitoring that took place at Chumash Creek during the NMP study, the Estuary Program’s effectiveness monitoring spans a much longer time period before and after BMP installation. Recent Estuary Program suspended sediment monitoring examines the 1991 to 2001 NMP dataset as pre-BMP, and the 2008 to the present dataset as post-BMP. Thus, rather than monitoring the initial short-term effect of BMPs, the new dataset examines the longer-term net effect of BMPs at Walters Creek. In order to generate consistent and comparable data, the Estuary Program implemented SSC monitoring at the same location as the NMP study. The existing structural components were repaired and re-instrumented for the new data collection effort. For consistency, the same sample intake was used for sample collection. The primary difference between the NMP and Estuary Program dataset is the laboratory method of sample analysis. The NMP study utilized TSS analysis protocols for analyzing suspended sediment content and noted in the conclusions that error might be reduced by the use of method ASTM D 3977-97. The Estuary Program has utilized method ASTM D 3977-97 for all sample analysis throughout the recent monitoring period. The discrepancy between these methods is more apparent in samples that contain larger particles. The TSS methodology has shown bias in under sampling the true sediment concentration in samples containing coarse or sand-sized particles. Pre-BMP TSS data likely underestimated the true
2015 Sediment Report 13 October 2015
concentration of suspended sediment, but the site specific relationship between TSS and SSC data is unknown. The Walters Creek monitoring station was re-equipped and operational for the 2008-2009 water year. However, the 2008-2009 water year did not generate any surface flows in Walters Creek. The 2009-2010 water year generated substantial surface flows during a few prolonged storm events. Analysis was conducted for two large storm events in January 2010. Following those events, the site has not been monitored due to lack of sustained flows.
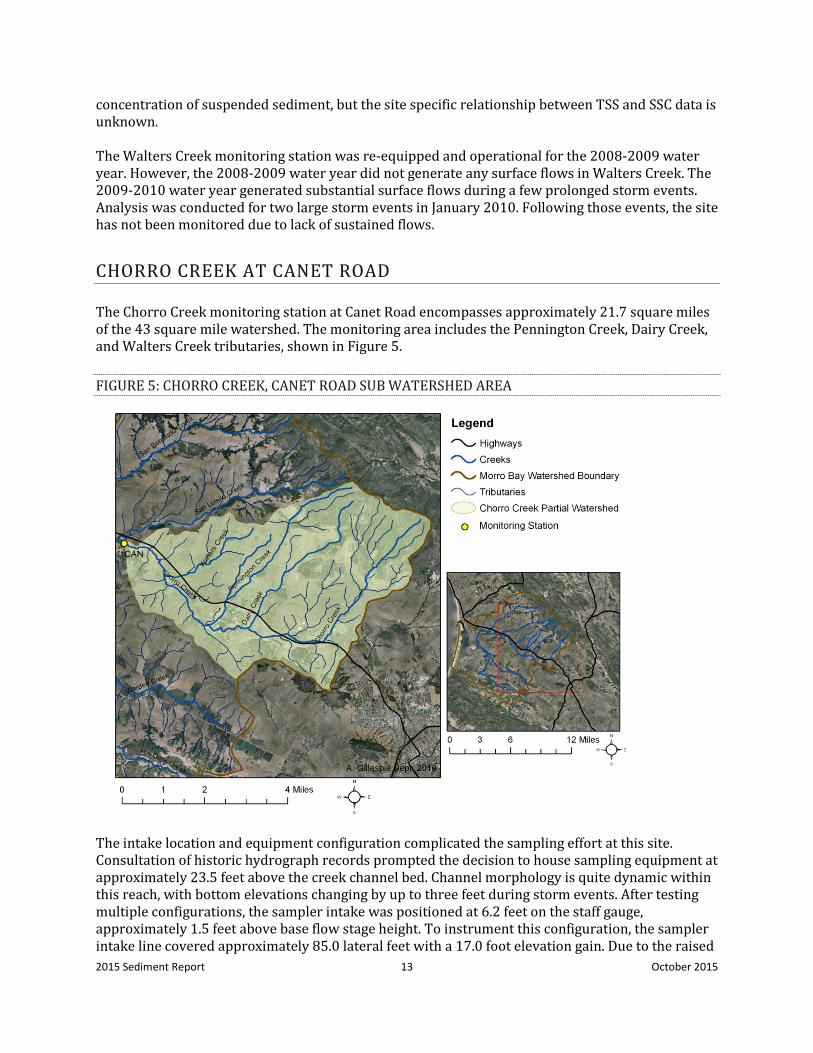
CHORRO CREEK AT CANET ROAD
The Chorro Creek monitoring station at Canet Road encompasses approximately 21.7 square miles of the 43 square mile watershed. The monitoring area includes the Pennington Creek, Dairy Creek, and Walters Creek tributaries, shown in Figure 5.
FIGURE 5: CHORRO CREEK, CANET ROAD SUB WATERSHED AREA
The intake location and equipment configuration complicated the sampling effort at this site. Consultation of historic hydrograph records prompted the decision to house sampling equipment at approximately 23.5 feet above the creek channel bed. Channel morphology is quite dynamic within this reach, with bottom elevations changing by up to three feet during storm events. After testing multiple configurations, the sampler intake was positioned at 6.2 feet on the staff gauge, approximately 1.5 feet above base flow stage height. To instrument this configuration, the sampler intake line covered approximately 85.0 lateral feet with a 17.0 foot elevation gain. Due to the raised
2015 Sediment Report 14 October 2015
elevation of the sampler intake, small storm events did not consistently submerge the intake to enable sampling. The dynamic morphology of the channel bottom at this site were challenging to all parties involved in the project. Fluctuations in channel bottom elevation prohibited the creation of a highly reliable stage discharge relationship. However, it was determined that efforts to quantify high stage discharge volumes would still be a valuable component of the project.
Discharge monitoring at 310CAN was conducted by ITRC engineers throughout the project. High volume discharge measurements were conducted during storm events in December 2007, January 2008 and January 2010. Analysis of field measurements determined that two unique equations were necessary to approximate flow rates at the site during storm events. For stage heights below 12.10 feet, the flow rate in ft3/s can be approximated by: Q (cfs) = 26Y1.8 where Y is the depth of water (in feet, recorded by the bubbler gauge) minus channel bottom elevation (3.75 ft) above the reference datum.
For recorded stage heights between 12.1 feet and 13.2 feet, the estimated Q was 1,200 cfs. This is the case when the culverts are full, and the water is not overtopping the bridge.
When the water has overtopped the bridge at heights above 13.2 feet, the following equation is applied:
Q (cfs) = 1200 + 88 [(H -13.2) + 0.326]2.1
where H is the staff gauge reference without adjustment for the channel bottom elevation. The extra water over the bridge was estimated using a complex weir equation. WinFlume software was used to create the equation. The stage discharge relationship for stage heights below 12.1 feet is shown in Figure 7.

2015 Sediment Report 15 October 2015
FIGURE 6: ORIGINAL CHORRO CREEK STAGE DISCHARGE RELATIONSHIP
During the analysis of the data for this report, potential inaccuracies of the discharge calculations at low flows were identified. It was determined that this was caused by insufficient low flow data points on the rating curve and the inability of the curve to approach 0 cfs at low stage. Fifteen low flow discharge values from Estuary Program monitoring and the corresponding San Luis Obispo County Flood Control stage records were added to the curve. In the March 2010 ITRC Streamflow Measurement Summary Report, three discharge and stage values were not included in their rating curve. It is unknown why they were included in the curve above but excluded from the report. These three data points were also removed from the rating curve in Figure 7.
0
200
400
600
800
1000
1200
1400
2 4 6 8 10 12 14
Dish
carg
e (c
fs)
Stage (ft)
Chorro Creek at 310CAN Rating Curve
2015 Sediment Report 16 October 2015
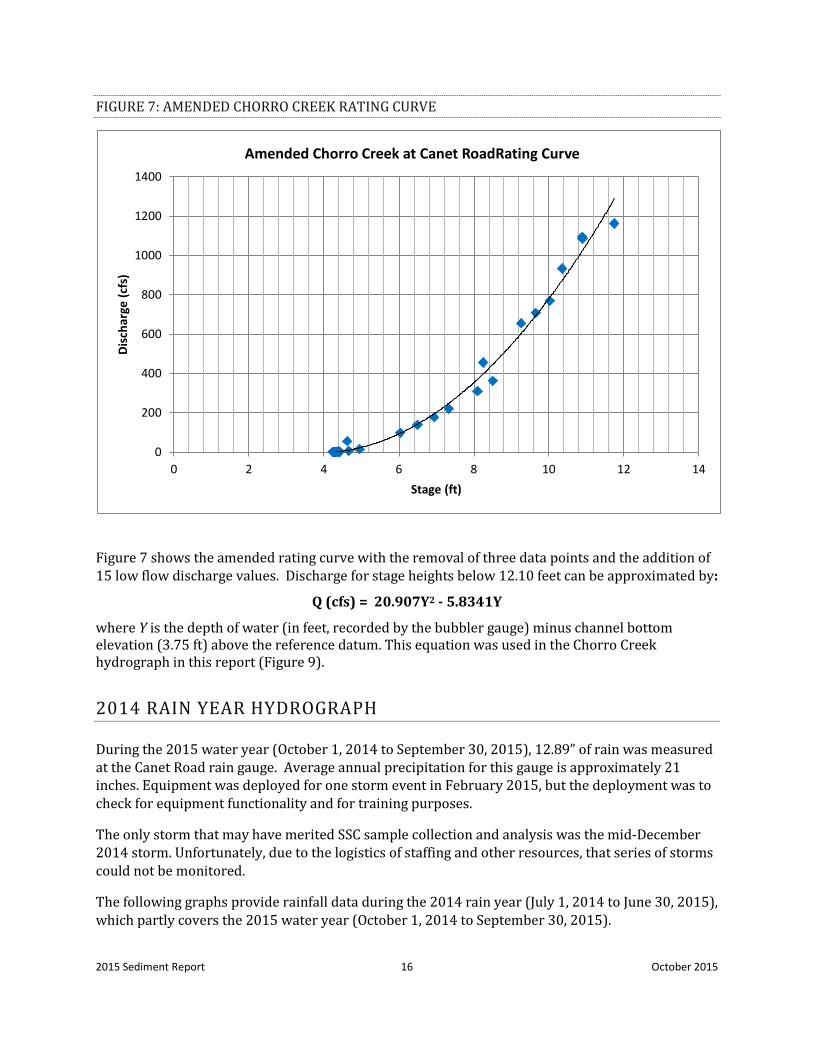
FIGURE 7: AMENDED CHORRO CREEK RATING CURVE
Figure 7 shows the amended rating curve with the removal of three data points and the addition of 15 low flow discharge values. Discharge for stage heights below 12.10 feet can be approximated by:
Q (cfs) = 20.907Y2 - 5.8341Y
where Y is the depth of water (in feet, recorded by the bubbler gauge) minus channel bottom elevation (3.75 ft) above the reference datum. This equation was used in the Chorro Creek hydrograph in this report (Figure 9).
2014 RAIN YEAR HYDROGRAPH
During the 2015 water year (October 1, 2014 to September 30, 2015), 12.89” of rain was measured at the Canet Road rain gauge. Average annual precipitation for this gauge is approximately 21 inches. Equipment was deployed for one storm event in February 2015, but the deployment was to check for equipment functionality and for training purposes.
The only storm that may have merited SSC sample collection and analysis was the mid-December 2014 storm. Unfortunately, due to the logistics of staffing and other resources, that series of storms could not be monitored.
The following graphs provide rainfall data during the 2014 rain year (July 1, 2014 to June 30, 2015), which partly covers the 2015 water year (October 1, 2014 to September 30, 2015).
0
200
400
600
800
1000
1200
1400
0 2 4 6 8 10 12 14
Disc
harg
e (c
fs)
Stage (ft)
Amended Chorro Creek at Canet RoadRating Curve
2015 Sediment Report 17 October 2015
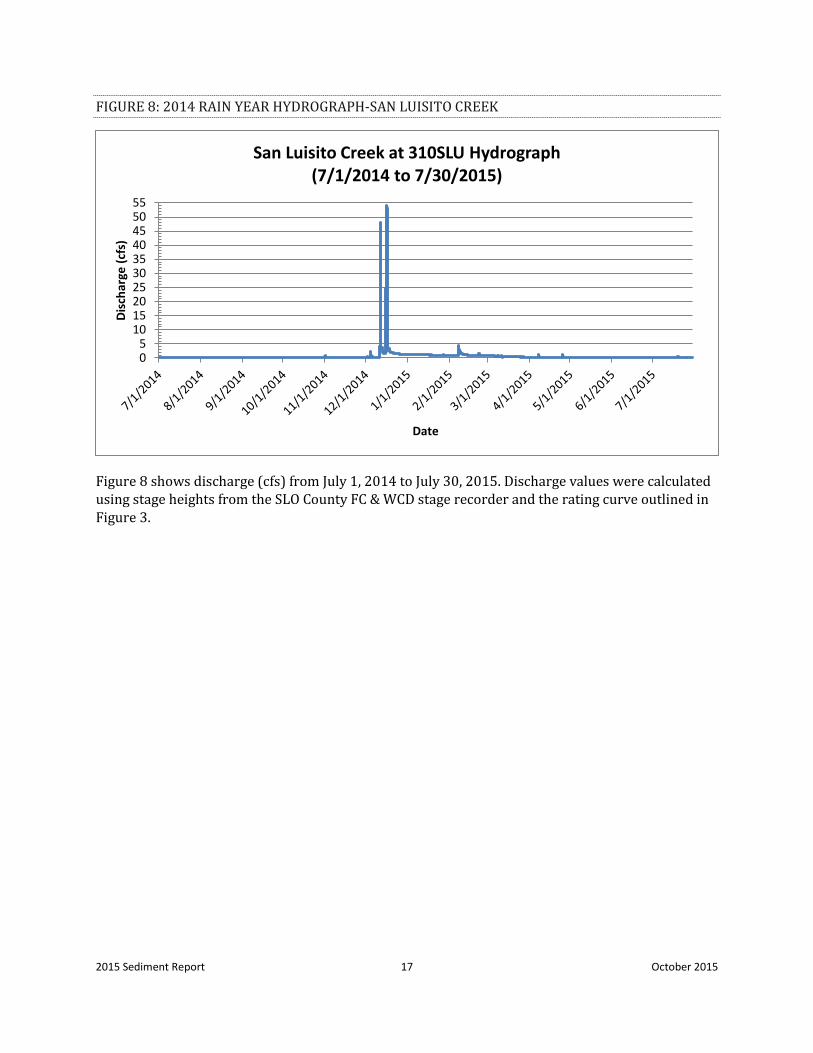
FIGURE 8: 2014 RAIN YEAR HYDROGRAPH-SAN LUISITO CREEK
Figure 8 shows discharge (cfs) from July 1, 2014 to July 30, 2015. Discharge values were calculated using stage heights from the SLO County FC & WCD stage recorder and the rating curve outlined in Figure 3.
05
10152025303540455055
Disc
harg
e (c
fs)
Date
San Luisito Creek at 310SLU Hydrograph (7/1/2014 to 7/30/2015)
2015 Sediment Report 18 October 2015
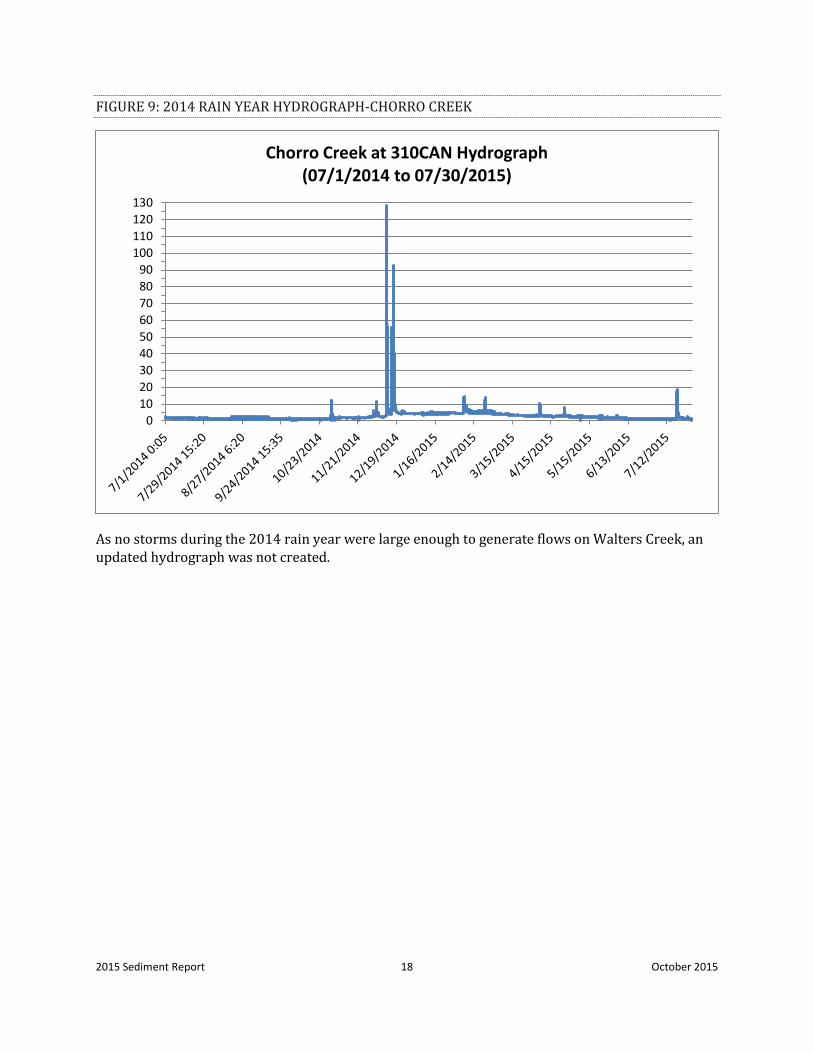
FIGURE 9: 2014 RAIN YEAR HYDROGRAPH-CHORRO CREEK
As no storms during the 2014 rain year were large enough to generate flows on Walters Creek, an updated hydrograph was not created.
0102030405060708090
100110120130
Chorro Creek at 310CAN Hydrograph (07/1/2014 to 07/30/2015)
2015 Sediment Report 19 October 2015
CROSS SECTION PROFILING
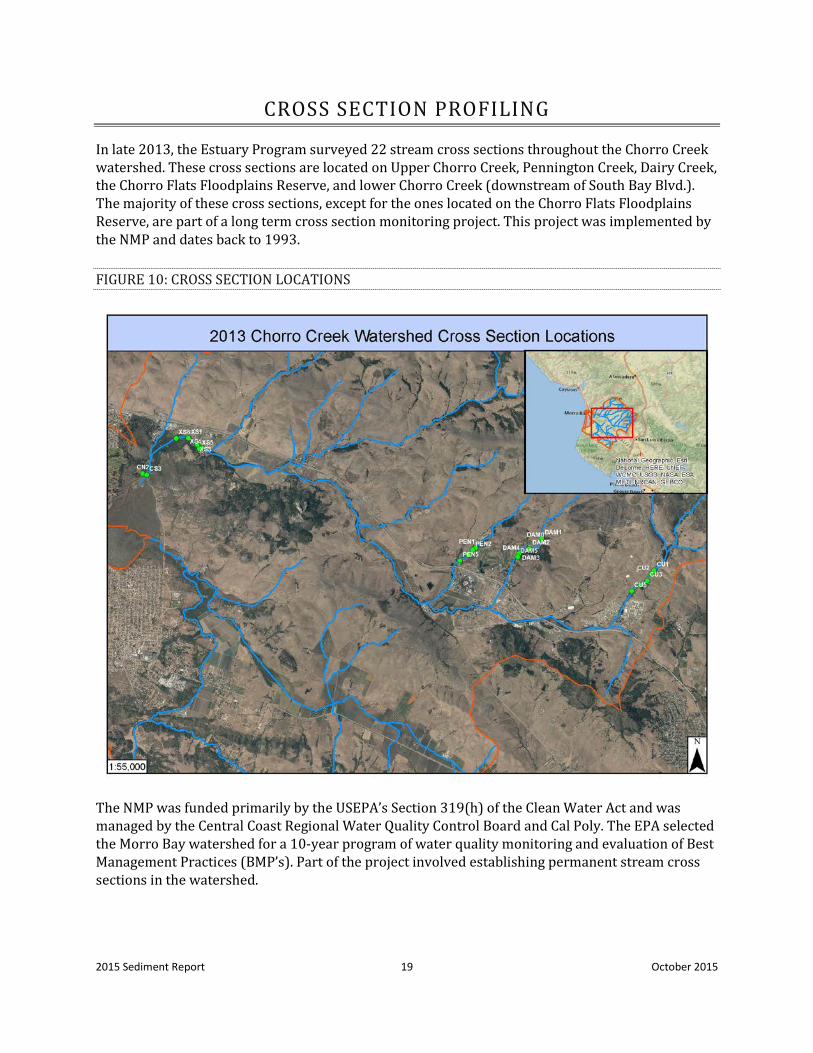
In late 2013, the Estuary Program surveyed 22 stream cross sections throughout the Chorro Creek watershed. These cross sections are located on Upper Chorro Creek, Pennington Creek, Dairy Creek, the Chorro Flats Floodplains Reserve, and lower Chorro Creek (downstream of South Bay Blvd.). The majority of these cross sections, except for the ones located on the Chorro Flats Floodplains Reserve, are part of a long term cross section monitoring project. This project was implemented by the NMP and dates back to 1993.
FIGURE 10: CROSS SECTION LOCATIONS
The NMP was funded primarily by the USEPA’s Section 319(h) of the Clean Water Act and was managed by the Central Coast Regional Water Quality Control Board and Cal Poly. The EPA selected the Morro Bay watershed for a 10-year program of water quality monitoring and evaluation of Best Management Practices (BMP’s). Part of the project involved establishing permanent stream cross sections in the watershed.
2015 Sediment Report 20 October 2015
CHORRO FLATS FLOODPLAIN RESERVE
The Chorro Flats Enhancement Project was implemented by the Coastal San Luis Resource Conservation District (CSLRCD) in 1997 to reduce the sediment load into Morro Bay. This project reconnected Chorro Creek to its original floodplain to facilitate sediment deposition onto the floodplain (Crawford, Multari, & Starr et al. 1993b). Part of this project included the construction of 4,340 feet of new channel. In 1997, 21 cross sections were surveyed on the newly-constructed and original channel to determine if the channel was developing a stable configuration. These cross sections were then resurveyed in 1998. Six of the 21 cross sections surveyed in 1997 and 1998 were included in the CSLRCD’s 2002 “Chorro Flats Final Report.”
In 2008, students from UC Berkeley attempted to resurvey the original cross sections in an effort to determine the effectiveness of the project. The only records found on the location of the cross sections was a map from the 2002 CSLRCD report that displayed the approximate locations of the cross sections. They were able to find and resurvey two of the original cross sections using the map, and they established five new cross sections in the same location and recorded their location with GPS coordinates. The CSLRCD only had data for one of the original cross sections surveyed by the UC Berkeley students.
In 2013, the Estuary Program also attempted to find and resurvey the original 21 cross sections, as well as those established by the UC Berkeley students. The Estuary Program found elevation data for most of the original 21 cross sections in the RCD archives, but could not find location coordinates.
To determine the general location of the original cross sections, the map from the “Chorro Flats Final Report” was georeferenced in ArcGIS, and latitude and longitude locations were produced. Using these coordinates, the Estuary Program attempted to find the locations of the 21 original cross sections. Only one (Cross Section XS4) was found and included in this report. MBNEP staff did find and resurvey four of the cross sections established by the UC Berkeley students in 2008, and these are included in this report.
RESULTS
The 2013 cross section results are illustrated in the following maps and graphs. In order to simplify the analysis for this report, five years of cross section data were used for comparison, unless otherwise noted. The years chosen for analysis were based on data availability, data quality and an even distribution of years between surveys.
2015 Sediment Report 21 October 2015
FIGURE 11: UPPER CHORRO CREEK RESULTS
2015 Sediment Report 22 October 2015
FIGURE 12: CHORRO FLATS RESULTS
2015 Sediment Report 23 October 2015
FIGURE 13: DAIRY CREEK RESULTS
2015 Sediment Report 24 October 2015
FIGURE 14: PENNINGTON CREEK RESULTS
2015 Sediment Report 25 October 2015
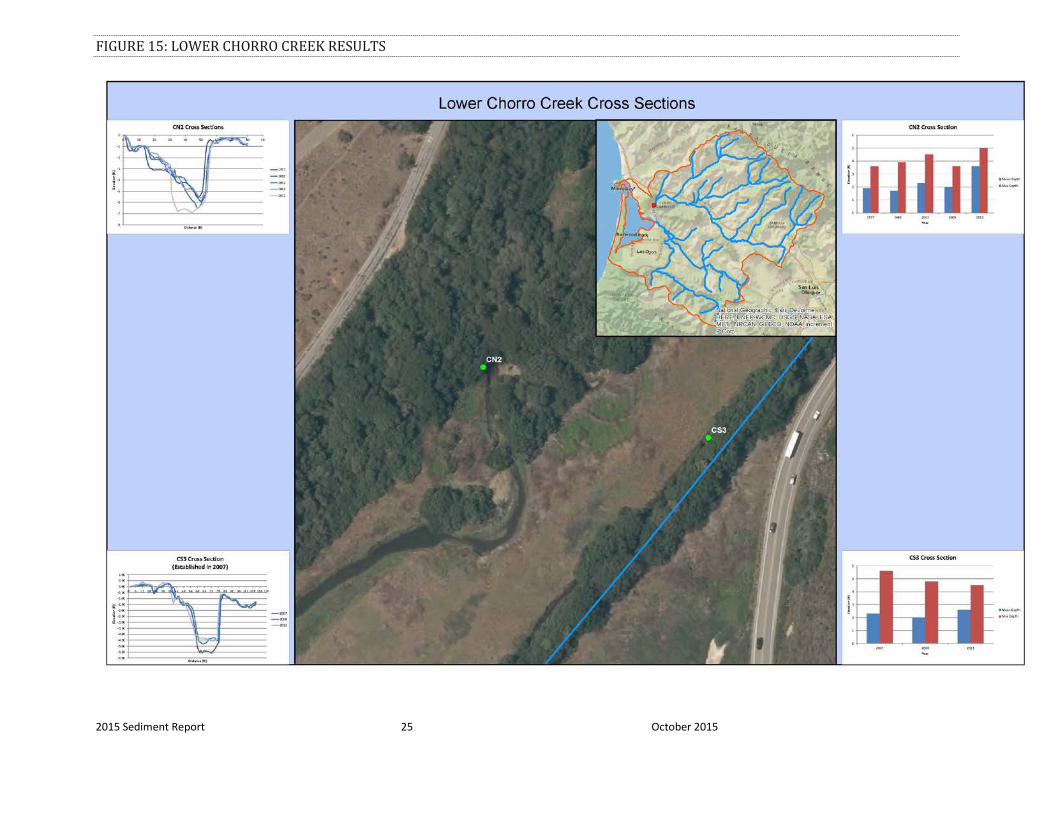
FIGURE 15: LOWER CHORRO CREEK RESULTS
2015 Sediment Report 26 October 2015
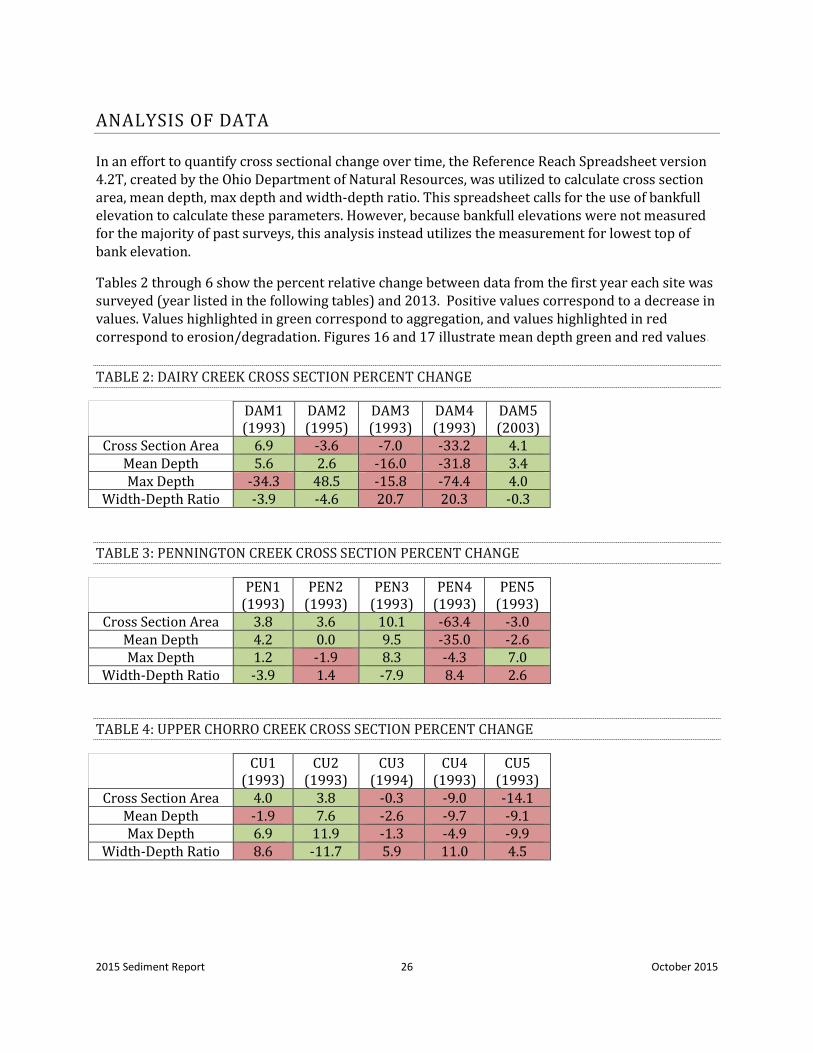
ANALYSIS OF DATA
In an effort to quantify cross sectional change over time, the Reference Reach Spreadsheet version 4.2T, created by the Ohio Department of Natural Resources, was utilized to calculate cross section area, mean depth, max depth and width-depth ratio. This spreadsheet calls for the use of bankfull elevation to calculate these parameters. However, because bankfull elevations were not measured for the majority of past surveys, this analysis instead utilizes the measurement for lowest top of bank elevation.
Tables 2 through 6 show the percent relative change between data from the first year each site was surveyed (year listed in the following tables) and 2013. Positive values correspond to a decrease in values. Values highlighted in green correspond to aggregation, and values highlighted in red correspond to erosion/degradation. Figures 16 and 17 illustrate mean depth green and red values.
TABLE 2: DAIRY CREEK CROSS SECTION PERCENT CHANGE
DAM1 (1993)
DAM2 (1995)
DAM3 (1993)
DAM4 (1993)
DAM5 (2003)
Cross Section Area 6.9 -3.6 -7.0 -33.2 4.1 Mean Depth 5.6 2.6 -16.0 -31.8 3.4 Max Depth -34.3 48.5 -15.8 -74.4 4.0
Width-Depth Ratio -3.9 -4.6 20.7 20.3 -0.3
TABLE 3: PENNINGTON CREEK CROSS SECTION PERCENT CHANGE
PEN1
(1993) PEN2
(1993) PEN3
(1993) PEN4
(1993) PEN5
(1993) Cross Section Area 3.8 3.6 10.1 -63.4 -3.0
Mean Depth 4.2 0.0 9.5 -35.0 -2.6 Max Depth 1.2 -1.9 8.3 -4.3 7.0
Width-Depth Ratio -3.9 1.4 -7.9 8.4 2.6
TABLE 4: UPPER CHORRO CREEK CROSS SECTION PERCENT CHANGE
CU1
(1993) CU2
(1993) CU3
(1994) CU4
(1993) CU5
(1993) Cross Section Area 4.0 3.8 -0.3 -9.0 -14.1
Mean Depth -1.9 7.6 -2.6 -9.7 -9.1 Max Depth 6.9 11.9 -1.3 -4.9 -9.9
Width-Depth Ratio 8.6 -11.7 5.9 11.0 4.5
2015 Sediment Report 27 October 2015
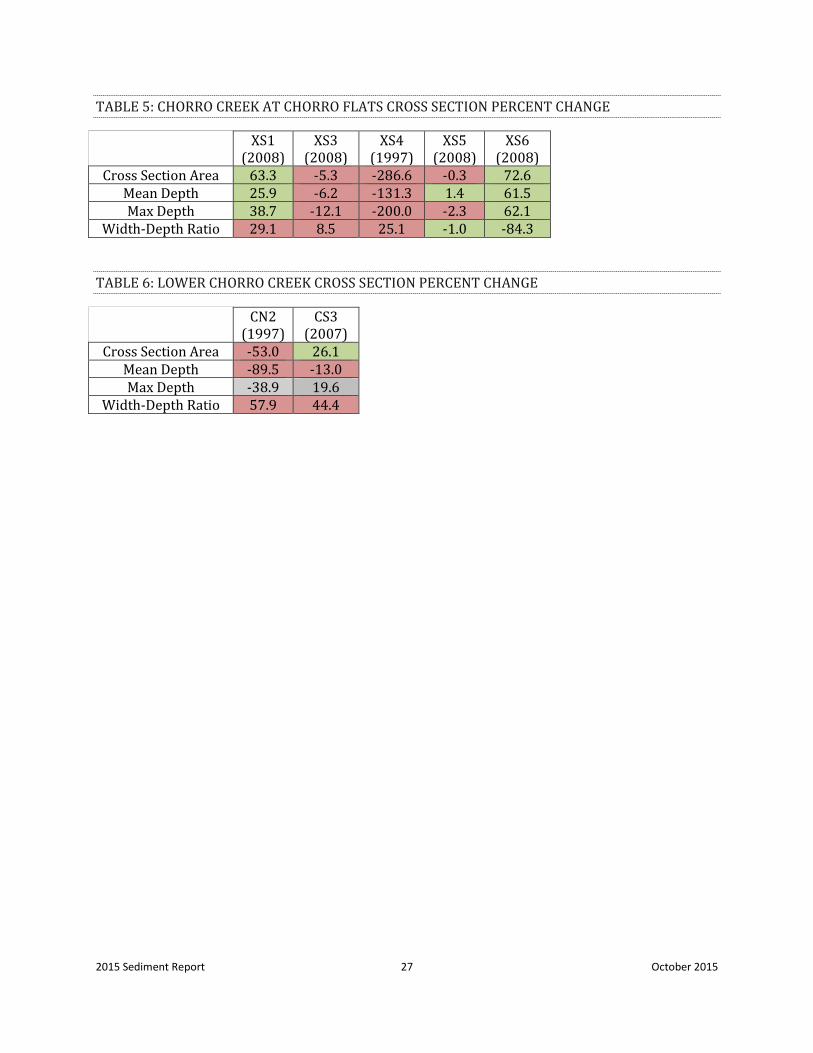
TABLE 5: CHORRO CREEK AT CHORRO FLATS CROSS SECTION PERCENT CHANGE
XS1
(2008) XS3
(2008) XS4
(1997) XS5
(2008) XS6
(2008) Cross Section Area 63.3 -5.3 -286.6 -0.3 72.6
Mean Depth 25.9 -6.2 -131.3 1.4 61.5 Max Depth 38.7 -12.1 -200.0 -2.3 62.1
Width-Depth Ratio 29.1 8.5 25.1 -1.0 -84.3
TABLE 6: LOWER CHORRO CREEK CROSS SECTION PERCENT CHANGE
CN2
(1997) CS3
(2007) Cross Section Area -53.0 26.1
Mean Depth -89.5 -13.0 Max Depth -38.9 19.6
Width-Depth Ratio 57.9 44.4
2015 Sediment Report 28 October 2015
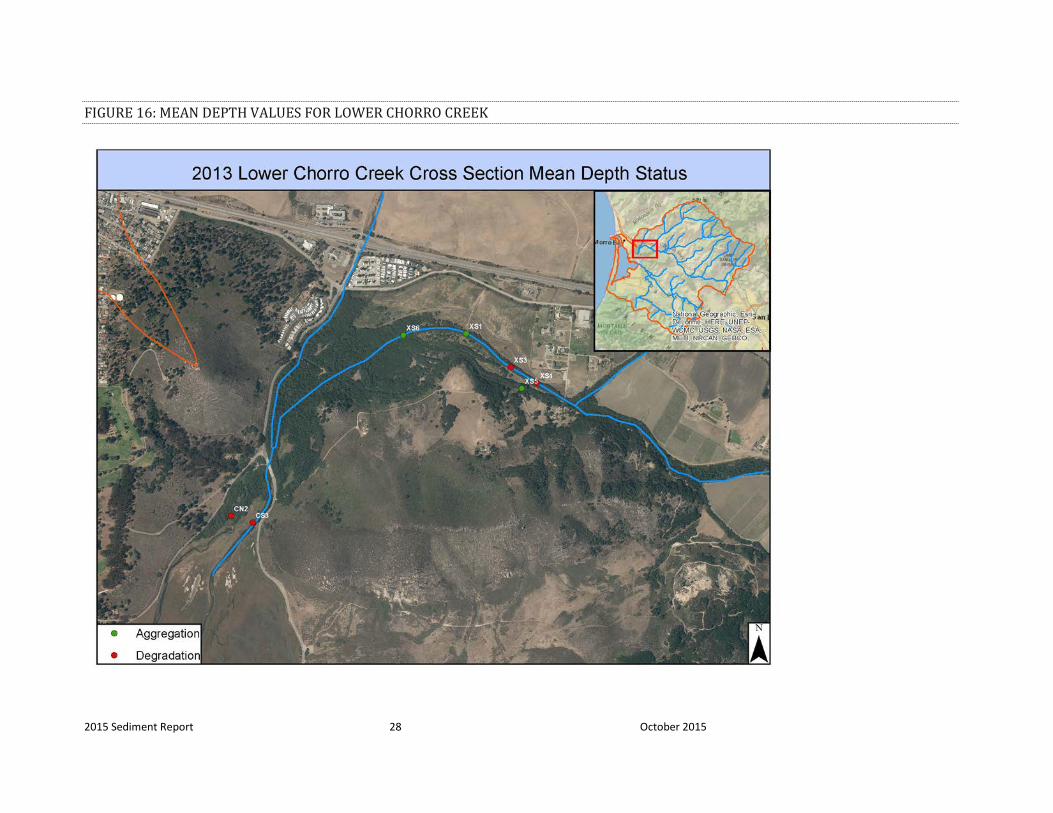
FIGURE 16: MEAN DEPTH VALUES FOR LOWER CHORRO CREEK
2015 Sediment Report 29 October 2015
FIGURE 17: MEAN DEPTH VALUES FOR UPPER CHORRO CREEK
2015 Sediment Report 30 October 2015
DISCUSSION
Slightly less than half of all cross sections had an increase in mean depth throughout the monitoring period. With the exception of Chorro Flats, these cross sections were generally located on the upstream portion of each study reach. This is especially evident on Pennington Creek, where four of the 12 increasing mean depth cross sections are located. Of the upper study reaches, DAM4 showed the greatest percent increase of maximum depth at 74.4%. DAM4 incised approximately 3 feet. While no study reach stands out in terms of channel instability, Upper Chorro Creek did have the greatest number of cross sections with an increase in cross section area, mean depth, maximum depth, and width to depth ratio. Channel characteristics on Upper Chorro Creek could possibly be highly influenced by Chorro Reservoir water releases and a deficiency in sediment. XS4, the only cross section to be monitored in every Chorro Flats Flood Plain monitoring event, showed great channel instability since 1997, the year of new channel construction. However in recent years, it has shown relative channel stability.
2015 Sediment Report 31 October 2015
STREAMBED SEDIMENT IMPAIRMENT INDICATORS
The relationship between aquatic health in a watershed and impacts due to sediment loading is of great interest in the regulation of sediment. Over a three-year period, researchers from the Sierra Nevada Aquatic Research Laboratory (SNARL) (associated with the University of California) conducted research to develop numeric targets for sediment impairment and biological thresholds in riverine systems in the Central Coast region. Although these criteria were not specifically developed for the Morro Bay watershed, they are being evaluated for assessments throughout the Central Coast region. Initial analysis shows that the indicators are applicable in the Central Coast region.
An extensive number of indices were tested across a gradient of test sites. The final outcome included 16 indicators of sediment impairment on aquatic habitat. The indicators cover both the physical characteristics (sediment) and the biological community.
A significant data collection effort is required to determine the status of all 16 sediment and biological indicators for a study reach. The current SWAMP Bioassessment Protocol (SWAMP, 2007) metrics can be used to generate seven of the nine (in bold) sediment indicators, and six of the seven biological indicators (in bold). Since Estuary Program monitoring is conducted per the SWAMP protocol, only the indicators in bold in the list below are available for analysis. There are three threshold criteria for comparison of each of these indicators, shown in Table 7.
Sediment Indicators:
1. Percent of Fines (F) on transects 2. Percent of Sand (S) on transects 3. Percent of Fines (F) + Percent of Sands (S) on transects 4. Percent of Fines, Sands and Gravels < 8mm on transects 5. D50 Median particle size 6. Percent patch-scale grid Fines and Sands 7. Log Relative Bed Stability 8. Percent of Fines (Steelhead) 9. Percent Cover of Fines and Sands (BMI Limits)
Biological Indicators
1. Total Richness 2. EPT Richness 3. %EPT 4. Biotic Index 5. Percent Tolerant 6. Sensitive Number 7. Crayfish Number and Size
2015 Sediment Report 32 October 2015
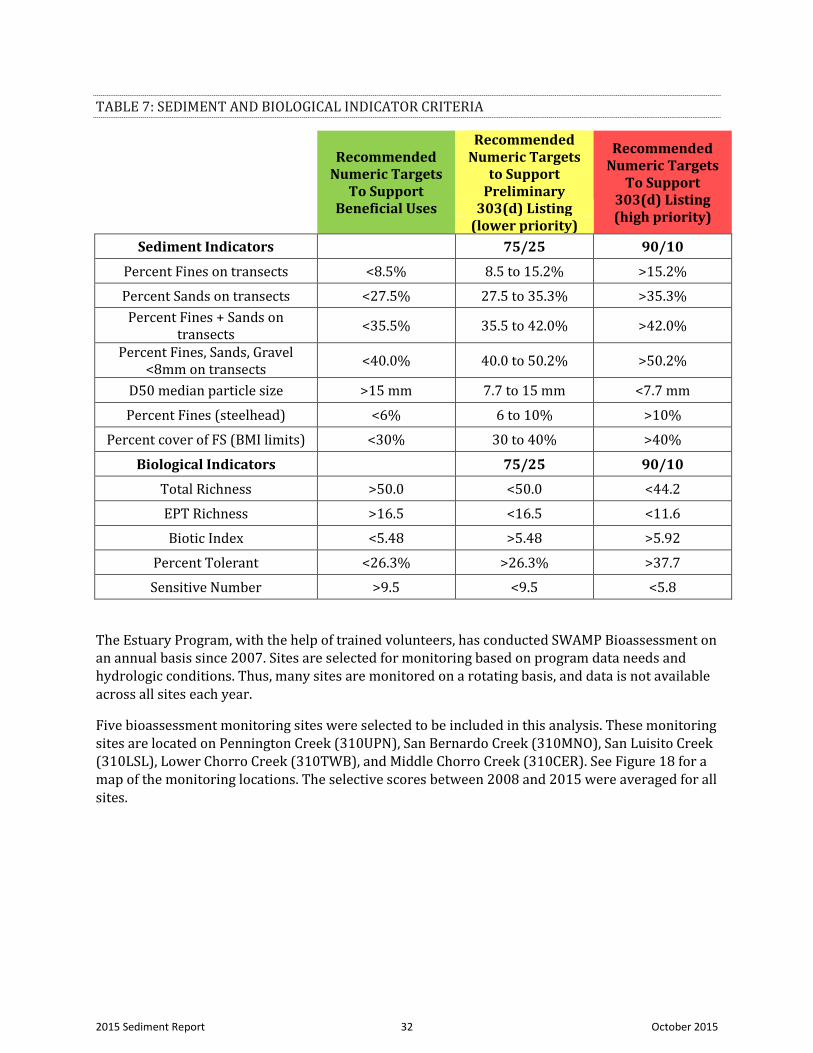
TABLE 7: SEDIMENT AND BIOLOGICAL INDICATOR CRITERIA
Recommended Numeric Targets
To Support Beneficial Uses
Recommended Numeric Targets
to Support Preliminary
Recommended Numeric Targets
To Support 303(d) Listing (high priority) 303(d) Listing
(lower priority) Sediment Indicators 75/25 90/10
Percent Fines on transects <8.5% 8.5 to 15.2% >15.2%
Percent Sands on transects <27.5% 27.5 to 35.3% >35.3% Percent Fines + Sands on
transects <35.5% 35.5 to 42.0% >42.0%
Percent Fines, Sands, Gravel <8mm on transects <40.0% 40.0 to 50.2% >50.2%
D50 median particle size >15 mm 7.7 to 15 mm <7.7 mm
Percent Fines (steelhead) <6% 6 to 10% >10%
Percent cover of FS (BMI limits) <30% 30 to 40% >40%
Biological Indicators 75/25 90/10
Total Richness >50.0 <50.0 <44.2
EPT Richness >16.5 <16.5 <11.6
Biotic Index <5.48 >5.48 >5.92
Percent Tolerant <26.3% >26.3% >37.7
Sensitive Number >9.5 <9.5 <5.8
The Estuary Program, with the help of trained volunteers, has conducted SWAMP Bioassessment on an annual basis since 2007. Sites are selected for monitoring based on program data needs and hydrologic conditions. Thus, many sites are monitored on a rotating basis, and data is not available across all sites each year.
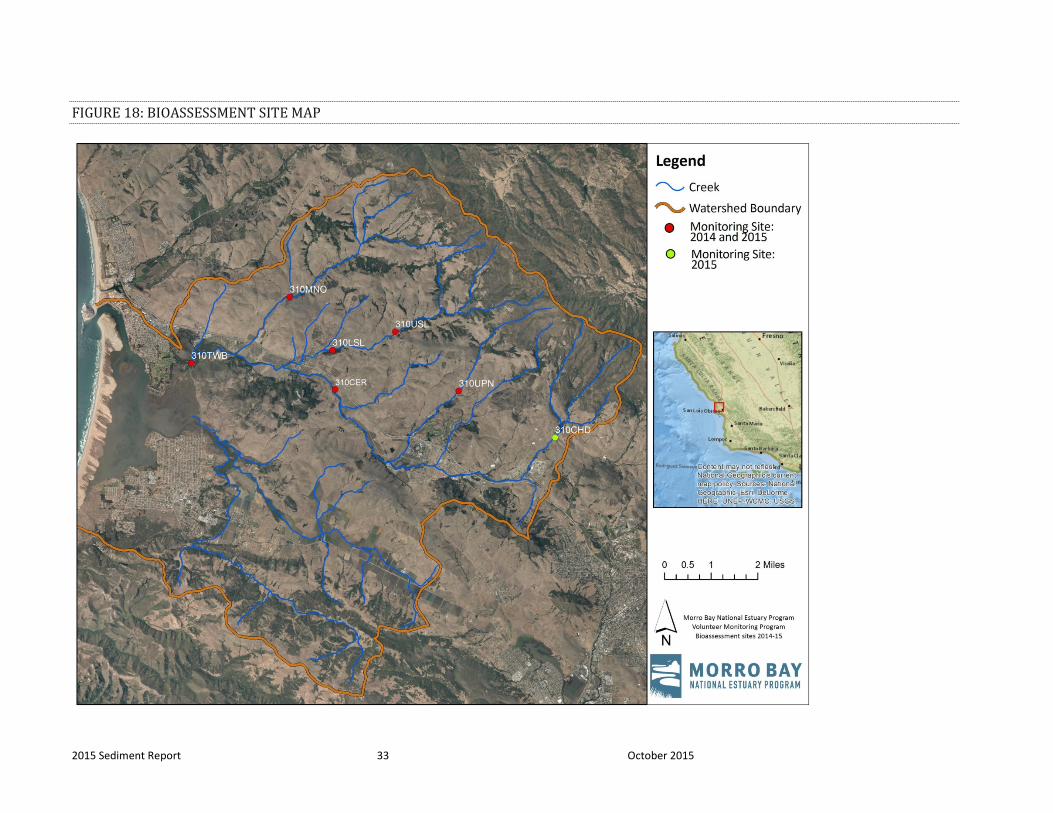
Five bioassessment monitoring sites were selected to be included in this analysis. These monitoring sites are located on Pennington Creek (310UPN), San Bernardo Creek (310MNO), San Luisito Creek (310LSL), Lower Chorro Creek (310TWB), and Middle Chorro Creek (310CER). See Figure 18 for a map of the monitoring locations. The selective scores between 2008 and 2015 were averaged for all sites.
2015 Sediment Report 33 October 2015
FIGURE 18: BIOASSESSMENT SITE MAP
2015 Sediment Report 34 October 2015
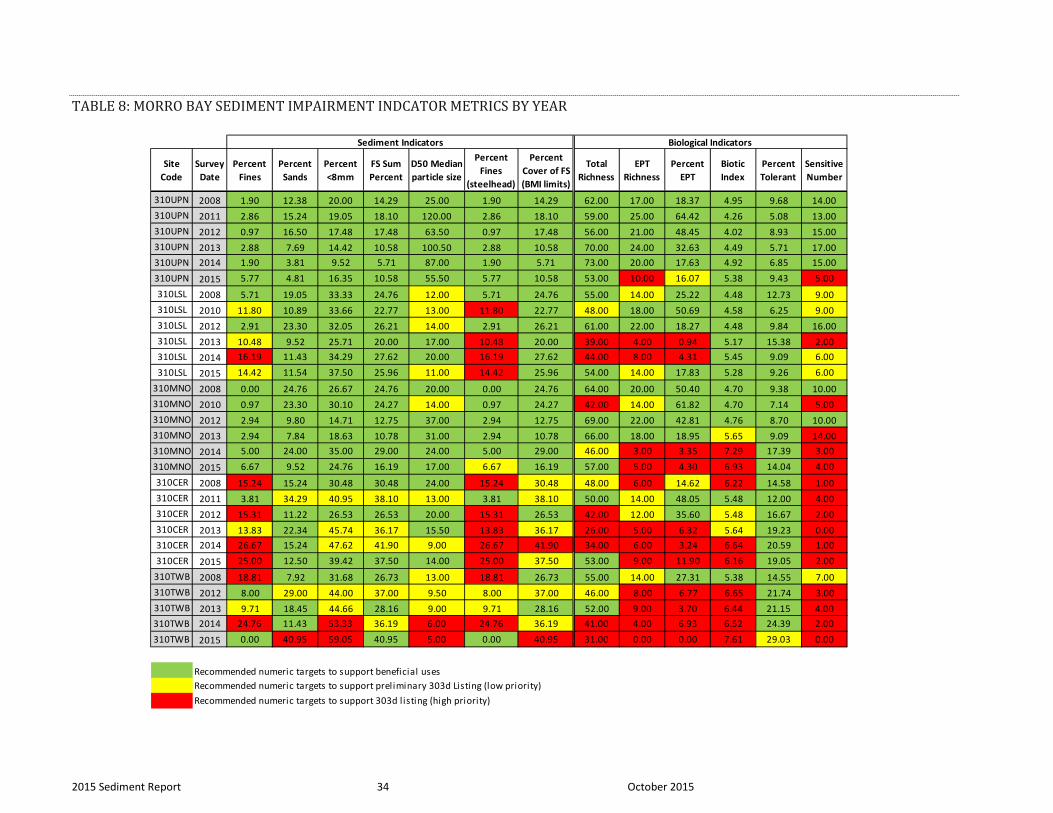
TABLE 8: MORRO BAY SEDIMENT IMPAIRMENT INDCATOR METRICS BY YEAR
Site Code
Survey Date
Percent Fines
Percent Sands
Percent <8mm
FS Sum Percent
D50 Median particle size
Percent Fines
(steelhead)
Percent Cover of FS (BMI limits)
Total Richness
EPT Richness
Percent EPT
Biotic Index
Percent Tolerant
Sensitive Number
310UPN 2008 1.90 12.38 20.00 14.29 25.00 1.90 14.29 62.00 17.00 18.37 4.95 9.68 14.00310UPN 2011 2.86 15.24 19.05 18.10 120.00 2.86 18.10 59.00 25.00 64.42 4.26 5.08 13.00310UPN 2012 0.97 16.50 17.48 17.48 63.50 0.97 17.48 56.00 21.00 48.45 4.02 8.93 15.00310UPN 2013 2.88 7.69 14.42 10.58 100.50 2.88 10.58 70.00 24.00 32.63 4.49 5.71 17.00310UPN 2014 1.90 3.81 9.52 5.71 87.00 1.90 5.71 73.00 20.00 17.63 4.92 6.85 15.00310UPN 2015 5.77 4.81 16.35 10.58 55.50 5.77 10.58 53.00 10.00 16.07 5.38 9.43 5.00310LSL 2008 5.71 19.05 33.33 24.76 12.00 5.71 24.76 55.00 14.00 25.22 4.48 12.73 9.00310LSL 2010 11.80 10.89 33.66 22.77 13.00 11.80 22.77 48.00 18.00 50.69 4.58 6.25 9.00310LSL 2012 2.91 23.30 32.05 26.21 14.00 2.91 26.21 61.00 22.00 18.27 4.48 9.84 16.00310LSL 2013 10.48 9.52 25.71 20.00 17.00 10.48 20.00 39.00 4.00 0.94 5.17 15.38 2.00310LSL 2014 16.19 11.43 34.29 27.62 20.00 16.19 27.62 44.00 8.00 4.31 5.45 9.09 6.00310LSL 2015 14.42 11.54 37.50 25.96 11.00 14.42 25.96 54.00 14.00 17.83 5.28 9.26 6.00
310MNO 2008 0.00 24.76 26.67 24.76 20.00 0.00 24.76 64.00 20.00 50.40 4.70 9.38 10.00310MNO 2010 0.97 23.30 30.10 24.27 14.00 0.97 24.27 42.00 14.00 61.82 4.70 7.14 5.00310MNO 2012 2.94 9.80 14.71 12.75 37.00 2.94 12.75 69.00 22.00 42.81 4.76 8.70 10.00310MNO 2013 2.94 7.84 18.63 10.78 31.00 2.94 10.78 66.00 18.00 18.95 5.65 9.09 14.00310MNO 2014 5.00 24.00 35.00 29.00 24.00 5.00 29.00 46.00 3.00 3.35 7.29 17.39 3.00310MNO 2015 6.67 9.52 24.76 16.19 17.00 6.67 16.19 57.00 5.00 4.30 6.93 14.04 4.00310CER 2008 15.24 15.24 30.48 30.48 24.00 15.24 30.48 48.00 6.00 14.62 6.22 14.58 1.00310CER 2011 3.81 34.29 40.95 38.10 13.00 3.81 38.10 50.00 14.00 48.05 5.48 12.00 4.00310CER 2012 15.31 11.22 26.53 26.53 20.00 15.31 26.53 42.00 12.00 35.60 5.48 16.67 2.00310CER 2013 13.83 22.34 45.74 36.17 15.50 13.83 36.17 26.00 5.00 6.32 5.64 19.23 0.00310CER 2014 26.67 15.24 47.62 41.90 9.00 26.67 41.90 34.00 6.00 3.24 6.64 20.59 1.00310CER 2015 25.00 12.50 39.42 37.50 14.00 25.00 37.50 53.00 9.00 11.90 6.16 19.05 2.00
310TWB 2008 18.81 7.92 31.68 26.73 13.00 18.81 26.73 55.00 14.00 27.31 5.38 14.55 7.00310TWB 2012 8.00 29.00 44.00 37.00 9.50 8.00 37.00 46.00 8.00 6.77 6.65 21.74 3.00310TWB 2013 9.71 18.45 44.66 28.16 9.00 9.71 28.16 52.00 9.00 3.70 6.44 21.15 4.00310TWB 2014 24.76 11.43 53.33 36.19 6.00 24.76 36.19 41.00 4.00 6.93 6.52 24.39 2.00310TWB 2015 0.00 40.95 59.05 40.95 5.00 0.00 40.95 31.00 0.00 0.00 7.61 29.03 0.00
Recommended numeric targets to support beneficial usesRecommended numeric targets to support preliminary 303d Listing (low priority)Recommended numeric targets to support 303d l isting (high priority)
Sediment Indicators Biological Indicators
2015 Sediment Report 35 October 2015
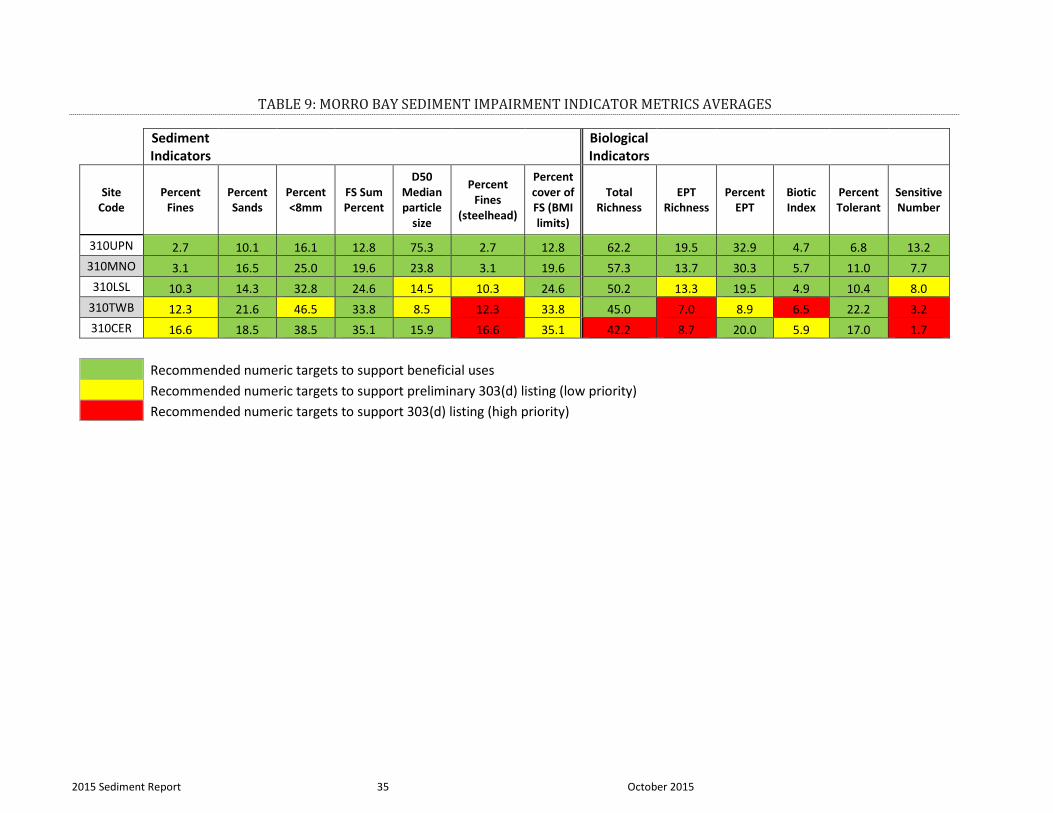
TABLE 9: MORRO BAY SEDIMENT IMPAIRMENT INDICATOR METRICS AVERAGES
Sediment Indicators
Biological Indicators
Site Code
Percent Fines
Percent Sands
Percent <8mm
FS Sum Percent
D50 Median particle
size
Percent Fines
(steelhead)
Percent cover of FS (BMI limits)
Total Richness
EPT Richness
Percent EPT
Biotic Index
Percent Tolerant
Sensitive Number
310UPN 2.7 10.1 16.1 12.8 75.3 2.7 12.8 62.2 19.5 32.9 4.7 6.8 13.2 310MNO 3.1 16.5 25.0 19.6 23.8 3.1 19.6 57.3 13.7 30.3 5.7 11.0 7.7 310LSL 10.3 14.3 32.8 24.6 14.5 10.3 24.6 50.2 13.3 19.5 4.9 10.4 8.0
310TWB 12.3 21.6 46.5 33.8 8.5 12.3 33.8 45.0 7.0 8.9 6.5 22.2 3.2 310CER 16.6 18.5 38.5 35.1 15.9 16.6 35.1 42.2 8.7 20.0 5.9 17.0 1.7
Recommended numeric targets to support beneficial uses Recommended numeric targets to support preliminary 303(d) listing (low priority)
Recommended numeric targets to support 303(d) listing (high priority)
2015 Sediment Report 36 October 2015
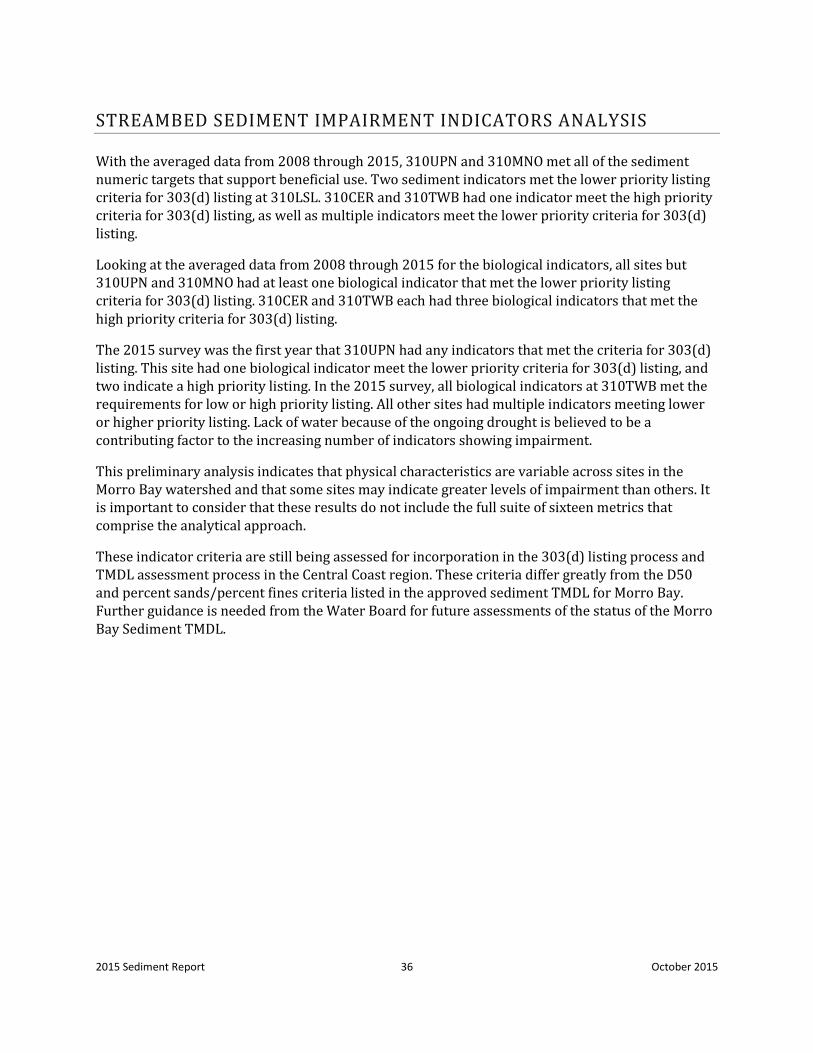
STREAMBED SEDIMENT IMPAIRMENT INDICATORS ANALYSIS
With the averaged data from 2008 through 2015, 310UPN and 310MNO met all of the sediment numeric targets that support beneficial use. Two sediment indicators met the lower priority listing criteria for 303(d) listing at 310LSL. 310CER and 310TWB had one indicator meet the high priority criteria for 303(d) listing, as well as multiple indicators meet the lower priority criteria for 303(d) listing.
Looking at the averaged data from 2008 through 2015 for the biological indicators, all sites but 310UPN and 310MNO had at least one biological indicator that met the lower priority listing criteria for 303(d) listing. 310CER and 310TWB each had three biological indicators that met the high priority criteria for 303(d) listing.
The 2015 survey was the first year that 310UPN had any indicators that met the criteria for 303(d) listing. This site had one biological indicator meet the lower priority criteria for 303(d) listing, and two indicate a high priority listing. In the 2015 survey, all biological indicators at 310TWB met the requirements for low or high priority listing. All other sites had multiple indicators meeting lower or higher priority listing. Lack of water because of the ongoing drought is believed to be a contributing factor to the increasing number of indicators showing impairment.
This preliminary analysis indicates that physical characteristics are variable across sites in the Morro Bay watershed and that some sites may indicate greater levels of impairment than others. It is important to consider that these results do not include the full suite of sixteen metrics that comprise the analytical approach.
These indicator criteria are still being assessed for incorporation in the 303(d) listing process and TMDL assessment process in the Central Coast region. These criteria differ greatly from the D50 and percent sands/percent fines criteria listed in the approved sediment TMDL for Morro Bay. Further guidance is needed from the Water Board for future assessments of the status of the Morro Bay Sediment TMDL.

2015 Sediment Report 37 October 2015
SEDIMENT ELEVATION TABLES
In addition to measurements of sediment transport and effects within the Morro Bay watershed, numerous sediment accretion sampling stations have been established in the salt marsh and mudflats. Surface Elevation Tables (SETs) and marker horizons were established in 2004 to measure sedimentation rates and establish a baseline for long term measurements.
Six surface elevation sampling stations were established in the salt marsh along three transects (A, B & C) in January of 2004. Additional sampling stations were constructed in the intertidal mudflats at elevations below each of the marsh sampling stations. Four additional mudflat stations were established around the shoreline of the bay in October of 2004. Stations are illustrated in Figure 19.
Measurements were conducted on a variable frequency by staff at the Department of Environmental Science from the University of San Francisco in 2004, 2007 and 2010. The results from these surveys were detailed in the Estuary Program’s 2011 sediment report. Monitoring was conducted in October 2015, but results were not available for inclusion in this report.
FIGURE 19: MAP OF ALL MORRO BAY SETS & HORIZON MARKERS
2015 Sediment Report 38 October 2015
SSC QUALITY ASSURANCE MEASURES
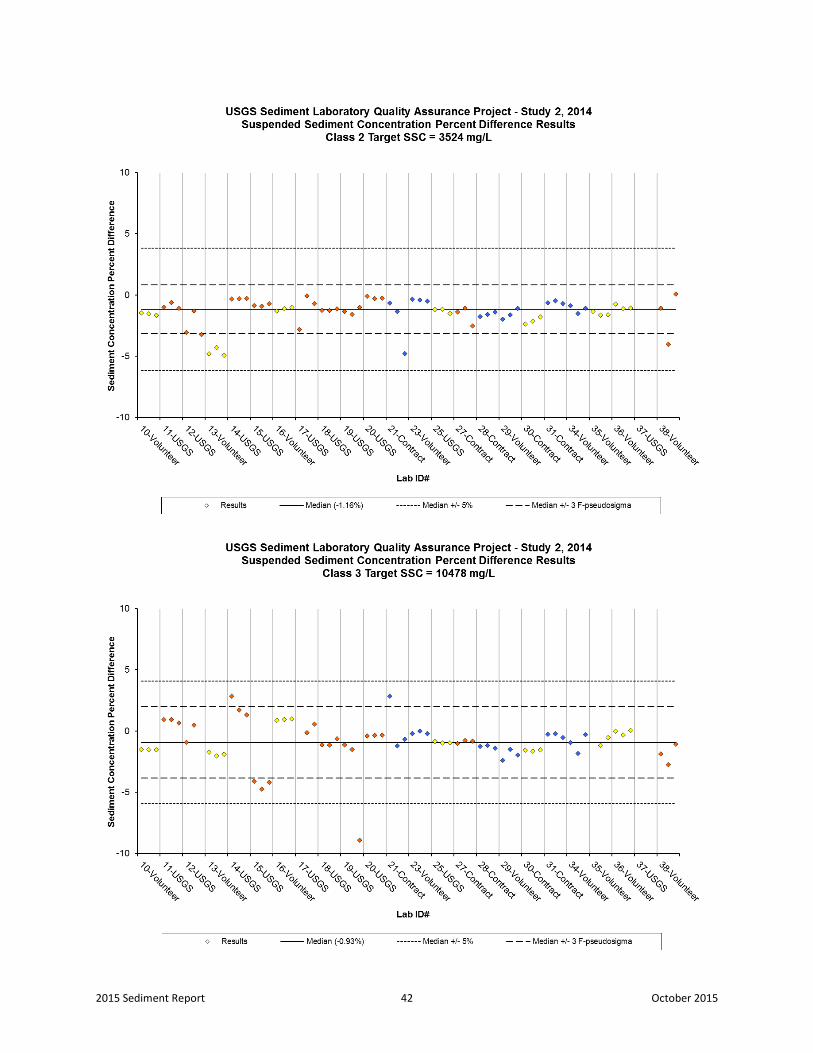
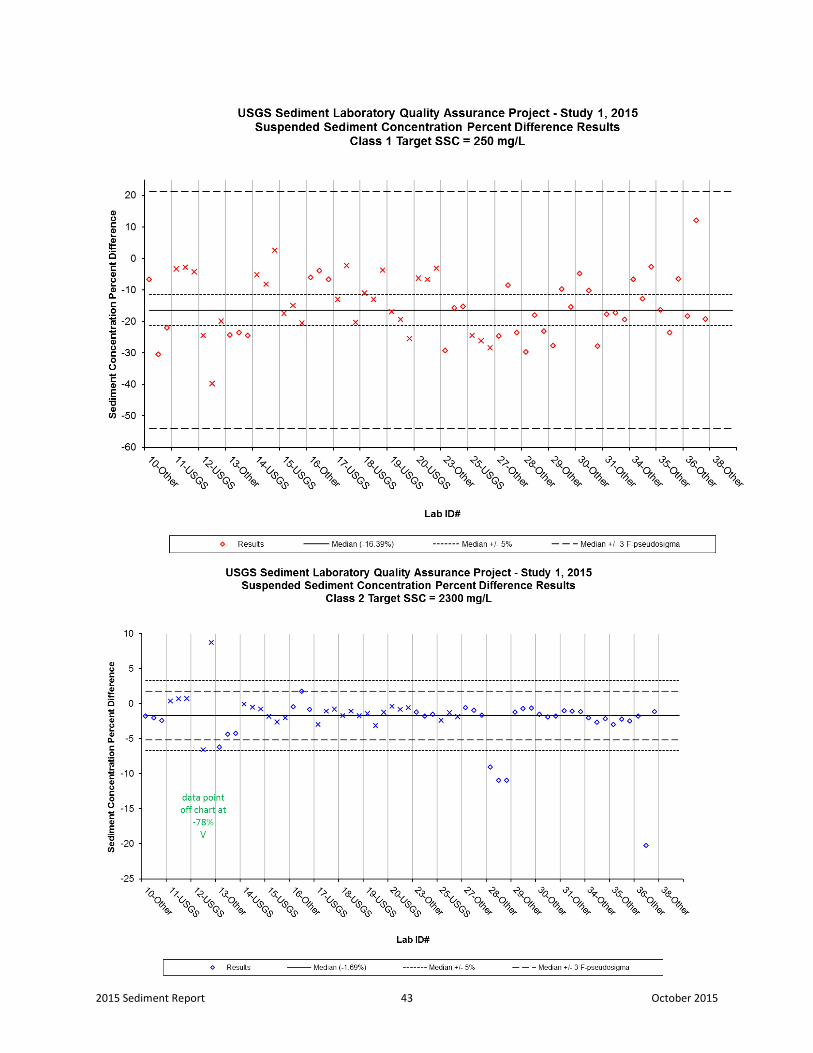
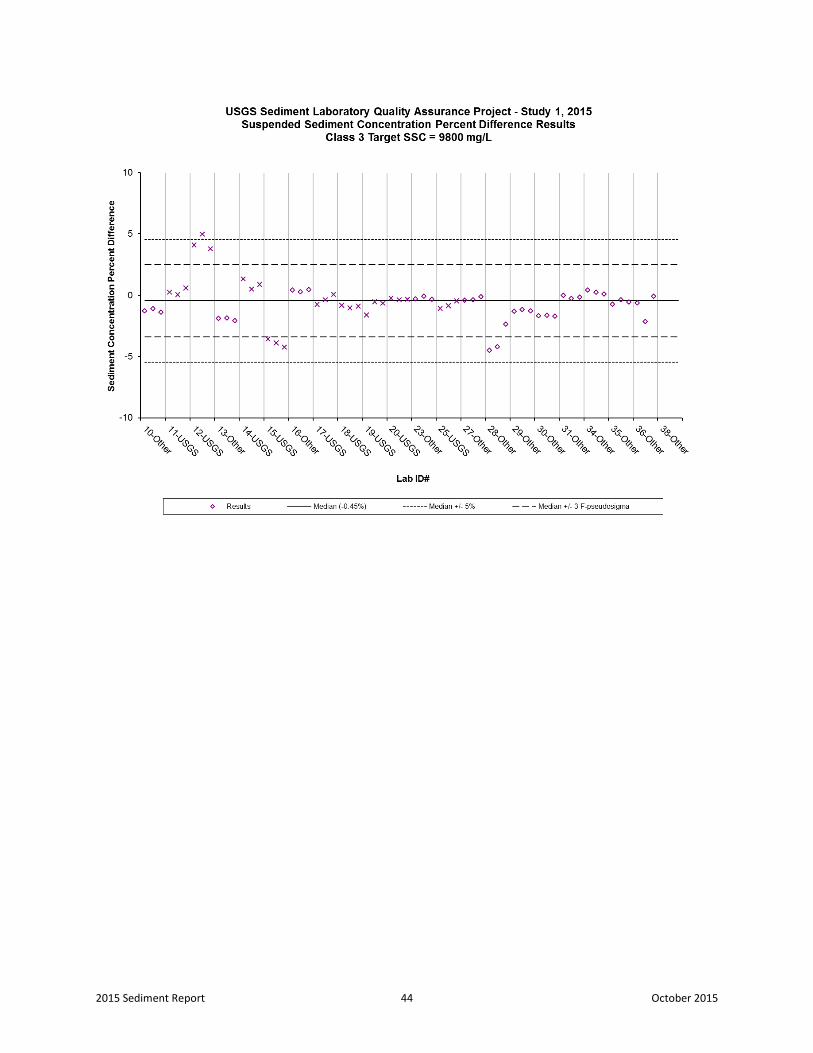
As part of efforts to ensure the quality of SSC data, the Estuary Program participates in the SLQA Project with the USGS Branch of Quality Systems. The USGS lab creates single-blind samples for SSC analysis by labs across the country. USGS provides triplicate samples from three ranges of sediment concentrations, one of which needs to be analyzed using a sand/fine split procedure. The individual labs analyze the samples and send the results to the USGS, which then compiles a summary report with results from all participating labs. This biannual quality control check provides an opportunity to verify that lab protocols, techniques, supplies and equipment are not introducing errors into the sample analysis process. The Estuary Program has participated in this QA program since the spring of 2008. The results from the fall 2014 and the spring 2015 rounds of SLQA testing are provided in Appendix A.
USGS presents the results as a sediment concentration percent difference, which is a measure of the difference between the known concentration of sediment in the prepared sample compared to the amount of sediment recovered by the individual lab. The results are usually negative percentages because typically sample is lost in the measurement process, rather than contamination being added to the sample. The results also provide a median percent difference value of all of the results as compared to the known sediment concentrations.
2015 Sediment Report 39 October 2015
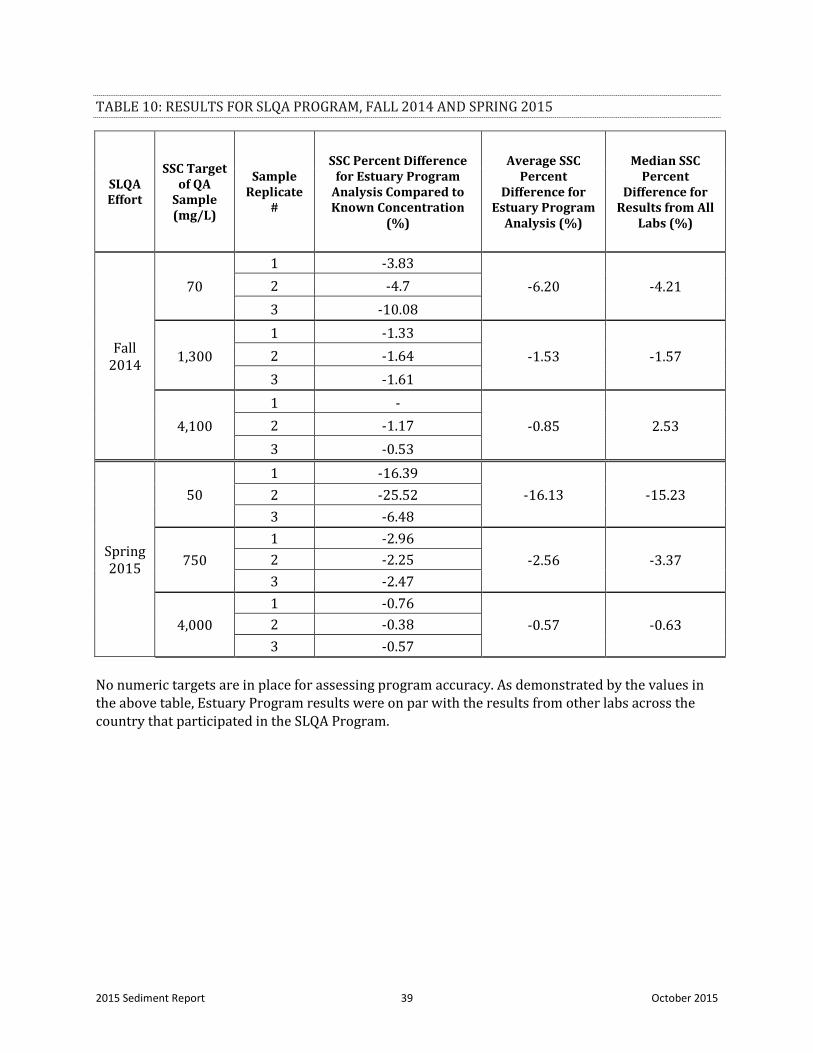
TABLE 10: RESULTS FOR SLQA PROGRAM, FALL 2014 AND SPRING 2015
SLQA Effort
SSC Target of QA
Sample (mg/L)
Sample Replicate
#
SSC Percent Difference for Estuary Program
Analysis Compared to Known Concentration
(%)
Average SSC Percent
Difference for Estuary Program
Analysis (%)
Median SSC Percent
Difference for Results from All
Labs (%)
Fall 2014
70 1 -3.83
-6.20 -4.21 2 -4.7 3 -10.08
1,300 1 -1.33
-1.53 -1.57 2 -1.64 3 -1.61
4,100 1 -
-0.85 2.53 2 -1.17 3 -0.53
Spring 2015
50 1 -16.39
-16.13 -15.23 2 -25.52 3 -6.48
750 1 -2.96
-2.56 -3.37 2 -2.25 3 -2.47
4,000 1 -0.76
-0.57 -0.63 2 -0.38 3 -0.57
No numeric targets are in place for assessing program accuracy. As demonstrated by the values in the above table, Estuary Program results were on par with the results from other labs across the country that participated in the SLQA Program.
2015 Sediment Report 40 October 2015
REFERENCES
Ankcorn, P. 2003. Clarifying Turbidity- The Potential and Limitations of Turbidity as a Surrogate for Water Quality Monitoring. Proceedings of the 2003 Georgia Water Resources Conference, held April 23-24, 2003.
ASTM, 1999. Standard Test Method for Determining Sediment Concentration in Water Samples: American Society of Testing and Materials, D 3977-97, Vol. 11.02, pp. 389-394.
Edwards, T.K. and Glysson, G.D., 1999. Field Methods for Measurement of Fluvial Sediment: U.S. Geological Survey Techniques of Water-Resource Investigations, Book 3, Chapter C2, 89p.
Gray, John R., Glysson, G. Douglas, Turcios, Lisa M., Schwarz, Gregory E., 2000. Comparability of Suspended Sediment Concentration and Total Suspended Solids Data, U.S. Geological Survey Water-Reources Investigations Report 00-4191, 14 p. (http://water.usgs.gov/osw/pubs/WRIR00-4191.pdf).
Herbst, David, et al. Sediment Deposition Relations to Watershed Land Use and Sediment Load Models Using a Reference Stream Approach to Develop Sediment TMDL Numeric Targets for the San Lorenzo River and Central Coast California Streams. January 2011.
Herbst, David, et al. Development of Biological Indicators and Targets to Guide Sediment TMDLs for Streams of the Central Coast Region of California and the San Lorenzo River. January 2011.
Morro Bay National Estuary Program’s Implementation Effectiveness Program for the Morro Bay Watershed, Suspended Sediment Monitoring Report, 2009-2010. Morro Bay National Estuary Program. September 2010.
Morro Bay National Monitoring Program: Nonpoint Source Pollution and Treatment Measure Evaluation for the Morro Bay Watershed Final Report. Central Coast Regional Water Quality Control Board. August 2003.
Morro Bay Sediment Loading Update, December 2011. Morro Bay National Estuary Program. December 2011.
Morro Bay Total Maximum Daily Load for Sediment (including Chorro Creek, Los Osos Creek and the Morro Bay Estuary). Central Coast Regional Water Quality Control Board. 2003.
Ode, Peter. California Department of Fish and Game Aquatic Bioassessment Laboratory. Standard Operating Procedure for Collecting Benthic Macroinvertebrate Samples and Associated Physical and Chemical Data for Ambient Bioassessments in California. February 2007.
Paustian, S. and Beschta, R. 1979. The Suspended Sediment Regime of An Oregon Coast Range Stream. Water Resources Bulletin, American Water Resources Association. 15 (1) pp.144-154.
Three-Year Implementation Tracking Progress Report of the Morro Bay Sediment Total Maximum Daily Load. Central Coast Regional Water Quality Control Board. April 2007.
Tetra Tech, Inc. 1998. Morro Bay Estuary Program Sediment Loading Study.
2015 Sediment Report 41 October 2015
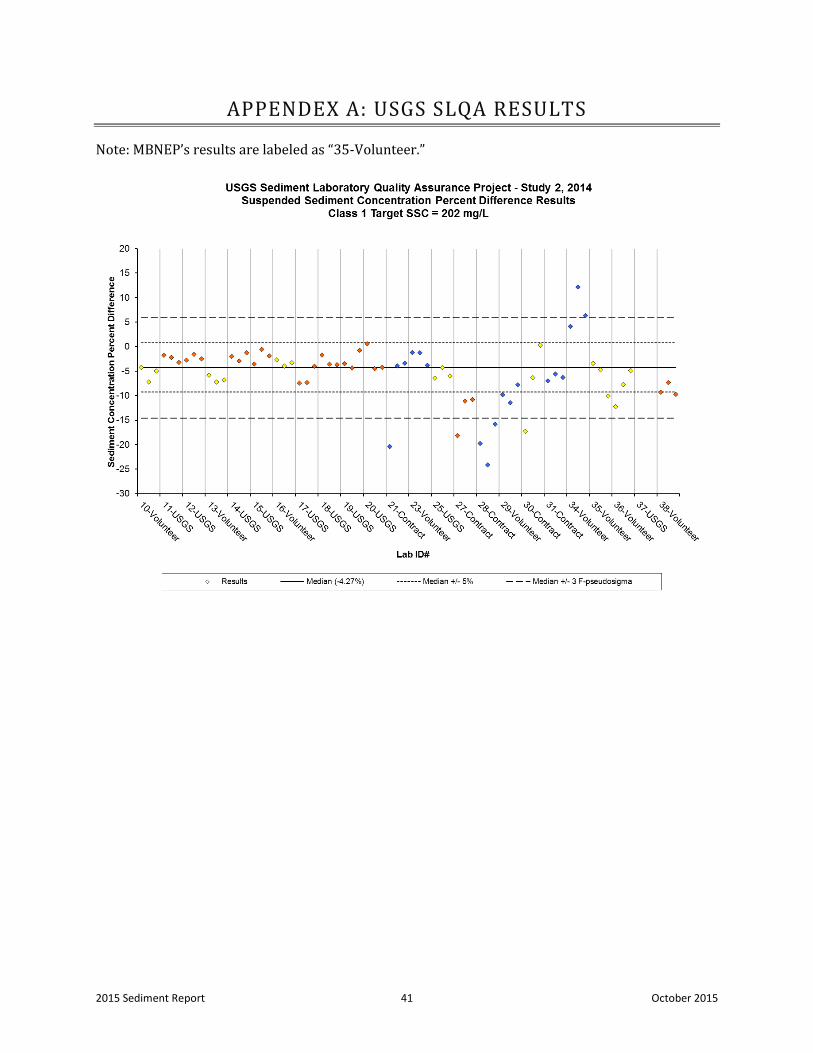
APPENDEX A: USGS SLQA RESULTS
Note: MBNEP’s results are labeled as “35-Volunteer.”
2015 Sediment Report 42 October 2015
2015 Sediment Report 43 October 2015
2015 Sediment Report 44 October 2015