morris p. fiorina, stanford university
TRANSCRIPT

1
“Electoral Behaviour in the USA: the Newest Results”
Morris P. Fiorina, Stanford University
5-6 June 2006
What I do today is to organize my remarks around some common misconceptions about
American politics and these are widely, prevalently United States’ misconceptions and so I
assume that those that receive none but United States American media probably share some of
the same misconceptions.
Som e C om m on M isperceptions
• 1 . T he 2004 E lections
• 2 . Popu lar P o larization
• 3 . R elig ion v . E conom ics
• 4 . S tab ility o f the C urren t O rder
First- they are puzzled about what happened in the 2004 elections; second- just how
polarized, how divided is the American electorate; third- the question of whether religion has
displaced economics as the primary cleavage in the American politics, as some argue; then,
forth- I will say some more speculative things about the stability of the current order in the
American politics.
For the first three, I have quite a bit of data, while the last one is more speculative and
remarks there given to some theoretical issues may have some rather relevance for those of
you studying European elections, as well.

2
1. So, first the question of what happened in the 2004 elections
The 2004 Elections
• The M oral Values M yth• Christian Conservatives
• W hat Really M attered• W ho Really Re-elected George Bush
Right after, really the morning after, the media promulgated the myth that the elections
have been decided on the basis of moral values and that George Bush owed his re-election to
the support of Christian conservatives, some “social conservatives”, we call them sometimes
in the United States.
Neither of those things is true. When I talk about what really mattered in the last
elections, I focus on groups, who really re-elected George Bush.
The myth of moral values turned out to come from a single poorly-phrased exit-poll
item that the media talked and ran with: it was: “What is the most important issue and how
you decided it?” and they gave people these categories:
N ational E lection P ool
M ost Im portant Issue:
Taxes 5%Education 4Iraq 15Terrorism 19Econom y/Jobs 20M oral V alues 22H ealth Care 8
As you can see, the result was pretty spread out, but the media looked and said that
moral values were number one, with 22%; moral values must mean abortion and gay marriage
and therefore that’s what the election was about. That’s a very tenuous conclusion, given how
3
data had spread out; moreover, none of these moral values is a category or it has been
compared with individual issues; for example, the Bush administration tried to equate Iraq
and terrorism.
The Carry campaign was about economic issues: education, economy, jobs, health care.
We can go in the other direction and say that those moral values encompass more than
abortion and gay marriage, because the amount of people referring expressly to abortion and
gay marriage, in that category, range from 5% to 9%, referring specifically to those issues.
One of the reasons for this interpretation [the myth of the moral values victory] was the
fact that the Bush campaign had worked to put a series of what we call “GMIs” – Gay
Marriage Issues – on the ballot in the States. So, this circumstance was the evidence that
indicated that the republicans had to bring up the social conservatives, as succeeded they
elected George Bush.
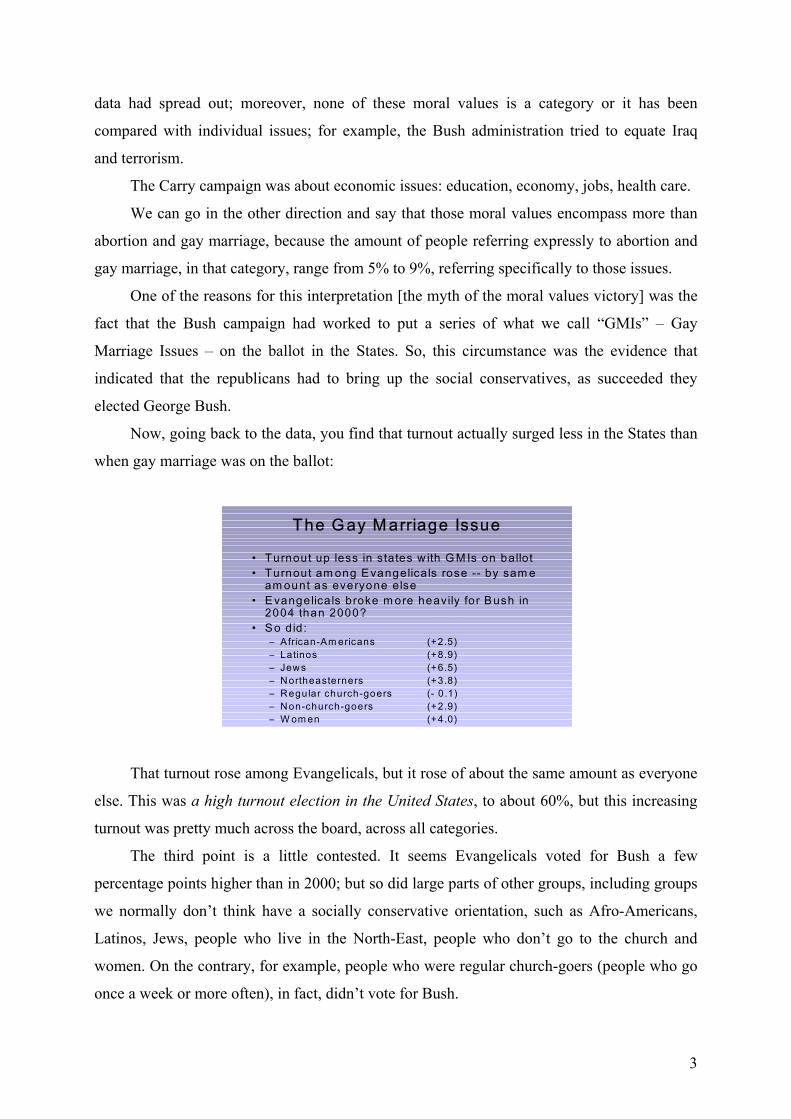
Now, going back to the data, you find that turnout actually surged less in the States than
when gay marriage was on the ballot:
The G ay M arriage Issue
• Turnout up less in states w ith G M Is on ballot• Turnout am ong Evangelicals rose -- by sam e
am ount as everyone else• Evangelica ls broke m ore heavily for Bush in
2004 than 2000?• So did:
– African-Am ericans (+2.5)– Latinos (+8.9)– Jews (+6.5)– Northeasterners (+3.8)– Regular church-goers (- 0.1)– Non-church-goers (+2.9)– W om en (+4.0)
That turnout rose among Evangelicals, but it rose of about the same amount as everyone
else. This was a high turnout election in the United States, to about 60%, but this increasing
turnout was pretty much across the board, across all categories.
The third point is a little contested. It seems Evangelicals voted for Bush a few
percentage points higher than in 2000; but so did large parts of other groups, including groups
we normally don’t think have a socially conservative orientation, such as Afro-Americans,
Latinos, Jews, people who live in the North-East, people who don’t go to the church and
women. On the contrary, for example, people who were regular church-goers (people who go
once a week or more often), in fact, didn’t vote for Bush.

4
In fact, studies that look at the importance of issues found gay marriage to be waded
down to the bottom.
ISSUE IM PO RTANCE: 2004
145Terrorism
2426Gay M arriage
.
.
240Jobs.
Not at A llIm portant
Extrem ely Im portant
Hillygus and Shields (KN Survey)
This was the study: gay marriage was the 15th issue, as they rated it from “extremely
important”, “fairly important”, “not at all important”, while they found that terrorism was the
number one issue in election; job was number two. So, gay marriage was 15th out of 16 issues.
Another study published recently, an American election study, which asked people to
say in their own words what was the most important issue in the election, shows that 43%
cited “terrorism”:
M o st Im p o r ta n t Issu e 2 0 0 4K lin k n er (N E S )
% C itin g B u sh V o te
• T erro rism 4 3 7 0 • Iraq 1 7 3 1• E co n o m y 1 5 3 0• M o ra ls < 3 7 6• A ll O th e r 2 2 3 8
This was, according to the author, the single largest number of Americans deciding any
specific issue since Vietnam, in 1968, when the figure was 44%.
This was really an election about people’s fears, about terrorism and about the
Republican successfully campaign on images of strength, the Democrats being unable to

5
project a convincing and persuasive image that they can keep the country safe. People
choosing any kind of moral issue, in this study, was less than 3% of the population. Now, the
sensational thing that people citing “Iraq” did not vote for Bush (second line of the graph
above), in particular high rates that Iraq was already beginning to be separated from
“terrorism” was the nugget here.
In contrast with the argument that Christian conservatives re-elected Bush, you could
argue it was women:
NOT EVANGELICALS … WOMEN
2000 2004 Gain
Black Women 5.8% 9.8% 4.0%
Latina Women 34.9 41.4 6.5
White Women 50.5 55.5 5.0
Married Black Women 7.1 11.5 4.4
Married Latina Women 37.3 43.8 6.5
Married White Women 54.9 61.8 6.9
Married WW with Children 58.9 66.0 7.1
Married WW without Children 51.5 59.4 7.9
Unmarried WW with Children 40.6 47.1 6.5
Unmarried WW without Children 40.3 43.1 2.8
The Republican Swing Among Women Was General
Source: Fiorina, Abrams, and Pope. 2005
The surge of Bush between 2000 and 2004 was about 2,5% of the popular vote. The
surge about women was around 4 to 5% of the popular vote.
As you know, there has been a gender gap in the United States, caused with generation
now where women typically vote more democratic than men. That gender gap closed up in
2004 and across all categories of women: ethnicity (latinos and white women), married and
single women. The only group that seems somewhat to resist to the Bush appeal was
unmarried, white women who had no children, primarily younger women, working in the
labour force.
So, basically, the surge of 4 to 5% among women can account for giving a little more
than half of the electorate, can account for most of the 2,5% Bush surge in the popular vote.
6
Thus, contrarily to the Christian conservatives, it’s basically women who re-elected
George Bush.
2. The question of polarization.
It’s certainly true that American political class is highly polarized: they are in fact much
more polarized than they used to be.
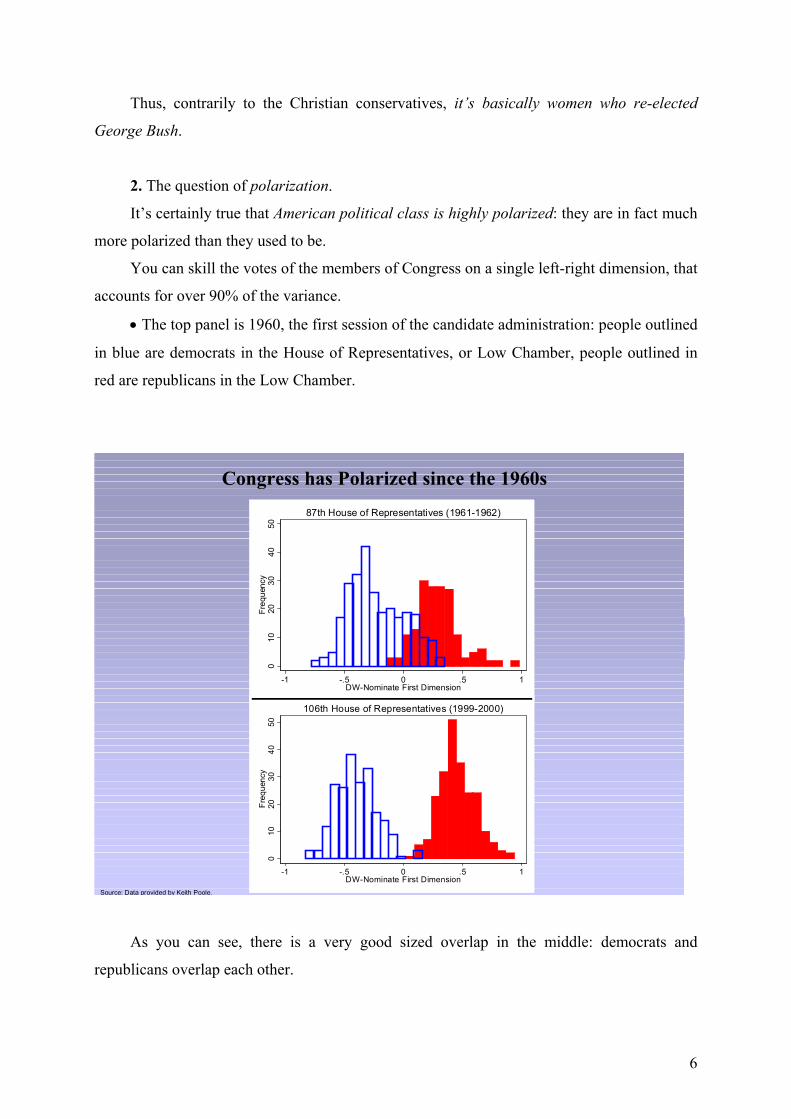
You can skill the votes of the members of Congress on a single left-right dimension, that
accounts for over 90% of the variance.
• The top panel is 1960, the first session of the candidate administration: people outlined
in blue are democrats in the House of Representatives, or Low Chamber, people outlined in
red are republicans in the Low Chamber.
Congress has Polarized since the 1960s
010
2030
4050
Freq
uenc
y
-1 -.5 0 .5 1DW-Nominate First Dimension
87th House of Representatives (1961-1962)
010
2030
4050
Freq
uenc
y
-1 -.5 0 .5 1DW-Nominate First Dimension
106th House of Representatives (1999-2000)
Source: Data provided by Keith Poole.
As you can see, there is a very good sized overlap in the middle: democrats and
republicans overlap each other.

7
The bottom figure is about representatives in the current congresses: this are the last
years of Clinton administration. You can see that there is now almost no overlap between
democrats and republicans; and this enormous polarization within the US Congress is
increasing.
It turns out that in the United States everything falls in the left-right dimension:
abortion, gay marriage, economics, foreign policy, all collapses into this single dimension.
• When you see a distribution, such as the bottom distribution the tendency is to assume
that the electorate that elects those people is polarized:
D em R epm
D em R epm
C losely but N ot D eeply D ivided
C losely and D eeply D ivided
In the top panel, there is a big left segment of the electorate and a big right segment of
the electorate, very few people in between and so, democrats and republicans get elected.
But you can also have an electorate such as in the bottom: a very centrist electorate,
giving you the same result. People slightly to the left vote for the left most candidate and
people slightly to the right vote for the right most candidate. So, the parties hard leftist and
hard rightist candidates will still be elected, even if most of the voters are, in fact, centrist.
The evidence is strongly in favour of the argument that the American voters are more like the
bottom panel than the top panel.
• It’s been common to describe the United States as composed by “red States” and “blue
States”: the red States vote republican and the blue States vote democratic and it’s argued
they differ mainly about political issues and cultural attitudes.
8
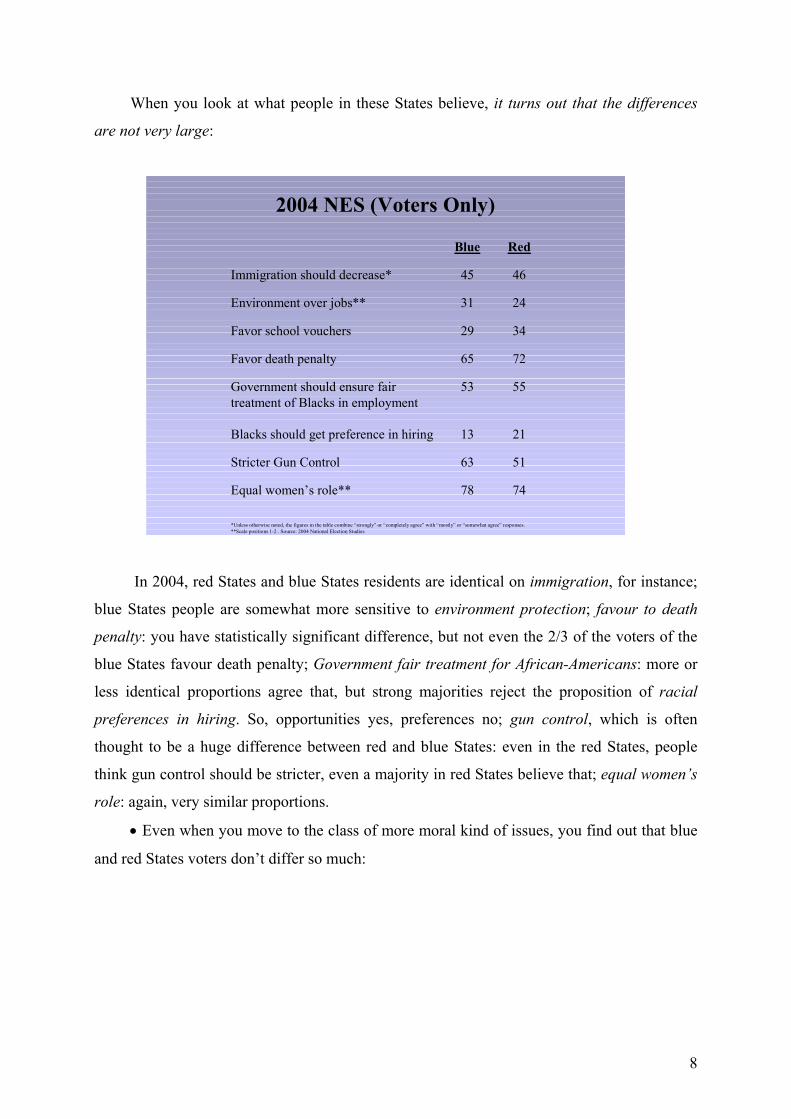
When you look at what people in these States believe, it turns out that the differences
are not very large:
2004 NES (Voters Only)
7478Equal women’s role**
5163Stricter Gun Control
2113Blacks should get preference in hiring
5553Government should ensure fair treatment of Blacks in employment
7265Favor death penalty
3429Favor school vouchers
2431Environment over jobs**
4645Immigration should decrease*
RedBlue
*Unless otherwise noted, the figures in the table combine “strongly” or “completely agree” with “mostly” or “somewhat agree” responses. **Scale positions 1-2 . Source: 2004 National Election Studies
In 2004, red States and blue States residents are identical on immigration, for instance;
blue States people are somewhat more sensitive to environment protection; favour to death
penalty: you have statistically significant difference, but not even the 2/3 of the voters of the
blue States favour death penalty; Government fair treatment for African-Americans: more or
less identical proportions agree that, but strong majorities reject the proposition of racial
preferences in hiring. So, opportunities yes, preferences no; gun control, which is often
thought to be a huge difference between red and blue States: even in the red States, people
think gun control should be stricter, even a majority in red States believe that; equal women’s
role: again, very similar proportions.
• Even when you move to the class of more moral kind of issues, you find out that blue
and red States voters don’t differ so much:

9
2004 NES (Voters Only)
5160Favor gays in military (strongly)
6981No gay job discrimination
3139Allow homosexual marriage
4157Allow homosexual adoption
3244Abortion- Always legal
6065Tolerate others’ moral views
RedBlue
*Unless otherwise noted, the figures in the table combine “strongly” or “completely agree” with “mostly” or “somewhat agree” responses. **Scale positions 1-2 . Source: 2004 National Election Studies
About abortion, there is a statistically significant difference, but, even in the blue States,
only a minority agrees that abortion should always be legal; homosexual adoption: it was the
single biggest difference we found in 2004: in the blue States, majority is in favour of
homosexual adoption, in the red States, they were opposed to it; they both oppose job
discrimination for gays; and finally the issue that was very controversial in 1992 and now it’s
a majority preferred issue: people think gays should be able to serve openly in the military.
• What has happened in the United States is a certain amount of politic sorting.
In the diagrams, you can see what people mean for polarization:
P O L A R IZ A T IO N
R
R
R
R
R RRR
R
R
R
RRR
R
R R RRR
R
R
R
R R
R R
R
R
R R RR
D
D
D
D
D
D
D
D
DDDD DDD
DDD
D D
D
DD
D
DDDD
DD
D
D
D
T im e 1
D
D
D
D
DD
D
D
DD
D
D
D
D
D
D
D
DD
D
T im e 2
D
D
D
D
D
D
DD
D
D D
D
D
D
D
D
DD
D
D
D
D
D
D
D
D
D D
D
D
R
RR
R
RR
R
R
R
R
R
RR
R
R
R
R
R
R
R
R
R
R
R
RR
R
R
RR
R
R
R
R
R
R
R
R
RR
R
R R
R
R
R
R
R
RR
I
I
I
I
I
I I
I
I
I
I
I
I
I
III
I
II
I
I
I I
I
I
I
I I
I
I
I
I I
10
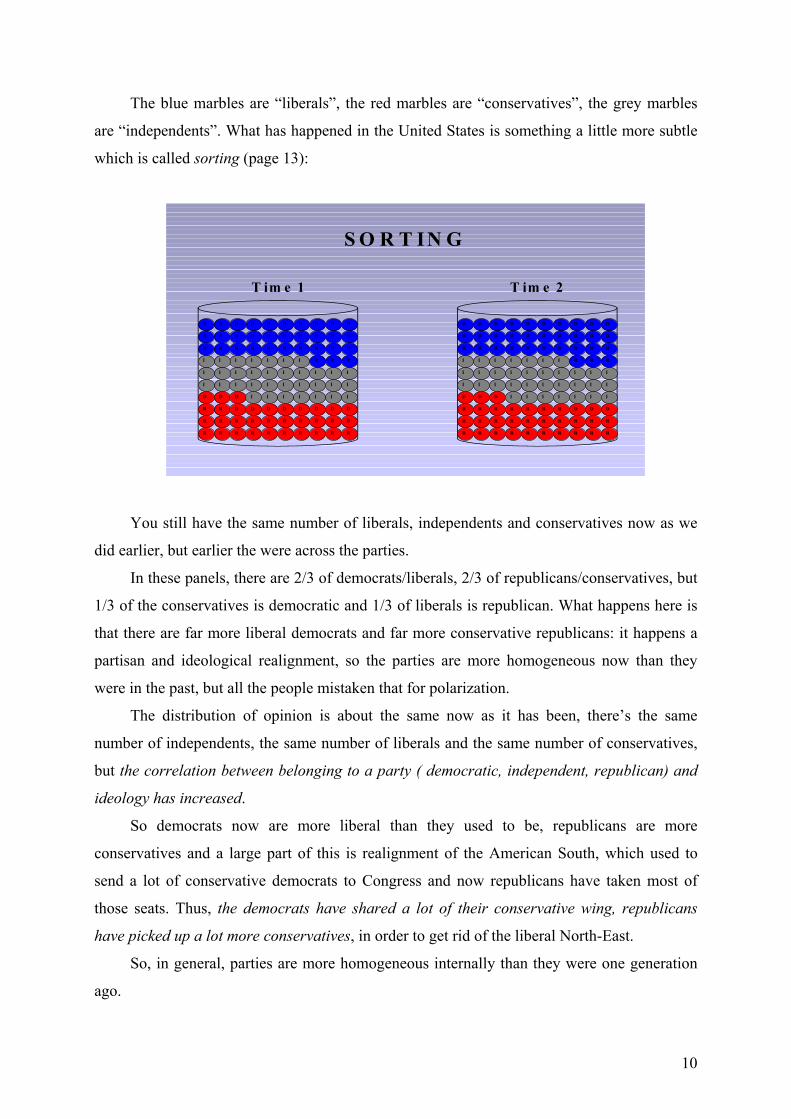
The blue marbles are “liberals”, the red marbles are “conservatives”, the grey marbles
are “independents”. What has happened in the United States is something a little more subtle
which is called sorting (page 13):
S O R T IN G
RR RRRR
RRR
R
RR
R R
R
R
R R RR
D
D
D
D
D
D
DDD
D D
D
DDDD
DD
D
D
D
T im e 1 T im e 2
R
D
R
D
D
R RRR
D
R
R
RRR
R
R R DDR
R
R
R
R R
R R
R
R
R R RR
D
D
D
D
D
D
D
R
DRRR DDD
DDD
D D
D
RR
D
DDDD
DD
D
D
D
DDD
DDR DDDD
R
DD
RR RRR
RR
RRR D
I
I
I
I
I
I
I I I
I
I
I
I
II I
I
I
II
I
I
I I
I
I
I
I
I
I
I
II
I
I
II
II
I
I I I
I
I I
II
III
II
IIIII
II
I
II
I
II
II
You still have the same number of liberals, independents and conservatives now as we
did earlier, but earlier the were across the parties.
In these panels, there are 2/3 of democrats/liberals, 2/3 of republicans/conservatives, but
1/3 of the conservatives is democratic and 1/3 of liberals is republican. What happens here is
that there are far more liberal democrats and far more conservative republicans: it happens a
partisan and ideological realignment, so the parties are more homogeneous now than they
were in the past, but all the people mistaken that for polarization.
The distribution of opinion is about the same now as it has been, there’s the same
number of independents, the same number of liberals and the same number of conservatives,
but the correlation between belonging to a party ( democratic, independent, republican) and
ideology has increased.
So democrats now are more liberal than they used to be, republicans are more
conservatives and a large part of this is realignment of the American South, which used to
send a lot of conservative democrats to Congress and now republicans have taken most of
those seats. Thus, the democrats have shared a lot of their conservative wing, republicans
have picked up a lot more conservatives, in order to get rid of the liberal North-East.
So, in general, parties are more homogeneous internally than they were one generation
ago.
11
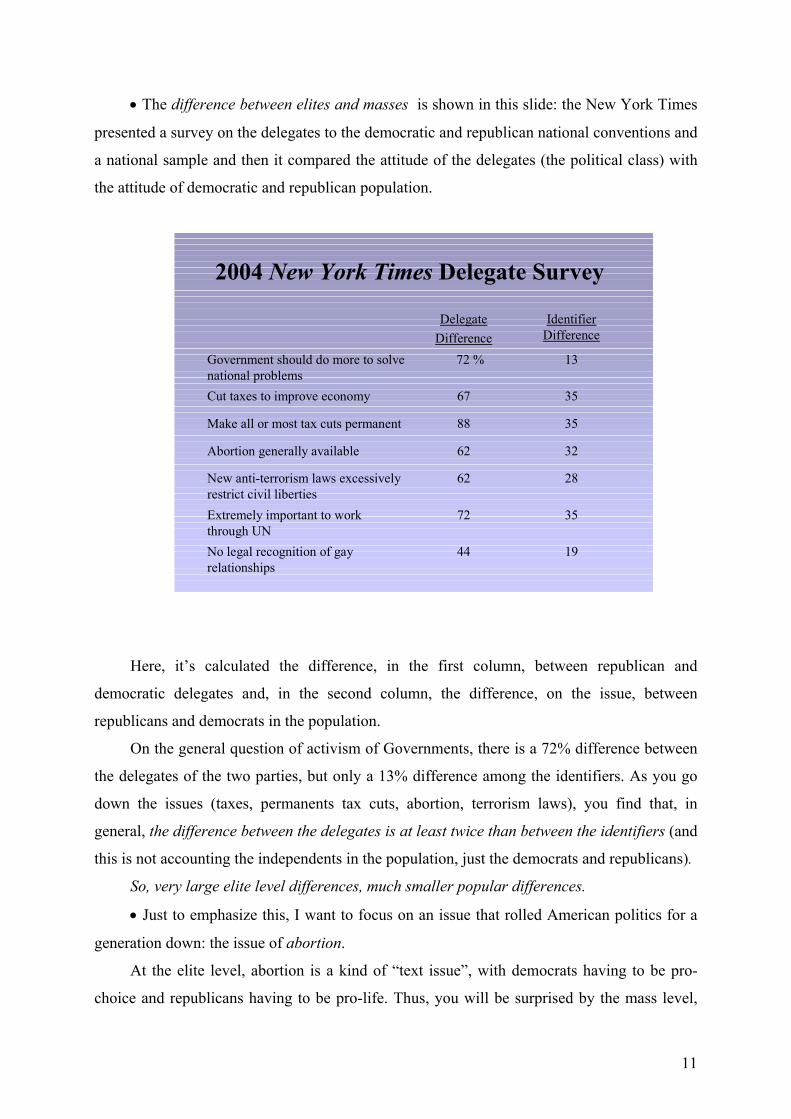
• The difference between elites and masses is shown in this slide: the New York Times
presented a survey on the delegates to the democratic and republican national conventions and
a national sample and then it compared the attitude of the delegates (the political class) with
the attitude of democratic and republican population.
2004 New York Times Delegate Survey
3572Extremely important to work through UN
1944No legal recognition of gay relationships
2862New anti-terrorism laws excessively restrict civil liberties
3262Abortion generally available
3588Make all or most tax cuts permanent
3567Cut taxes to improve economy
1372 %Government should do more to solve national problems
Identifier Difference
Delegate Difference
Here, it’s calculated the difference, in the first column, between republican and
democratic delegates and, in the second column, the difference, on the issue, between
republicans and democrats in the population.
On the general question of activism of Governments, there is a 72% difference between
the delegates of the two parties, but only a 13% difference among the identifiers. As you go
down the issues (taxes, permanents tax cuts, abortion, terrorism laws), you find that, in
general, the difference between the delegates is at least twice than between the identifiers (and
this is not accounting the independents in the population, just the democrats and republicans).
So, very large elite level differences, much smaller popular differences.
• Just to emphasize this, I want to focus on an issue that rolled American politics for a
generation down: the issue of abortion.
At the elite level, abortion is a kind of “text issue”, with democrats having to be pro-
choice and republicans having to be pro-life. Thus, you will be surprised by the mass level,

12
given how dividing is this issue at the elite level: the first point is that public opinion has not
moved much at all on this issue in a generation.
Public Opinion on the Legality of Abortion Has Remained Consistent For Decades
0
10
20
30
40
50
60
70
80
90
100
1975 1977 1979 1981 1983 1985 1987 1989 1991 1993 1995 1997 1999 2001 2003 2005
Year
Perc
enta
ge
Legal only under certain circumstances Legal under any circumstances Illegal in all circumstances
Source: The Gallup Organization
There is a gap of data, where the top of the graph, the top line is “people thinking
abortion should be legal under certain circumstances”; so, most Americans, the majority
consistently says: “Sometimes yes, sometimes no”. The democratic position is the bottom
line, which is “always legal” (20 to 25%); the republican position is “always illegal” (about
20%).
So, you have the parties representing these much smaller proportions of the population,
while the population itself is largely centrist on this issue.
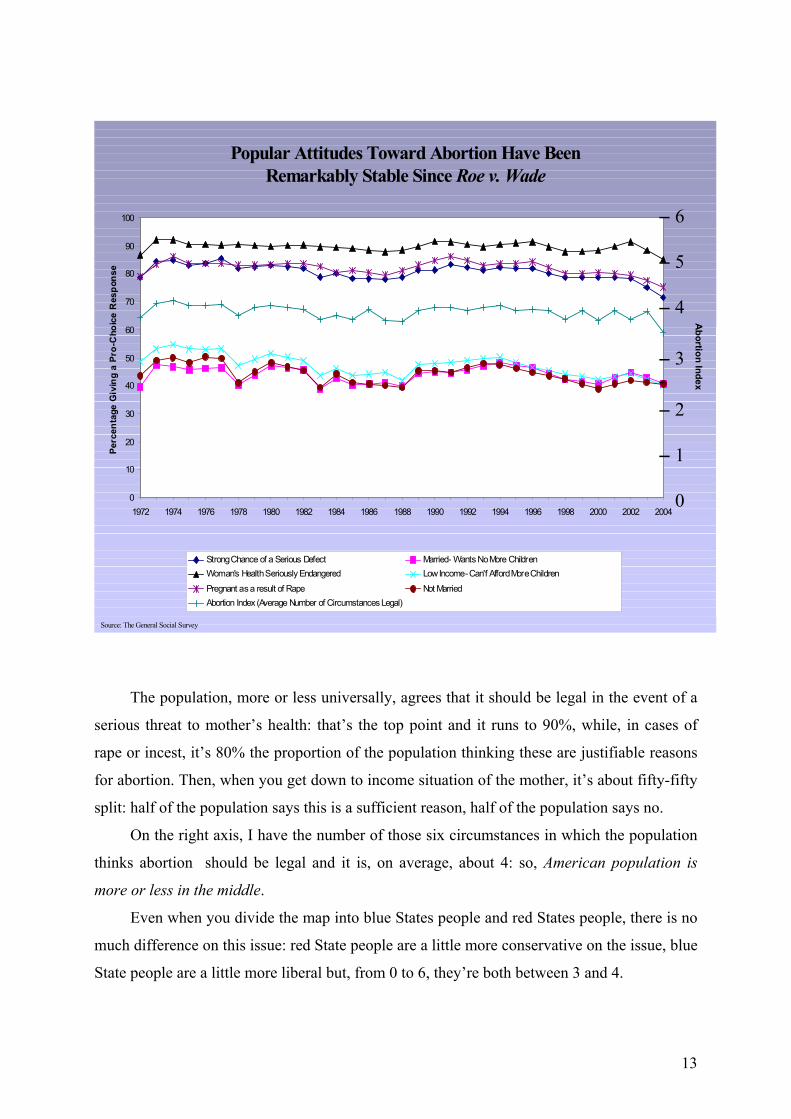
I want to give you some specific data, using a general social survey from University of
Chicago, because it gives you much more demographic details. The question reads as follows:
“Should abortion be legal under each of the following circumstances?”.
13
Popular Attitudes Toward Abortion Have Been Remarkably Stable Since Roe v. Wade
0
10
20
30
40
50
60
70
80
90
100
1972 1974 1976 1978 1980 1982 1984 1986 1988 1990 1992 1994 1996 1998 2000 2002 2004
Perc
enta
ge G
ivin
g a
Pro-
Cho
ice
Res
pons
e
Strong Chance of a Serious Defect Married- Wants No More ChildrenWoman's Health Seriously Endangered Low Income- Can'f Afford More Children
Pregnant as a result of Rape Not MarriedAbortion Index (Average Number of Circumstances Legal)
6
2
1
0
3
4
Abortion Index
5
Source: The General Social Survey
The population, more or less universally, agrees that it should be legal in the event of a
serious threat to mother’s health: that’s the top point and it runs to 90%, while, in cases of
rape or incest, it’s 80% the proportion of the population thinking these are justifiable reasons
for abortion. Then, when you get down to income situation of the mother, it’s about fifty-fifty
split: half of the population says this is a sufficient reason, half of the population says no.
On the right axis, I have the number of those six circumstances in which the population
thinks abortion should be legal and it is, on average, about 4: so, American population is
more or less in the middle.
Even when you divide the map into blue States people and red States people, there is no
much difference on this issue: red State people are a little more conservative on the issue, blue
State people are a little more liberal but, from 0 to 6, they’re both between 3 and 4.
14
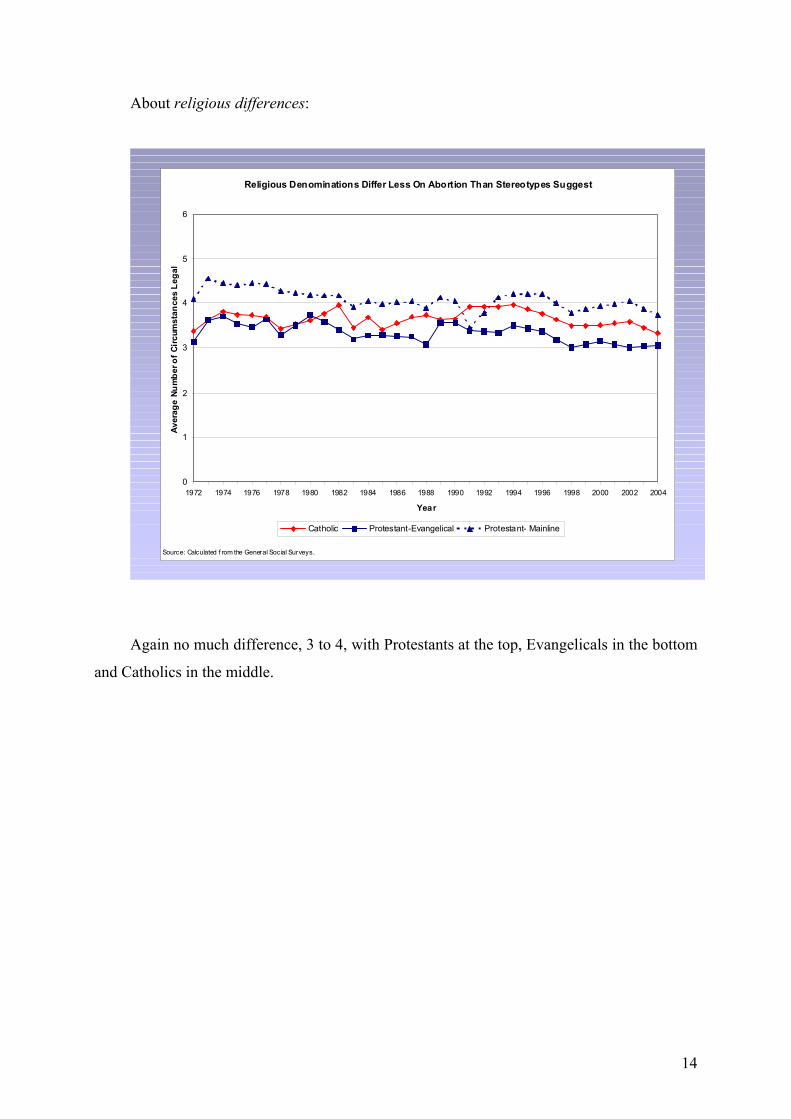
About religious differences:
Religious Denominations Differ Less On Abortion Than Stereotypes Suggest
0
1
2
3
4
5
6
1972 1974 1976 1978 1980 1982 1984 1986 1988 1990 1992 1994 1996 1998 2000 2002 2004
Year
Aver
age
Num
ber o
f Circ
umst
ance
s Le
gal
Catholic Protestant-Evangelical Protestant- Mainline
Source: Calculated f rom the General Social Surveys.
Again no much difference, 3 to 4, with Protestants at the top, Evangelicals in the bottom
and Catholics in the middle.

15
Then, we have partisans:
Partisan s in th e General Pu blic D o N ot Differ Mu ch on Abo rtion
0
1
2
3
4
5
6
197 2 1974 197 6 1978 1980 1982 1984 1986 1988 1990 1992 1994 1996 1998 2000 2002 2004
Ye ar
Aver
age
Num
ber o
f Cir
cum
stan
ces
Lega
l
Dem ocrats Republicans Independents
Source: Calculated f rom the Gener al Soc ial Sur veys .Note: Par tisans inc lude s trong and w eak identif iers .
Abortion is, as we saw, a hugely dividing issue at the elite level. But here, at the mass
level, we have democrats at the top, republicans in the bottom and independents in between.
Here’s what I mean by the “politic sorting”: as you can see from the graph, it took about
twenty years for the parties even to get on the right side, for this issue. Finally, you see
democrats looking a little more liberals than republicans, but, in contrast with the huge
division that this issue provokes at the elite level, republicans and democrats in the population
are only one circumstance apart on this issue, with the independents in between.
So, the general picture is that if you ask Americans where they stand (this is the
ideology skill) the red States people and blue States people say they’re pretty much in the
middle.
Here, the top panel is “all residents”, the bottom panel is “voters only”.

16
Red and Blue State Residents are Basically Centrists: 2004Ideological Self-Placement of All Respondents Liv ing in Red and Blue
States
0
5
10
15
20
25
30
35
40
1 2 3 4 5 6 7
7-Point Scale
Perc
enta
ge
Red States Blue States
Ideological Se lf-Placement of Voters Liv ing in Red and Blue States
0
5
10
15
20
25
30
35
40
1 2 3 4 5 6 7
7-Point Scale
Perc
enta
ge
Red States Blue States
Source: 2004 National Election Studies
In both, slightly conservative and slightly liberal are in the middle. When you ask the
same people where the parties stand, they put democrats on their left and republicans on their
right:

17
Red and Blue State Voters Agree that the Parties are Not Centrist: 2004
Voters Placements of the Democratic Party
0
10
20
30
40
50
60
1 2 3 4 5 6 7
7-Point Scale
Perc
enta
ge
Red States Blue StatesVoters Placements of the Republican Party
0
10
20
30
40
50
60
1 2 3 4 5 6 7
7-Point Scale
Perc
enta
ge
Red States Blue StatesSource: 2004 National Election Studies
So, the general view of the American politics is still a largely centrist population,
choosing between parties on both sides.
• Another issue I had mentioned is Iraq: I talked about it at the beginning, about the
terrorism question. This paper was just published a month ago by Philip Klinkner and it is a
very detailed analysis on foreign politics considerations in 2004 election:
P a r t i s a n D i f f e r e n c e s 2 0 0 4( K l i n k n e r N E S )
• F o r e i g n P o l i c y G o a l s – n o t l a r g e• F o r e i g n P o l i c y M e a n s – n o t l a r g e• N a t i o n a l D e f e n s e – n o t l a r g e• P a t r i o t i s m – n o t l a r g e
• B u s h – v e r y l a r g e

18
There’s something very interesting: if you look at the foreign politics goals that
Americans believe should be followed (question of human rights, national interest, exc.),
democrats and republicans, at a mass level, don’t show a lot of difference. If you look at
foreign politics means (military, diplomacy, exc.), again, they don’t show a lot of difference.
If you look at national defence issues, they don’t show a lot of difference. If you look at
patriotism issues, they don’t show a lot of difference. If you ask about electing George Bush,
they show huge difference.
Somehow, small differences in positions (what do you think should be done? What do
you think about issues?) have been translated, at least in this administration, in huge
differences in evaluation of the candidates.
So, something unusual is going on here, some complex mapping. My interpretation is
that a non- polarizing candidate, like Bush, could, in fact, appeal to this much larger centre
and give you the appearance of a politics much less polarized than we have.
3. The third misconception I mentioned at the beginning was the notion that religion has
replaced economics as a major cleavage in American politics.
Some of you may have read Thomas Frank’ s book “What’s the matter with Kansas?”:
it’s a wonderful book to read, but completely wrong. In fact, if you look at the data (pages 23-
24), this is the difference in the democratic presidential vote between respondents whose
household is in the upper third of the income distribution and respondents whose household
is in the lower third of the income distribution (there are only whites, because Afro-
Americans tend to vote democratic):

19
Difference in Democratic Presidential Vote BetweenLower and Upper Income Thirds
-5 0 5 10 15 20 25
1952
1956
1960
1964
1968
1972
1976
1980
1984
1988
1992
1996
2000
2004
Year
Source: Calculated f rom the National Election Studies.Note: Includes w hite voters only
D ifference in Democratic Presidential Vote Between L ower and Up per In co me Third s
-5 0 5 1 0 1 5 2 0 25 3 0
19 52
19 56
19 60
19 64
19 68
19 72
19 76
19 80
19 84
19 88
19 92
19 96
20 00
20 04
Year
Sou rce : Calcula ted from the Na tio nal Ele ctio n Stud ie s.
As you can see, income differences in voting have been much stronger in recent years
than they were and, if you include African-Americans in that group, you conclude that, in
2004, the income dividing the American politics was the largest it has been in the fifty years

20
in which we have data. So, income is not going away, as a division: economics is still a
fundamental division in American politics.
There’s a paper by a political scientist, entitled: “What’s the matter with Connecticut?”;
a foundation in Philadelphia did a huge survey in 2000, they had 100.000 respondents (it was
a continuing survey) and that made it possible to estimate voting models for individual States,
supposing the nation as a whole:
What’s the Matter with Connecticut?
Source: Gelman, Shor, Bafumi, and Park. 2005.
They found something very interesting: the poor States are the States in which the
income correlation with the vote is the highest. In the rich States it disappears.
In fact, Mississippi is the poorest State in the U.S. by median income, Ohio is the
median State, Connecticut is the richest State: in Connecticut, there is absolutely no
correlation between your income and your vote for President. In Mississippi and in Kansas,
which are the poorest States, there’s a high correlation between your income and your vote.
So, if you look at systematic data, the argument that economics is not a major cleavage
anymore, people voting on the basis of other issues, is simply not true. Of course, there are
other issues, but economics is still very important.
It is true that religion has got more important: this is a similar kind of diagram showing
the difference in democratic presidential vote between people who go to the church every

21
Sunday or more and people who never go to the church, so very religious people and the
seculars:
Difference in Democratic Presidential Vote BetweenRegular Churchgoers and Non-Attenders
0 5 10 15 20 25 30
1952
1956
1960
1964
1968
1972
1976
1980
1984
1988
1992
1996
2000
2004
Year
Source: Calculated f rom the National Election Studies.Note: Includes w hite voters only.
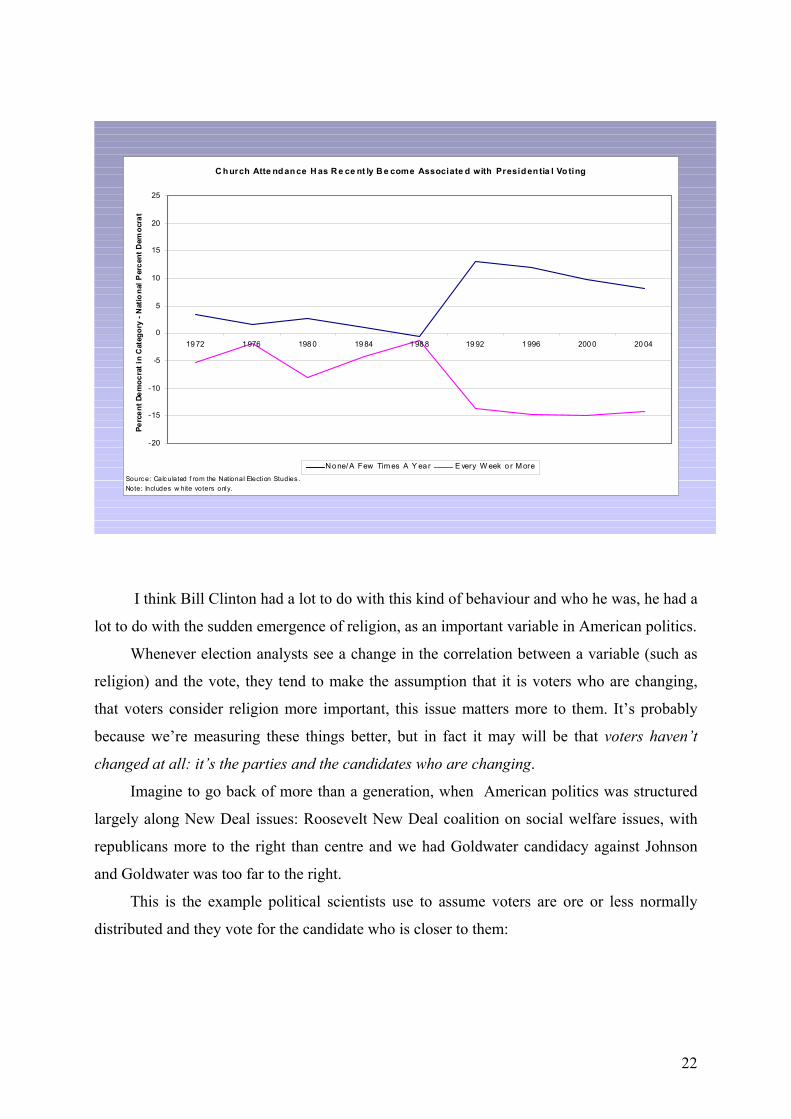
As you can see, the difference has increased automatically in recent years, since 1992
election; moreover, it’s not a gradual increase, it is a sudden, sharp surge. In 1992, this
difference just exploded and that’s when Bill Clinton appeared on the scene.
22
C hurch Atte ndance H as R e ce nt ly B e come Associate d with Presiden tia l Vo ting
-20
-15
-10
-5
0
5
10
15
20
25
19 72 1 976 198 0 19 84 1 98 8 19 92 1 996 200 0 20 04
Perc
ent D
emoc
rat i
n C
ateg
ory
- Nat
iona
l Per
cent
Dem
ocra
t
No ne/A Few Tim es A Y ea r E very W eek o r M oreSourc e: Calc ulated f rom the National Election Studies .Note: Includes w hite voters only.
I think Bill Clinton had a lot to do with this kind of behaviour and who he was, he had a
lot to do with the sudden emergence of religion, as an important variable in American politics.
Whenever election analysts see a change in the correlation between a variable (such as
religion) and the vote, they tend to make the assumption that it is voters who are changing,
that voters consider religion more important, this issue matters more to them. It’s probably
because we’re measuring these things better, but in fact it may will be that voters haven’t
changed at all: it’s the parties and the candidates who are changing.
Imagine to go back of more than a generation, when American politics was structured
largely along New Deal issues: Roosevelt New Deal coalition on social welfare issues, with
republicans more to the right than centre and we had Goldwater candidacy against Johnson
and Goldwater was too far to the right.
This is the example political scientists use to assume voters are ore or less normally
distributed and they vote for the candidate who is closer to them:

23
Candidate Competition in Two Dimensions: Arial View
In this case, the vertical line that is a little on the right of the centre, is the cutting line
that separates people closer to Goldwater and people closer to Johnson: and, in fact, Johnson
got the 60% of the votes.
Whether you are social conservatives or libertarian conservatives, it doesn’t matter: all
that matters is the difference on the economic dimension. What happens over the years is the
politics move: republicans move to the more traditional end of the moral dimension, as they
ally with the Christian right, the democrats become more and more secular and they move to
the more modern and progressive end of the dimension.
Now, the cutting line between the two parties is shifting from a vertical to a North-
South/East-West orientation:

24
Economic
Moral
Clinton
LBJ
Bush
Gore
Goldwater
Democrats and Republicans Separate on the Moral Dimension
So, we have some people left to the centre who vote for Bush on the basis of their moral
issues and some people on the right to the centre vote for Clinton and Gore, basing on their
moral issues.
Thus, the cutting line, the cleavage, changes, but I haven’t changed any voters in this
example. The voters are in the same position, they will position on this dimension equally: it’s
the party they are choosing that has moved.
Back to thirty or forty years ago, all candidates presented to the American voters were
paragons of middle-class virtues: they were all married, they went to church on Sunday, they
all had loving wives and loving children. We’re in a very different world now: Bill Clinton
cannot cover that role: he was pro-gay, he said he had never smoked marijuana but could have
approved it for medical use, exc. So, in a lot of ways, he sent signals saying he was down on
this dimension. Meanwhile, republicans allied with Christian right and moved up on this
dimension. So, I think this image of America becoming more religious oriented and more
culturally conservative probably is exaggerated; I’m not saying it hasn’t occurred, but I’m
saying there’s a confluence of two effects here: whether the voters have changed and how
much the stimuli the candidates are choosing between have changed.
4. I want to end up with the much more speculative arguments.

25
• I think this new political order in the US is quite fragile. The blue and red map
(democratic and republican States) is pretty much the same from election to election and a lot
of people have argued that this is now a deep, stable cleavage in the American politics and
that’s not going to change that much. But if you look at the map of the governors of the
American States: stepping down from presidential races to the races for governors, you’ve got
a very different picture: 22 of the American States have a governor different from the
presidential candidate they voted for in the last election, some by large numbers. Many States
voted for Bush and elected a democratic governor, by an easy margin. So, depending on
what’s the choice that is offered to them, they change their voting. A large example last time
was the State of Montana, which is a culturally conservative State: they passed the gay
marriage issue by a 60 to 40 vote margin and they also approved the medical use of marijuana
by a 60 to 40 vote margin. They simply switched from one side to the other, depending on the
choice they were offered. They also elected a democratic governor at the same time they
elected George Bush, by an overwhelming margin.
• There is a believe that is very prevalent in the American political class at the moment:
the democrats have to reach out to the middle, because their base is so small.
In the US, about 20 to 25% of the population say they’re liberal, about 35% say they’re
conservative, so the argument of the republicans is that they can win largely mobilizing their
base and reaching out just a little bit to the middle.
I think both sides have a kind of wrong: there are several recent papers out and this is
one by James Stimson and his students, that looks at what are the actual issue positions of
people who call themselves “liberals” and “conservatives”.
26
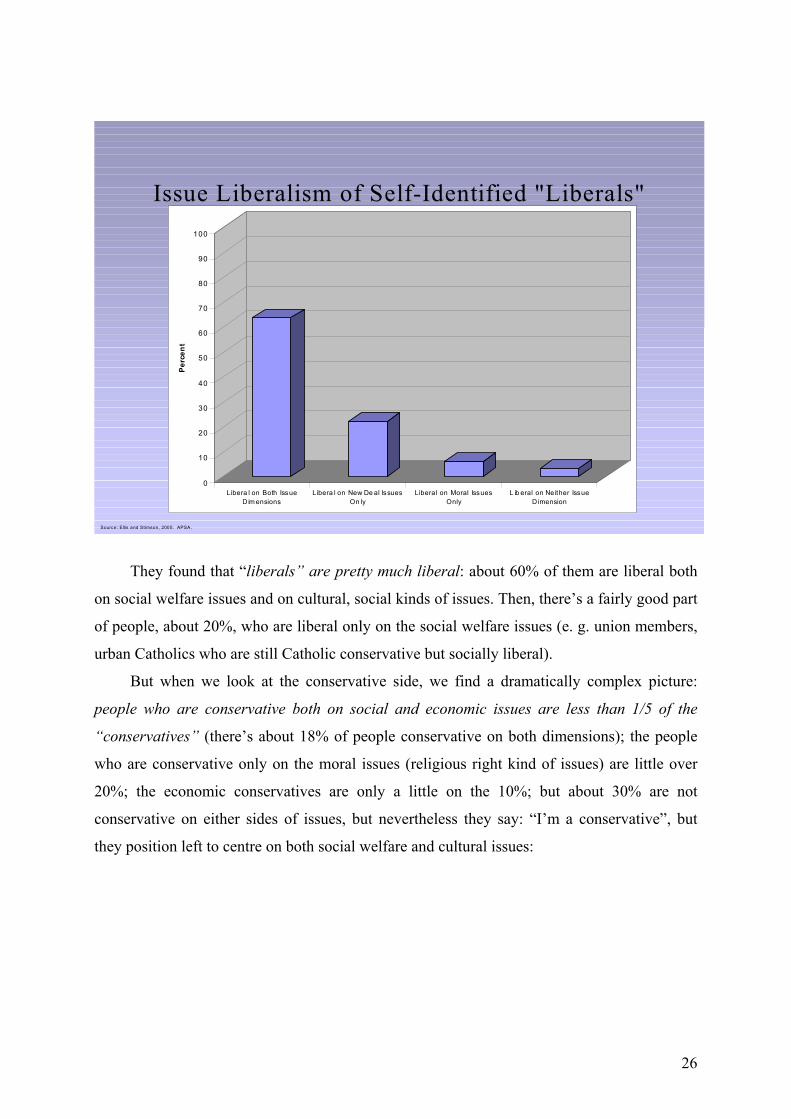
Issue Liberalism of Self-Identified "Liberals"
0
10
20
30
40
50
60
70
80
90
100
Per
cen
t
Libera l on Both IssueD im ensions
Libera l on New De al IssuesOn ly
Liberal on Moral IssuesOnly
L ib eral on Neither IssueD imension
Source: Ellis and Stimson, 2005. APSA.
They found that “liberals” are pretty much liberal: about 60% of them are liberal both
on social welfare issues and on cultural, social kinds of issues. Then, there’s a fairly good part
of people, about 20%, who are liberal only on the social welfare issues (e. g. union members,
urban Catholics who are still Catholic conservative but socially liberal).
But when we look at the conservative side, we find a dramatically complex picture:
people who are conservative both on social and economic issues are less than 1/5 of the
“conservatives” (there’s about 18% of people conservative on both dimensions); the people
who are conservative only on the moral issues (religious right kind of issues) are little over
20%; the economic conservatives are only a little on the 10%; but about 30% are not
conservative on either sides of issues, but nevertheless they say: “I’m a conservative”, but
they position left to centre on both social welfare and cultural issues:

27
Issue Conservatism of Self-Identified “Conservatives"
0
10
20
30
40
50
60
70
80
90
100
Per
cent
Conservative on Both IssueDimensions
Conservative on Mora lIssues Only
Conserva tive on New DealIssu es Only
Conserva tive on Neithe rDimension
Source: Ellis and Stimson, 2005. APSA.
Remembering George Bush’s attempts in privatising elements of social security, you
can see that the presumption that all conservatives support this, on the base of this sort of
data, is shown to be completely false. In fact, the majority of people who say: “We’re
conservatives” doesn’t necessarily favour right to centre economic policies, like elements of
social security; so, it’s very heterogeneous.
I think the conservative label, in the American context, is always been more popular and
it’s just somehow culturally more liberal to say that “liberal” conveys libertine, exc. What’s
interesting is that people in the last category (neither conservatives nor liberals on both kinds
of issues) didn’t really know much. They tend to be younger, they didn’t have a lot of
information about positions, they just say: “I’m conservative”. I basically think they just see
conservatives on TV and think: “They look more like me than the liberals I see on TV” and
this is the kind of cultural signals sent out.
Thus, to sum up:
• the 2004 election has been very badly misinterpreted, around the world and in the
United States;

28
• terrorism is the big deal for the democrats to figure out the ways to convey a
convincing image to the American public that they’re strong on the national defence, with the
republicans sending a clear signal: “We are strong on national defence”; the democrats have
difficulties doing it ever since Vietnam: so they have to find a way to overcome that.
• the population as polarized as people think: there’s still a big centre that can be
appealed to, but I think there’s a kind of exhaustion: people are looking for a more pragmatic
administration that solves problems, such as social welfare issues, medical care, health care,
social security and so on.