monthly stats report december 2020
TRANSCRIPT

MAY 2020 MONTHLY STATS REPORT DECEMBER 2020
Executive Summary The O‘ahu real estate market ended 2020 with a spike in sales and new listings in December. Closed sales of single-family homes on O‘ahu were up 35.9%, and condo sales rose by 20.1% compared to the same period in 2019. New listings increased by 15.3% and 3.6% year-over-year for single-family homes and condos, respectively. Median sales prices for December 2020 were up 6.1% at $870,000 for single-family homes and 6.9% to $455,000 for condos. While 2020 began with both single-family home and condo sales outpacing the start of 2019, O‘ahu’s real estate market experienced a steep decline in activity when the COVID-19 pandemic hit in mid-March. In reaction to stay-at-home orders, record-high unemployment, health concerns, and general uncertainty brought about by the pandemic, second-quarter sales dropped 17.3% for single-family homes and 38.1% for condos, compared to the same period in 2019. Deemed an essential business, the real estate industry pivoted to implement new policies and procedures that allowed for safe client interactions, open houses and transaction elements while adhering to public health and safety guidelines. Third-quarter sales saw a 4.0% bump in single-family home sales and a 13.4% decline in condo sales. By the end of the year, mortgage rates were at a record low, with the average 30-year fixed-rate dipping more than one percentage point over the 12-month period. Total annual single-family home sales were up 2.3% over 2019, but condo sales remained down, declining 13.0%. Increased purchasing power from lower mortgage rates and heightened competition spurred by low inventory resulted in annual median sales price increases of 5.2% to $830,000 for single-family homes and 2.4% to $435,000 for condos. Total new listings were down by 17.7% for single-family homes and 14.4% for condos compared to 2019. The number of single-family homes sold over the original asking price was up 168.1% in the fourth quarter of 2020, representing 45.0% of the quarter’s sales compared to just 19.0% in the year prior. Competitive bids were also seen more frequently in the condo market during the fourth quarter of 2020. The number of condos sold over the original asking price increased by 93.2%, representing 22.3% of the quarterly sales compared to 12.1% in 2019. Neighborhood trends and sales by bedroom count may indicate how some buyers navigated their options during the pandemic. The greatest annual sales increases for single-family homes occurred in Kailua, North Shore and Ewa Plain regions. The Ewa Plain and Kailua also saw the greatest increase in sales volume for condos. Given the shortage in single-family home inventory, preferences for more space and added purchasing power from low mortgage rates, condos with four or more bedrooms experienced a 31.7% jump in closed sales at 79 properties compared to 60 in 2019.

Monthly Indicators 2
Closed Sales 3
$870,000 +6.1% Median Sales Price 4
Median Days on Market 5
New Listings 6
Pending Sales 7
420 +35.9% Months of Inventory 8
Active Listings 9
Average Sales Price 10
% of Original Listing Price Received 11
$1,113,076 +13.1% Active Continue to Show 12
Housing Supply Overview 13
Pending Sales (by price range) 14-15 Median Days on Market (by price range) 16-17
% of list price received (by price range) 18-19
$455,000 +6.9% Inventory of Homes (by price range) 20-21
Months Supply of Inventory (price range) 22-23
514 +20.1% Historical Graphs 24-25
Price Graphs 26-27
$504,222 -12.6%
SOURCE: Honolulu Board of REALTORS®, residential re-sales data compiled from HiCentral MLS, Ltd.® ©Copyright 2020. Honolulu Board of REALTORS®. All Rights Reserved. Information herein deemed reliable but not guaranteed.
Oahu Monthly Housing StatisticsDecember 2020
Median Sales Price
SINGLE FAMILY HOMES
Closed Sales
CONDOS
Median Sales Price
Closed Sales
Average Sales Price
INDEX:
Average Sales Price
WĂŐĞ�ϭ�ŽĨ�Ϯϳ

Dec-20 Dec-19 % YTD-20 YTD-19 %Closed Sales 420 309 35.9% 3,838 3,750 2.3%Median Sales Price $870,000 $820,000 6.1% $830,000 $789,000 5.2%Median Days on Market 10 18 -44.4% 14 22 -36.4%New Listings 264 229 15.3% 4,444 5,398 -17.7%Pending Sales 644 443 45.4% 6,485 5,516 17.6%Months of Inventory 1.4 2.5 -44.0% -- -- --Active Listings 770 1,157 -33.4% -- -- --Average Sales Price $1,113,076 $983,758 13.1% $1,014,167 $953,772 6.3%% of Original Listing Price Received 100.0% 98.5% 1.5% 99.3% 98.1% 1.2%
Dec-20 Dec-19 % YTD-20 YTD-19 %Closed Sales 514 428 20.1% 4,706 5,408 -13.0%Median Sales Price $455,000 $425,500 6.9% $435,000 $425,000 2.4%Median Days on Market 19 30 -36.7% 24 25 -4.0%New Listings 466 450 3.6% 7,112 8,307 -14.4%Pending Sales 738 570 29.5% 7,059 7,493 -5.8%Months of Inventory 3.3 3.4 -2.9% -- -- --Active Listings 1,938 2,094 -7.4% -- -- --Average Sales Price $504,222 $576,898 -12.6% $502,965 $519,375 -3.2%% of Original Listing Price Received 98.5% 97.5% 1.0% 98.1% 97.9% 0.2%
Single Family Homes
Condos
Monthly IndicatorsDecember 2020
SOURCE: Honolulu Board of REALTORS®, compiled from MLS data. ©Copyright 2020. Honolulu Board of REALTORS®. All Rights Reserved. Information herein deemed reliable but not guaranteed.
WĂŐĞ�Ϯ�ŽĨ�Ϯϳ
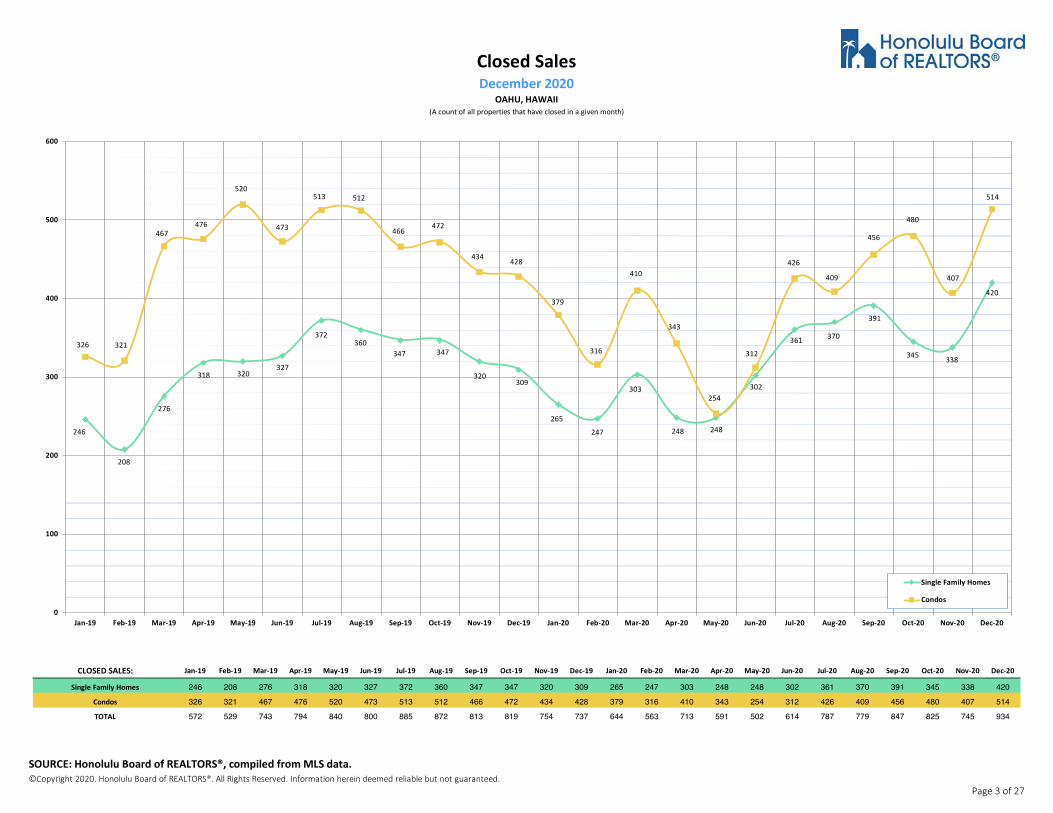
CLOSED SALES: Jan-19 Feb-19 Mar-19 Apr-19 May-19 Jun-19 Jul-19 Aug-19 Sep-19 Oct-19 Nov-19 Dec-19 Jan-20 Feb-20 Mar-20 Apr-20 May-20 Jun-20 Jul-20 Aug-20 Sep-20 Oct-20 Nov-20 Dec-20
Single Family Homes 246 208 276 318 320 327 372 360 347 347 320 309 265 247 303 248 248 302 361 370 391 345 338 420
Condos 326 321 467 476 520 473 513 512 466 472 434 428 379 316 410 343 254 312 426 409 456 480 407 514
TOTAL 572 529 743 794 840 800 885 872 813 819 754 737 644 563 713 591 502 614 787 779 847 825 745 934
Closed SalesDecember 2020
(A count of all properties that have closed in a given month)OAHU, HAWAII
246
208
276
318 320327
372360
347 347
320309
265
247
303
248 248
302
361 370
391
345 338
420
326 321
467476
520
473
513 512
466472
434 428
379
316
410
343
254
312
426
409
456
480
407
514
0
100
200
300
400
500
600
Jan-19 Feb-19 Mar-19 Apr-19 May-19 Jun-19 Jul-19 Aug-19 Sep-19 Oct-19 Nov-19 Dec-19 Jan-20 Feb-20 Mar-20 Apr-20 May-20 Jun-20 Jul-20 Aug-20 Sep-20 Oct-20 Nov-20 Dec-20
Single Family Homes
Condos
SOURCE: Honolulu Board of REALTORS®, compiled from MLS data. ©Copyright 2020. Honolulu Board of REALTORS®. All Rights Reserved. Information herein deemed reliable but not guaranteed.
WĂŐĞ�ϯ�ŽĨ�Ϯϳ

MEDIAN SALES PRICE: Jan-19 Feb-19 Mar-19 Apr-19 May-19 Jun-19 Jul-19 Aug-19 Sep-19 Oct-19 Nov-19 Dec-19 Jan-20 Feb-20 Mar-20 Apr-20 May-20 Jun-20 Jul-20 Aug-20 Sep-20 Oct-20 Nov-20 Dec-20
Single Family Homes 767,500 789,000 782,500 766,750 770,000 800,000 835,000 790,000 777,000 780,000 794,750 820,000 770,000 765,000 810,000 809,000 797,000 770,000 815,000 839,000 880,000 865,000 872,500 870,000 Condos 399,000 415,000 429,000 418,950 417,500 432,500 461,500 419,500 445,000 441,000 415,000 425,500 429,000 430,000 435,000 450,000 399,000 421,500 440,000 430,000 445,000 439,500 420,000 455,000
Median Sales PriceDecember 2020
OAHU, HAWAII(The median sales price for all closed properties in a given month)
$767,500$789,000 $782,500
$766,750 $770,000
$800,000
$835,000
$790,000$777,000 $780,000
$794,750
$820,000
$770,000 $765,000
$810,000 $809,000$797,000
$770,000
$815,000
$839,000
$880,000$865,000 $872,500 $870,000
$399,000$415,000
$429,000$418,950 $417,500
$432,500
$461,500
$419,500
$445,000 $441,000
$415,000$425,500 $429,000 $430,000 $435,000
$450,000
$399,000$421,500
$440,000$430,000
$445,000 $439,500$420,000
$455,000
-
100,000
200,000
300,000
400,000
500,000
600,000
700,000
800,000
900,000
1,000,000
Jan-19 Feb-19 Mar-19 Apr-19 May-19 Jun-19 Jul-19 Aug-19 Sep-19 Oct-19 Nov-19 Dec-19 Jan-20 Feb-20 Mar-20 Apr-20 May-20 Jun-20 Jul-20 Aug-20 Sep-20 Oct-20 Nov-20 Dec-20
Single Family Homes
Condos
SOURCE: Honolulu Board of REALTORS®, compiled from MLS data. ©Copyright 2020. Honolulu Board of REALTORS®. All Rights Reserved. Information herein deemed reliable but not guaranteed.
WĂŐĞ�ϰ�ŽĨ�Ϯϳ

MEDIAN DAYS ON MARKET: Jan-19 Feb-19 Mar-19 Apr-19 May-19 Jun-19 Jul-19 Aug-19 Sep-19 Oct-19 Nov-19 Dec-19 Jan-20 Feb-20 Mar-20 Apr-20 May-20 Jun-20 Jul-20 Aug-20 Sep-20 Oct-20 Nov-20 Dec-20
Single Family Homes 27 25 24 25 21 18 17 27 29 23 23 18 35 35 15 19 13 20 13 15 9 10 10 10
Condos 27 25 22 29 27 27 26 22 27 26 26 30 33 34 23 27 23 40 26 23 21 18 16 19
Median Days on MarketDecember 2020
OAHU, HAWAII(The median number of days between when a property is first listed and when an offer is accepted)
27
2524
25
21
1817
27
29
23 23
18
35 35
15
19
13
20
13
15
910 10 10
27
25
22
29
27 2726
22
2726 26
3033
34
23
27
23
40
26
23
21
18
16
19
0
5
10
15
20
25
30
35
40
45
Jan-19 Feb-19 Mar-19 Apr-19 May-19 Jun-19 Jul-19 Aug-19 Sep-19 Oct-19 Nov-19 Dec-19 Jan-20 Feb-20 Mar-20 Apr-20 May-20 Jun-20 Jul-20 Aug-20 Sep-20 Oct-20 Nov-20 Dec-20
Single Family Homes
Condos
SOURCE: Honolulu Board of REALTORS®, compiled from MLS data. ©Copyright 2020. Honolulu Board of REALTORS®. All Rights Reserved. Information herein deemed reliable but not guaranteed.
WĂŐĞ�ϱ�ŽĨ�Ϯϳ

NEW LISTINGS: Jan-19 Feb-19 Mar-19 Apr-19 May-19 Jun-19 Jul-19 Aug-19 Sep-19 Oct-19 Nov-19 Dec-19 Jan-20 Feb-20 Mar-20 Apr-20 May-20 Jun-20 Jul-20 Aug-20 Sep-20 Oct-20 Nov-20 Dec-20
Single Family Homes 519 383 468 532 550 459 520 484 451 461 342 229 428 399 390 290 345 392 422 387 368 380 379 264
Condos 867 663 712 727 726 755 778 753 638 653 585 450 696 639 610 440 509 598 657 696 576 664 561 466
TOTAL 1386 1046 1180 1259 1276 1214 1298 1237 1089 1114 927 679 1124 1038 1000 730 854 990 1079 1083 944 1044 940 730
New ListingsDecember 2020
OAHU, HAWAII(A count of the properties that have been newly listed on the market in a given month)
519
383
468
532550
459
520
484
451 461
342
229
428399 390
290
345
392
422
387368
380 379
264
867
663
712727 726
755778
753
638653
585
450
696
639
610
440
509
598
657
696
576
664
561
466
0
100
200
300
400
500
600
700
800
900
1000
Jan-19 Feb-19 Mar-19 Apr-19 May-19 Jun-19 Jul-19 Aug-19 Sep-19 Oct-19 Nov-19 Dec-19 Jan-20 Feb-20 Mar-20 Apr-20 May-20 Jun-20 Jul-20 Aug-20 Sep-20 Oct-20 Nov-20 Dec-20
Single Family Homes
Condos
SOURCE: Honolulu Board of REALTORS®, compiled from MLS data. ©Copyright 2020. Honolulu Board of REALTORS®. All Rights Reserved. Information herein deemed reliable but not guaranteed.
WĂŐĞ�ϲ�ŽĨ�Ϯϳ

PENDING SALES: Jan-19 Feb-19 Mar-19 Apr-19 May-19 Jun-19 Jul-19 Aug-19 Sep-19 Oct-19 Nov-19 Dec-19 Jan-20 Feb-20 Mar-20 Apr-20 May-20 Jun-20 Jul-20 Aug-20 Sep-20 Oct-20 Nov-20 Dec-20
Single Family Homes 352 335 424 455 495 497 521 533 494 506 461 443 411 402 470 422 437 509 609 662 683 618 618 644Condos 454 498 659 640 710 662 705 708 637 642 608 570 543 520 581 465 395 483 636 652 685 691 670 738TOTAL 806 833 1083 1095 1205 1159 1226 1241 1131 1148 1069 1013 954 922 1051 887 832 992 1245 1314 1368 1309 1288 1382
Pending SalesDecember 2020
OAHU, HAWAII(A count of the properties that have offers accepted on them in a given month)
352335
424
455
495 497
521533
494506
461443
411402
470
422437
509
609
662
683
618 618
644
454
498
659640
710
662
705 708
637 642
608
570
543
520
581
465
395
483
636652
685 691670
738
0
100
200
300
400
500
600
700
800
Jan-19 Feb-19 Mar-19 Apr-19 May-19 Jun-19 Jul-19 Aug-19 Sep-19 Oct-19 Nov-19 Dec-19 Jan-20 Feb-20 Mar-20 Apr-20 May-20 Jun-20 Jul-20 Aug-20 Sep-20 Oct-20 Nov-20 Dec-20
Single Family Homes
Condos
SOURCE: Honolulu Board of REALTORS®, compiled from MLS data. ©Copyright 2020. Honolulu Board of REALTORS®. All Rights Reserved. Information herein deemed reliable but not guaranteed.
WĂŐĞ�ϳ�ŽĨ�Ϯϳ
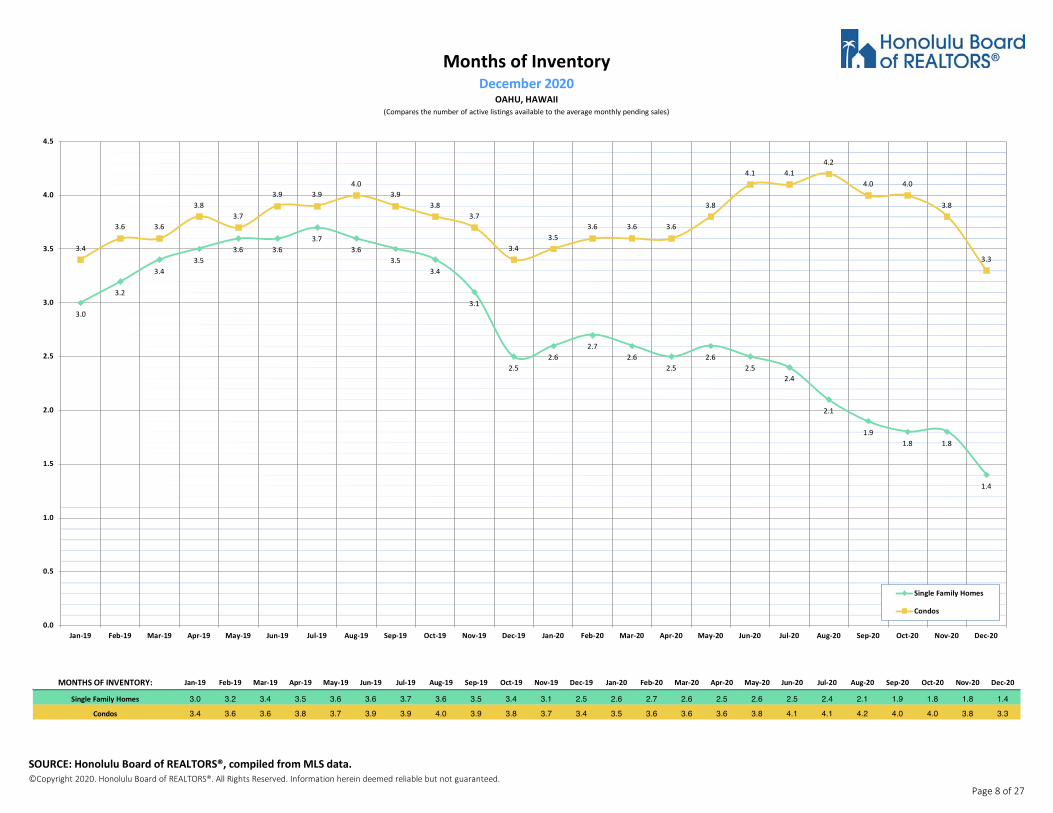
MONTHS OF INVENTORY: Jan-19 Feb-19 Mar-19 Apr-19 May-19 Jun-19 Jul-19 Aug-19 Sep-19 Oct-19 Nov-19 Dec-19 Jan-20 Feb-20 Mar-20 Apr-20 May-20 Jun-20 Jul-20 Aug-20 Sep-20 Oct-20 Nov-20 Dec-20
Single Family Homes 3.0 3.2 3.4 3.5 3.6 3.6 3.7 3.6 3.5 3.4 3.1 2.5 2.6 2.7 2.6 2.5 2.6 2.5 2.4 2.1 1.9 1.8 1.8 1.4
Condos 3.4 3.6 3.6 3.8 3.7 3.9 3.9 4.0 3.9 3.8 3.7 3.4 3.5 3.6 3.6 3.6 3.8 4.1 4.1 4.2 4.0 4.0 3.8 3.3
Months of InventoryDecember 2020
OAHU, HAWAII(Compares the number of active listings available to the average monthly pending sales)
3.0
3.2
3.43.5
3.6 3.63.7
3.63.5
3.4
3.1
2.52.6
2.72.6
2.52.6
2.52.4
2.1
1.91.8 1.8
1.4
3.4
3.6 3.6
3.83.7
3.9 3.94.0
3.93.8
3.7
3.43.5
3.6 3.6 3.6
3.8
4.1 4.14.2
4.0 4.0
3.8
3.3
0.0
0.5
1.0
1.5
2.0
2.5
3.0
3.5
4.0
4.5
Jan-19 Feb-19 Mar-19 Apr-19 May-19 Jun-19 Jul-19 Aug-19 Sep-19 Oct-19 Nov-19 Dec-19 Jan-20 Feb-20 Mar-20 Apr-20 May-20 Jun-20 Jul-20 Aug-20 Sep-20 Oct-20 Nov-20 Dec-20
Single Family Homes
Condos
SOURCE: Honolulu Board of REALTORS®, compiled from MLS data. ©Copyright 2020. Honolulu Board of REALTORS®. All Rights Reserved. Information herein deemed reliable but not guaranteed.
WĂŐĞ�ϴ�ŽĨ�Ϯϳ
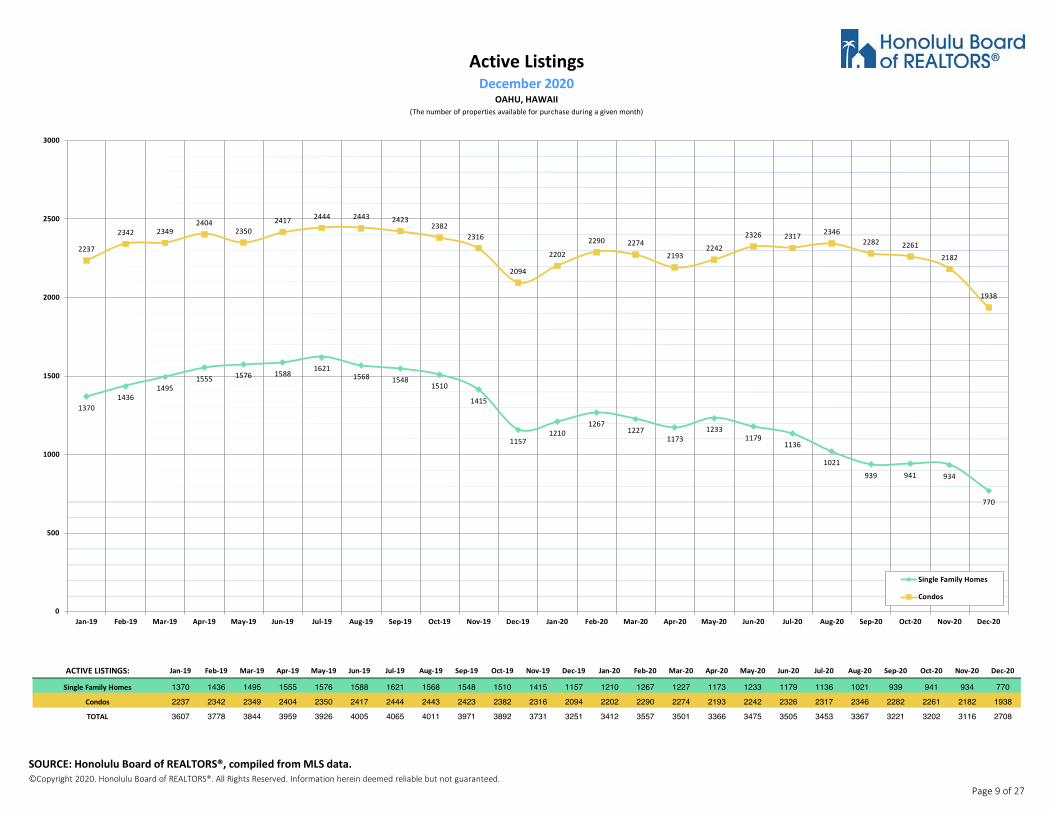
ACTIVE LISTINGS: Jan-19 Feb-19 Mar-19 Apr-19 May-19 Jun-19 Jul-19 Aug-19 Sep-19 Oct-19 Nov-19 Dec-19 Jan-20 Feb-20 Mar-20 Apr-20 May-20 Jun-20 Jul-20 Aug-20 Sep-20 Oct-20 Nov-20 Dec-20
Single Family Homes 1370 1436 1495 1555 1576 1588 1621 1568 1548 1510 1415 1157 1210 1267 1227 1173 1233 1179 1136 1021 939 941 934 770
Condos 2237 2342 2349 2404 2350 2417 2444 2443 2423 2382 2316 2094 2202 2290 2274 2193 2242 2326 2317 2346 2282 2261 2182 1938
TOTAL 3607 3778 3844 3959 3926 4005 4065 4011 3971 3892 3731 3251 3412 3557 3501 3366 3475 3505 3453 3367 3221 3202 3116 2708
Active ListingsDecember 2020
OAHU, HAWAII(The number of properties available for purchase during a given month)
13701436
14951555 1576 1588
16211568 1548
1510
1415
11571210
12671227
11731233
11791136
1021939 941 934
770
2237
2342 23492404
23502417 2444 2443 2423
23822316
2094
2202
2290 22742193
22422326 2317 2346
2282 22612182
1938
0
500
1000
1500
2000
2500
3000
Jan-19 Feb-19 Mar-19 Apr-19 May-19 Jun-19 Jul-19 Aug-19 Sep-19 Oct-19 Nov-19 Dec-19 Jan-20 Feb-20 Mar-20 Apr-20 May-20 Jun-20 Jul-20 Aug-20 Sep-20 Oct-20 Nov-20 Dec-20
Single Family Homes
Condos
SOURCE: Honolulu Board of REALTORS®, compiled from MLS data. ©Copyright 2020. Honolulu Board of REALTORS®. All Rights Reserved. Information herein deemed reliable but not guaranteed.
WĂŐĞ�ϵ�ŽĨ�Ϯϳ

AVERAGE SALES PRICE: Jan-19 Feb-19 Mar-19 Apr-19 May-19 Jun-19 Jul-19 Aug-19 Sep-19 Oct-19 Nov-19 Dec-19 Jan-20 Feb-20 Mar-20 Apr-20 May-20 Jun-20 Jul-20 Aug-20 Sep-20 Oct-20 Nov-20 Dec-20
Single Family Homes 967,119 1,001,370 905,155 876,258 901,482 954,149 978,651 961,456 952,257 924,895 1,058,258 983,758 899,689 974,283 972,367 941,708 1,003,419 899,271 1,016,491 1,022,449 1,073,692 1,065,594 1,084,834 1,113,076 Condos 490,812 499,059 515,150 508,023 535,992 528,541 530,870 486,234 545,491 516,273 485,383 576,898 508,395 527,836 528,606 521,484 453,220 481,220 475,346 527,573 545,367 479,736 472,726 504,222
Average Sales PriceDecember 2020
OAHU, HAWAII(The average sales price for all closed sales in a given month)
$967,119
$1,001,370
$905,155
$876,258$901,482
$954,149
$978,651$961,456 $952,257
$924,895
$1,058,258
$983,758
$899,689
$974,283 $972,367
$941,708
$1,003,419
$899,271
$1,016,491$1,022,449
$1,073,692 $1,065,594$1,084,834
$1,113,076
$490,812 $499,059$515,150 $508,023
$535,992 $528,541 $530,870
$486,234
$545,491
$516,273$485,383
$576,898
$508,395$527,836 $528,606 $521,484
$453,220
$481,220$475,346
$527,573$545,367
$479,736 $472,726
$504,222
-
200,000
400,000
600,000
800,000
1,000,000
1,200,000
Jan-19 Feb-19 Mar-19 Apr-19 May-19 Jun-19 Jul-19 Aug-19 Sep-19 Oct-19 Nov-19 Dec-19 Jan-20 Feb-20 Mar-20 Apr-20 May-20 Jun-20 Jul-20 Aug-20 Sep-20 Oct-20 Nov-20 Dec-20
Single Family Homes
Condos
SOURCE: Honolulu Board of REALTORS®, compiled from MLS data. ©Copyright 2020. Honolulu Board of REALTORS®. All Rights Reserved. Information herein deemed reliable but not guaranteed.
WĂŐĞ�ϭϬ�ŽĨ�Ϯϳ
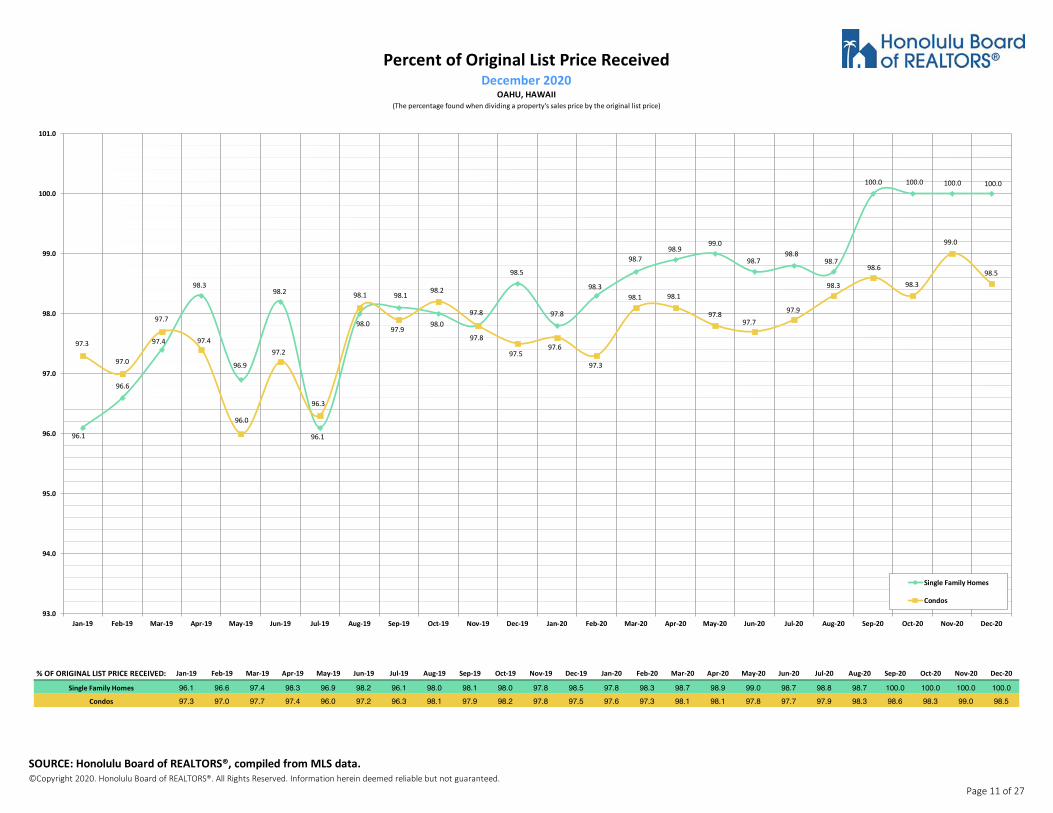
% OF ORIGINAL LIST PRICE RECEIVED: Jan-19 Feb-19 Mar-19 Apr-19 May-19 Jun-19 Jul-19 Aug-19 Sep-19 Oct-19 Nov-19 Dec-19 Jan-20 Feb-20 Mar-20 Apr-20 May-20 Jun-20 Jul-20 Aug-20 Sep-20 Oct-20 Nov-20 Dec-20
Single Family Homes 96.1 96.6 97.4 98.3 96.9 98.2 96.1 98.0 98.1 98.0 97.8 98.5 97.8 98.3 98.7 98.9 99.0 98.7 98.8 98.7 100.0 100.0 100.0 100.0Condos 97.3 97.0 97.7 97.4 96.0 97.2 96.3 98.1 97.9 98.2 97.8 97.5 97.6 97.3 98.1 98.1 97.8 97.7 97.9 98.3 98.6 98.3 99.0 98.5
Percent of Original List Price ReceivedDecember 2020
OAHU, HAWAII(The percentage found when dividing a property's sales price by the original list price)
96.1
96.6
97.4
98.3
96.9
98.2
96.1
98.0
98.1
98.0
97.8
98.5
97.8
98.3
98.798.9
99.0
98.798.8
98.7
100.0 100.0 100.0 100.0
97.3
97.0
97.7
97.4
96.0
97.2
96.3
98.1
97.9
98.2
97.8
97.597.6
97.3
98.1 98.1
97.897.7
97.9
98.3
98.6
98.3
99.0
98.5
93.0
94.0
95.0
96.0
97.0
98.0
99.0
100.0
101.0
Jan-19 Feb-19 Mar-19 Apr-19 May-19 Jun-19 Jul-19 Aug-19 Sep-19 Oct-19 Nov-19 Dec-19 Jan-20 Feb-20 Mar-20 Apr-20 May-20 Jun-20 Jul-20 Aug-20 Sep-20 Oct-20 Nov-20 Dec-20
Single Family Homes
Condos
SOURCE: Honolulu Board of REALTORS®, compiled from MLS data. ©Copyright 2020. Honolulu Board of REALTORS®. All Rights Reserved. Information herein deemed reliable but not guaranteed.
WĂŐĞ�ϭϭ�ŽĨ�Ϯϳ

ACTIVE CONTINUE TO SHOW: Jan-19 Feb-19 Mar-19 Apr-19 May-19 Jun-19 Jul-19 Aug-19 Sep-19 Oct-19 Nov-19 Dec-19 Jan-20 Feb-20 Mar-20 Apr-20 May-20 Jun-20 Jul-20 Aug-20 Sep-20 Oct-20 Nov-20 Dec-20
Single Family Homes 342 373 430 450 497 474 484 482 468 424 420 324 377 453 402 369 436 496 494 456 410 420 431 351Condos 458 530 546 588 591 580 581 574 531 508 502 409 413 506 429 333 384 511 504 554 540 546 537 479TOTAL 800 903 976 1038 1088 1054 1065 1056 999 932 922 733 790 959 831 702 820 1007 998 1010 950 966 968 830
Active Continue to ShowDecember 2020
OAHU, HAWAII(A count of the properties that are in "ES" status during the current month)
342
373
430
450
497
474484 482
468
424 420
324
377
453
402 369
436
496 494
456
410420
431
351
458
530546
588 591580 581
574
531
508 502
409 413
506
429
333
384
511504
554540 546 537
479
0
100
200
300
400
500
600
700
Jan-19 Feb-19 Mar-19 Apr-19 May-19 Jun-19 Jul-19 Aug-19 Sep-19 Oct-19 Nov-19 Dec-19 Jan-20 Feb-20 Mar-20 Apr-20 May-20 Jun-20 Jul-20 Aug-20 Sep-20 Oct-20 Nov-20 Dec-20
Single Family Homes
Condos
SOURCE: Honolulu Board of REALTORS®, compiled from MLS data. ©Copyright 2020. Honolulu Board of REALTORS®. All Rights Reserved. Information herein deemed reliable but not guaranteed.
WĂŐĞ�ϭϮ�ŽĨ�Ϯϳ

Single Family Homes Dec-20 Dec-19 % Dec-20 Dec-19 % Dec-20 Dec-19 % Dec-20 Dec-19 % Dec-20 Dec-19 %
$350,000 and Below 41 60 -31.7% 73 48 52.4% 93.7% 94.0% -0.3% 5 18 -72.2% 1.2 3.6 -67.4%$350,001 - $475,000 127 114 11.4% 47 19 145.3% 96.5% 97.8% -1.4% 5 34 -85.3% 0.5 3.2 -85.0%$475,001 - $550,000 150 202 -25.7% 17 29 -41.7% 99.0% 97.1% 2.0% 14 33 -57.6% 0.9 1.9 -49.9%$550,001 - $650,000 450 540 -16.7% 17 27 -39.0% 99.3% 98.1% 1.3% 47 114 -58.8% 1.1 2.7 -59.3%$650,001 - $800,000 1100 1149 -4.3% 12 24 -48.7% 100.0% 98.0% 2.1% 92 198 -53.5% 1.0 2.2 -55.9%
$800,001 - $1.1M 1236 1069 15.6% 17 21 -21.6% 99.2% 97.4% 1.9% 185 248 -25.4% 2.0 2.9 -32.3%$1.1M - $1.9M 756 583 29.7% 29 27 6.8% 97.2% 95.9% 1.3% 206 263 -21.7% 3.9 5.4 -28.5%
$1.9M and Above 223 174 28.2% 66 44 50.4% 93.9% 93.4% 0.5% 216 249 -13.3% 13.7 16.5 -17.1%All Single Family Homes 4083 3891 4.9% 17 23 -26.1% 99.1% 97.5% 1.6% 770 1157 -33.4% 2.3 3.7 -36.6%
Condos Dec-20 Dec-19 % Dec-20 Dec-19 % Dec-20 Dec-19 % Dec-20 Dec-19 % Dec-20 Dec-19 %
$150,000 and below 204 225 -9.3% 52 37 42.1% 92.4% 92.4% -0.1% 111 93 19.4% 6.2 4.5 36.7%$150,001 - $200,000 190 240 -20.8% 49 34 46.5% 93.2% 96.0% -2.9% 126 92 37.0% 7.5 4.2 78.5%$200,001 - $250,000 286 365 -21.6% 36 27 31.1% 96.9% 96.1% 0.8% 127 112 13.4% 5.0 3.6 40.0%$250,001 - $300,000 332 382 -13.1% 43 30 44.5% 96.7% 97.5% -0.8% 149 162 -8.0% 5.2 4.6 12.1%$300,001 - $375,000 735 935 -21.4% 30 21 39.9% 97.5% 98.1% -0.6% 239 230 3.9% 3.4 2.9 18.3%$375,001 - $475,000 1142 1118 2.1% 20 23 -12.0% 98.9% 97.7% 1.2% 313 357 -12.3% 3.4 3.7 -9.4%$475,001 - $700,000 1466 1510 -2.9% 19 26 -24.8% 99.0% 98.0% 1.0% 394 494 -20.2% 3.2 3.9 -18.3%$700,001 and above 612 808 -24.3% 42 40 4.6% 97.2% 96.4% 0.8% 479 554 -13.5% 8.1 8.3 -2.5%
All Condos 4967 5583 -11.0% 25 26 -3.5% 98.1% 97.3% 0.8% 1938 2094 -7.4% 4.5 4.4 1.8%
Housing Supply OverviewDecember 2020
OAHU, HAWAII
Pending Sales Days on MarketPercentage of Original
Price ReceivedInventory of Homes
for SaleMonths Supply of
Inventory
Pending Sales Days on MarketPercentage of Original
Price ReceivedInventory of Homes
for SaleMonths Supply of
Inventory
SOURCE: Honolulu Board of REALTORS®, compiled from MLS data. ©Copyright 2020. Honolulu Board of REALTORS®. All Rights Reserved. Information herein deemed reliable but not guaranteed.
WĂŐĞ�ϭϯ�ŽĨ�Ϯϳ

Jan-19 Feb-19 Mar-19 Apr-19 May-19 Jun-19 Jul-19 Aug-19 Sep-19 Oct-19 Nov-19 Dec-19 Jan-20 Feb-20 Mar-20 Apr-20 May-20 Jun-20 Jul-20 Aug-20 Sep-20 Oct-20 Nov-20 Dec-20
$350,000 and Below 61 60 59 63 63 58 55 57 58 61 63 60 57 57 58 51 49 52 53 53 51 46 43 41$350,001 - $475,000 157 148 142 130 125 120 119 121 116 116 116 114 119 120 119 118 116 125 134 132 130 127 126 127$475,001 - $550,000 213 217 210 215 213 212 212 203 199 210 207 202 205 202 192 184 183 179 175 168 166 167 155 150$550,001 - $650,000 491 501 496 486 509 495 493 504 533 547 530 540 542 544 540 542 527 533 528 544 509 481 466 450$650,001 - $800,000 1038 1037 1015 1076 1089 1081 1076 1110 1117 1129 1148 1149 1158 1188 1214 1173 1155 1140 1155 1137 1140 1115 1096 1100
$800,001 - $1.1M 986 991 1026 1010 1015 1007 1027 1033 1017 1033 1044 1069 1085 1086 1101 1094 1080 1076 1089 1117 1161 1168 1205 1236$1.1M - $1.9M 596 601 601 592 588 579 594 574 576 573 573 583 589 597 610 611 604 602 593 633 671 698 733 756
$1.9M and Above 197 191 186 182 178 182 179 179 177 174 175 174 176 182 185 184 185 181 189 185 190 196 200 223All Single Family Homes 3739 3746 3735 3754 3780 3734 3755 3781 3793 3843 3856 3891 3931 3976 4019 3957 3899 3888 3916 3969 4018 3998 4024 4083
Pending SalesDecember 2020
Single Family Homes: Monthly, by Price Range(A count of properties that have offers accepted on them in a given month. Based on a 12 month rolling total.)
0
200
400
600
800
1000
1200
1400
Jan-19 Feb-19 Mar-19 Apr-19 May-19 Jun-19 Jul-19 Aug-19 Sep-19 Oct-19 Nov-19 Dec-19 Jan-20 Feb-20 Mar-20 Apr-20 May-20 Jun-20 Jul-20 Aug-20 Sep-20 Oct-20 Nov-20 Dec-20
$350,000 and Below
$350,001 - $475,000
$475,001 - $550,000
$550,001 - $650,000$650,001 - $800,000
$800,001 - $1.1M
$1.1M - $1.9M
$1.9M and Above
SOURCE: Honolulu Board of REALTORS®, compiled from MLS data. ©Copyright 2020. Honolulu Board of REALTORS®. All Rights Reserved. Information herein deemed reliable but not guaranteed.
WĂŐĞ�ϭϰ�ŽĨ�Ϯϳ
Jan-19 Feb-19 Mar-19 Apr-19 May-19 Jun-19 Jul-19 Aug-19 Sep-19 Oct-19 Nov-19 Dec-19 Jan-20 Feb-20 Mar-20 Apr-20 May-20 Jun-20 Jul-20 Aug-20 Sep-20 Oct-20 Nov-20 Dec-20
$150,000 and below 265 270 265 257 257 255 251 243 234 228 226 225 226 231 232 231 225 217 210 203 204 209 207 204$150,001 - $200,000 280 270 262 271 272 263 262 261 258 258 266 240 237 237 222 212 196 196 198 189 187 184 179 190$200,001 - $250,000 378 388 389 378 380 373 373 378 379 377 365 365 357 341 340 315 300 294 298 282 279 280 291 286$250,001 - $300,000 438 434 439 442 439 429 415 417 415 395 392 382 378 391 377 356 332 334 339 324 311 330 329 332$300,001 - $375,000 965 963 976 943 949 937 961 960 947 940 951 935 955 964 937 898 858 825 799 794 777 751 742 735$375,001 - $475,000 1170 1179 1181 1160 1170 1144 1130 1128 1120 1129 1136 1118 1130 1140 1135 1113 1085 1068 1087 1079 1104 1111 1123 1142$475,001 - $700,000 1528 1524 1496 1477 1494 1479 1516 1502 1471 1520 1519 1510 1563 1567 1557 1523 1448 1413 1395 1405 1421 1407 1434 1466$700,001 and above 831 806 810 783 795 800 786 788 781 784 784 808 818 827 808 783 736 699 672 653 624 623 618 612
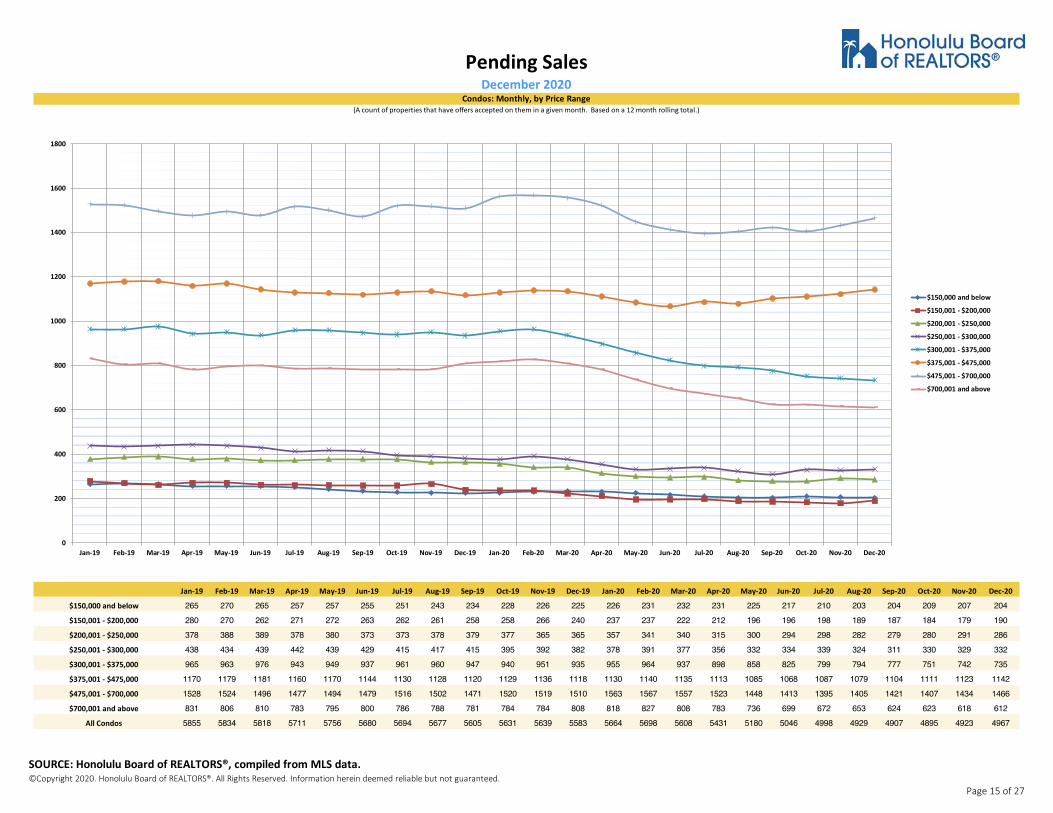
All Condos 5855 5834 5818 5711 5756 5680 5694 5677 5605 5631 5639 5583 5664 5698 5608 5431 5180 5046 4998 4929 4907 4895 4923 4967
Pending SalesCondos: Monthly, by Price Range
(A count of properties that have offers accepted on them in a given month. Based on a 12 month rolling total.)
December 2020
0
200
400
600
800
1000
1200
1400
1600
1800
Jan-19 Feb-19 Mar-19 Apr-19 May-19 Jun-19 Jul-19 Aug-19 Sep-19 Oct-19 Nov-19 Dec-19 Jan-20 Feb-20 Mar-20 Apr-20 May-20 Jun-20 Jul-20 Aug-20 Sep-20 Oct-20 Nov-20 Dec-20
$150,000 and below
$150,001 - $200,000
$200,001 - $250,000
$250,001 - $300,000
$300,001 - $375,000
$375,001 - $475,000
$475,001 - $700,000
$700,001 and above
SOURCE: Honolulu Board of REALTORS®, compiled from MLS data. ©Copyright 2020. Honolulu Board of REALTORS®. All Rights Reserved. Information herein deemed reliable but not guaranteed.
WĂŐĞ�ϭϱ�ŽĨ�Ϯϳ
Jan-19 Feb-19 Mar-19 Apr-19 May-19 Jun-19 Jul-19 Aug-19 Sep-19 Oct-19 Nov-19 Dec-19 Jan-20 Feb-20 Mar-20 Apr-20 May-20 Jun-20 Jul-20 Aug-20 Sep-20 Oct-20 Nov-20 Dec-20
$350,000 and Below 41 37 42 41 47 46 53 54 61 59 52 48 49 54 51 48 50 56 49 50 75 74 72 73$350,001 - $475,000 23 23 23 23 22 22 23 22 20 20 21 19 18 17 23 25 27 31 34 44 43 48 47 47$475,001 - $550,000 26 28 29 29 31 32 30 30 33 29 28 29 29 27 25 25 23 24 24 23 18 18 18 17$550,001 - $650,000 21 23 25 26 26 27 27 29 29 30 29 27 26 25 23 23 23 22 22 20 19 18 17 17$650,001 - $800,000 19 20 22 22 23 23 24 24 26 25 24 24 24 22 21 20 18 18 18 17 15 14 13 12
$800,001 - $1.1M 20 20 20 20 20 20 21 22 23 22 22 21 23 25 25 24 24 24 23 22 20 19 17 17$1.1M - $1.9M 27 25 27 28 28 28 28 30 31 31 30 27 27 29 30 29 31 31 32 32 31 30 29 29
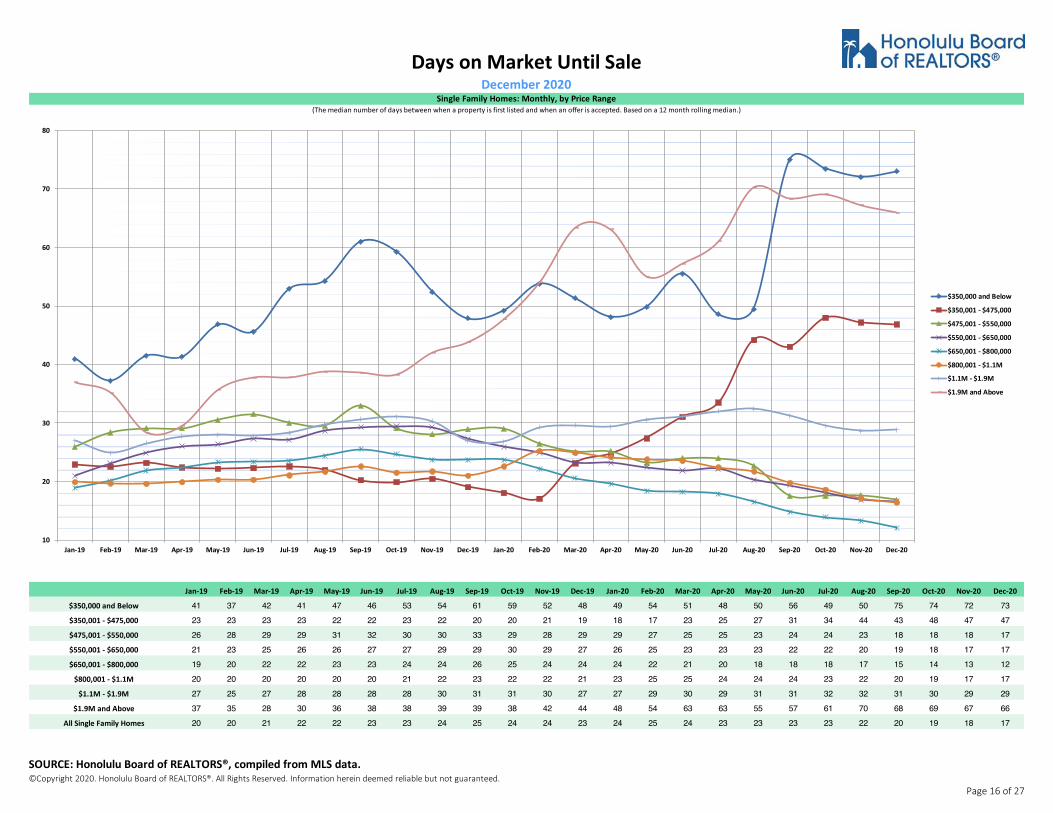
$1.9M and Above 37 35 28 30 36 38 38 39 39 38 42 44 48 54 63 63 55 57 61 70 68 69 67 66All Single Family Homes 20 20 21 22 22 23 23 24 25 24 24 23 24 25 24 23 23 23 23 22 20 19 18 17
Days on Market Until SaleDecember 2020
Single Family Homes: Monthly, by Price Range(The median number of days between when a property is first listed and when an offer is accepted. Based on a 12 month rolling median.)
10
20
30
40
50
60
70
80
Jan-19 Feb-19 Mar-19 Apr-19 May-19 Jun-19 Jul-19 Aug-19 Sep-19 Oct-19 Nov-19 Dec-19 Jan-20 Feb-20 Mar-20 Apr-20 May-20 Jun-20 Jul-20 Aug-20 Sep-20 Oct-20 Nov-20 Dec-20
$350,000 and Below
$350,001 - $475,000
$475,001 - $550,000
$550,001 - $650,000
$650,001 - $800,000
$800,001 - $1.1M
$1.1M - $1.9M
$1.9M and Above
SOURCE: Honolulu Board of REALTORS®, compiled from MLS data. ©Copyright 2020. Honolulu Board of REALTORS®. All Rights Reserved. Information herein deemed reliable but not guaranteed.
WĂŐĞ�ϭϲ�ŽĨ�Ϯϳ

Jan-19 Feb-19 Mar-19 Apr-19 May-19 Jun-19 Jul-19 Aug-19 Sep-19 Oct-19 Nov-19 Dec-19 Jan-20 Feb-20 Mar-20 Apr-20 May-20 Jun-20 Jul-20 Aug-20 Sep-20 Oct-20 Nov-20 Dec-20
$150,000 and below 38 39 38 39 39 40 41 42 39 39 39 37 40 38 43 42 44 46 44 45 48 49 50 52$150,001 - $200,000 31 30 29 28 29 29 27 28 33 33 35 34 37 38 39 41 41 42 43 48 44 48 47 49$200,001 - $250,000 23 22 23 24 25 27 26 26 27 25 27 27 29 33 34 34 33 32 36 35 35 35 34 36$250,001 - $300,000 22 23 23 24 26 27 28 29 28 28 28 30 32 33 33 33 32 34 36 38 40 42 45 43$300,001 - $375,000 17 17 17 18 18 18 19 19 20 20 21 21 21 25 25 26 26 26 28 29 29 31 30 30$375,001 - $475,000 19 19 19 20 21 21 22 22 22 23 23 23 24 24 24 24 23 24 23 23 23 22 21 20$475,001 - $700,000 20 22 23 24 24 25 26 26 27 26 26 26 24 23 23 22 22 23 23 23 22 21 20 19$700,001 and above 33 31 31 32 34 36 37 37 39 38 39 40 42 44 46 45 44 47 46 46 45 44 44 42
All Condos 21 21 21 22 23 24 24 25 25 25 26 26 27 27 28 27 27 28 28 28 28 27 26 25
Days on Market Until SaleDecember 2020
Condos: Monthly, by Price Range(The median number of days between when a property is first listed and when an offer is accepted. Based on a 12 month rolling median.)
10
15
20
25
30
35
40
45
50
55
Jan-19 Feb-19 Mar-19 Apr-19 May-19 Jun-19 Jul-19 Aug-19 Sep-19 Oct-19 Nov-19 Dec-19 Jan-20 Feb-20 Mar-20 Apr-20 May-20 Jun-20 Jul-20 Aug-20 Sep-20 Oct-20 Nov-20 Dec-20
$150,000 and below
$150,001 - $200,000
$200,001 - $250,000
$250,001 - $300,000
$300,001 - $375,000
$375,001 - $475,000
$475,001 - $700,000
$700,001 and above
SOURCE: Honolulu Board of REALTORS®, compiled from MLS data. ©Copyright 2020. Honolulu Board of REALTORS®. All Rights Reserved. Information herein deemed reliable but not guaranteed.
WĂŐĞ�ϭϳ�ŽĨ�Ϯϳ
Jan-19 Feb-19 Mar-19 Apr-19 May-19 Jun-19 Jul-19 Aug-19 Sep-19 Oct-19 Nov-19 Dec-19 Jan-20 Feb-20 Mar-20 Apr-20 May-20 Jun-20 Jul-20 Aug-20 Sep-20 Oct-20 Nov-20 Dec-20
$350,000 and Below 95.3% 96.1% 94.5% 95.4% 95.3% 94.2% 94.3% 94.2% 93.0% 93.0% 94.0% 94.0% 93.5% 93.2% 93.9% 94.0% 93.7% 94.2% 93.8% 94.0% 93.4% 93.5% 93.7% 93.7%$350,001 - $475,000 97.8% 98.2% 98.0% 97.9% 98.2% 98.2% 97.7% 97.2% 97.3% 97.2% 97.0% 97.8% 97.7% 97.7% 97.3% 97.7% 97.3% 96.8% 97.1% 96.6% 96.6% 96.3% 96.4% 96.5%$475,001 - $550,000 97.3% 97.3% 97.0% 97.1% 97.2% 97.2% 97.2% 97.3% 97.3% 97.0% 97.1% 97.1% 97.2% 97.5% 97.8% 97.9% 98.1% 98.3% 98.2% 97.9% 98.2% 98.5% 98.7% 99.0%$550,001 - $650,000 99.0% 99.0% 98.6% 98.3% 98.2% 98.0% 97.9% 98.2% 98.0% 97.9% 97.9% 98.1% 98.1% 98.2% 98.5% 98.7% 98.8% 99.0% 99.0% 98.9% 99.0% 99.1% 99.3% 99.3%$650,001 - $800,000 98.0% 97.8% 97.6% 97.7% 97.8% 97.7% 97.7% 97.7% 97.6% 97.7% 97.9% 98.0% 98.2% 98.3% 98.4% 98.6% 98.9% 99.0% 99.2% 99.3% 99.4% 99.6% 99.7% 100.0%
$800,001 - $1.1M 98.4% 98.3% 98.0% 97.9% 97.7% 97.4% 97.2% 97.1% 97.1% 97.1% 97.1% 97.4% 97.5% 97.3% 97.5% 97.6% 97.8% 98.0% 98.2% 98.4% 98.6% 98.9% 99.1% 99.2%$1.1M - $1.9M 95.3% 95.6% 95.4% 95.3% 94.7% 94.3% 94.1% 94.0% 94.3% 94.7% 95.1% 95.9% 96.1% 96.0% 96.2% 96.3% 96.7% 96.9% 96.8% 96.7% 96.9% 97.0% 97.1% 97.2%
$1.9M and Above 92.5% 92.8% 92.5% 92.1% 93.2% 92.6% 92.4% 92.1% 92.2% 92.9% 92.7% 93.4% 93.1% 92.9% 93.2% 93.3% 93.1% 93.5% 93.4% 93.6% 93.8% 93.8% 93.8% 93.9%All Single Family Homes 98.2% 97.9% 97.9% 97.9% 97.9% 97.8% 97.6% 97.5% 97.4% 97.5% 97.6% 97.5% 97.7% 97.8% 97.9% 98.0% 98.1% 98.2% 98.4% 98.5% 98.6% 98.8% 99.0% 99.1%
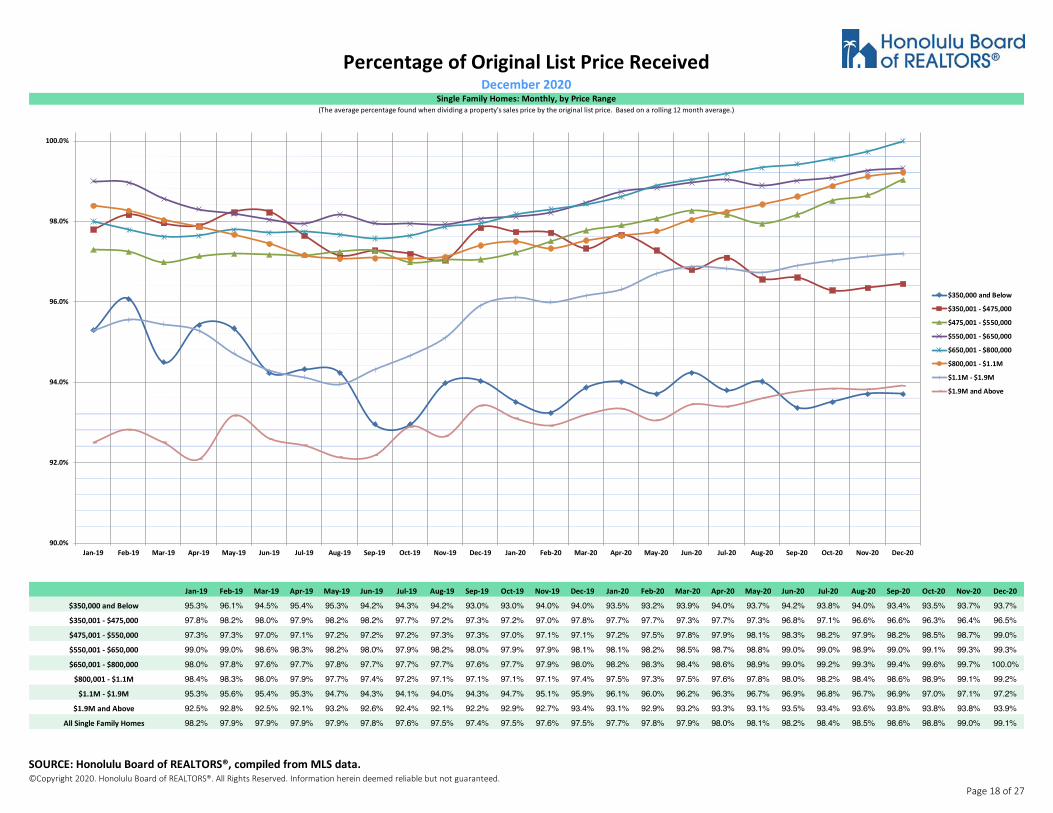
Percentage of Original List Price ReceivedDecember 2020
Single Family Homes: Monthly, by Price Range(The average percentage found when dividing a property's sales price by the original list price. Based on a rolling 12 month average.)
90.0%
92.0%
94.0%
96.0%
98.0%
100.0%
Jan-19 Feb-19 Mar-19 Apr-19 May-19 Jun-19 Jul-19 Aug-19 Sep-19 Oct-19 Nov-19 Dec-19 Jan-20 Feb-20 Mar-20 Apr-20 May-20 Jun-20 Jul-20 Aug-20 Sep-20 Oct-20 Nov-20 Dec-20
$350,000 and Below
$350,001 - $475,000
$475,001 - $550,000
$550,001 - $650,000
$650,001 - $800,000
$800,001 - $1.1M
$1.1M - $1.9M
$1.9M and Above
SOURCE: Honolulu Board of REALTORS®, compiled from MLS data. ©Copyright 2020. Honolulu Board of REALTORS®. All Rights Reserved. Information herein deemed reliable but not guaranteed.
WĂŐĞ�ϭϴ�ŽĨ�Ϯϳ

Jan-19 Feb-19 Mar-19 Apr-19 May-19 Jun-19 Jul-19 Aug-19 Sep-19 Oct-19 Nov-19 Dec-19 Jan-20 Feb-20 Mar-20 Apr-20 May-20 Jun-20 Jul-20 Aug-20 Sep-20 Oct-20 Nov-20 Dec-20
$150,000 and below 89.0% 89.7% 88.9% 90.3% 90.3% 90.9% 90.7% 90.5% 92.0% 92.6% 92.4% 92.4% 92.5% 92.4% 93.2% 92.8% 92.8% 92.5% 92.6% 92.9% 92.8% 92.8% 92.2% 92.4%$150,001 - $200,000 96.4% 96.4% 96.2% 96.4% 96.4% 96.0% 96.1% 96.2% 96.1% 96.4% 96.0% 96.0% 96.2% 95.9% 95.2% 95.0% 94.8% 94.8% 94.8% 94.3% 94.3% 93.4% 93.7% 93.2%$200,001 - $250,000 96.4% 96.8% 96.6% 96.9% 96.7% 96.6% 97.0% 97.1% 96.8% 96.7% 96.3% 96.1% 96.2% 95.9% 96.1% 96.1% 96.4% 96.2% 96.1% 96.2% 96.7% 96.5% 97.1% 96.9%$250,001 - $300,000 97.5% 97.5% 97.4% 97.2% 96.9% 96.9% 97.1% 97.1% 97.3% 97.5% 97.8% 97.5% 97.4% 97.5% 97.5% 97.7% 97.7% 97.6% 97.3% 97.3% 97.1% 96.8% 96.7% 96.7%$300,001 - $375,000 98.5% 98.4% 98.3% 98.4% 98.3% 98.3% 98.3% 98.2% 98.2% 98.2% 98.1% 98.1% 98.0% 98.0% 97.8% 97.7% 97.8% 97.5% 97.5% 97.6% 97.6% 97.5% 97.6% 97.5%$375,001 - $475,000 98.4% 98.4% 98.3% 98.2% 98.1% 97.9% 97.7% 97.7% 97.7% 97.7% 97.7% 97.7% 97.8% 97.8% 97.9% 98.1% 98.1% 98.4% 98.5% 98.6% 98.6% 98.7% 98.8% 98.9%$475,001 - $700,000 98.4% 98.2% 98.0% 97.9% 98.0% 97.9% 97.7% 97.8% 97.8% 97.7% 97.8% 98.0% 98.1% 98.3% 98.3% 98.4% 98.3% 98.5% 98.6% 98.6% 98.7% 98.8% 98.9% 99.0%$700,001 and above 96.6% 96.8% 96.7% 97.0% 96.9% 96.9% 96.4% 96.5% 96.5% 96.5% 96.6% 96.4% 96.4% 96.3% 96.2% 96.2% 96.3% 96.2% 96.6% 96.7% 96.8% 97.0% 97.1% 97.2%
All Condos 98.3% 98.2% 98.1% 98.0% 97.9% 97.8% 97.6% 97.6% 97.5% 97.5% 97.5% 97.3% 97.4% 97.4% 97.4% 97.5% 97.6% 97.7% 97.8% 97.8% 97.9% 97.9% 98.0% 98.1%
Percentage of Original List Price ReceivedDecember 2020
Condos: Monthly, by Price Range(The average percentage found when dividing a property's sales price by the original list price. Based on a rolling 12 month average.)
88.0%
90.0%
92.0%
94.0%
96.0%
98.0%
100.0%
Jan-19 Feb-19 Mar-19 Apr-19 May-19 Jun-19 Jul-19 Aug-19 Sep-19 Oct-19 Nov-19 Dec-19 Jan-20 Feb-20 Mar-20 Apr-20 May-20 Jun-20 Jul-20 Aug-20 Sep-20 Oct-20 Nov-20 Dec-20
$150,000 and below
$150,001 - $200,000
$200,001 - $250,000
$250,001 - $300,000
$300,001 - $375,000
$375,001 - $475,000
$475,001 - $700,000
$700,001 and above
SOURCE: Honolulu Board of REALTORS®, compiled from MLS data. ©Copyright 2020. Honolulu Board of REALTORS®. All Rights Reserved. Information herein deemed reliable but not guaranteed.
WĂŐĞ�ϭϵ�ŽĨ�Ϯϳ

Jan-19 Feb-19 Mar-19 Apr-19 May-19 Jun-19 Jul-19 Aug-19 Sep-19 Oct-19 Nov-19 Dec-19 Jan-20 Feb-20 Mar-20 Apr-20 May-20 Jun-20 Jul-20 Aug-20 Sep-20 Oct-20 Nov-20 Dec-20
$350,000 and Below 25 28 26 20 19 22 17 18 20 14 17 18 19 15 17 16 12 12 12 8 9 9 9 5$350,001 - $475,000 25 23 29 31 28 28 22 29 28 33 36 34 36 37 40 45 40 33 24 24 22 15 14 5$475,001 - $550,000 64 59 58 56 53 52 44 45 51 46 34 33 45 46 51 47 41 39 32 30 29 24 22 14$550,001 - $650,000 125 123 127 147 141 137 152 162 148 131 144 114 131 129 136 128 125 102 91 70 56 56 57 47$650,001 - $800,000 276 327 322 334 319 330 355 321 301 299 260 198 208 218 209 200 211 192 176 145 129 116 115 92
$800,001 - $1.1M 321 345 392 409 431 418 418 375 380 363 323 248 237 267 258 242 268 272 263 244 212 224 237 185$1.1M - $1.9M 305 304 315 311 328 343 335 348 342 352 326 263 278 292 274 265 289 283 291 276 258 266 244 206
$1.9M and Above 229 227 226 247 257 258 278 270 278 272 275 249 256 263 242 230 247 246 247 224 224 231 236 216All Single Family Homes 1370 1436 1495 1555 1576 1588 1621 1568 1548 1510 1415 1157 1210 1267 1227 1173 1233 1179 1136 1021 939 941 934 770
Inventory of Homes for SaleDecember 2020
Single Family Homes: Monthly, by Price Range(The number of properties available for sale in active status at the end of a given month)
0
50
100
150
200
250
300
350
400
450
500
Jan-19 Feb-19 Mar-19 Apr-19 May-19 Jun-19 Jul-19 Aug-19 Sep-19 Oct-19 Nov-19 Dec-19 Jan-20 Feb-20 Mar-20 Apr-20 May-20 Jun-20 Jul-20 Aug-20 Sep-20 Oct-20 Nov-20 Dec-20
$350,000 and Below
$350,001 - $475,000
$475,001 - $550,000
$550,001 - $650,000
$650,001 - $800,000
$800,001 - $1.1M
$1.1M - $1.9M
$1.9M and Above
SOURCE: Honolulu Board of REALTORS®, compiled from MLS data. ©Copyright 2020. Honolulu Board of REALTORS®. All Rights Reserved. Information herein deemed reliable but not guaranteed.
WĂŐĞ�ϮϬ�ŽĨ�Ϯϳ

Jan-19 Feb-19 Mar-19 Apr-19 May-19 Jun-19 Jul-19 Aug-19 Sep-19 Oct-19 Nov-19 Dec-19 Jan-20 Feb-20 Mar-20 Apr-20 May-20 Jun-20 Jul-20 Aug-20 Sep-20 Oct-20 Nov-20 Dec-20
$150,000 and below 98 95 94 98 94 108 110 112 113 115 113 93 104 114 112 102 113 115 118 127 132 127 118 111$150,001 - $200,000 92 102 109 99 106 92 96 96 103 100 96 92 99 110 128 118 127 131 133 129 126 129 132 126$200,001 - $250,000 150 123 133 138 133 134 142 133 134 139 132 112 135 134 150 167 166 148 149 179 180 163 144 127$250,001 - $300,000 161 162 155 161 146 150 159 168 156 166 165 162 158 157 161 170 176 171 165 183 173 168 175 149$300,001 - $375,000 231 262 242 253 259 265 278 301 282 282 265 230 268 268 260 276 275 282 300 281 292 275 253 239$375,001 - $475,000 361 366 369 400 382 432 441 419 422 405 401 357 363 404 386 360 366 379 380 395 362 365 353 313$475,001 - $700,000 504 554 577 595 600 609 604 601 607 580 552 494 517 531 527 496 513 543 505 494 464 473 462 394$700,001 and above 640 678 670 660 630 627 614 613 606 595 592 554 558 572 550 504 506 557 567 558 553 561 545 479
All Condos 2237 2342 2349 2404 2350 2417 2444 2443 2423 2382 2316 2094 2202 2290 2274 2193 2242 2326 2317 2346 2282 2261 2182 1938
Inventory of Homes for SaleDecember 2020
Condos: Monthly, by Price Range(The number of properties available for sale in active status at the end of a given month)
70
170
270
370
470
570
670
770
Jan-19 Feb-19 Mar-19 Apr-19 May-19 Jun-19 Jul-19 Aug-19 Sep-19 Oct-19 Nov-19 Dec-19 Jan-20 Feb-20 Mar-20 Apr-20 May-20 Jun-20 Jul-20 Aug-20 Sep-20 Oct-20 Nov-20 Dec-20
$150,000 and below
$150,001 - $200,000
$200,001 - $250,000
$250,001 - $300,000
$300,001 - $375,000
$375,001 - $475,000
$475,001 - $700,000
$700,001 and above
SOURCE: Honolulu Board of REALTORS®, compiled from MLS data. ©Copyright 2020. Honolulu Board of REALTORS®. All Rights Reserved. Information herein deemed reliable but not guaranteed.
WĂŐĞ�Ϯϭ�ŽĨ�Ϯϳ
Jan-19 Feb-19 Mar-19 Apr-19 May-19 Jun-19 Jul-19 Aug-19 Sep-19 Oct-19 Nov-19 Dec-19 Jan-20 Feb-20 Mar-20 Apr-20 May-20 Jun-20 Jul-20 Aug-20 Sep-20 Oct-20 Nov-20 Dec-20
$350,000 and Below 4.3 5.0 4.8 3.7 3.6 4.2 3.3 3.5 4.0 2.8 3.4 3.6 3.8 3.0 3.4 3.3 2.5 2.5 2.6 1.7 1.9 2.0 2.1 1.2$350,001 - $475,000 1.6 1.5 2.0 2.2 2.0 2.1 1.7 2.4 2.4 2.9 3.3 3.2 3.5 3.7 4.0 4.6 4.1 3.3 2.4 2.4 2.2 1.5 1.4 0.5$475,001 - $550,000 3.1 3.0 3.0 2.9 2.8 2.8 2.4 2.5 2.8 2.6 1.9 1.9 2.6 2.7 3.0 2.8 2.4 2.4 2.0 1.9 1.8 1.5 1.5 0.9$550,001 - $650,000 2.6 2.6 2.8 3.3 3.2 3.2 3.6 3.8 3.5 3.1 3.4 2.7 3.1 3.0 3.1 2.9 2.8 2.3 2.0 1.6 1.3 1.3 1.3 1.1$650,001 - $800,000 3.0 3.6 3.5 3.7 3.5 3.7 4.0 3.6 3.4 3.3 2.9 2.2 2.3 2.4 2.2 2.1 2.2 2.0 1.8 1.5 1.3 1.2 1.2 1.0
$800,001 - $1.1M 3.8 4.1 4.6 4.8 5.1 5.0 5.0 4.4 4.5 4.3 3.8 2.9 2.8 3.1 3.0 2.8 3.0 3.1 3.0 2.7 2.3 2.4 2.6 2.0$1.1M - $1.9M 6.1 6.0 6.3 6.2 6.6 6.9 6.7 7.0 6.9 7.2 6.7 5.4 5.7 6.0 5.6 5.4 5.9 5.8 5.9 5.6 5.1 5.2 4.7 3.9
$1.9M and Above 14.2 14.1 14.0 15.4 16.1 16.3 17.7 17.3 17.9 17.7 18.0 16.5 17.1 17.7 16.3 15.4 16.5 16.5 16.5 14.9 14.8 15.1 15.3 13.7All Single Family Homes 4.1 4.3 4.6 4.8 4.9 5.0 5.1 5.0 4.9 4.8 4.5 3.7 3.8 4.0 3.8 3.6 3.8 3.6 3.5 3.1 2.9 2.9 2.8 2.3
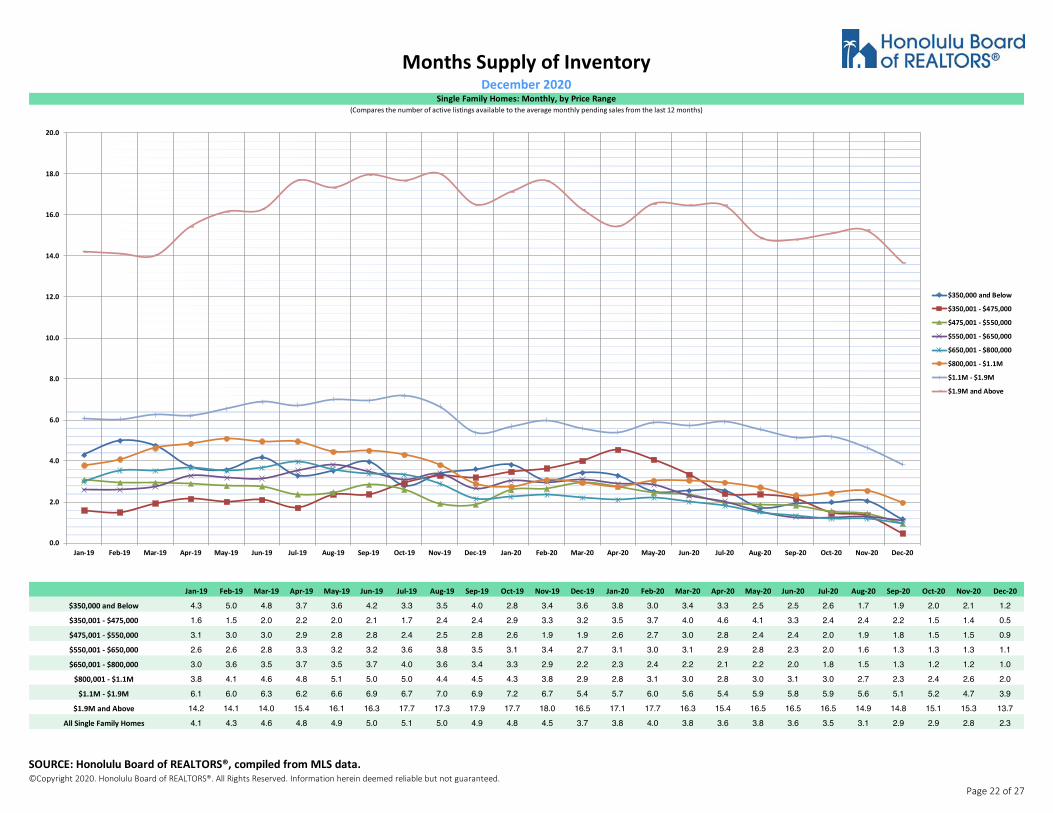
Months Supply of InventoryDecember 2020
Single Family Homes: Monthly, by Price Range(Compares the number of active listings available to the average monthly pending sales from the last 12 months)
0.0
2.0
4.0
6.0
8.0
10.0
12.0
14.0
16.0
18.0
20.0
Jan-19 Feb-19 Mar-19 Apr-19 May-19 Jun-19 Jul-19 Aug-19 Sep-19 Oct-19 Nov-19 Dec-19 Jan-20 Feb-20 Mar-20 Apr-20 May-20 Jun-20 Jul-20 Aug-20 Sep-20 Oct-20 Nov-20 Dec-20
$350,000 and Below
$350,001 - $475,000
$475,001 - $550,000
$550,001 - $650,000
$650,001 - $800,000
$800,001 - $1.1M
$1.1M - $1.9M
$1.9M and Above
SOURCE: Honolulu Board of REALTORS®, compiled from MLS data. ©Copyright 2020. Honolulu Board of REALTORS®. All Rights Reserved. Information herein deemed reliable but not guaranteed.
WĂŐĞ�ϮϮ�ŽĨ�Ϯϳ
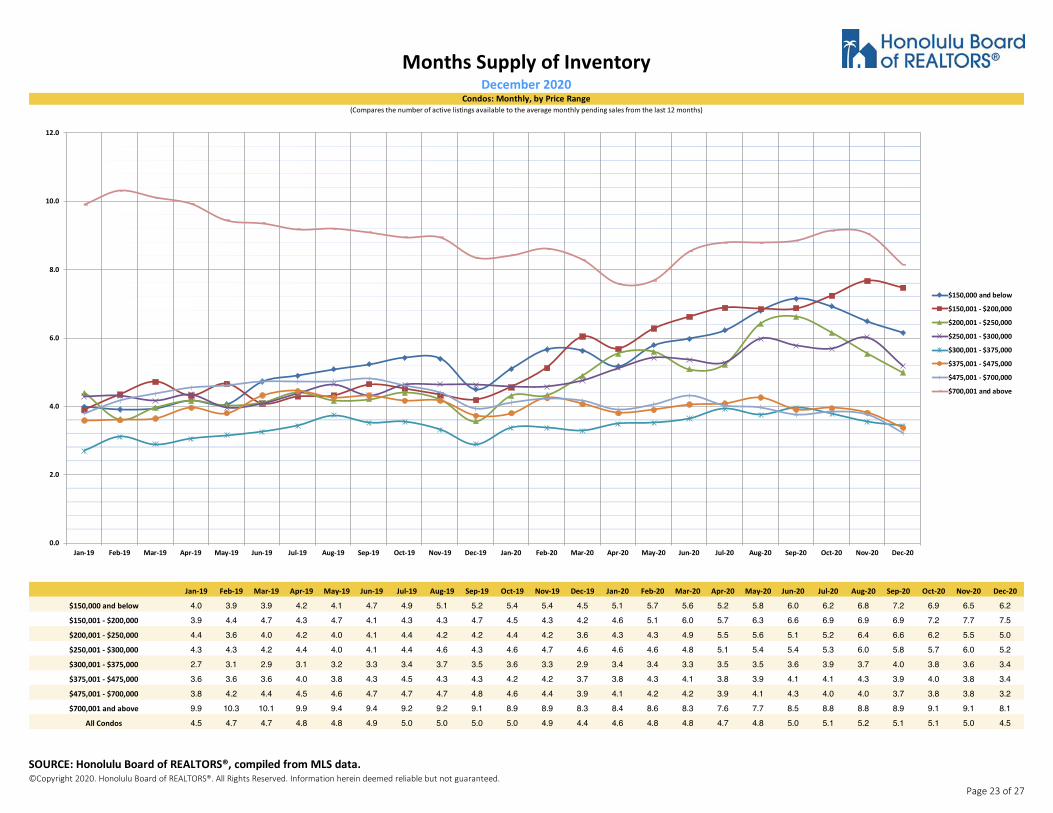
Jan-19 Feb-19 Mar-19 Apr-19 May-19 Jun-19 Jul-19 Aug-19 Sep-19 Oct-19 Nov-19 Dec-19 Jan-20 Feb-20 Mar-20 Apr-20 May-20 Jun-20 Jul-20 Aug-20 Sep-20 Oct-20 Nov-20 Dec-20
$150,000 and below 4.0 3.9 3.9 4.2 4.1 4.7 4.9 5.1 5.2 5.4 5.4 4.5 5.1 5.7 5.6 5.2 5.8 6.0 6.2 6.8 7.2 6.9 6.5 6.2$150,001 - $200,000 3.9 4.4 4.7 4.3 4.7 4.1 4.3 4.3 4.7 4.5 4.3 4.2 4.6 5.1 6.0 5.7 6.3 6.6 6.9 6.9 6.9 7.2 7.7 7.5$200,001 - $250,000 4.4 3.6 4.0 4.2 4.0 4.1 4.4 4.2 4.2 4.4 4.2 3.6 4.3 4.3 4.9 5.5 5.6 5.1 5.2 6.4 6.6 6.2 5.5 5.0$250,001 - $300,000 4.3 4.3 4.2 4.4 4.0 4.1 4.4 4.6 4.3 4.6 4.7 4.6 4.6 4.6 4.8 5.1 5.4 5.4 5.3 6.0 5.8 5.7 6.0 5.2$300,001 - $375,000 2.7 3.1 2.9 3.1 3.2 3.3 3.4 3.7 3.5 3.6 3.3 2.9 3.4 3.4 3.3 3.5 3.5 3.6 3.9 3.7 4.0 3.8 3.6 3.4$375,001 - $475,000 3.6 3.6 3.6 4.0 3.8 4.3 4.5 4.3 4.3 4.2 4.2 3.7 3.8 4.3 4.1 3.8 3.9 4.1 4.1 4.3 3.9 4.0 3.8 3.4$475,001 - $700,000 3.8 4.2 4.4 4.5 4.6 4.7 4.7 4.7 4.8 4.6 4.4 3.9 4.1 4.2 4.2 3.9 4.1 4.3 4.0 4.0 3.7 3.8 3.8 3.2$700,001 and above 9.9 10.3 10.1 9.9 9.4 9.4 9.2 9.2 9.1 8.9 8.9 8.3 8.4 8.6 8.3 7.6 7.7 8.5 8.8 8.8 8.9 9.1 9.1 8.1
All Condos 4.5 4.7 4.7 4.8 4.8 4.9 5.0 5.0 5.0 5.0 4.9 4.4 4.6 4.8 4.8 4.7 4.8 5.0 5.1 5.2 5.1 5.1 5.0 4.5
Months Supply of InventoryDecember 2020
Condos: Monthly, by Price Range(Compares the number of active listings available to the average monthly pending sales from the last 12 months)
0.0
2.0
4.0
6.0
8.0
10.0
12.0
Jan-19 Feb-19 Mar-19 Apr-19 May-19 Jun-19 Jul-19 Aug-19 Sep-19 Oct-19 Nov-19 Dec-19 Jan-20 Feb-20 Mar-20 Apr-20 May-20 Jun-20 Jul-20 Aug-20 Sep-20 Oct-20 Nov-20 Dec-20
$150,000 and below
$150,001 - $200,000
$200,001 - $250,000
$250,001 - $300,000
$300,001 - $375,000
$375,001 - $475,000
$475,001 - $700,000
$700,001 and above
SOURCE: Honolulu Board of REALTORS®, compiled from MLS data. ©Copyright 2020. Honolulu Board of REALTORS®. All Rights Reserved. Information herein deemed reliable but not guaranteed.
WĂŐĞ�Ϯϯ�ŽĨ�Ϯϳ

Closed SalesSingle-Family Homes and Condos
OAHU, HAWAII: Jan 1987 to the Present
0
100
200
300
400
500
600
700
800
900
1987 1988 1989 1990 1991 1992 1993 1994 1995 1996 1997 1998 1999 2000 2001 2002 2003 2004 2005 2006 2007 2008 2009 2010 2011 2012 2013 2014 2015 2016 2017 2018 2019 2020
Closed Sales SFH Closed Sales CONDO
SOURCE: Honolulu Board of REALTORS®, compiled from MLS data. ©Copyright 2020. Honolulu Board of REALTORS®. All Rights Reserved. Information herein deemed reliable but not guaranteed.
WĂŐĞ�Ϯϰ�ŽĨ�Ϯϳ

Median Sales PriceSingle-Family Homes and Condos
OAHU, HAWAII: Jan 1987 to the Present
$0
$100,000
$200,000
$300,000
$400,000
$500,000
$600,000
$700,000
$800,000
$900,000
$1,000,000
1987 1988 1989 1990 1991 1992 1993 1994 1995 1996 1997 1998 1999 2000 2001 2002 2003 2004 2005 2006 2007 2008 2009 2010 2011 2012 2013 2014 2015 2016 2017 2018 2019 2020
Median Sales Price SFH Median Sales Price CONDO
SOURCE: Honolulu Board of REALTORS®, compiled from MLS data. ©Copyright 2020. Honolulu Board of REALTORS®. All Rights Reserved. Information herein deemed reliable but not guaranteed.
WĂŐĞ�Ϯϱ�ŽĨ�Ϯϳ
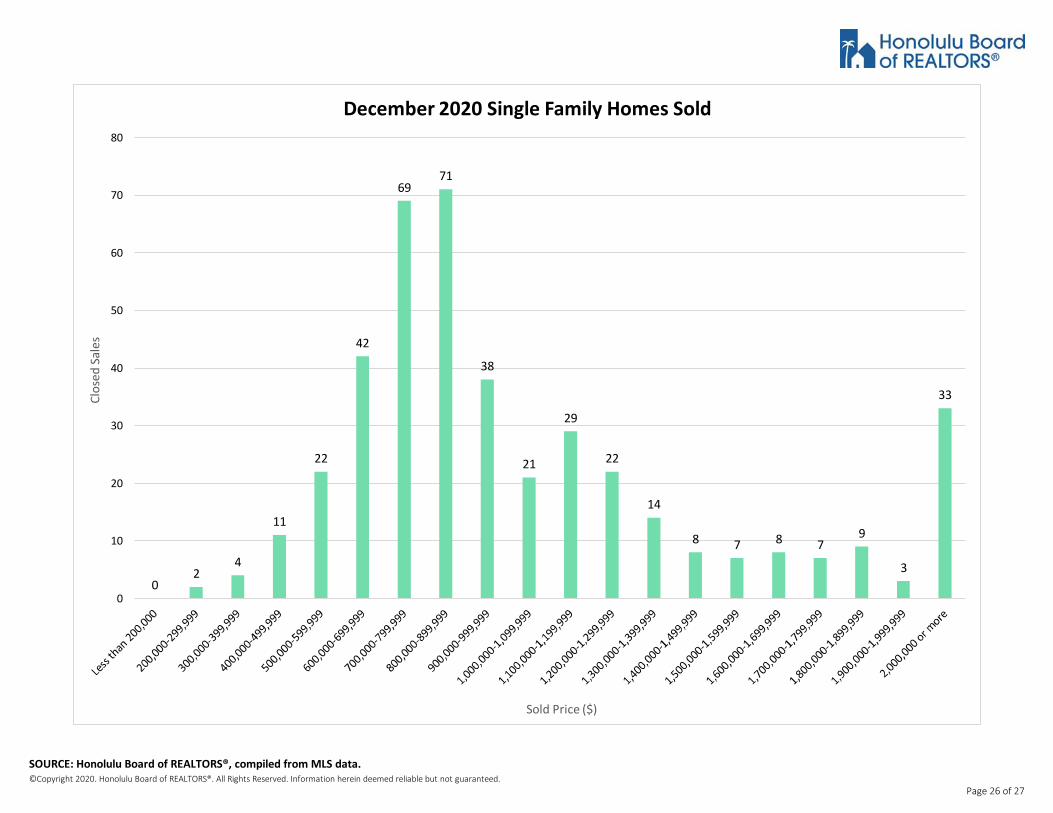
02
4
11
22
42
6971
38
21
29
22
14
8 7 8 79
3
33
0
10
20
30
40
50
60
70
80
Clos
ed Sa
les
Sold Price ($)
December 2020 Single Family Homes Sold
SOURCE: Honolulu Board of REALTORS®, compiled from MLS data. ©Copyright 2020. Honolulu Board of REALTORS®. All Rights Reserved. Information herein deemed reliable but not guaranteed.
WĂŐĞ�Ϯϲ�ŽĨ�Ϯϳ
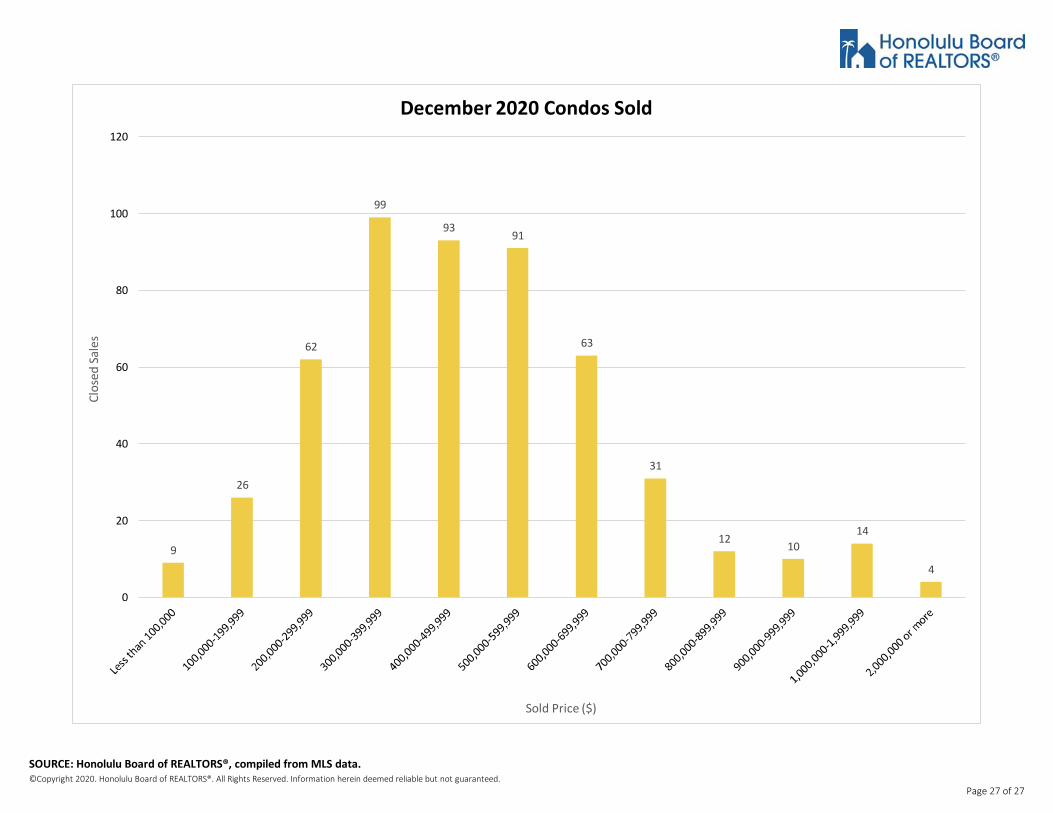
9
26
62
99
93 91
63
31
12 1014
4
0
20
40
60
80
100
120
Clos
ed Sa
les
Sold Price ($)
December 2020 Condos Sold
SOURCE: Honolulu Board of REALTORS®, compiled from MLS data. ©Copyright 2020. Honolulu Board of REALTORS®. All Rights Reserved. Information herein deemed reliable but not guaranteed.
WĂŐĞ�Ϯϳ�ŽĨ�Ϯϳ