monthly statistics package - fraser valley real estate board
TRANSCRIPT
Fraser Valley Real Estate Board Monthly Statistics Package
January 2021
News Release FraserValleyRealEstateBoard
Contact Laurie Dawson, Communications Specialist [email protected] Fraser Valley Real Estate Board Telephone 604.930.7657 Fax 604.930.7623 www.fvreb.bc.ca http://fvreb.bc.ca/statistics/eStats‐2021‐01.html
For Immediate Release: February 2, 2021
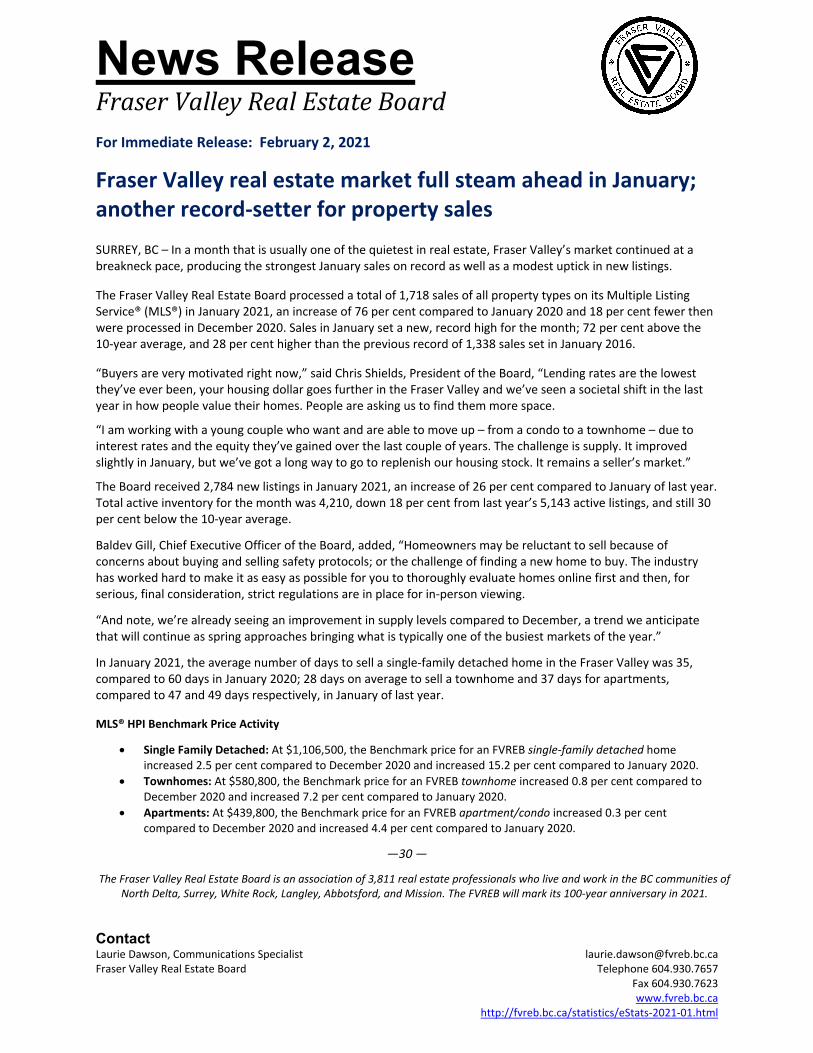
Fraser Valley real estate market full steam ahead in January; another record‐setter for property sales SURREY, BC – In a month that is usually one of the quietest in real estate, Fraser Valley’s market continued at a breakneck pace, producing the strongest January sales on record as well as a modest uptick in new listings.
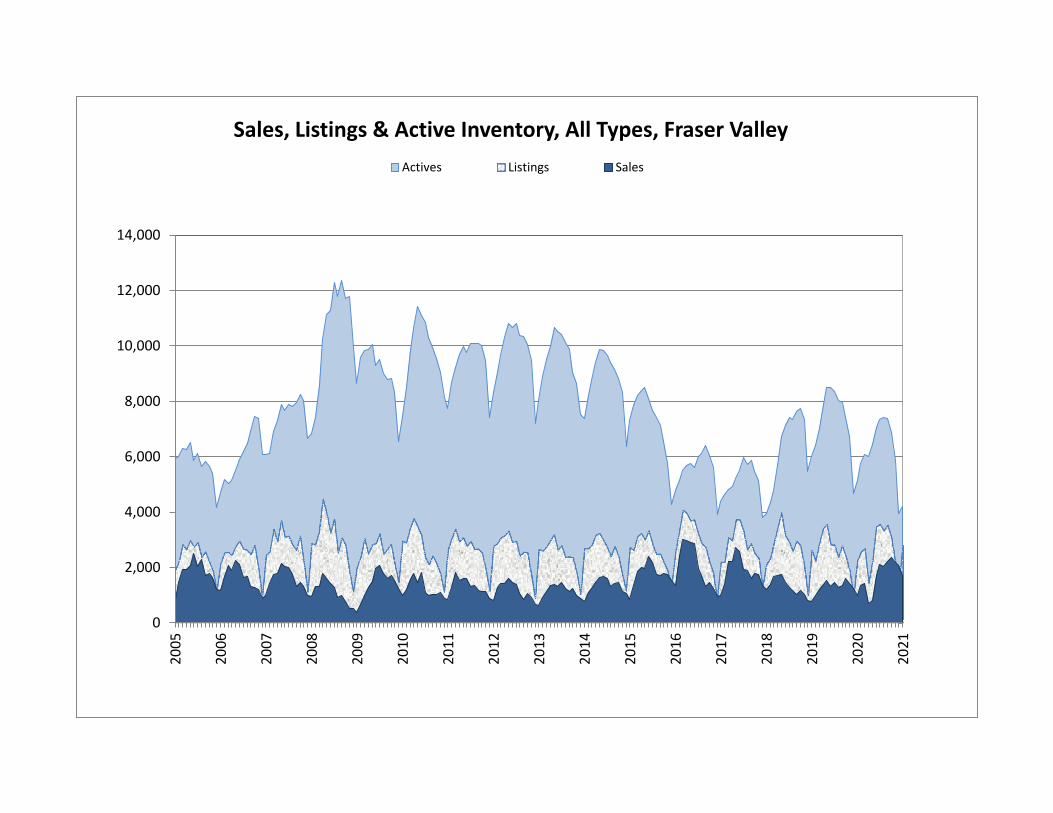
The Fraser Valley Real Estate Board processed a total of 1,718 sales of all property types on its Multiple Listing Service® (MLS®) in January 2021, an increase of 76 per cent compared to January 2020 and 18 per cent fewer then were processed in December 2020. Sales in January set a new, record high for the month; 72 per cent above the 10‐year average, and 28 per cent higher than the previous record of 1,338 sales set in January 2016. “Buyers are very motivated right now,” said Chris Shields, President of the Board, “Lending rates are the lowest they’ve ever been, your housing dollar goes further in the Fraser Valley and we’ve seen a societal shift in the last year in how people value their homes. People are asking us to find them more space.
“I am working with a young couple who want and are able to move up – from a condo to a townhome – due to interest rates and the equity they’ve gained over the last couple of years. The challenge is supply. It improved slightly in January, but we’ve got a long way to go to replenish our housing stock. It remains a seller’s market.”
The Board received 2,784 new listings in January 2021, an increase of 26 per cent compared to January of last year. Total active inventory for the month was 4,210, down 18 per cent from last year’s 5,143 active listings, and still 30 per cent below the 10‐year average.
Baldev Gill, Chief Executive Officer of the Board, added, “Homeowners may be reluctant to sell because of concerns about buying and selling safety protocols; or the challenge of finding a new home to buy. The industry has worked hard to make it as easy as possible for you to thoroughly evaluate homes online first and then, for serious, final consideration, strict regulations are in place for in‐person viewing.
“And note, we’re already seeing an improvement in supply levels compared to December, a trend we anticipate that will continue as spring approaches bringing what is typically one of the busiest markets of the year.”
In January 2021, the average number of days to sell a single‐family detached home in the Fraser Valley was 35, compared to 60 days in January 2020; 28 days on average to sell a townhome and 37 days for apartments, compared to 47 and 49 days respectively, in January of last year.
MLS® HPI Benchmark Price Activity
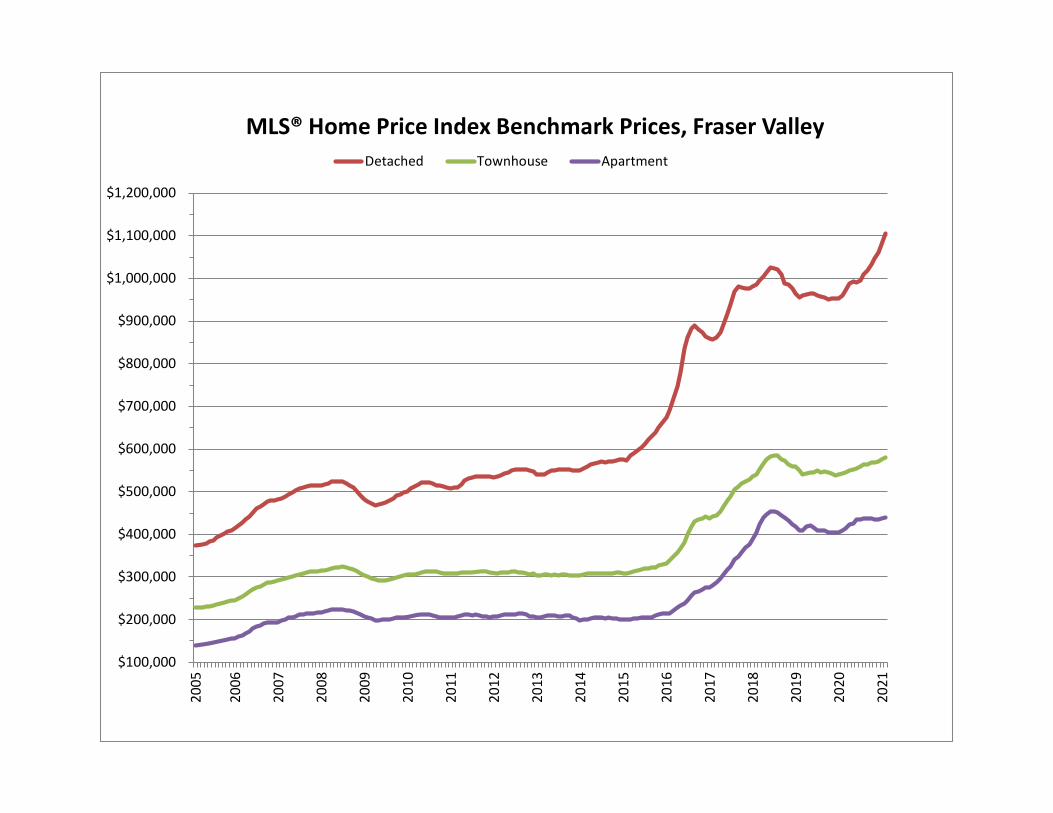
Single Family Detached: At $1,106,500, the Benchmark price for an FVREB single‐family detached home increased 2.5 per cent compared to December 2020 and increased 15.2 per cent compared to January 2020.
Townhomes: At $580,800, the Benchmark price for an FVREB townhome increased 0.8 per cent compared to December 2020 and increased 7.2 per cent compared to January 2020.
Apartments: At $439,800, the Benchmark price for an FVREB apartment/condo increased 0.3 per cent compared to December 2020 and increased 4.4 per cent compared to January 2020.
—30 —
The Fraser Valley Real Estate Board is an association of 3,811 real estate professionals who live and work in the BC communities of North Delta, Surrey, White Rock, Langley, Abbotsford, and Mission. The FVREB will mark its 100‐year anniversary in 2021.
MLS® Summary - Fraser ValleyJanuary 2021
All Property Types All Property Types
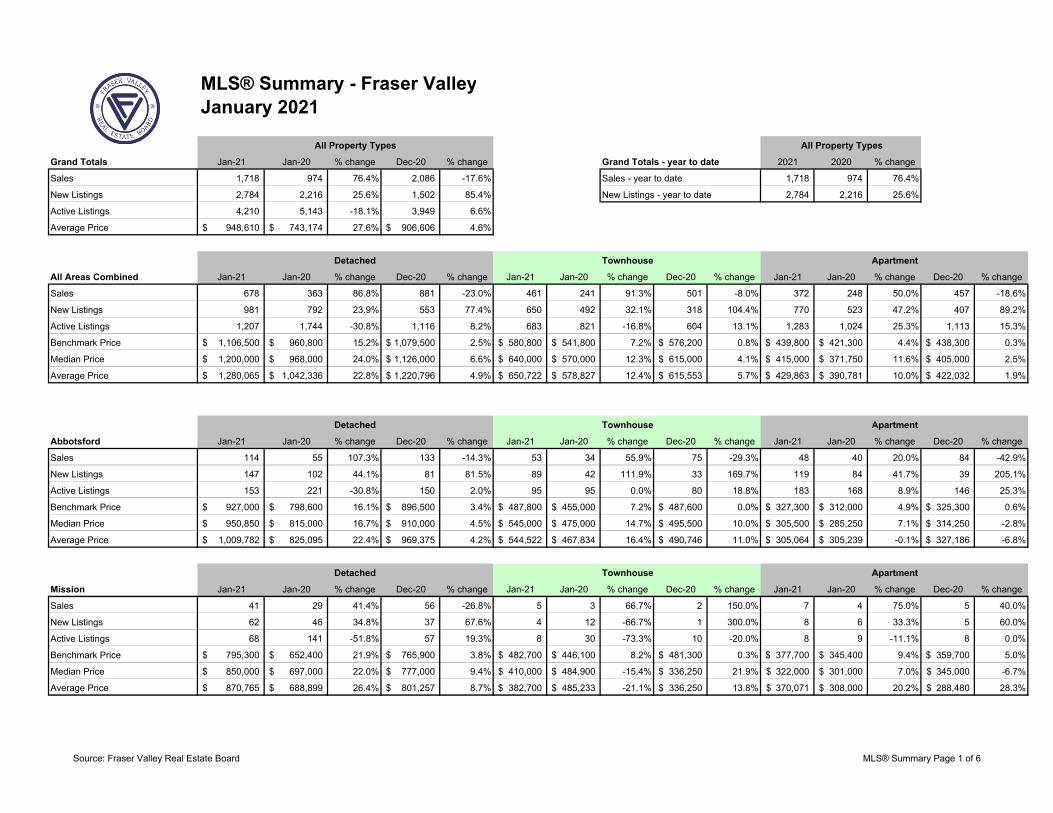
Grand Totals Jan-21 Jan-20 % change Dec-20 % change Grand Totals - year to date 2021 2020 % change
Sales 1,718 974 76.4% 2,086 -17.6% Sales - year to date 1,718 974 76.4%
New Listings 2,784 2,216 25.6% 1,502 85.4% New Listings - year to date 2,784 2,216 25.6%
Active Listings 4,210 5,143 -18.1% 3,949 6.6%
Average Price 948,610$ 743,174$ 27.6% 906,606$ 4.6%
Detached Townhouse Apartment
All Areas Combined Jan-21 Jan-20 % change Dec-20 % change Jan-21 Jan-20 % change Dec-20 % change Jan-21 Jan-20 % change Dec-20 % change
Sales 678 363 86.8% 881 -23.0% 461 241 91.3% 501 -8.0% 372 248 50.0% 457 -18.6%
New Listings 981 792 23.9% 553 77.4% 650 492 32.1% 318 104.4% 770 523 47.2% 407 89.2%
Active Listings 1,207 1,744 -30.8% 1,116 8.2% 683 821 -16.8% 604 13.1% 1,283 1,024 25.3% 1,113 15.3%
Benchmark Price 1,106,500$ 960,800$ 15.2% 1,079,500$ 2.5% 580,800$ 541,800$ 7.2% 576,200$ 0.8% 439,800$ 421,300$ 4.4% 438,300$ 0.3%
Median Price 1,200,000$ 968,000$ 24.0% 1,126,000$ 6.6% 640,000$ 570,000$ 12.3% 615,000$ 4.1% 415,000$ 371,750$ 11.6% 405,000$ 2.5%
Average Price 1,280,065$ 1,042,336$ 22.8% 1,220,796$ 4.9% 650,722$ 578,827$ 12.4% 615,553$ 5.7% 429,863$ 390,781$ 10.0% 422,032$ 1.9%
Detached Townhouse Apartment
Abbotsford Jan-21 Jan-20 % change Dec-20 % change Jan-21 Jan-20 % change Dec-20 % change Jan-21 Jan-20 % change Dec-20 % change
Sales 114 55 107.3% 133 -14.3% 53 34 55.9% 75 -29.3% 48 40 20.0% 84 -42.9%
New Listings 147 102 44.1% 81 81.5% 89 42 111.9% 33 169.7% 119 84 41.7% 39 205.1%
Active Listings 153 221 -30.8% 150 2.0% 95 95 0.0% 80 18.8% 183 168 8.9% 146 25.3%
Benchmark Price 927,000$ 798,600$ 16.1% 896,500$ 3.4% 487,800$ 455,000$ 7.2% 487,600$ 0.0% 327,300$ 312,000$ 4.9% 325,300$ 0.6%
Median Price 950,850$ 815,000$ 16.7% 910,000$ 4.5% 545,000$ 475,000$ 14.7% 495,500$ 10.0% 305,500$ 285,250$ 7.1% 314,250$ -2.8%
Average Price 1,009,782$ 825,095$ 22.4% 969,375$ 4.2% 544,522$ 467,834$ 16.4% 490,746$ 11.0% 305,064$ 305,239$ -0.1% 327,186$ -6.8%
Detached Townhouse Apartment
Mission Jan-21 Jan-20 % change Dec-20 % change Jan-21 Jan-20 % change Dec-20 % change Jan-21 Jan-20 % change Dec-20 % change
Sales 41 29 41.4% 56 -26.8% 5 3 66.7% 2 150.0% 7 4 75.0% 5 40.0%
New Listings 62 46 34.8% 37 67.6% 4 12 -66.7% 1 300.0% 8 6 33.3% 5 60.0%
Active Listings 68 141 -51.8% 57 19.3% 8 30 -73.3% 10 -20.0% 8 9 -11.1% 8 0.0%
Benchmark Price 795,300$ 652,400$ 21.9% 765,900$ 3.8% 482,700$ 446,100$ 8.2% 481,300$ 0.3% 377,700$ 345,400$ 9.4% 359,700$ 5.0%
Median Price 850,000$ 697,000$ 22.0% 777,000$ 9.4% 410,000$ 484,900$ -15.4% 336,250$ 21.9% 322,000$ 301,000$ 7.0% 345,000$ -6.7%
Average Price 870,765$ 688,899$ 26.4% 801,257$ 8.7% 382,700$ 485,233$ -21.1% 336,250$ 13.8% 370,071$ 308,000$ 20.2% 288,480$ 28.3%
Source: Fraser Valley Real Estate Board MLS® Summary Page 1 of 6
Detached Townhouse Apartment
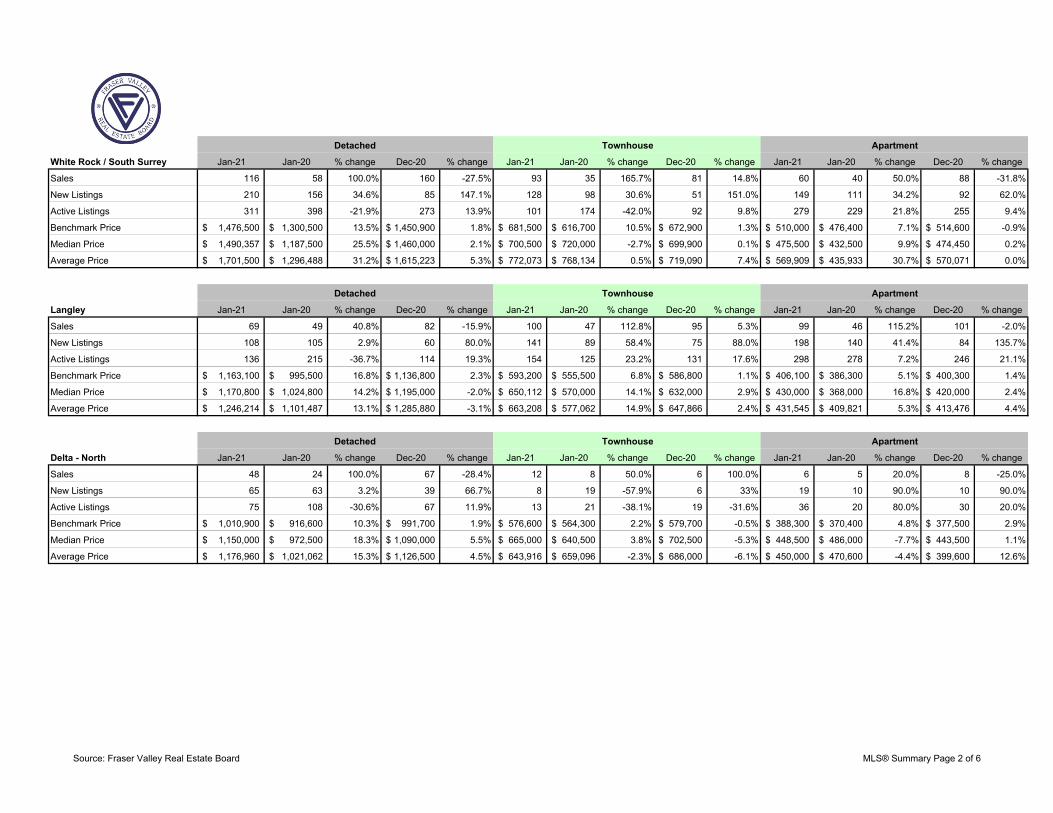
White Rock / South Surrey Jan-21 Jan-20 % change Dec-20 % change Jan-21 Jan-20 % change Dec-20 % change Jan-21 Jan-20 % change Dec-20 % change
Sales 116 58 100.0% 160 -27.5% 93 35 165.7% 81 14.8% 60 40 50.0% 88 -31.8%
New Listings 210 156 34.6% 85 147.1% 128 98 30.6% 51 151.0% 149 111 34.2% 92 62.0%
Active Listings 311 398 -21.9% 273 13.9% 101 174 -42.0% 92 9.8% 279 229 21.8% 255 9.4%
Benchmark Price 1,476,500$ 1,300,500$ 13.5% 1,450,900$ 1.8% 681,500$ 616,700$ 10.5% 672,900$ 1.3% 510,000$ 476,400$ 7.1% 514,600$ -0.9%
Median Price 1,490,357$ 1,187,500$ 25.5% 1,460,000$ 2.1% 700,500$ 720,000$ -2.7% 699,900$ 0.1% 475,500$ 432,500$ 9.9% 474,450$ 0.2%
Average Price 1,701,500$ 1,296,488$ 31.2% 1,615,223$ 5.3% 772,073$ 768,134$ 0.5% 719,090$ 7.4% 569,909$ 435,933$ 30.7% 570,071$ 0.0%
Detached Townhouse Apartment
Langley Jan-21 Jan-20 % change Dec-20 % change Jan-21 Jan-20 % change Dec-20 % change Jan-21 Jan-20 % change Dec-20 % change
Sales 69 49 40.8% 82 -15.9% 100 47 112.8% 95 5.3% 99 46 115.2% 101 -2.0%
New Listings 108 105 2.9% 60 80.0% 141 89 58.4% 75 88.0% 198 140 41.4% 84 135.7%
Active Listings 136 215 -36.7% 114 19.3% 154 125 23.2% 131 17.6% 298 278 7.2% 246 21.1%
Benchmark Price 1,163,100$ 995,500$ 16.8% 1,136,800$ 2.3% 593,200$ 555,500$ 6.8% 586,800$ 1.1% 406,100$ 386,300$ 5.1% 400,300$ 1.4%
Median Price 1,170,800$ 1,024,800$ 14.2% 1,195,000$ -2.0% 650,112$ 570,000$ 14.1% 632,000$ 2.9% 430,000$ 368,000$ 16.8% 420,000$ 2.4%
Average Price 1,246,214$ 1,101,487$ 13.1% 1,285,880$ -3.1% 663,208$ 577,062$ 14.9% 647,866$ 2.4% 431,545$ 409,821$ 5.3% 413,476$ 4.4%
Detached Townhouse Apartment
Delta - North Jan-21 Jan-20 % change Dec-20 % change Jan-21 Jan-20 % change Dec-20 % change Jan-21 Jan-20 % change Dec-20 % change
Sales 48 24 100.0% 67 -28.4% 12 8 50.0% 6 100.0% 6 5 20.0% 8 -25.0%
New Listings 65 63 3.2% 39 66.7% 8 19 -57.9% 6 33% 19 10 90.0% 10 90.0%
Active Listings 75 108 -30.6% 67 11.9% 13 21 -38.1% 19 -31.6% 36 20 80.0% 30 20.0%
Benchmark Price 1,010,900$ 916,600$ 10.3% 991,700$ 1.9% 576,600$ 564,300$ 2.2% 579,700$ -0.5% 388,300$ 370,400$ 4.8% 377,500$ 2.9%
Median Price 1,150,000$ 972,500$ 18.3% 1,090,000$ 5.5% 665,000$ 640,500$ 3.8% 702,500$ -5.3% 448,500$ 486,000$ -7.7% 443,500$ 1.1%
Average Price 1,176,960$ 1,021,062$ 15.3% 1,126,500$ 4.5% 643,916$ 659,096$ -2.3% 686,000$ -6.1% 450,000$ 470,600$ -4.4% 399,600$ 12.6%
Source: Fraser Valley Real Estate Board MLS® Summary Page 2 of 6
Detached Townhouse Apartment
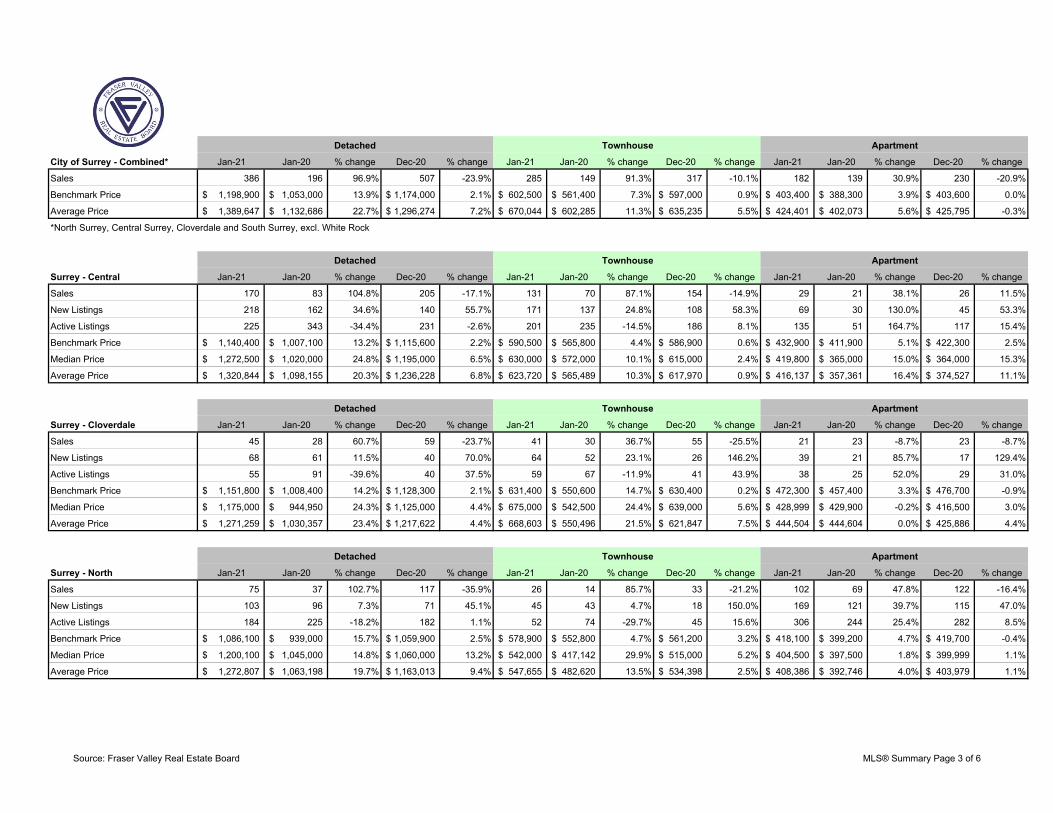
City of Surrey - Combined* Jan-21 Jan-20 % change Dec-20 % change Jan-21 Jan-20 % change Dec-20 % change Jan-21 Jan-20 % change Dec-20 % change
Sales 386 196 96.9% 507 -23.9% 285 149 91.3% 317 -10.1% 182 139 30.9% 230 -20.9%
Benchmark Price 1,198,900$ 1,053,000$ 13.9% 1,174,000$ 2.1% 602,500$ 561,400$ 7.3% 597,000$ 0.9% 403,400$ 388,300$ 3.9% 403,600$ 0.0%
Average Price 1,389,647$ 1,132,686$ 22.7% 1,296,274$ 7.2% 670,044$ 602,285$ 11.3% 635,235$ 5.5% 424,401$ 402,073$ 5.6% 425,795$ -0.3%
*North Surrey, Central Surrey, Cloverdale and South Surrey, excl. White Rock
Detached Townhouse Apartment
Surrey - Central Jan-21 Jan-20 % change Dec-20 % change Jan-21 Jan-20 % change Dec-20 % change Jan-21 Jan-20 % change Dec-20 % change
Sales 170 83 104.8% 205 -17.1% 131 70 87.1% 154 -14.9% 29 21 38.1% 26 11.5%
New Listings 218 162 34.6% 140 55.7% 171 137 24.8% 108 58.3% 69 30 130.0% 45 53.3%
Active Listings 225 343 -34.4% 231 -2.6% 201 235 -14.5% 186 8.1% 135 51 164.7% 117 15.4%
Benchmark Price 1,140,400$ 1,007,100$ 13.2% 1,115,600$ 2.2% 590,500$ 565,800$ 4.4% 586,900$ 0.6% 432,900$ 411,900$ 5.1% 422,300$ 2.5%
Median Price 1,272,500$ 1,020,000$ 24.8% 1,195,000$ 6.5% 630,000$ 572,000$ 10.1% 615,000$ 2.4% 419,800$ 365,000$ 15.0% 364,000$ 15.3%
Average Price 1,320,844$ 1,098,155$ 20.3% 1,236,228$ 6.8% 623,720$ 565,489$ 10.3% 617,970$ 0.9% 416,137$ 357,361$ 16.4% 374,527$ 11.1%
Detached Townhouse Apartment
Surrey - Cloverdale Jan-21 Jan-20 % change Dec-20 % change Jan-21 Jan-20 % change Dec-20 % change Jan-21 Jan-20 % change Dec-20 % change
Sales 45 28 60.7% 59 -23.7% 41 30 36.7% 55 -25.5% 21 23 -8.7% 23 -8.7%
New Listings 68 61 11.5% 40 70.0% 64 52 23.1% 26 146.2% 39 21 85.7% 17 129.4%
Active Listings 55 91 -39.6% 40 37.5% 59 67 -11.9% 41 43.9% 38 25 52.0% 29 31.0%
Benchmark Price 1,151,800$ 1,008,400$ 14.2% 1,128,300$ 2.1% 631,400$ 550,600$ 14.7% 630,400$ 0.2% 472,300$ 457,400$ 3.3% 476,700$ -0.9%
Median Price 1,175,000$ 944,950$ 24.3% 1,125,000$ 4.4% 675,000$ 542,500$ 24.4% 639,000$ 5.6% 428,999$ 429,900$ -0.2% 416,500$ 3.0%
Average Price 1,271,259$ 1,030,357$ 23.4% 1,217,622$ 4.4% 668,603$ 550,496$ 21.5% 621,847$ 7.5% 444,504$ 444,604$ 0.0% 425,886$ 4.4%
Detached Townhouse Apartment
Surrey - North Jan-21 Jan-20 % change Dec-20 % change Jan-21 Jan-20 % change Dec-20 % change Jan-21 Jan-20 % change Dec-20 % change
Sales 75 37 102.7% 117 -35.9% 26 14 85.7% 33 -21.2% 102 69 47.8% 122 -16.4%
New Listings 103 96 7.3% 71 45.1% 45 43 4.7% 18 150.0% 169 121 39.7% 115 47.0%
Active Listings 184 225 -18.2% 182 1.1% 52 74 -29.7% 45 15.6% 306 244 25.4% 282 8.5%
Benchmark Price 1,086,100$ 939,000$ 15.7% 1,059,900$ 2.5% 578,900$ 552,800$ 4.7% 561,200$ 3.2% 418,100$ 399,200$ 4.7% 419,700$ -0.4%
Median Price 1,200,100$ 1,045,000$ 14.8% 1,060,000$ 13.2% 542,000$ 417,142$ 29.9% 515,000$ 5.2% 404,500$ 397,500$ 1.8% 399,999$ 1.1%
Average Price 1,272,807$ 1,063,198$ 19.7% 1,163,013$ 9.4% 547,655$ 482,620$ 13.5% 534,398$ 2.5% 408,386$ 392,746$ 4.0% 403,979$ 1.1%
Source: Fraser Valley Real Estate Board MLS® Summary Page 3 of 6
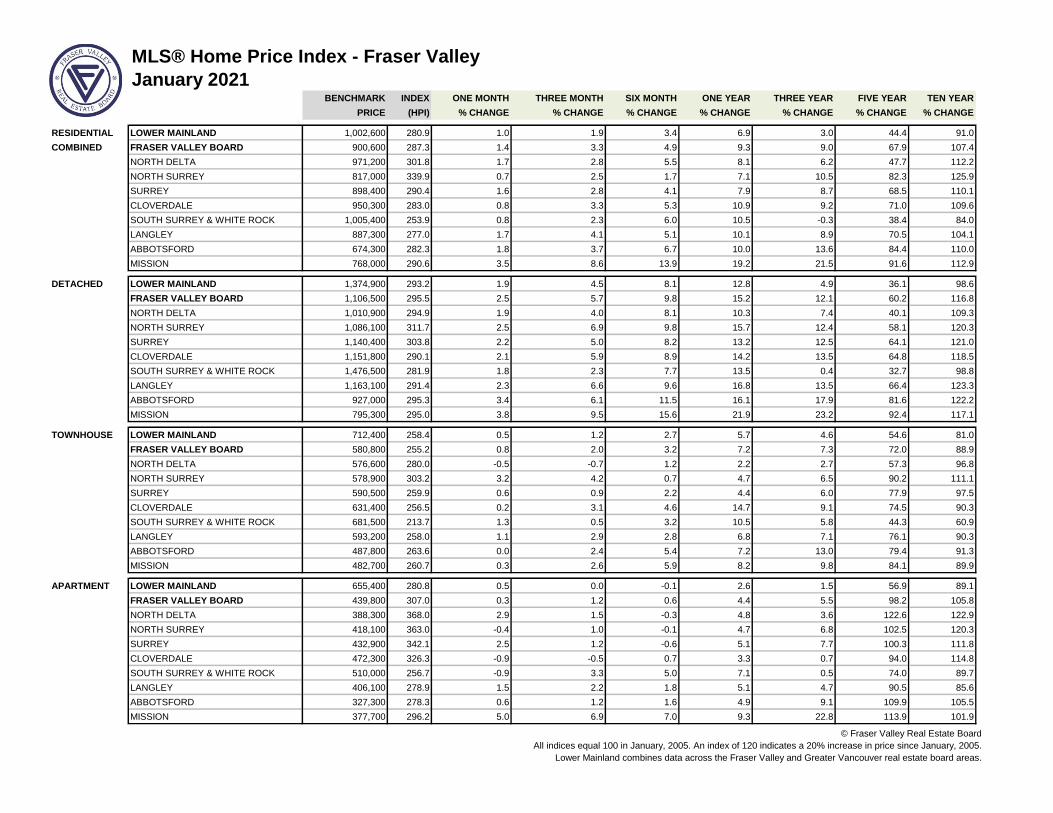
MLS® Home Price Index - Fraser Valley
January 2021BENCHMARK INDEX ONE MONTH THREE MONTH SIX MONTH ONE YEAR THREE YEAR FIVE YEAR TEN YEAR
PRICE (HPI) % CHANGE % CHANGE % CHANGE % CHANGE % CHANGE % CHANGE % CHANGE
RESIDENTIAL LOWER MAINLAND 1,002,600 280.9 1.0 1.9 3.4 6.9 3.0 44.4 91.0
COMBINED FRASER VALLEY BOARD 900,600 287.3 1.4 3.3 4.9 9.3 9.0 67.9 107.4
NORTH DELTA 971,200 301.8 1.7 2.8 5.5 8.1 6.2 47.7 112.2
NORTH SURREY 817,000 339.9 0.7 2.5 1.7 7.1 10.5 82.3 125.9
SURREY 898,400 290.4 1.6 2.8 4.1 7.9 8.7 68.5 110.1
CLOVERDALE 950,300 283.0 0.8 3.3 5.3 10.9 9.2 71.0 109.6
SOUTH SURREY & WHITE ROCK 1,005,400 253.9 0.8 2.3 6.0 10.5 -0.3 38.4 84.0
LANGLEY 887,300 277.0 1.7 4.1 5.1 10.1 8.9 70.5 104.1
ABBOTSFORD 674,300 282.3 1.8 3.7 6.7 10.0 13.6 84.4 110.0
MISSION 768,000 290.6 3.5 8.6 13.9 19.2 21.5 91.6 112.9
DETACHED LOWER MAINLAND 1,374,900 293.2 1.9 4.5 8.1 12.8 4.9 36.1 98.6
FRASER VALLEY BOARD 1,106,500 295.5 2.5 5.7 9.8 15.2 12.1 60.2 116.8
NORTH DELTA 1,010,900 294.9 1.9 4.0 8.1 10.3 7.4 40.1 109.3
NORTH SURREY 1,086,100 311.7 2.5 6.9 9.8 15.7 12.4 58.1 120.3
SURREY 1,140,400 303.8 2.2 5.0 8.2 13.2 12.5 64.1 121.0
CLOVERDALE 1,151,800 290.1 2.1 5.9 8.9 14.2 13.5 64.8 118.5
SOUTH SURREY & WHITE ROCK 1,476,500 281.9 1.8 2.3 7.7 13.5 0.4 32.7 98.8
LANGLEY 1,163,100 291.4 2.3 6.6 9.6 16.8 13.5 66.4 123.3
ABBOTSFORD 927,000 295.3 3.4 6.1 11.5 16.1 17.9 81.6 122.2
MISSION 795,300 295.0 3.8 9.5 15.6 21.9 23.2 92.4 117.1
TOWNHOUSE LOWER MAINLAND 712,400 258.4 0.5 1.2 2.7 5.7 4.6 54.6 81.0
FRASER VALLEY BOARD 580,800 255.2 0.8 2.0 3.2 7.2 7.3 72.0 88.9
NORTH DELTA 576,600 280.0 -0.5 -0.7 1.2 2.2 2.7 57.3 96.8
NORTH SURREY 578,900 303.2 3.2 4.2 0.7 4.7 6.5 90.2 111.1
SURREY 590,500 259.9 0.6 0.9 2.2 4.4 6.0 77.9 97.5
CLOVERDALE 631,400 256.5 0.2 3.1 4.6 14.7 9.1 74.5 90.3
SOUTH SURREY & WHITE ROCK 681,500 213.7 1.3 0.5 3.2 10.5 5.8 44.3 60.9
LANGLEY 593,200 258.0 1.1 2.9 2.8 6.8 7.1 76.1 90.3
ABBOTSFORD 487,800 263.6 0.0 2.4 5.4 7.2 13.0 79.4 91.3
MISSION 482,700 260.7 0.3 2.6 5.9 8.2 9.8 84.1 89.9
APARTMENT LOWER MAINLAND 655,400 280.8 0.5 0.0 -0.1 2.6 1.5 56.9 89.1
FRASER VALLEY BOARD 439,800 307.0 0.3 1.2 0.6 4.4 5.5 98.2 105.8
NORTH DELTA 388,300 368.0 2.9 1.5 -0.3 4.8 3.6 122.6 122.9
NORTH SURREY 418,100 363.0 -0.4 1.0 -0.1 4.7 6.8 102.5 120.3
SURREY 432,900 342.1 2.5 1.2 -0.6 5.1 7.7 100.3 111.8
CLOVERDALE 472,300 326.3 -0.9 -0.5 0.7 3.3 0.7 94.0 114.8
SOUTH SURREY & WHITE ROCK 510,000 256.7 -0.9 3.3 5.0 7.1 0.5 74.0 89.7
LANGLEY 406,100 278.9 1.5 2.2 1.8 5.1 4.7 90.5 85.6
ABBOTSFORD 327,300 278.3 0.6 1.2 1.6 4.9 9.1 109.9 105.5
MISSION 377,700 296.2 5.0 6.9 7.0 9.3 22.8 113.9 101.9
© Fraser Valley Real Estate Board
All indices equal 100 in January, 2005. An index of 120 indicates a 20% increase in price since January, 2005.
Lower Mainland combines data across the Fraser Valley and Greater Vancouver real estate board areas.
0
2,000
4,000
6,000
8,000
10,000
12,000
14,000
2005
2006
2007
2008
2009
2010
2011
2012
2013
2014
2015
2016
2017
2018
2019
2020
2021
Sales, Listings & Active Inventory, All Types, Fraser Valley
Actives Listings Sales
0
10
20
30
40
50
60
2005
2006
2007
2008
2009
2010
2011
2012
2013
2014
2015
2016
2017
2018
2019
2020
2021
Ratio
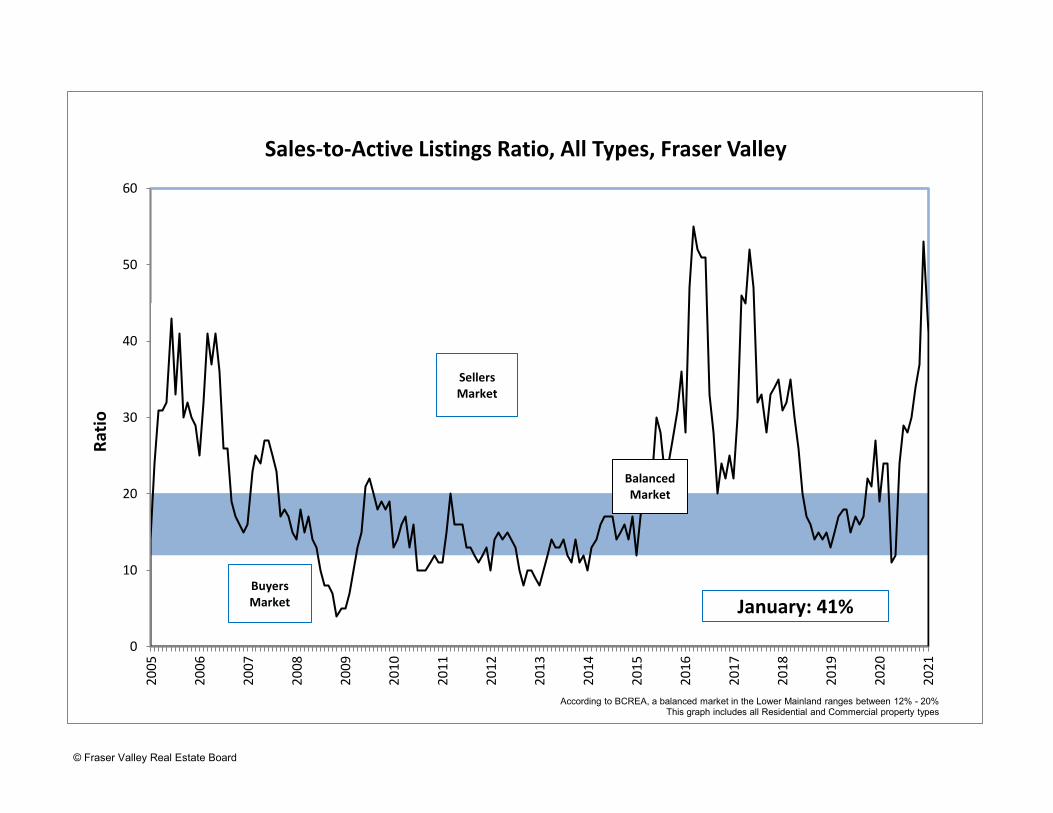
Sales‐to‐Active Listings Ratio, All Types, Fraser Valley
According to BCREA, a balanced market in the Lower Mainland ranges between 12% - 20%This graph includes all Residential and Commercial property types
Sellers Market
Balanced Market
Buyers Market January: 41%
© Fraser Valley Real Estate Board
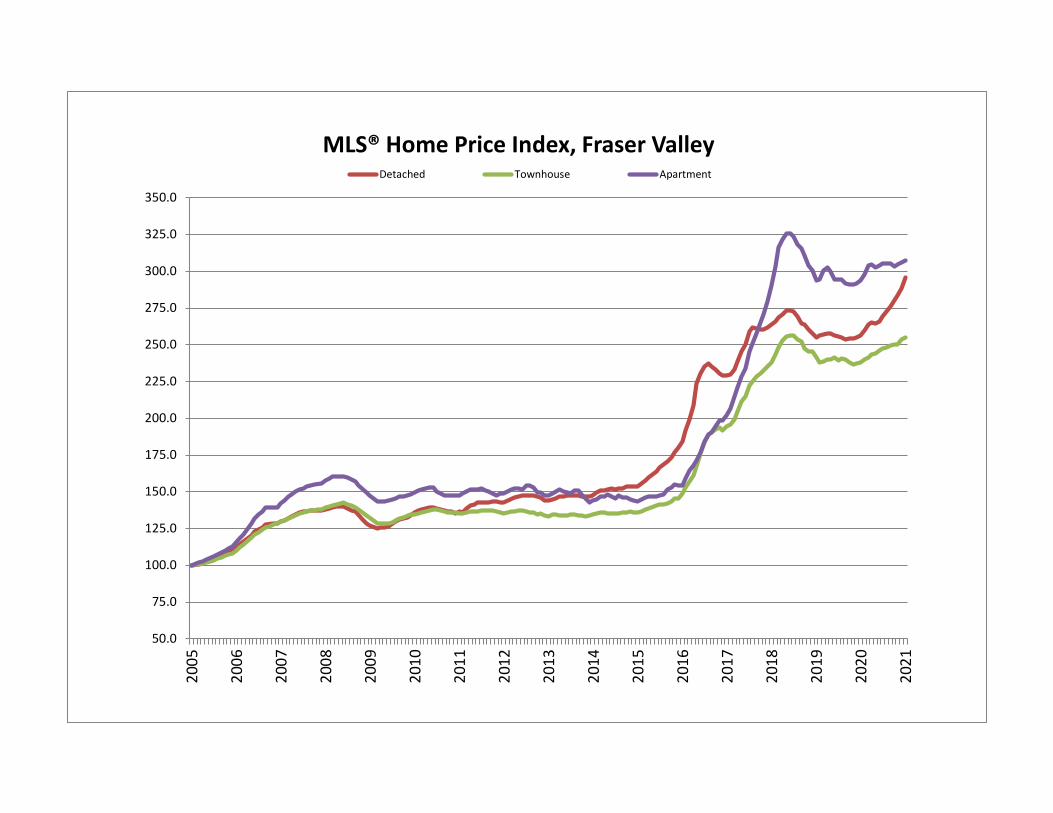
50.0
75.0
100.0
125.0
150.0
175.0
200.0
225.0
250.0
275.0
300.0
325.0
350.02005
2006
2007
2008
2009
2010
2011
2012
2013
2014
2015
2016
2017
2018
2019
2020
2021
MLS® Home Price Index, Fraser ValleyDetached Townhouse Apartment
$100,000
$200,000
$300,000
$400,000
$500,000
$600,000
$700,000
$800,000
$900,000
$1,000,000
$1,100,000
$1,200,0002005
2006
2007
2008
2009
2010
2011
2012
2013
2014
2015
2016
2017
2018
2019
2020
2021
MLS® Home Price Index Benchmark Prices, Fraser Valley
Detached Townhouse Apartment
$0
$200,000
$400,000
$600,000
$800,000
$1,000,000
$1,200,000
$1,400,000
1979
1980
1981
1982
1983
1984
1985
1986
1987
1988
1989
1990
1991
1992
1993
1994
1995
1996
1997
1998
1999
2000
2001
2002
2003
2004
2005
2006
2007
2008
2009
2010
2011
2012
2013
2014
2015
2016
2017
2018
2019
2020
2021
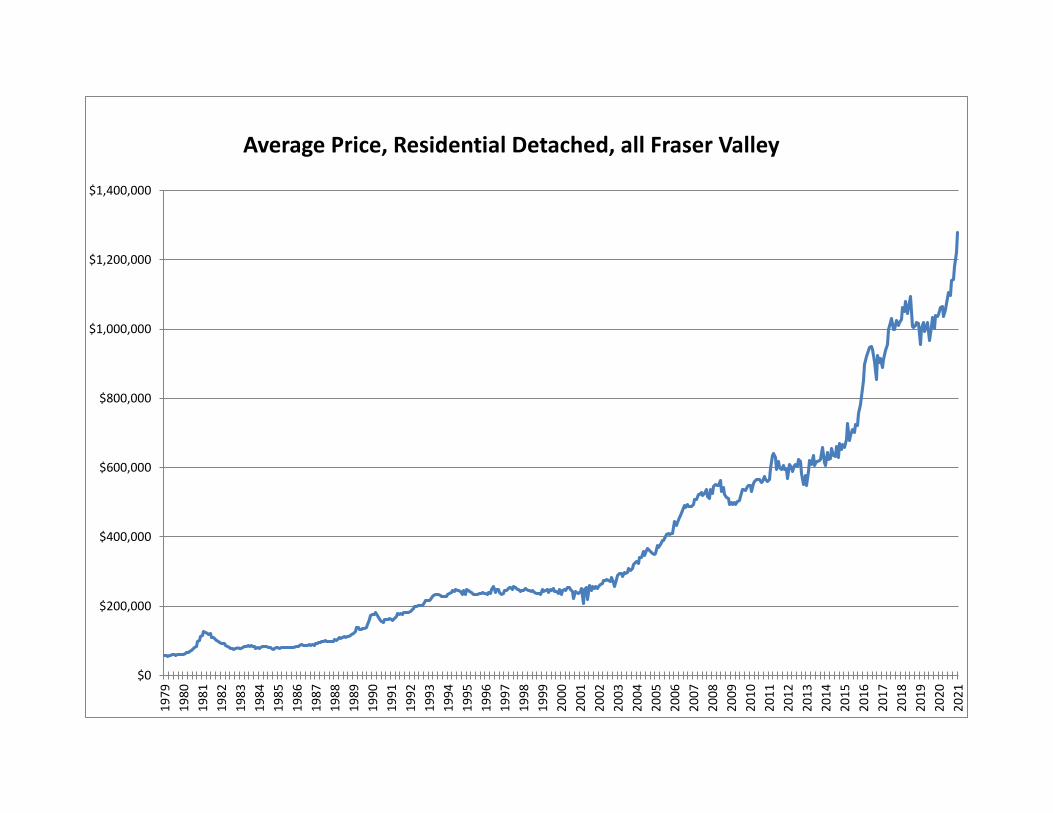
Average Price, Residential Detached, all Fraser Valley
$‐
$100,000
$200,000
$300,000
$400,000
$500,000
$600,000
$700,000
$800,000
$900,000
$1,000,000
‐
5,000
10,000
15,000
20,000
25,000
30,000
35,000
40,000
1990
1991
1992
1993
1994
1995
1996
1997
1998
1999
2000
2001
2002
2003
2004
2005
2006
2007
2008
2009
2010
2011
2012
2013
2014
2015
2016
2017
2018
2019
2020
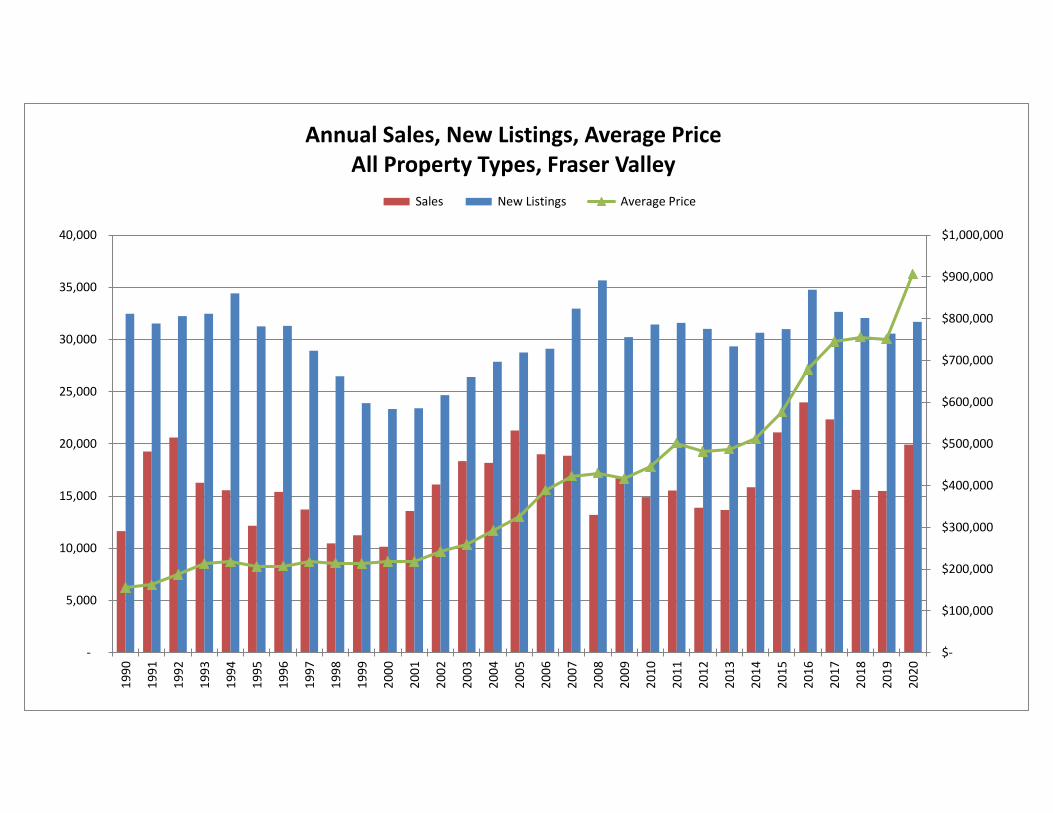
Annual Sales, New Listings, Average Price All Property Types, Fraser Valley
Sales New Listings Average Price