monthly alco package august 2010
TRANSCRIPT
www.pcbb.com www.bancinvestment.com
MONTHLY ALCO PACKAGEAugust 2010
BANK ACTIVITY
1 of 21
Economic and Banking Summary July and its summer heat took toll on all of us in one form or another. Despite the typical summer doldrums brought on by burnout and vacations, the month was a sizzler on a number of fronts. Using equities as a backdrop, both the S&P and Dow rounded out the month with modest gains. Dow up 8.05% and S&P up 7.73%. As for fixed income, the flight to quality remains strong as economic outlook encourages low risk investments. 2Y Treasury touched a record low 0.565% late in July. Mortgage rates continued their descent, and jumbos broke the 5% barrier for the first time this year. In the last 6 weeks and on 5 separate occasions, mortgage rates continue to make home buying and refinancing the most attractive in decades. GDP continues to grow and posted a 2.4% for the month. However, the momentum of growth has slowed to its slowest pace in almost a year. Consumer sentiment beat market expectations and had an upwards revision to 67.8% in the latter end of July. In contrast, consumer confidence fell by 3.9 points to 50.4% (slightly more than expected). The big news of the month was the passing of the Dodd-Frank Wall Street Reform and Consumer Protection Act. This is the most sweeping banking legislation since Great Depression, as it covers 16 chapters, 2000+ pages and 243 rules. To put this in perspective, GLBA was only 145 pages and SOX was only 61 pages. Now, some 67 1x reports to Congress are due (including Chinese drywall, mine safety and exploitation of Congo’s mineral deposits) in addition to the 22 ongoing reports that are required from regulators and legislative bodies. While the real impact will not be know for the next 1-2Y as the regulators write the rules, so far community banks can expect an increase in FDIC assessments, higher capital levels (such as 8% leverage ratio and 12% Tier-1 requirements), greater consumer compliance effort, more shareholder activism (for public banks) and more restrictions to holding company operations. The good news is the higher deposit insurance levels will help future deposit gathering and the fact that on a relative basis, community banks will get hurt a whole lot less than banks over $10B and $50B. At the end of July, we were able to gather a complete picture of 2Q numbers on bank performance. In general, bank earnings improved largely driven by lower additional reserves. Next to reserves, margins improved slightly amid a greater number of fixed rate loans added to the portfolio and lower deposit costs (and higher volume). In sum, a stable 2Q has made banks devote a small portion of resources away from credit quality and start to get back to the business of building a franchise. In other news, most European bank’s passed their stress test which was a strong point of relief to global markets. Having the stress test behind combined with financial sector reform legislation and revisions to Basel III, created a supportive market environment. This sentiment, combined with low inflation and a high level of liquidity are making many banks broadly positive on the risk outlook. As we enter into the last full month of summer, August is starting off with a deciding bearish tone largely driven a dour employment report. The loss of jobs, even discounting the planned Census workers coming off the payrolls, is concerning. The private sector did add jobs in education, healthcare and a few other areas, but losses from the government sector overwhelmed the numbers. Revisions to past months also hurt the employment outlook. The end result is while job growth should pick up, it is nowhere near the pace that is required to secure a stable recover and bring the threat of inflation forward (which is what we really need right now). Chris Nichols President & CEO
BANK ACTIVITY
2 of 21
Lending Activity Banks continue to see limited lending opportunities for commercial customers. We see underwriting standards becoming “more flexible” and spreads tightening. Given low rates, and a flattening curve, we believe that net interest margins are more likely to continue to be under pressure for the next year. While loan demand remains muted, banks continue to aggressively poach customers from each other – competing mostly on rate. Those banks that maintain good borrowers in floating-rate loans, or fixed-rate loans without prepayment penalties must be mindful of losing those customers or at the very least re-negotiating spreads. Many bankers are telling us that they would be pleased if they remain flat on loans for the remainder of the year, but for that to occur runoff must be stopped. We continue to sell loans to banks interested in floating-rate, national C&I obligors with strong credit profiles. In addition, we remain active at helping banks manage both credit and interest rate risk, through use of our unique BLP program. Ed Kofman Managing Director - Derivatives Desk
BANK ACTIVITY
3 of 21
Certificate of Deposit Issuance July was a surprisingly busy month for CD issuance as we had a few larger banks come in and gobble up some volume at these cheap levels. Most of the issuance was in the early part of the month as things tapered off to close out July. Rates ended the month slightly cheaper throughout the curve than where funds were trading to start the month. Pressure from regulators, capitalization issues and the lack of loan demand has and continues to keep the CD market quiet. As we always mention, these are the times for banks to be opportunistic as funds are readily available to you at a low all in cost. Looking ahead to August we anticipate the market to remain fairly quiet and issuance to be light throughout the month. August has always been a historically quiet month and with the current environment there is no evidence that this August will set the world on fire. So if you have some upcoming maturities or a CD that you can call and re-issue please contact us to discuss your options. Don Saunders Managing Director - Brokered CD's
BANK ACTIVITY
4 of 21
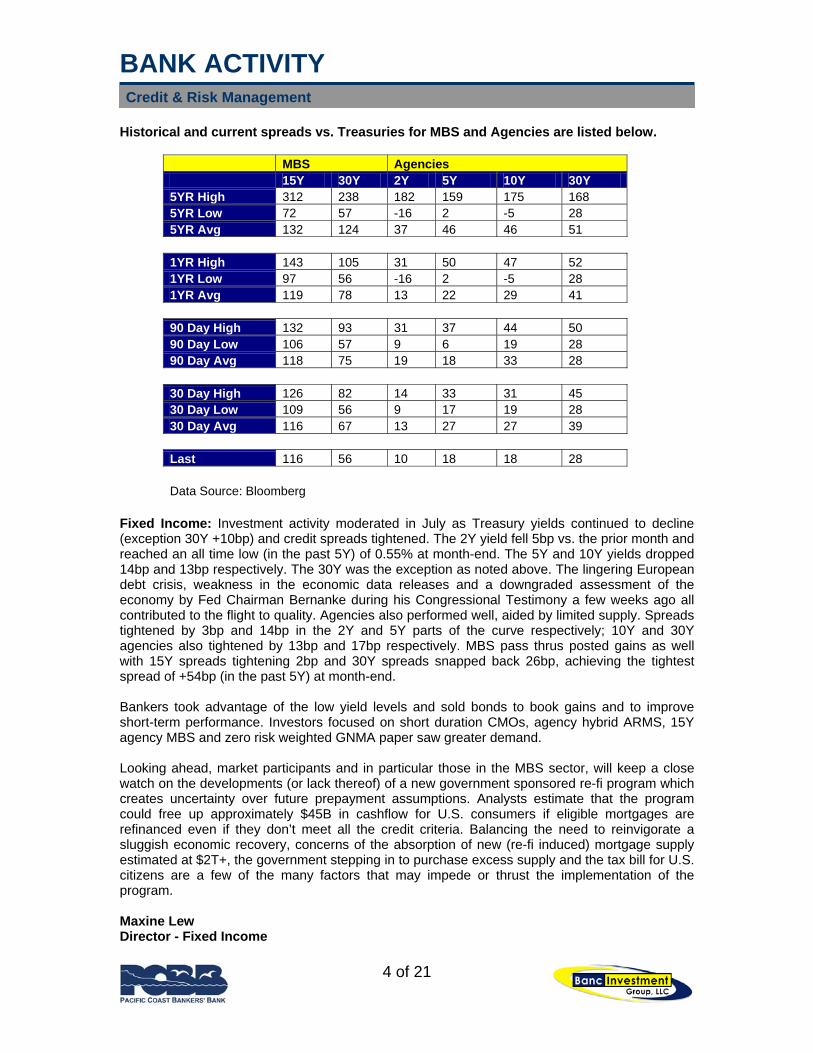
Credit & Risk Management Historical and current spreads vs. Treasuries for MBS and Agencies are listed below.
MBS Agencies 15Y 30Y 2Y 5Y 10Y 30Y 5YR High 312 238 182 159 175 168 5YR Low 72 57 -16 2 -5 28 5YR Avg 132 124 37 46 46 51 1YR High 143 105 31 50 47 52 1YR Low 97 56 -16 2 -5 28 1YR Avg 119 78 13 22 29 41 90 Day High 132 93 31 37 44 50 90 Day Low 106 57 9 6 19 28 90 Day Avg 118 75 19 18 33 28 30 Day High 126 82 14 33 31 45 30 Day Low 109 56 9 17 19 28 30 Day Avg 116 67 13 27 27 39 Last 116 56 10 18 18 28 Data Source: Bloomberg
Fixed Income: Investment activity moderated in July as Treasury yields continued to decline (exception 30Y +10bp) and credit spreads tightened. The 2Y yield fell 5bp vs. the prior month and reached an all time low (in the past 5Y) of 0.55% at month-end. The 5Y and 10Y yields dropped 14bp and 13bp respectively. The 30Y was the exception as noted above. The lingering European debt crisis, weakness in the economic data releases and a downgraded assessment of the economy by Fed Chairman Bernanke during his Congressional Testimony a few weeks ago all contributed to the flight to quality. Agencies also performed well, aided by limited supply. Spreads tightened by 3bp and 14bp in the 2Y and 5Y parts of the curve respectively; 10Y and 30Y agencies also tightened by 13bp and 17bp respectively. MBS pass thrus posted gains as well with 15Y spreads tightening 2bp and 30Y spreads snapped back 26bp, achieving the tightest spread of +54bp (in the past 5Y) at month-end. Bankers took advantage of the low yield levels and sold bonds to book gains and to improve short-term performance. Investors focused on short duration CMOs, agency hybrid ARMS, 15Y agency MBS and zero risk weighted GNMA paper saw greater demand. Looking ahead, market participants and in particular those in the MBS sector, will keep a close watch on the developments (or lack thereof) of a new government sponsored re-fi program which creates uncertainty over future prepayment assumptions. Analysts estimate that the program could free up approximately $45B in cashflow for U.S. consumers if eligible mortgages are refinanced even if they don’t meet all the credit criteria. Balancing the need to reinvigorate a sluggish economic recovery, concerns of the absorption of new (re-fi induced) mortgage supply estimated at $2T+, the government stepping in to purchase excess supply and the tax bill for U.S. citizens are a few of the many factors that may impede or thrust the implementation of the program. Maxine Lew Director - Fixed Income
BANK ACTIVITY
5 of 21
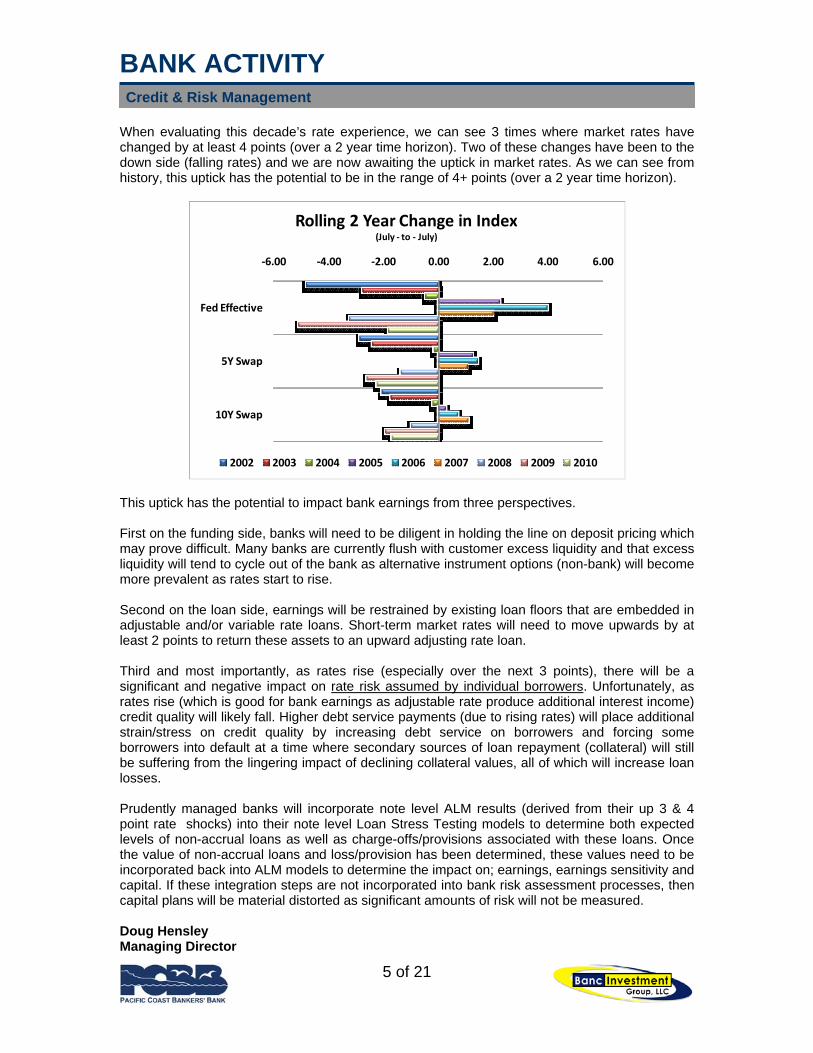
Credit & Risk Management When evaluating this decade’s rate experience, we can see 3 times where market rates have changed by at least 4 points (over a 2 year time horizon). Two of these changes have been to the down side (falling rates) and we are now awaiting the uptick in market rates. As we can see from history, this uptick has the potential to be in the range of 4+ points (over a 2 year time horizon).
‐6.00 ‐4.00 ‐2.00 0.00 2.00 4.00 6.00
Fed Effective
5Y Swap
10Y Swap
Rolling 2 Year Change in Index(July ‐ to ‐ July)
2002 2003 2004 2005 2006 2007 2008 2009 2010
This uptick has the potential to impact bank earnings from three perspectives. First on the funding side, banks will need to be diligent in holding the line on deposit pricing which may prove difficult. Many banks are currently flush with customer excess liquidity and that excess liquidity will tend to cycle out of the bank as alternative instrument options (non-bank) will become more prevalent as rates start to rise. Second on the loan side, earnings will be restrained by existing loan floors that are embedded in adjustable and/or variable rate loans. Short-term market rates will need to move upwards by at least 2 points to return these assets to an upward adjusting rate loan. Third and most importantly, as rates rise (especially over the next 3 points), there will be a significant and negative impact on rate risk assumed by individual borrowers. Unfortunately, as rates rise (which is good for bank earnings as adjustable rate produce additional interest income) credit quality will likely fall. Higher debt service payments (due to rising rates) will place additional strain/stress on credit quality by increasing debt service on borrowers and forcing some borrowers into default at a time where secondary sources of loan repayment (collateral) will still be suffering from the lingering impact of declining collateral values, all of which will increase loan losses. Prudently managed banks will incorporate note level ALM results (derived from their up 3 & 4 point rate shocks) into their note level Loan Stress Testing models to determine both expected levels of non-accrual loans as well as charge-offs/provisions associated with these loans. Once the value of non-accrual loans and loss/provision has been determined, these values need to be incorporated back into ALM models to determine the impact on; earnings, earnings sensitivity and capital. If these integration steps are not incorporated into bank risk assessment processes, then capital plans will be material distorted as significant amounts of risk will not be measured. Doug Hensley Managing Director
BANK ACTIVITY
6 of 21
Funding The 2nd quarter preliminary numbers for banks at this point are only partial, but we are seeing a trend which indicates the downward movement in the COF on interest bearing deposits may be slowing. This could mean for some banks their deposit rates and mix have reached a point where they can not lower their funding costs much more. For others, it could be an indication that more work is needed. In which category does your bank fall? In the samples of banks that we have been reviewing, the average change in the cost of funds on interest bearing deposits was around 20 bps from December 2009 to March 2010. The partial sample for the 2nd quarter shows the decline from March to June to be closer to 10 bps. Market interest rates such as LIBOR and Fed Funds have remained relatively steady (incredibly low) for most of 2010, but there have been significant changes in deposit pricing activity in most markets as certain banks are resolved or adopt better pricing discipline – some by choice, some by force. This moves the reference standard for all banks, and some have reacted better than others. One cannot afford to fall asleep at the switch as banks once pricing in the bottom third of the market may find themselves in the upper third if they are not careful about monitoring and adjusting their deposit activity. One of the processes banks have been going through has been to bring deposit costs from earlier interest rate environments down to current market levels. Rates on non-maturity deposits are typically the easiest and quickest to bring down. As of July 26, 2010, the FDIC national average rate for $10k tier MMDAs was 29 bps with the +75 bps rate cap being 1.04%. Similarly, the 12 month CD FDIC national average rate was 72 bps, with a rate cap of 1.47% for those institutions subject to this pricing restriction. As shown by our monthly market analysis packages for our Coach clients, most banks are pricing closer to the FDIC national rate averages than the caps. Older CDs have typically worked their way through the maturity schedule, so current COF performance is becoming more reflective of pricing and marketing activity of today rather than that of the past. Against this backdrop, it is important for banks to review their pricing and marketing activity to ensure they are doing all they can to continue lowering their deposit costs. IF the national average deposit rates are loosely 1.00% or less, how does your bank’s overall COF on interest bearing deposits compare? A hint is only 20-30% of the banks in the US have deposit costs less than 1.00%. We touched on one of the mistakes banks are making with their deposit activity in last month’s funding commentary – there are plenty of other mistakes we have been seeing which have caused certain banks to slow or even reverse the decline in their COFs. Fixing harmful behavior is just as effective, if not more so, than coming up with the next “miracle” product or marketing campaign. Most banks are rather liquid currently and have significantly reduced their growth rates from prior years. This is a perfect opportunity to take a closer look at your bank’s funding practices to ensure that positive behaviors are being employed to maximize current profitability (lower funding costs), and to position your bank for the future. If your bank had high or volatile funding costs in the past, it will most likely do so again unless corrective steps are taken today. Strongly performing banks need to work even harder today to ensure they are able to maintain and protect their superior performance. In which category does your bank fall? Greg Judge Liability and Strategic Consulting
BANK ACTIVITY
7 of 21
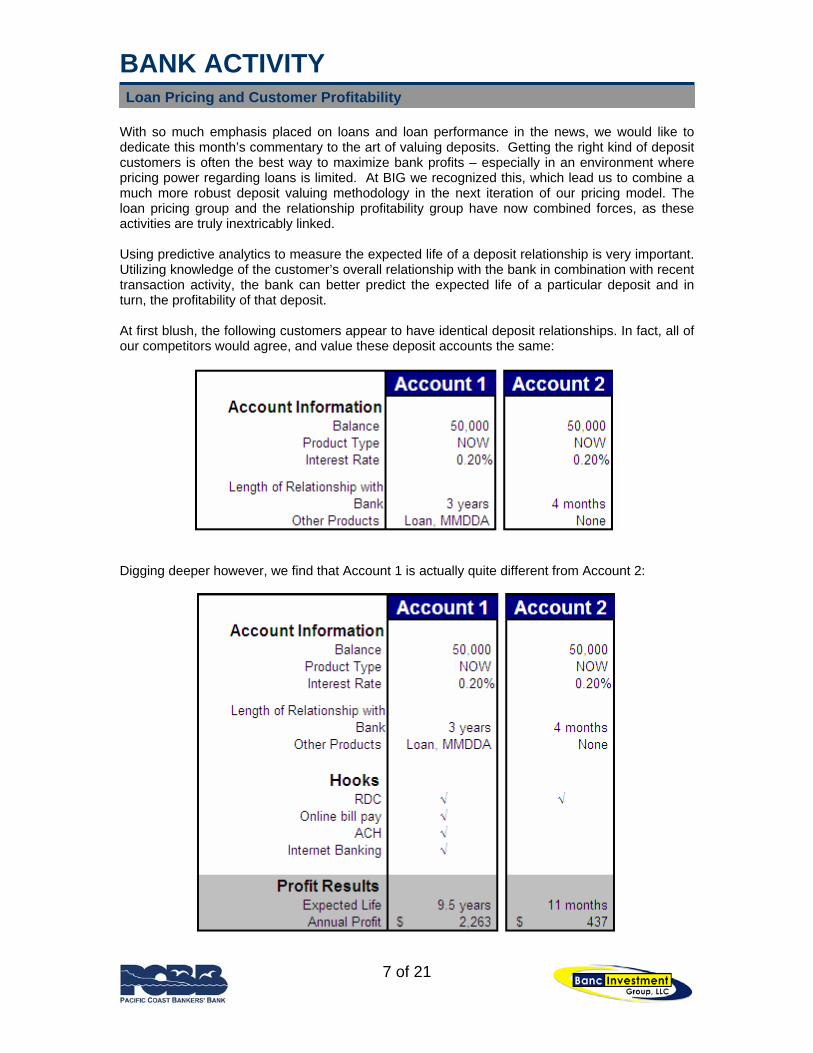
Loan Pricing and Customer Profitability With so much emphasis placed on loans and loan performance in the news, we would like to dedicate this month’s commentary to the art of valuing deposits. Getting the right kind of deposit customers is often the best way to maximize bank profits – especially in an environment where pricing power regarding loans is limited. At BIG we recognized this, which lead us to combine a much more robust deposit valuing methodology in the next iteration of our pricing model. The loan pricing group and the relationship profitability group have now combined forces, as these activities are truly inextricably linked. Using predictive analytics to measure the expected life of a deposit relationship is very important. Utilizing knowledge of the customer’s overall relationship with the bank in combination with recent transaction activity, the bank can better predict the expected life of a particular deposit and in turn, the profitability of that deposit. At first blush, the following customers appear to have identical deposit relationships. In fact, all of our competitors would agree, and value these deposit accounts the same:
Digging deeper however, we find that Account 1 is actually quite different from Account 2:
BANK ACTIVITY
8 of 21
Loan Pricing and Customer Profitability Studies show that the more products a customer uses, the lower the likelihood they are to leave. For example, if a customer only has a checking account at the bank, there is a 50% chance of losing that customer in any given year. However, if that customer has a checking and savings account, the probability drops to 10%. Those banks that can add a loan to the mix can push the probability down to 2%. Knowing which customers to cross sell to, and with which products, plays a huge roll in customer retention. The length of relationship, combined with other products and services, result in a much more profitable customer. The deposit funds from Account 1 are a much more stable (and predictable) source of funding than those from Account 2. Probabilities of Default Month in Review The average probability of default (PD) dropped 1.43% to 5.15% in July. Ag Farmland and Ag Production PDs reached all time highs at 2.91% and 1.43%, respectively. However, these are still the lowest PDs of the categories tracked and appear tame compared to Hotel's 11.02%. 6 categories hit annual highs while 5 are at yearly lows. Kim Jackson Managing Director Mike Middleton Managing Director
BANK ACTIVITY
9 of 21
Loan Pricing and Customer Profitability
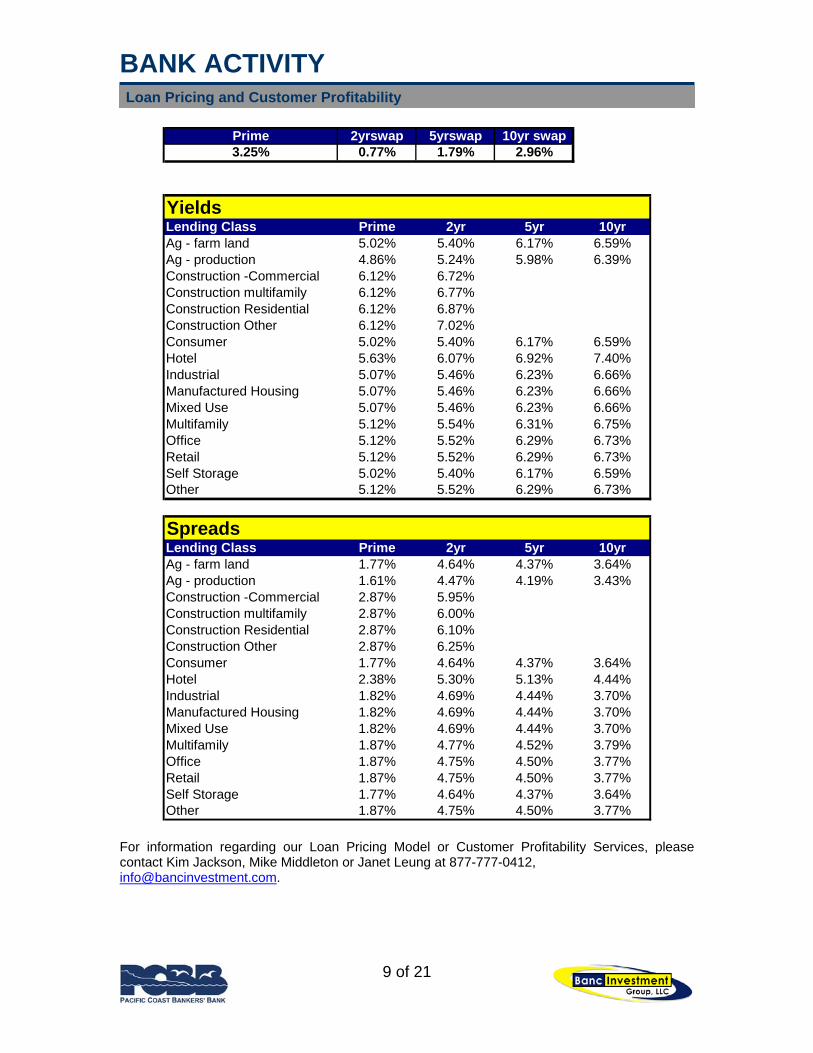
Prime 2yrswap 5yrswap 10yr swap3.25% 0.77% 1.79% 2.96%
YieldsLending Class Prime 2yr 5yr 10yrAg - farm land 5.02% 5.40% 6.17% 6.59%Ag - production 4.86% 5.24% 5.98% 6.39%Construction -Commercial 6.12% 6.72%Construction multifamily 6.12% 6.77%Construction Residential 6.12% 6.87%Construction Other 6.12% 7.02%Consumer 5.02% 5.40% 6.17% 6.59%Hotel 5.63% 6.07% 6.92% 7.40%Industrial 5.07% 5.46% 6.23% 6.66%Manufactured Housing 5.07% 5.46% 6.23% 6.66%Mixed Use 5.07% 5.46% 6.23% 6.66%Multifamily 5.12% 5.54% 6.31% 6.75%Office 5.12% 5.52% 6.29% 6.73%Retail 5.12% 5.52% 6.29% 6.73%Self Storage 5.02% 5.40% 6.17% 6.59%Other 5.12% 5.52% 6.29% 6.73%
SpreadsLending Class Prime 2yr 5yr 10yrAg - farm land 1.77% 4.64% 4.37% 3.64%Ag - production 1.61% 4.47% 4.19% 3.43%Construction -Commercial 2.87% 5.95%Construction multifamily 2.87% 6.00%Construction Residential 2.87% 6.10%Construction Other 2.87% 6.25%Consumer 1.77% 4.64% 4.37% 3.64%Hotel 2.38% 5.30% 5.13% 4.44%Industrial 1.82% 4.69% 4.44% 3.70%Manufactured Housing 1.82% 4.69% 4.44% 3.70%Mixed Use 1.82% 4.69% 4.44% 3.70%Multifamily 1.87% 4.77% 4.52% 3.79%Office 1.87% 4.75% 4.50% 3.77%Retail 1.87% 4.75% 4.50% 3.77%Self Storage 1.77% 4.64% 4.37% 3.64%Other 1.87% 4.75% 4.50% 3.77%
For information regarding our Loan Pricing Model or Customer Profitability Services, please contact Kim Jackson, Mike Middleton or Janet Leung at 877-777-0412, [email protected].
BANK ACTIVITY
10 of 21
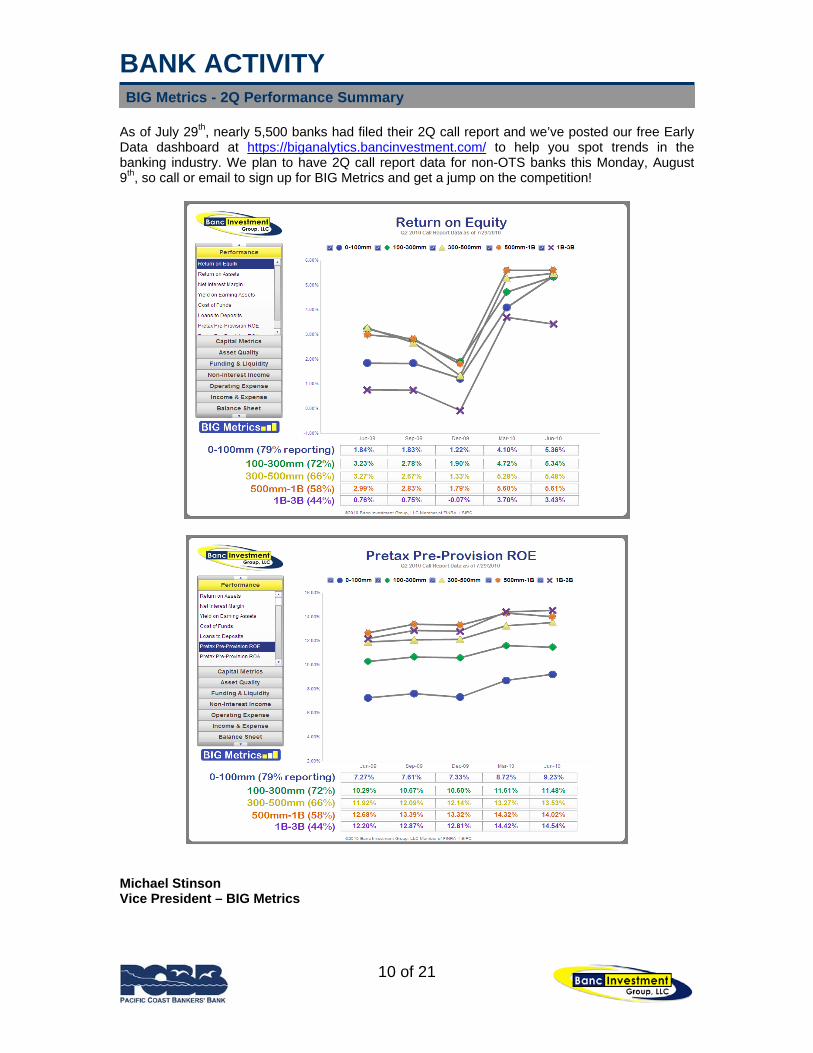
BIG Metrics - 2Q Performance Summary As of July 29th, nearly 5,500 banks had filed their 2Q call report and we’ve posted our free Early Data dashboard at https://biganalytics.bancinvestment.com/ to help you spot trends in the banking industry. We plan to have 2Q call report data for non-OTS banks this Monday, August 9th, so call or email to sign up for BIG Metrics and get a jump on the competition!
Michael Stinson Vice President – BIG Metrics

Real Estate Market Trends - Special Report2Q BriefingThe 2Q noted the season of records and for the most part was of the unpleasant kind. Employment continued to wane,ending the quarter at 9.5%. Although down from a 10.1% high last fall, any improvement in conditions will take sometime to ripple through office and retail properties. As for multifamily real estate, the pickup has begun.
For multifamily properties, the national average vacancy rate dropped for the first time in 3Y, falling 20bp to 7.8% asdemand made a larger turn. Net absorption topped 46k units, marking the largest quarterly gain in occupied space in10Y. 70% of this change came from existing properties as asking rents averaged 15% more for newly completedspaces. Over 29k units came online over the quarter, of which 57% remained vacant. Overall, rents were up a secondconsecutive quarter, rising 70bp following a 30bp rise in the 1Q. 67of 82 markets experienced a rise in rents with just asmany seeing an increase in occupancy. With the 2Q and 3Q typically running as stronger seasons, the 3Q should atleast be stable. With employment on the stop and go, the recovery may be muted.
Office occupied stock dropped for a 10th straight quarter with net absorption wading in the negatives, pushing vacanciesup 10bp to 17.4%, a 17Y high. Over the last 12 months, vacancies rose 140bp and since the cycle low in 3Q07, 490bp.Helpfully, construction has remained low, adding only 7.6mm sq. ft over the quarter. If employment does not takeanother turn for the worse, recovery may begin in the 2H of this year. Rents dropped an average 80bp, with 65 of 82markets experiencing a fall (up from 54/82 in the 1Q). Vacancies rose in 49 of 82 regions.
Construction completions tightened further for neighborhood and community shopping centers, with only 355mm sq. ft.coming online in the 2Q. However, this supply change did little, as demand languishes. As net absorption remained inthe negative (-2.2mm sq. ft) for the 10th straight quarter, vacancy rates inched another 10bp to 10.9% with rents fallinganother 50bp. Deterioration is slowing, helping alleviate some pressure from landlords. Vacancies jumped in 31 of 80markets with rents falling in 67. As for regional and super regional malls, vacancies rose 10bp to 9.0%, noting the 7thstraight quarter of vacancies surpassing record highs. Not coincidently, asking rents dropped for a 7th consecutivequarter, down 20bp.
Retail sales, less gas and auto, dropped 0.8% in May, and picked up a slight 0.1% in June. Until these figures begintrucking along, performance remains meager. Expectations on recovery are projected for late 2012.
11 of 21
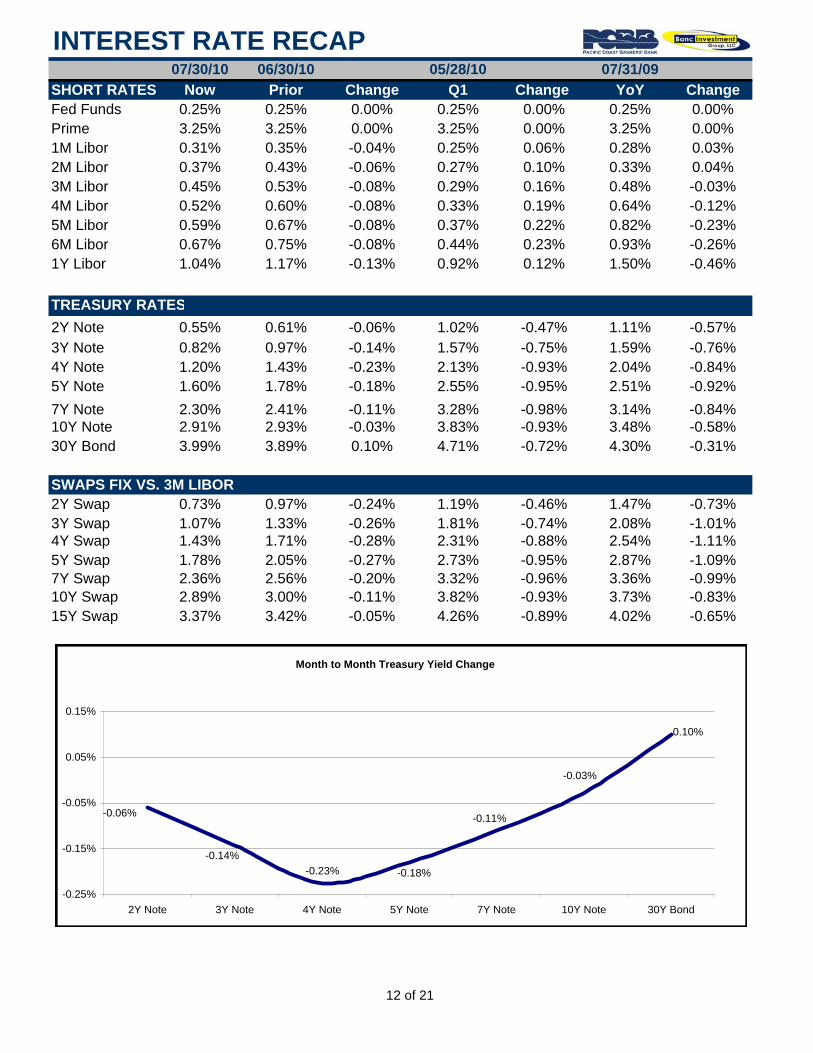
INTEREST RATE RECAP07/30/10 06/30/10 05/28/10 07/31/09
SHORT RATES Now Prior Change Q1 Change YoY ChangeFed Funds 0.25% 0.25% 0.00% 0.25% 0.00% 0.25% 0.00%Prime 3.25% 3.25% 0.00% 3.25% 0.00% 3.25% 0.00%1M Libor 0.31% 0.35% -0.04% 0.25% 0.06% 0.28% 0.03%2M Libor 0.37% 0.43% -0.06% 0.27% 0.10% 0.33% 0.04%3M Libor 0.45% 0.53% -0.08% 0.29% 0.16% 0.48% -0.03%4M Libor 0.52% 0.60% -0.08% 0.33% 0.19% 0.64% -0.12%5M Libor 0.59% 0.67% -0.08% 0.37% 0.22% 0.82% -0.23%6M Libor 0.67% 0.75% -0.08% 0.44% 0.23% 0.93% -0.26%1Y Libor 1.04% 1.17% -0.13% 0.92% 0.12% 1.50% -0.46%
TREASURY RATES2Y Note 0.55% 0.61% -0.06% 1.02% -0.47% 1.11% -0.57%3Y Note 0.82% 0.97% -0.14% 1.57% -0.75% 1.59% -0.76%4Y Note 1.20% 1.43% -0.23% 2.13% -0.93% 2.04% -0.84%5Y Note 1.60% 1.78% -0.18% 2.55% -0.95% 2.51% -0.92%7Y Note 2.30% 2.41% -0.11% 3.28% -0.98% 3.14% -0.84%10Y Note 2.91% 2.93% -0.03% 3.83% -0.93% 3.48% -0.58%30Y Bond 3.99% 3.89% 0.10% 4.71% -0.72% 4.30% -0.31%
SWAPS FIX VS. 3M LIBOR2Y Swap 0.73% 0.97% -0.24% 1.19% -0.46% 1.47% -0.73%3Y Swap 1.07% 1.33% -0.26% 1.81% -0.74% 2.08% -1.01%4Y Swap 1.43% 1.71% -0.28% 2.31% -0.88% 2.54% -1.11%5Y Swap 1.78% 2.05% -0.27% 2.73% -0.95% 2.87% -1.09%7Y Swap 2.36% 2.56% -0.20% 3.32% -0.96% 3.36% -0.99%10Y Swap 2.89% 3.00% -0.11% 3.82% -0.93% 3.73% -0.83%15Y Swap 3.37% 3.42% -0.05% 4.26% -0.89% 4.02% -0.65%
Month to Month Treasury Yield Change
-0.06%
-0.14%-0.23% -0.18%
-0.11%
-0.03%
0.10%
-0.25%
-0.15%
-0.05%
0.05%
0.15%
2Y Note 3Y Note 4Y Note 5Y Note 7Y Note 10Y Note 30Y Bond
12 of 21
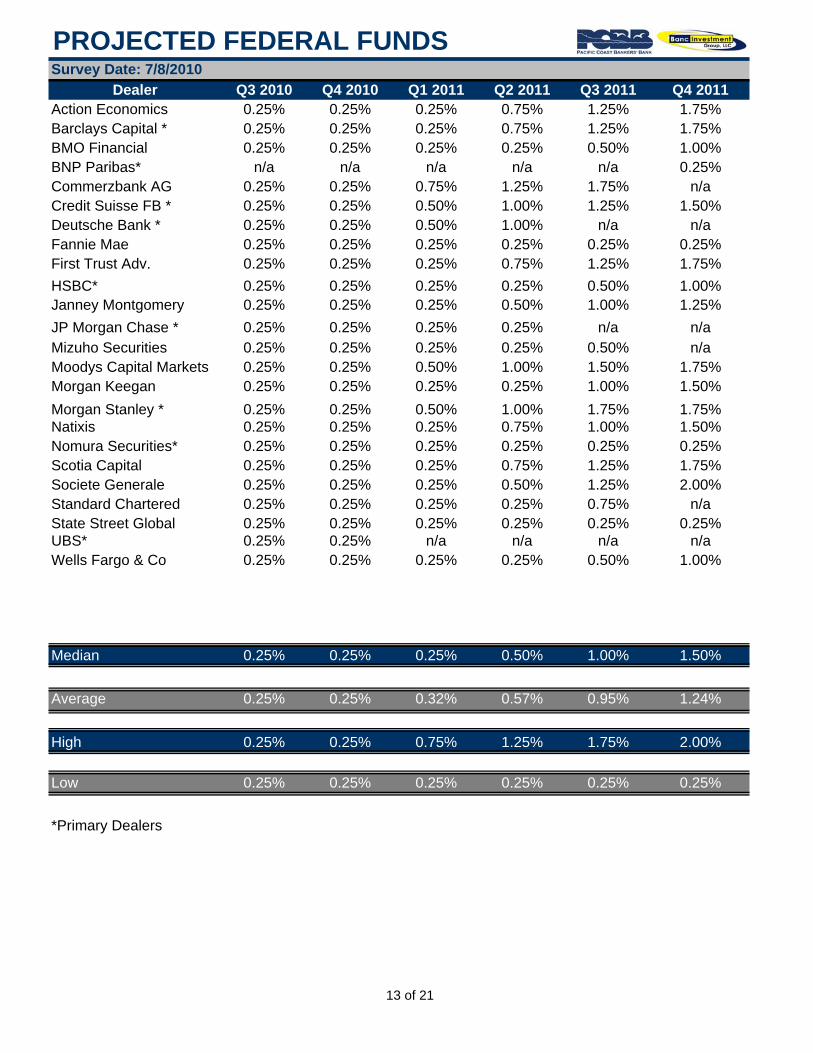
PROJECTED FEDERAL FUNDSSurvey Date: 7/8/2010
Dealer Q3 2010 Q4 2010 Q1 2011 Q2 2011 Q3 2011 Q4 2011Action Economics 0.25% 0.25% 0.25% 0.75% 1.25% 1.75%Barclays Capital * 0.25% 0.25% 0.25% 0.75% 1.25% 1.75%BMO Financial 0.25% 0.25% 0.25% 0.25% 0.50% 1.00%BNP Paribas* n/a n/a n/a n/a n/a 0.25%Commerzbank AG 0.25% 0.25% 0.75% 1.25% 1.75% n/aCredit Suisse FB * 0.25% 0.25% 0.50% 1.00% 1.25% 1.50%Deutsche Bank * 0.25% 0.25% 0.50% 1.00% n/a n/aFannie Mae 0.25% 0.25% 0.25% 0.25% 0.25% 0.25%First Trust Adv. 0.25% 0.25% 0.25% 0.75% 1.25% 1.75%HSBC* 0.25% 0.25% 0.25% 0.25% 0.50% 1.00%Janney Montgomery 0.25% 0.25% 0.25% 0.50% 1.00% 1.25%JP Morgan Chase * 0.25% 0.25% 0.25% 0.25% n/a n/aMizuho Securities 0.25% 0.25% 0.25% 0.25% 0.50% n/aMoodys Capital Markets 0.25% 0.25% 0.50% 1.00% 1.50% 1.75%Morgan Keegan 0.25% 0.25% 0.25% 0.25% 1.00% 1.50%Morgan Stanley * 0.25% 0.25% 0.50% 1.00% 1.75% 1.75%Natixis 0.25% 0.25% 0.25% 0.75% 1.00% 1.50%Nomura Securities* 0.25% 0.25% 0.25% 0.25% 0.25% 0.25%Scotia Capital 0.25% 0.25% 0.25% 0.75% 1.25% 1.75%Societe Generale 0.25% 0.25% 0.25% 0.50% 1.25% 2.00%Standard Chartered 0.25% 0.25% 0.25% 0.25% 0.75% n/aState Street Global 0.25% 0.25% 0.25% 0.25% 0.25% 0.25%UBS* 0.25% 0.25% n/a n/a n/a n/aWells Fargo & Co 0.25% 0.25% 0.25% 0.25% 0.50% 1.00%
Median 0.25% 0.25% 0.25% 0.50% 1.00% 1.50%
Average 0.25% 0.25% 0.32% 0.57% 0.95% 1.24%
High 0.25% 0.25% 0.75% 1.25% 1.75% 2.00%
Low 0.25% 0.25% 0.25% 0.25% 0.25% 0.25%
*Primary Dealers
13 of 21
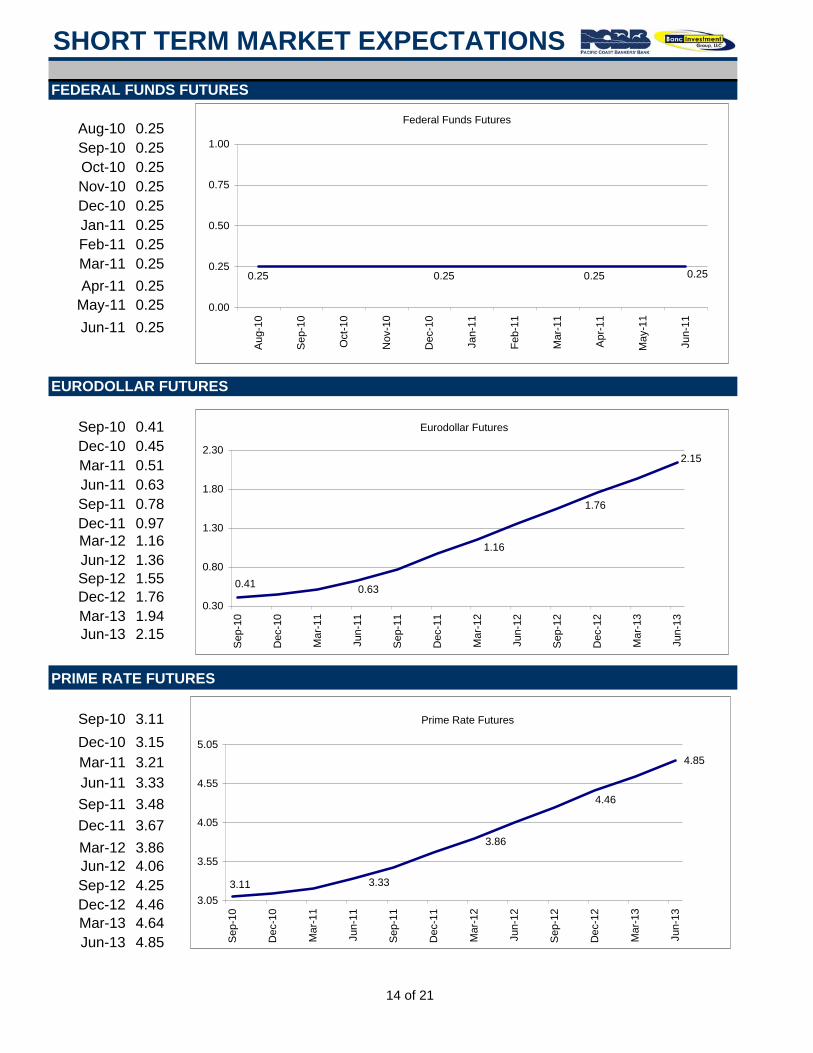
SHORT TERM MARKET EXPECTATIONSFEDERAL FUNDS FUTURES
Aug-10 0.25Sep-10 0.25Oct-10 0.25Nov-10 0.25Dec-10 0.25Jan-11 0.25Feb-11 0.25Mar-11 0.25Apr-11 0.25
May-11 0.25Jun-11 0.25
EURODOLLAR FUTURES
Sep-10 0.41Dec-10 0.45Mar-11 0.51Jun-11 0.63Sep-11 0.78Dec-11 0.97Mar-12 1.16Jun-12 1.36Sep-12 1.55Dec-12 1.76Mar-13 1.94Jun-13 2.15
PRIME RATE FUTURES
Sep-10 3.11Dec-10 3.15Mar-11 3.21Jun-11 3.33Sep-11 3.48Dec-11 3.67Mar-12 3.86Jun-12 4.06Sep-12 4.25Dec-12 4.46Mar-13 4.64Jun-13 4.85
Prime Rate Futures
4.85
3.11 3.33
3.86
4.46
3.05
3.55
4.05
4.55
5.05
Sep
-10
Dec
-10
Mar
-11
Jun-
11
Sep
-11
Dec
-11
Mar
-12
Jun-
12
Sep
-12
Dec
-12
Mar
-13
Jun-
13
Federal Funds Futures
0.25 0.25 0.25 0.25
0.00
0.25
0.50
0.75
1.00
Aug
-10
Sep
-10
Oct
-10
Nov
-10
Dec
-10
Jan-
11
Feb-
11
Mar
-11
Apr
-11
May
-11
Jun-
11
Eurodollar Futures
0.41 0.63
1.16
1.76
2.15
0.30
0.80
1.30
1.80
2.30
Sep
-10
Dec
-10
Mar
-11
Jun-
11
Sep
-11
Dec
-11
Mar
-12
Jun-
12
Sep
-12
Dec
-12
Mar
-13
Jun-
13
14 of 21
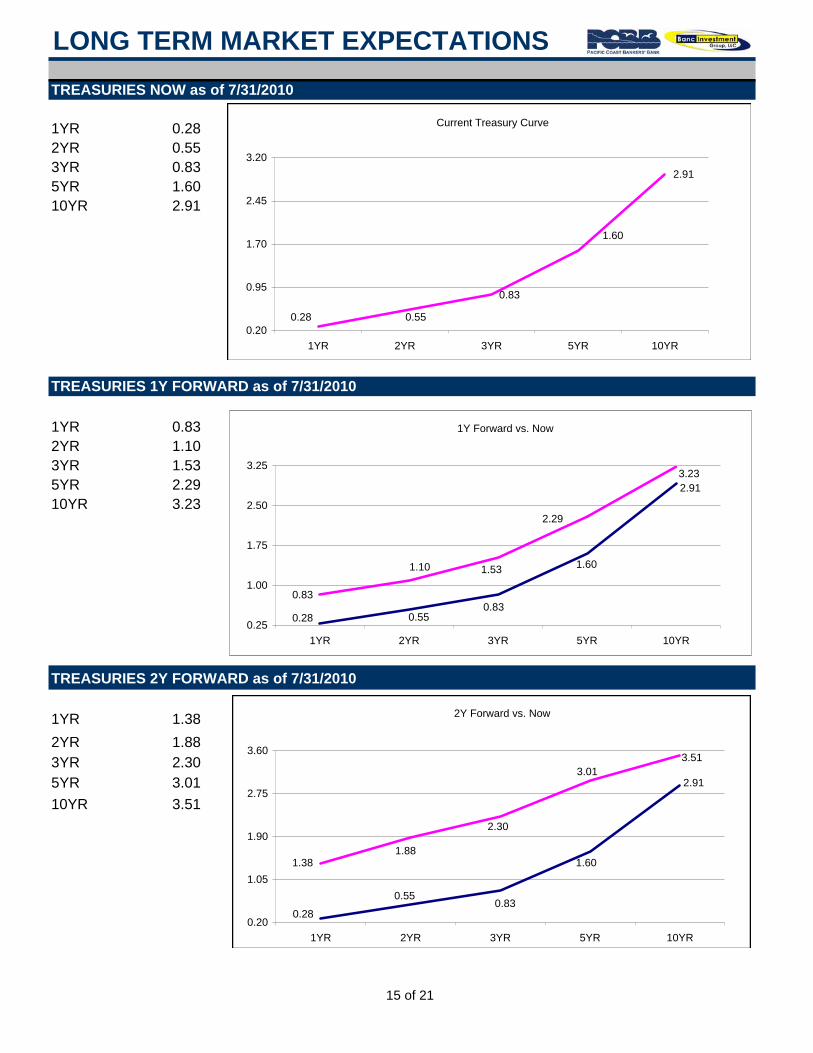
LONG TERM MARKET EXPECTATIONSTREASURIES NOW as of 7/31/2010
1YR 0.282YR 0.55 3.303YR 0.835YR 1.6010YR 2.91
TREASURIES 1Y FORWARD as of 7/31/2010
1YR 0.832YR 1.103YR 1.535YR 2.2910YR 3.23
TREASURIES 2Y FORWARD as of 7/31/2010
1YR 1.382YR 1.883YR 2.305YR 3.0110YR 3.51
Current Treasury Curve
2.91
0.28 0.55
0.83
1.60
0.20
0.95
1.70
2.45
3.20
1YR 2YR 3YR 5YR 10YR
1Y Forward vs. Now
0.28 0.550.83
1.60
2.91
0.83
1.10 1.53
2.29
3.23
0.25
1.00
1.75
2.50
3.25
1YR 2YR 3YR 5YR 10YR
2Y Forward vs. Now
1.381.88
2.30
3.013.51
0.28
0.550.83
1.60
2.91
0.20
1.05
1.90
2.75
3.60
1YR 2YR 3YR 5YR 10YR
15 of 21
OTHER IMPORTANT DATA
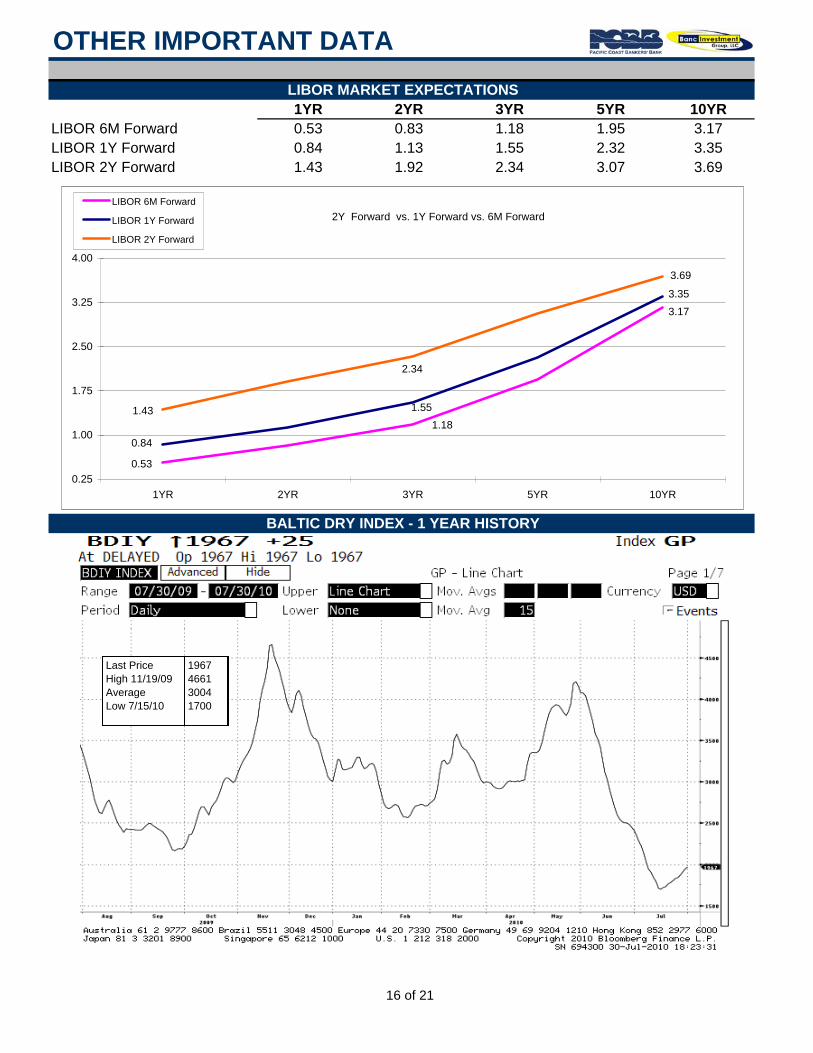
1YR 2YR 3YR 5YR 10YRLIBOR 6M Forward 0.53 0.83 1.18 1.95 3.17LIBOR 1Y Forward 0.84 1.13 1.55 2.32 3.35LIBOR 2Y Forward 1.43 1.92 2.34 3.07 3.69
LIBOR MARKET EXPECTATIONS
BALTIC DRY INDEX - 1 YEAR HISTORY
2Y Forward vs. 1Y Forward vs. 6M Forward
0.53
1.18
3.17
0.84
1.55
3.35
1.43
2.34
3.69
0.25
1.00
1.75
2.50
3.25
4.00
1YR 2YR 3YR 5YR 10YR
LIBOR 6M Forward
LIBOR 1Y Forward
LIBOR 2Y Forward
Last Price High 11/19/09Average Low 7/15/10
1967466130041700
16 of 21
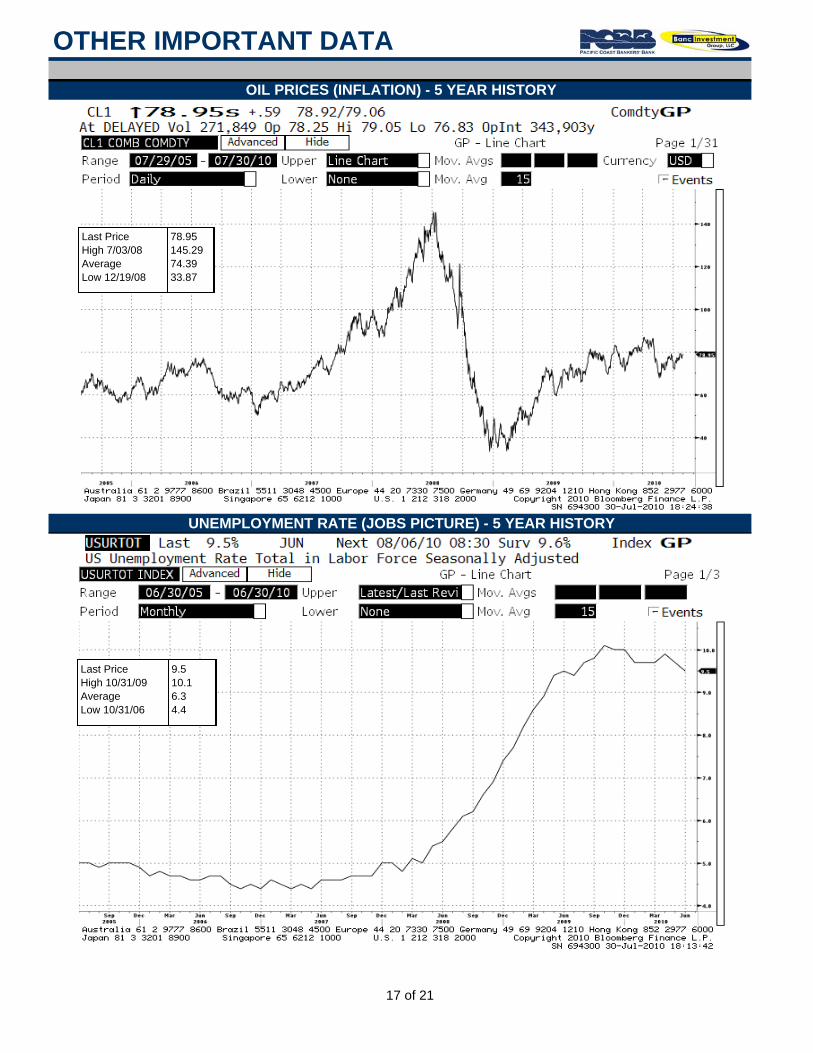
OTHER IMPORTANT DATAOIL PRICES (INFLATION) - 5 YEAR HISTORY
UNEMPLOYMENT RATE (JOBS PICTURE) - 5 YEAR HISTORY
Last Price High 10/31/09Average Low 10/31/06
9.510.16.34.4
Last Price High 7/03/08Average Low 12/19/08
78.95145.2974.3933.87
17 of 21
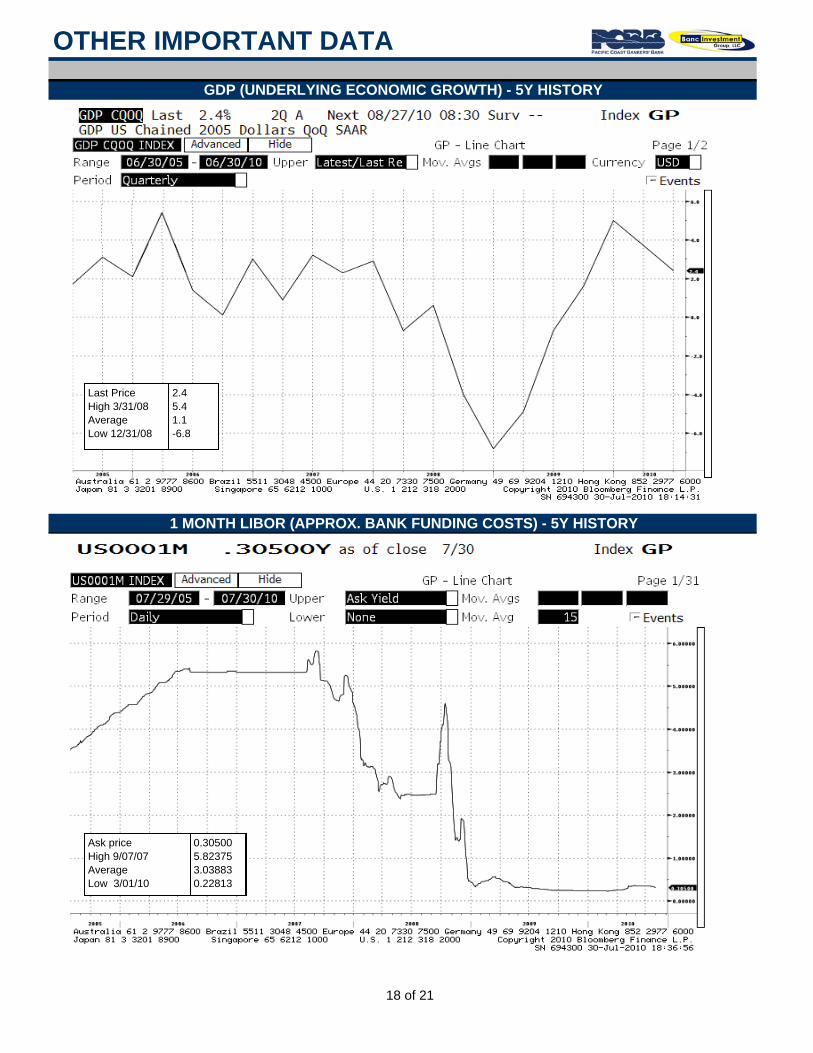
OTHER IMPORTANT DATAGDP (UNDERLYING ECONOMIC GROWTH) - 5Y HISTORY
1 MONTH LIBOR (APPROX. BANK FUNDING COSTS) - 5Y HISTORY
Last Price High 3/31/08 Average Low 12/31/08
2.45.41.1-6.8
Ask price High 9/07/07 Average Low 3/01/10
0.305005.823753.038830.22813
18 of 21
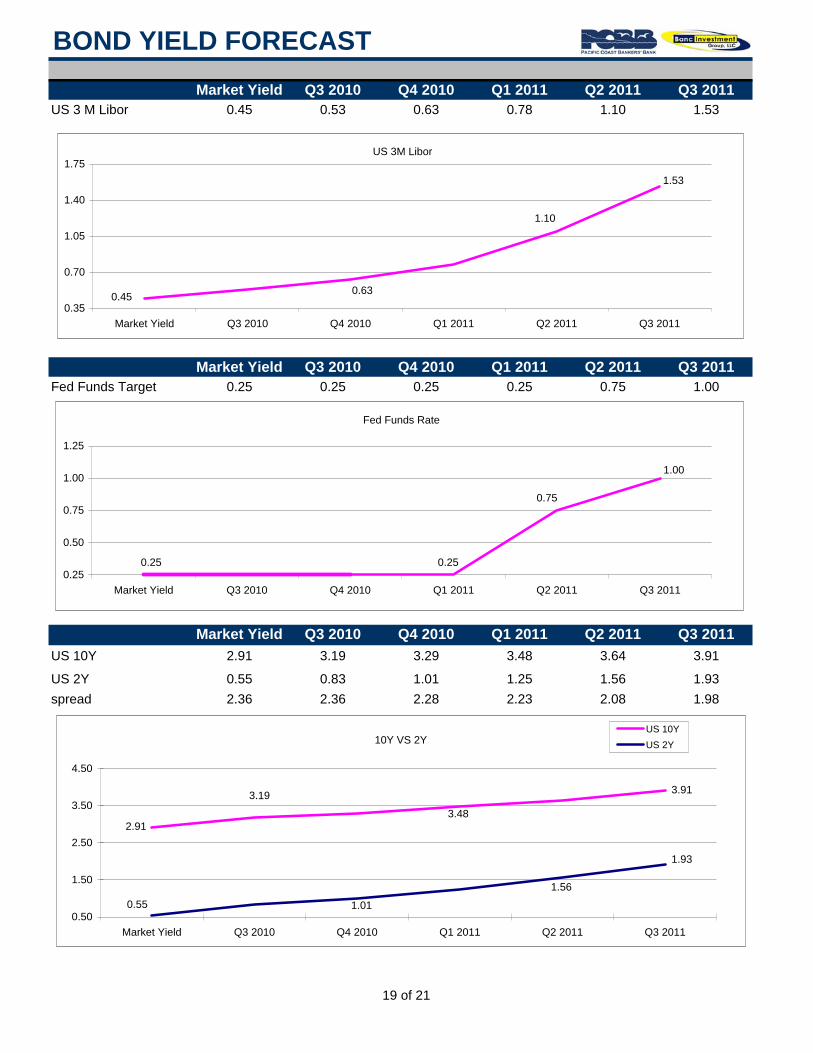
BOND YIELD FORECASTMarket Yield Q3 2010 Q4 2010 Q1 2011 Q2 2011 Q3 2011
US 3 M Libor 0.45 0.53 0.63 0.78 1.10 1.53
Market Yield Q3 2010 Q4 2010 Q1 2011 Q2 2011 Q3 2011Fed Funds Target 0.25 0.25 0.25 0.25 0.75 1.00
Market Yield Q3 2010 Q4 2010 Q1 2011 Q2 2011 Q3 2011US 10Y 2.91 3.19 3.29 3.48 3.64 3.91
US 2Y 0.55 0.83 1.01 1.25 1.56 1.93spread 2.36 2.36 2.28 2.23 2.08 1.98
US 3M Libor
0.45 0.63
1.10
1.53
0.35
0.70
1.05
1.40
1.75
Market Yield Q3 2010 Q4 2010 Q1 2011 Q2 2011 Q3 2011
Fed Funds Rate
0.25 0.25
0.75
1.00
0.25
0.50
0.75
1.00
1.25
Market Yield Q3 2010 Q4 2010 Q1 2011 Q2 2011 Q3 2011
10Y VS 2Y
2.91
3.19
3.48
3.91
0.55 1.01
1.56
1.93
0.50
1.50
2.50
3.50
4.50
Market Yield Q3 2010 Q4 2010 Q1 2011 Q2 2011 Q3 2011
US 10Y US 2Y
19 of 21

KEY UPCOMING DATES
01/28/09 0.00- 0.25% Risk to Growth 1 Ben Bernanke (Chairman)03/18/09 0.00- 0.25% Risk to Growth 2 James Bullard04/29/09 0.00- 0.25% Risk to Growth 3 William Dudley06/24/09 0.00- 0.25% Risk to Growth 4 Elizabeth Duke08/12/09 0.00- 0.25% Risk to Growth 5 Thomas Hoenig09/23/09 0.00- 0.25% Risk to Growth 6 Donald Kohn11/04/09 0.00- 0.25% Risk to Growth 7 Sandra Pianalto12/16/09 0.00- 0.25% Risk to Growth 8 Eric Rosengren01/27/10 0.00- 0.25% Risk to Growth 9 Daniel Tarullo03/16/10 0.00- 0.25% Risk to Growth 10 Kevin Warsh04/29/10 0.00- 0.25% Risk to Growth06/24/10 0.00- 0.25% Risk to Growth08/12/10 1 Christine Cumming09/23/10 2 Charles Evans11/04/10 3 Richard Fisher12/16/10 4 Narayana Kocherlakota01/26/11 5 Charles Plosser
Date Indicator Date Indicator8/2/2010 Construction Spending MoM 8/17/2010 Capacity Utilization8/2/2010 ISM Manufacturing & Prices Paid 8/17/2010 Building Permits & Housing Starts8/3/2010 Vehicle Sales 8/19/2010 Leading Indicators8/3/2010 Pending Home Sales 8/23/2010 Chicago Fed Nat Activity Index8/6/2010 Employment Report 8/24/2010 Richmond Fed Manufact. Index8/6/2010 Consumer Credit 8/24/2010 Existing Home Sales8/10/2010 Wholesale Inventories 8/25/2010 House Price Index8/11/2010 Monthly Budget Statement 8/25/2010 New Home Sales8/11/2010 Trade Balance 8/25/2010 Durable Goods Orders8/12/2010 Import Price Index 8/27/2010 GDP Price Index8/13/2010 Business Inventories 8/27/2010 Core PCE QoQ8/13/2010 Advance Retail Sales 8/27/2010 U. of Michigan Confidence8/13/2010 Consumer Price Index 8/30/2010 Personal Consumption8/16/2010 Empire Manufacturing 8/31/2010 Consumer Confidence8/16/2010 NAHB Housing Market Index 8/31/2010 S&P/ Case Shiller Home Price Ind8/17/2010 Producer Price Index 8/31/2010 Chicago Purchasing Manager8/17/2010 Industrial Production 8/31/2010 NAPM-Milwaukee
FOMC VOTING MEMBERSFOMC MEETING DATES
FOMC ALTERNATE MEMBERS
KEY UPCOMING ECONOMIC DATA
20 of 21
DISCLAIMER
340 Pine Street, Suite 401, San Francisco, CA 94104 ph. 877-777-0412
The information contained in this document is privileged and confidential. If the reader of this message isnot involved in trading or financial service activities, or responsible for delivering this message to theintended recipient, you are hereby notified that any distribution or copying of this communication is strictlyprohibited. If you have received this communication in error, please notify the Banc Investment Groupimmediately at 877-777-0412. This information does not constitute either an offer to sell or a solicitationof an offer to buy any of the securities referred to herein. Offers to sell and solicitations of offers to buythe securities are made only by, and this information must be read in conjunction with, the finalProspectus Supplement and the related Prospectus or, if not registered under the securities laws, thefinal Offering Memorandum (the “Offering Document”). Information contained herein does not purport tobe complete and is subject to the same qualifications and assumptions, and should be considered byinvestors only in the light of the same warnings, lack of assurances and representations and otherprecautionary matters, as disclosed in the Offering Document. This information may include certainassumptions and no representation is made that it is accurate or complete or that any returns indicatedwill be achieved. Changes to assumptions may have a material impact on returns. Past performance isnot indicative of future results. Price and availability are subject to change without notice. Pastperformance is no guarantee of future results. Investment return and principal value of mutual fundinvestments may fluctuate so that investor’s shares, when redeemed, may be worth more or less thantheir original cost. Mutual funds are not FDIC insured, not bank guaranteed and may lose value.Customers should rely on their own outside counsel, regulator, or accounting firm to address specificcircumstances. Additional information is available on request. Banc Investment Group is a member ofFINRA and SIPC, and the sister company of Pacific Coast Bankers' Bank. This document cannot bereproduced or redistributed outside of your institution without the written consent of the Banc InvestmentGroup. Banc Investment Group is the sister company of PCBB, and all securities are offer through BIG.
Source for data is Bloomberg, dealer provided documents and proprietary calculations or research. Thispackage is created specifically for independent banks as an added monthly service and provided bySteve Brown, Chris Nichols and the rest of the team at Banc Investment Group.
21 of 21