monthly state of the market report november 2012
TRANSCRIPT
Monthly State of the Market Report
November 2012
Published December 17, 2012
SPP Market Monitoring Unit

Table of Contents
Executive Summary .....................................................................................................................................2
Figure 1 – SPP EIS Price Contour Map ...........................................................................................3
Figure 2 – Congestion by Shadow Price Impact – November 2012 ................................................4
Figure 3 – Congestion by Shadow Price Impact – Previous 12 months ..........................................5
Figure 4 – Congestion by Interval ...................................................................................................6
Figure 5 – LIP / Gas Cost Comparison ............................................................................................7
Figure 6 – Average Hourly Price by Market Participant – November 2012 ...................................7
Figure 7 – Average Hourly Price by Market Participant – Previous 12 months .............................9
Figure 8 – Regional Monthly Prices ..............................................................................................10
Figure 9 – Energy Generation by Fuel Type .................................................................................11
Figure 10 – Wind Generation & Capacity .....................................................................................13
Figure 11 – Fuel on the Margin .....................................................................................................14
Figure 12 – EIS Settlements - GWh ..............................................................................................15
Figure 13 – Depth of Energy Market for Resources Only – by Status ..........................................16
Figure 14 –Market Ramp Rate Deficiency and Availability .........................................................17
Figure 15 – Dispatchable Range ....................................................................................................18
Figure 16 – Transmission Owner Revenue ....................................................................................19
Figure 17 – Average Transmission Reservations and Schedules ..................................................20
Figure 18 – RNU Components ......................................................................................................21
DISCLAIMER
The data and analysis in this report are provided for informational purposes only and shall not be considered or relied upon as market
advice or market settlement data. The Southwest Power Pool Market Monitoring Unit (SPP MMU) makes no representation or warranties
of any kind, express or implied, with respect to the accuracy or adequacy of the information contained herein.
The SPP MMU shall have no liability to recipients of this information or third parties for the consequences arising from errors or
discrepancies in this information, or for any claim, loss or damage of any kind or nature whatsoever arising out of or in connection with (i)
the deficiency or inadequacy of this information for any purpose, whether or not known or disclosed to the authors, (ii) any error or
discrepancy in this information, (iii) the use of this information, or (iv) a loss of business or other consequential loss or damage whether or
not resulting from any of the foregoing.
Copyright © 2012 by Southwest Power Pool, Inc. All rights reserved.

Southwest Power Pool, Inc. SPP Market Monitoring Unit
Monthly State of the Market Report 2 November 2012
Executive Summary
Congestion across the SPP Energy Imbalance Service (EIS) footprint abated
somewhat in November with only 6.5% of intervals having at least one breached
flowgate, compared to 11.5% of intervals in October (Figure 4). Congestion for the
year continues to exceed that experienced in prior years. The primary contributors to
localized congestion in the SPP EIS market during November included:
• High levels of wind generation and fluctuation of wind generation
• External impacts
• Planned transmission and generation outages, which typically take place during
“shoulder” months outside of the peak seasons.
Areas that saw much of the localized congestion in November (Figures 1 & 2)
included:
• Kansas City – Omaha corridor
• Texas Panhandle
• Southeast Kansas.
Wind generation in the SPP EIS Market continues to increase. Penetration into the
total generation mix is at an all-time high with 1,901 GWh of wind generation
during November. This represents 11.4% of all generation during November, which
is up from 9.6% in October (Figure 10).
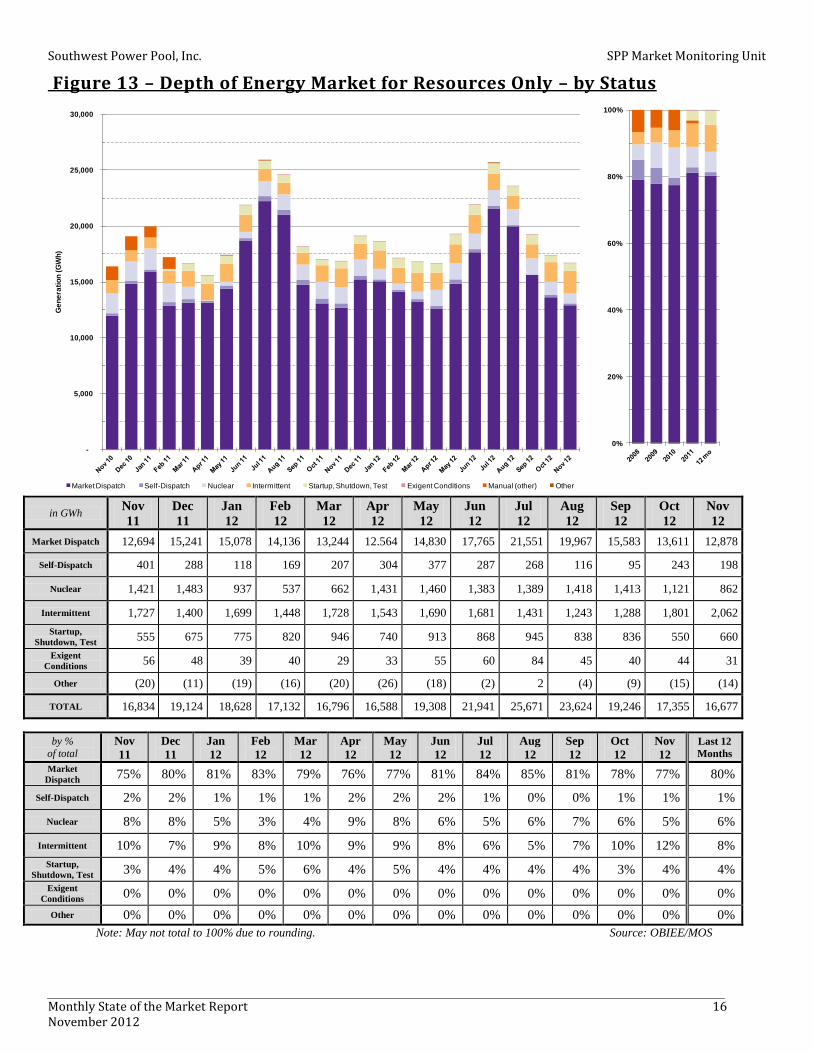
The SPP EIS market continues to operate efficiently and effectively, with just over
1% of total generation self-scheduled for November, while 77% of generation was
available for market dispatch and 12% produced by intermittent resources (Figure
13).
Average LIP for the SPP EIS market for November was $23.68/MWh, a 3% decrease
from October. Gas cost at the Panhandle Eastern hub increased by 7% during this
same period (Figure 5). Even with the increase in gas cost, the large amount of low-
cost wind output in the generation mix helped to decrease the LIP from October to
November.
Good availability of ramp resulted in only three intervals having a ramp deficiency
during November (Figure 14). Although dispatchable range decreased from October
to November, this is a typical seasonal pattern. However, the dispatchable range for
November 2012 is significantly higher than the same month in prior years (Figure
15).

Southwest Power Pool, Inc. SPP Market Monitoring Unit
Monthly State of the Market Report 3 November 2012
Figure 1 – SPP EIS Price Contour Map
November 2012
12 Month EIS Price Contour Map
500 kV
345 kV
230 kV
161 kV
138 kV
115 kV
69 kV
Oklahoma City
Tulsa
500 kV
345 kV
230 kV
161 kV
138 kV
115 kV
69 kV
Oklahoma City
Tulsa
Texas Panhandle
Kansas City –
Omaha
Corridor
SE Kansas
NE Texas

Southwest Power Pool, Inc. SPP Market Monitoring Unit
Monthly State of the Market Report 4 November 2012
Figure 2 – Congestion by Shadow Price Impact – November 2012
Region Flowgate Name Flowgate Location (kV)
[Balancing Authority]
Average
Hourly
Shadow
Price
($/MWh)
Total %
Intervals
(Breached
or
Binding)
Detailed Description
Kansas City –
Omaha PENMUNSTRCRA
Pentagon – Mund (115) [WR] ftlo Stranger Creek – Craig
(345) [WR-KCPL] $ 43.76 28.8%
Congested due to high external impacts, along
with planned outages in the area.
Texas
Panhandle
OSGCANBUSDEA
Osage Switch - Canyon East (115) ftlo Bushland - Deaf
Smith (230) [SPS] $ 22.93 23.2%
Congestion due to fluctuating wind generation
along with limited generation in the area to
respond to congestion. SPSNORTH_STH
5 element PTDF flowgate
north to south through west Texas
$ 6.40 28.9%
SE Kansas
NEORIVNEODEL
Neosho - Riverton (161) ftlo
Neosho - Delaware (345) [WR-EDE-CSWS]
$ 14.74 8.8%
Planned transmission outage in the area
contributed to congestion. NEORIVNEOMOR
Neosho - Riverton (161) ftlo
Neosho - Morgan (345) [WR-EDE]
$ 6.85 2.4%
NEORIVASBLIT
Neosho - Riverton (161) ftlo
Asbury - Litchfield (161)
[WR-EDE] $ 3.75 3.0%
NE Texas VALIANTLYDIA Valiant-Lydia (345) [CSWS] $ 9.69 11.0% Planned transmission outage in the area
contributed to congestion.
Western
Kansas
MEDXFRSPEMUL
Medicine Lodge Xfmr
(138/155) ftlo Spearville -
Mullergren (230) [SECI] $ 5.98 1.3%
Congestion due to fluctuating wind generation
along with limited generation in the area to
respond to congestion. In addition, planned
transmission and generation outages in the area
contributed to congestion.
TEMP03_18670
Flat Ridge - Harper (138) ftlo Spearville - Mullergren (230)
[SECI] $ 3.99 1.1%
TEMP28_18528
Hayes - Vine (115) ftlo
Postrock - Knoll (230) [SECI-MIDW]
$ 3.75 1.6%
0%
10%
20%
30%
40%
50%
$0
$10
$20
$30
$40
$50
%T
ota
l In
terv
als
Co
ng
este
d
Avera
ge H
ou
rly S
had
ow
Pri
ce
($/M
Wh
)
Average Hourly Shadow Price ($/MWh) % Total Intervals Congested

Southwest Power Pool, Inc. SPP Market Monitoring Unit
Monthly State of the Market Report 5 November 2012
Figure 3 – Congestion by Shadow Price Impact – Previous 12 months
Region Flowgate Name Flowgate Location (kV)
Average
Hourly
Shadow
Price
($/MWh)
Total %
Intervals
(Breached or
Binding)
Projects Expected to Provide Some
Positive Mitigation
(Estimated In Service Date –
Upgrade Type)
Texas
Panhandle
OSGCANBUSDEA
Osage Switch - Canyon East (115)
ftlo Bushland - Deaf Smith (230)
[SPS] $ 10.81 15.0%
1. Tuco Int. – Woodward 345 kV line (May 2014 -
Balanced Portfolio)
2. Castro County Int. – Newhart 115 kV line (April 2015 - Regional Reliability)
3. Tuco Int. – Amoco – Hobbs 345 lines (January
2020 – ITP10)
SPSNORTH_STH 5 element PTDF flowgate north to
south through west Texas $ 2.94 16.8%
1. Tuco Int. – Woodward 345 kV line (May 2014 -
Balanced Portfolio)
GRAXFRSWEELK
Grapevine Xfmr (230/115) [SPS]
ftlo Sweetwater – Elk City (230)
[CSWS] $ 2.70 1.2%
1.Bowers – Howard 115 kV line (June 2016 – ITPNT)
2. Altus Jct Tap – Russell 138 kV
Kansas
City –
Omaha
Corridor
PENMUNSTRCRA
Pentagon – Mund (115) [WR] ftlo
Stranger Creek – Craig (345) [WR-KCPL]
$ 6.76 5.5%
1. 1. Tap existing Swissvale – Stilwell 345 kV line at
West Gardner (Dec 2012 - Balanced Portfolio) 2. 2. Terminal upgrade for Pentagon – Mund 115 kV line
(TBD – ITPNT)
3. Iatan – Nashua 345 kV line (June 2015 - Balanced Portfolio)
CIRKNGIATSTJ Circleville - King Hill [WR] (115)
ftlo Iatan - St. Joe (345) [KCPL] $ 4.24 1.0%
1. Iatan – Nashua 345 kV line (June 2015 - Balanced
Portfolio)
LAKALASTJHAW
Lake Road – Alabama [GMOC] (161) ftlo St. Joe – Hawthorn
[GMOC] (345) $ 2.64 1.0%
1. Axtell – Post Rock – Spearville 345 kV line, two Spearville – Comanche – Flat Ridge –Woodward
345 kV lines, and two Flat Ridge – Wichita 345 kV
lines (Dec 2014 - Balanced Portfolio/Priority Projects)
2. Iatan – Nashua 345 kV line (June 2015 - Balanced
Portfolio)
3. Nebraska City – Maryville – Sibley 345 kV line
(June 2017 - Priority Projects)
4. Eastowne Transformer (345/161) and decommission of Lake Road – Alabama 161 kV
line (Jan 2013 – not NTC but is sponsored)
IASCLKNASJHA*
Iatan – Stranger Creek (345)
[KCPL/WR] ftlo Lake Road –
Alabama (161) [KCPL/GMOC]; St. Joe – Hawthorn (345)
[GMOC/KCPL]
$ 2.47 10.8%
1. Axtell – Post Rock – Spearville 345 kV line, two
Spearville – Comanche – Flat Ridge –Woodward 345 kV lines, and two Flat Ridge – Wichita 345 kV
lines (Dec 2014 - Balanced Portfolio/Priority
Projects) 2. Iatan – Nashua 345 kV line (June 2015 - Balanced
Portfolio)
3. Nebraska City – Maryville – Sibley 345 kV line (June 2017 - Priority Projects)
SUBTEKFTCRAU*
Sub 1226 - Tekamah (161) ftlo
Fort Calhoun - Raun (345)
[OPPD/MEC] $ 2.46 0.5%
1. Nebraska City – Maryville – Sibley 345 kV line
(June 2017 - Priority Projects)
Western
Kansas MINXFRMINSET
Mingo Xfmr (345/115) ftlo
Mingo - Setab (345) [SECI] $ 3.16 4.6%
1. Axtell-Post Rock-Spearville 345 kV (June 2013 –
Balanced Portfolio 2. Hitchland – Woodward 345 kV (July 2014 – High
Priority)
South
Central
Kansas
MEDXFRREDMIN
Medicine Lodge Xfmr (138/115) ftlo Red Willow – Mingo (345)
[SECI – NPPD] $ 2.40 2.3%
1. Axtell – Post Rock – Spearville 345 kV lines (June
2013 - Balanced Portfolio)
* Reciprocal Coordinated Flowgate (MISO)

Southwest Power Pool, Inc. SPP Market Monitoring Unit
Monthly State of the Market Report 6 November 2012
Figure 4 – Congestion by Interval
Nov
11
Dec
11
Jan
12
Feb
12
Mar
12
Apr
12
May
12
Jun
12
Jul
12
Aug
12
Sep
12
Oct
12
Nov
12
last 12
months
Uncongested
Intervals % 36.3% 17.3% 14.0% 4.1% 12.1% 12.3% 35.7% 18.7% 12.7% 3.2% 11.7% 7.3% 13.6% 13.6%
Intervals
with
Binding
Only %
60.6% 78.8% 81.8% 92.5% 82.7% 79.1% 58.0% 75.6% 78.9% 91.9% 81.9% 81.2% 80.0% 80.1%
Intervals
with a
Breach %
3.2% 3.8% 4.2% 3.4% 5.2% 8.6% 6.3% 5.6% 8.4% 4.9% 6.4% 11.5% 6.5% 6.3%
Source: MOS
0%
20%
40%
60%
80%
100%
Uncongested Intervals Intervals with Binding Only Intervals with a Breach
0%
20%
40%
60%
80%
100%

Southwest Power Pool, Inc. SPP Market Monitoring Unit
Monthly State of the Market Report 7 November 2012
Figure 5 – LIP / Gas Cost Comparison
Nov
11
Dec
11
Jan
12
Feb
12
Mar
12
Apr
12
May
12
Jun
12
Jul
12
Aug
12
Sep
12
Oct
12
Nov
12
12 month
average
Electricity
(LIP)
[$/MWh] 24.43 23.32 20.90 21.16 18.80 18.42 22.25 21.33 27.33 25.00 22.19 24.34 23.68 22.41
Gas
Panhandle
[$/MMBtu] 3.17 3.15 2.66 2.54 2.02 1.85 2.29 2.33 2.80 2.72 2.70 3.19 3.42 2.63
$0
$10
$20
$30
$40
$50
$0
$2
$4
$6
$8
$10
Ele
ctr
icit
y P
rice (
LIP
) $/M
Wh
Gas C
ost
$/M
MB
tu
Gas (Panhandle) Electricity (LIP)

Southwest Power Pool, Inc. SPP Market Monitoring Unit
Monthly State of the Market Report 8 November 2012
Figure 6 – Average Hourly Price by Market Participant – November 2012
in $ AECC AEPM BEPM EDEP GMOC GRDX GSEC INDN KBPU KCPS KPP LESM MEAN MIDW OGE OMPA OPPM SECI SPSM TEAC TEAN WFES WRGS
Max 181 185 152 178 170 182 58 171 171 171 171 163 159 139 189 190 165 120 58 177 160 197 171
Avg 26 26 20 27 24 25 24 25 28 25 22 21 20 21 23 23 21 20 24 26 21 23 21
Min -37 -24 -157 -49 -51 -53 -21 -51 -51 -51 -56 -195 -179 -66 -58 -59 -187 -72 -20 -48 -175 -65 -55
Volatility 43% 48% 71% 55% 45% 44% 32% 47% 59% 50% 50% 74% 72% 55% 48% 48% 72% 63% 31% 44% 71% 53% 48%
Volatility is measured by the Coefficient of Variation, which is the standard deviation across all hours
divided by the average of all hours. Higher percentages mean more volatility in hourly prices.
AECC
AEPM
BEPM
EDEP
GMOC
GRDX
GSEC
INDN
KBPU
KCPS
KPP
LESM
MEAN
MIDW
OGE OMPA
OPPM
SECI
SPSM
TEAC
TEAN
WFES
WRGS
23.68
$18
$20
$22
$24
$26
$28
AECC AEPM BEPM EDEP GMOC GRDX GSEC INDN KBPU KCPS KPP LESM MEAN MIDW OGE OMPA OPPM SECI SPSM TEAC TEAN WFES WRGS
$18
$20
$22
$24
$26
$28
Pri
ce
s ($
/MW
h)
Market Participant
MP Average SPP Average

Southwest Power Pool, Inc. SPP Market Monitoring Unit
Monthly State of the Market Report 9 November 2012
Figure 7 – Average Hourly Price by Market Participant – Previous 12 months
in $ AECC AEPM BEPM EDEP GMOC GRDX GSEC INDN KBPU KCPS KPP LESM MEAN MIDW OGE OMPA OPPM SECI SPSM TEAC TEAN WFES WRGS
Max 470 231 225 254 229 233 239 231 235 232 228 225 225 246 234 242 359 218 243 396 225 238 226
Avg 23 22 20 23 22 22 24 23 23 23 22 21 20 23 22 23 21 22 24 23 21 22 22
Min -139 -138 -185 -140 -142 -138 -69 -142 -141 -141 -142 -225 -204 -148 -137 -138 -228 -179 -70 -140 -204 -140 -142
Volati l i ty 54% 38% 61% 46% 41% 37% 39% 42% 46% 43% 39% 58% 57% 61% 39% 39% 65% 71% 42% 51% 57% 39% 36%
AECC
AEPM
BEPM
EDEP
GMOC
GRDX
GSEC
INDN
KBPU
KCPS
KPP
LESM
MEAN
MIDW
OGE OMPA
OPPM
SECI
SPSM
TEAC
TEAN
WFES
WRGS
22.41
$18
$20
$22
$24
$26
AECC AEPM BEPM EDEP GMOC GRDX GSEC INDN KBPU KCPS KPP LESM MEAN MIDW OGE OMPA OPPM SECI SPSM TEAC TEAN WFES WRGS
$18
$20
$22
$24
$26
Pri
ces (
$/M
Wh
)
Market Participant
MP Average SPP Average

Southwest Power Pool, Inc. SPP Market Monitoring Unit
Monthly State of the Market Report 10 November 2012
Figure 8 – Regional Monthly Prices
Region Average
Price
Maximum
Price
Minimum
Price Volatility
Average On-Peak
Price
Average Off-Peak
Price
SPP $23.68 $152.81 $(42.04) 40% $24.99 $22.44
MISO $29.11 $157.97 $1.40 52% $34.01 $25.19
ERCOT $27.37 $229.30 $7.21 67% $30.63 $24.76
Note: This table is a “rough comparison” because of inherent differences in the structure of the three markets and also because of the differences in how prices for SPP, MISO, and ERCOT are calculated. For SPP, load weighted averages are used, while the data from MISO and ERCOT are not load weighted. Volatility is measured by the Coefficient of Variation, which is the standard deviation across all hours divided by the average of all hours.
$0
$10
$20
$30
$40
Nov 11 Dec 11 Jan 12 Feb 12 Mar 12 Apr 12 May 12 Jun 12 Jul 12 Aug 12 Sep 12 Oct 12 Nov 12
$/M
Wh
SPP MISO ERCOT
0%
100%
200%
Nov 11 Dec 11 Jan 12 Feb 12 Mar 12 Apr 12 May 12 Jun 12 Jul 12 Aug 12 Sep 12 Oct 12 Nov 12
Regional Price VolatilitySPP Volatility
MISO Volatility
ERCOT Volatility

Southwest Power Pool, Inc. SPP Market Monitoring Unit
Monthly State of the Market Report 11 November 2012
Figure 9 – Energy Generation by Fuel Type
in
GWh Nov
11
Dec
11
Jan
12
Feb
12
Mar
12
Apr
12
May
12
Jun
12
Jul
12
Aug
12
Sep
12
Oct
12
Nov
12
Coal 10,756 12,872 12,238 11,190 9,867 8,678 10,479 12,365 14,303 13,677 11,726 11,344 11,041
Gas - SC 1,047 1,113 1,069 1,062 1,493 1,994 2,358 2,666 3,986 3,171 1,795 1,232 929
Gas - CC 1,986 2,281 2,723 2,946 3,100 2,949 3,396 3,965 4,681 4,098 3,136 1,939 1,907
Nuclear 1,421 1,483 937 537 662 1,431 1,460 1,383 1,389 1,408 1,413 1,121 862
Wind 1,505 1,236 1,552 1,252 1,498 1,325 1,484 1,480 1,226 1,037 1,111 1,664 1,901
Hydro 96 118 83 119 148 180 105 48 55 47 38 25 16
Other 23 21 25 26 28 31 26 34 31 32 28 28 21
Total 16,834 19,124 18,628 17,132 16,796 16,588 19,308 21,941 25,671 23,470 19,247 17,354 16,677
0
5,000
10,000
15,000
20,000
25,000
Gen
era
tio
n (
GW
h)
Coal Gas - SC Gas - CC Nuclear Wind Hydro Other
0%
20%
40%
60%
80%
100%

Southwest Power Pool, Inc. SPP Market Monitoring Unit
Monthly State of the Market Report 12 November 2012
0%
10%
20%
30%
40%
50%
60%
70%
80%
% o
f T
ota
l G
en
era
tio
n
Coal Gas - SC Gas - CC
0%
10%
20%
30%
40%
50%
60%
70%
80%
by % Nov
11
Dec
11
Jan
12
Feb
12
Mar
12
Apr
12
May
12
Jun
12
Jul
12
Aug
12
Sep
12
Oct
12
Nov
12
12
month
average
Coal 63.9% 67.3% 65.7% 65.3% 58.7% 52.3% 54.3% 56.4% 55.7% 58.3% 60.9% 65.4% 66.2% 60.3%
Gas-SC 6.2% 5.8% 5.7% 6.2% 8.9% 12.0% 12.2% 12.2% 15.5% 13.4% 9.3% 7.1% 5.6% 9.8%
Gas-CC 11.8% 11.9% 14.6% 17.2% 18.5% 17.8% 17.6% 18.1% 18.2% 17.6% 16.3% 11.2% 11.4% 16.0%
Nuclear 8.4% 7.8% 5.0% 3.1% 3.9% 8.6% 7.6% 6.3% 5.4% 6.0% 7.3% 6.5% 5.2% 6.1%
Wind 8.9% 6.5% 8.3% 7.3% 8.9% 8.0% 7.7% 6.7% 4.8% 4.4% 5.8% 9.6% 11.4% 7.2%
Hydro 0.6% 0.6% 0.4% 0.7% 0.9% 1.1% 0.5% 0.2% 0.2% 0.2% 0.2% 0.1% 0.1% 0.4%
Other 0.1% 0.1% 0.1% 0.1% 0.2% 0.2% 0.1% 0.2% 0.1% 0.1% 0.1% 0.2% 0.1% 0.1%

Southwest Power Pool, Inc. SPP Market Monitoring Unit
Monthly State of the Market Report 13 November 2012
Figure 10 – Wind Generation & Capacity
Nov
11
Dec
11
Jan
12
Feb
12
Mar
12
Apr
12
May
12
Jun
12
Jul
12
Aug
12
Sep
12
Oct
12
Nov
12
Capacity
(MW) 4,887 4,887 4,887 4,907 4,907 5,122 5,122 6,190 6,190 7,337 7,337 7,474 7,474
Generation
(GWh) 1,505 1,236 1,552 1,252 1,498 1,325 1,484 1,480 1,226 1,037 1,105 1,664 1,901
Capacity
Factor 43% 34% 43% 37% 41% 36% 39% 33% 27% 19% 21% 30% 35%
# of
Resources 70 70 70 71 71 73 73 81 81 91 91 93 93
Source: OBIEE/MOS
0
500
1,000
1,500
2,000
2,500
3,000
3,500
4,000
0
1,000
2,000
3,000
4,000
5,000
6,000
7,000
8,000
Win
d G
en
era
tio
n (
GW
h)
Win
d C
ap
acit
y (M
W)
Wind Capacity (MW) Wind Generation (GWh)
-
1,000
2,000
3,000
4,000
-
1,000
2,000
3,000
4,000
5,000
6,000
7,000
8,000
Win
d G
en
era
tio
n (
GW
h)
Win
d C
ap
acit
y (M
W)
20%
30%
40%
50%Wind Capacity Factor
2008 2009 2010 2011 last 12
months
Average
Monthly
Capacity
(MW)
1,950 2,985 3,468 4,263 5,986
Capacity
Factor 35.5% 32.5% 34.9% 36.4% 31.9%

Southwest Power Pool, Inc. SPP Market Monitoring Unit
Monthly State of the Market Report 14 November 2012
Figure 11 – Fuel on the Margin
Nov
11
Dec
11
Jan
12
Feb
12
Mar
12
Apr
12
May
12
Jun
12
Jul
12
Aug
12
Sep
12
Oct
12
Nov
12
last 12
months
Gas 40.2% 38.8% 42.3% 44.7% 49.5% 65.7% 62.1% 61.0% 74.5% 67.8% 55.1% 44.1% 44.0% 54.2%
Coal 59.7% 61.2% 57.7% 55.3% 50.4% 34.1% 37.8% 38.9% 25.4% 32.1% 44.8% 55.7% 55.8% 45.8%
Other 0.1% 0.0% 0.0% 0.0% 0.0% 0.1% 0.1% 0.1% 0.1% 0.1% 0.1% 0.2% 0.2% 0.1%
Source: MOS
Note:
During non-congested periods, one resource sets the price for the entire market. During
congested periods, the market is effectively segmented into several sub-areas, each with
its own marginal resource. Each congested interval counts the same as a non-congested
period, but the marginal fuel type for each sub-area is represented proportionally in the
congested period.
Co
al
Co
al
Co
al
Co
al
Co
al
Co
al
Co
al
Co
al
Co
al
Co
al
Co
al
Co
al C
oal
Co
al
Co
al
Co
al
Co
al
Co
al
Co
al
Co
al
Co
al
Co
al
Co
al C
oal
Co
al
Gas
Gas Gas
Gas
Gas
Gas G
as
Gas
Gas
Gas
Gas G
as
Gas
Gas
Gas
Gas
Gas
Gas
Gas
Gas
Gas G
as
Gas
Gas
Gas
0%
20%
40%
60%
80%
100%
Co
al C
oal
Co
al Co
al
Co
al
Gas
Gas
Gas G
as
Gas
0%
20%
40%
60%
80%
100%

Southwest Power Pool, Inc. SPP Market Monitoring Unit
Monthly State of the Market Report 15 November 2012
Figure 12 – EIS Settlements - GWh
in GWh Nov
11
Dec
11
Jan
12
Feb
12
Mar
12
Apr
12
May
12
Jun
12
Jul
12
Aug
12
Sep
12
Oct
12
Nov
12
Resource EI 3,038 3,381 3,765 3,395 4,095 3,549 3,487 3,904 4,190 4,204 3,571 3,495 3,479
Load EI 672 712 677 618 708 751 728 827 963 968 692 592 768
Scheduled
Transaction 29,551 33,621 32,421 29,887 28,503 28,434 34,253 39,302 47,019 42,194 33,715 30,044 29,023
Total Energy 33,261 37,713 36,864 33,900 33,306 32,734 38,467 44,033 52,172 47,365 37,979 34,131 33,270
by % Nov
11
Dec
11
Jan
12
Feb
12
Mar
12
Apr
12
May
12
Jun
12
Jul
12
Aug
12
Sep
12
Oct
12
Nov
12
Last 12
Months
Resource EI 9.1% 9.0% 10.2% 10.0% 12.3% 10.8% 9.1% 8.9% 8.0% 8.9% 9.4% 10.2% 10.5% 9.6%
Load EI 2.0% 1.9% 1.8% 1.8% 2.1% 2.3% 1.9% 1.9% 1.8% 2.0% 1.8% 1.7% 2.3% 1.9%
Scheduled
Transactions 88.9% 89.1% 88.0% 88.2% 85.6% 86.9% 89.0% 89.2% 90.1% 89.1% 88.8% 88.0% 87.2% 88.4%
Totals may not equal 100% due to rounding.
5%
7%
9%
11%
13%
15%
17%
0
10,000
20,000
30,000
40,000
50,000
60,000
EIS
Tra
nsacti
on
s a
s %
of
To
tal
GW
h
Scheduled Transactions (GWh) Load EI GWh Resource EI GWh % EIS Transactions
5%
7%
9%
11%
13%
15%
17%
2008 2009 2010 2011 12 mo
Southwest Power Pool, Inc. SPP Market Monitoring Unit
Monthly State of the Market Report 16 November 2012
Figure 13 – Depth of Energy Market for Resources Only – by Status
in GWh Nov
11
Dec
11
Jan
12
Feb
12
Mar
12
Apr
12
May
12
Jun
12
Jul
12
Aug
12
Sep
12
Oct
12
Nov
12
Market Dispatch 12,694 15,241 15,078 14,136 13,244 12.564 14,830 17,765 21,551 19,967 15,583 13,611 12,878
Self-Dispatch 401 288 118 169 207 304 377 287 268 116 95 243 198
Nuclear 1,421 1,483 937 537 662 1,431 1,460 1,383 1,389 1,418 1,413 1,121 862
Intermittent 1,727 1,400 1,699 1,448 1,728 1,543 1,690 1,681 1,431 1,243 1,288 1,801 2,062
Startup,
Shutdown, Test 555 675 775 820 946 740 913 868 945 838 836 550 660
Exigent
Conditions 56 48 39 40 29 33 55 60 84 45 40 44 31
Other (20) (11) (19) (16) (20) (26) (18) (2) 2 (4) (9) (15) (14)
TOTAL 16,834 19,124 18,628 17,132 16,796 16,588 19,308 21,941 25,671 23,624 19,246 17,355 16,677
by %
of total Nov
11
Dec
11
Jan
12
Feb
12
Mar
12
Apr
12
May
12
Jun
12
Jul
12
Aug
12
Sep
12
Oct
12
Nov
12
Last 12
Months
Market
Dispatch 75% 80% 81% 83% 79% 76% 77% 81% 84% 85% 81% 78% 77% 80%
Self-Dispatch 2% 2% 1% 1% 1% 2% 2% 2% 1% 0% 0% 1% 1% 1%
Nuclear 8% 8% 5% 3% 4% 9% 8% 6% 5% 6% 7% 6% 5% 6%
Intermittent 10% 7% 9% 8% 10% 9% 9% 8% 6% 5% 7% 10% 12% 8%
Startup,
Shutdown, Test 3% 4% 4% 5% 6% 4% 5% 4% 4% 4% 4% 3% 4% 4%
Exigent
Conditions 0% 0% 0% 0% 0% 0% 0% 0% 0% 0% 0% 0% 0% 0%
Other 0% 0% 0% 0% 0% 0% 0% 0% 0% 0% 0% 0% 0% 0%
Note: May not total to 100% due to rounding. Source: OBIEE/MOS
-
5,000
10,000
15,000
20,000
25,000
30,000
Ge
ne
rati
on
(G
Wh
)
Market Dispatch Self-Dispatch Nuclear Intermittent Startup, Shutdown, Test Exigent Conditions Manual (other) Other
0%
20%
40%
60%
80%
100%

Southwest Power Pool, Inc. SPP Market Monitoring Unit
Monthly State of the Market Report 17 November 2012
Figure 14 –Market Ramp Rate Deficiency and Availability
Nov
11
Dec
11
Jan
12
Feb
12
Mar
12
Apr
12
May
12
Jun
12
Jul
12
Aug
12
Sep
12
Oct
12
Nov
12
12 month
average
UP Ramp
Deficiency
Intervals 6 0 1 0 0 1 1 1 0 1 3 0 1 1
DOWN Ramp
Deficiency
Intervals 7 7 2 0 4 2 16 19 1 0 4 5 2 5
Total Ramp
Deficiency
Intervals 13 7 3 0 4 3 17 20 1 1 7 5 3 6
% of Total
Market
Dispatch
Intervals
0.15% 0.08% 0.03% 0.00% 0.04% 0.03% 0.19% 0.23% 0.01% 0.01% 0.08% 0.06% 0.03% 0.07%
MW / Minute /
100 MW of
Online Capacity 0.87 0.89 0.93 0.96 1.00 1.04 1.09 1.06 1.19 1.10 1.02 0.96 0.94 1.02
0.00
0.20
0.40
0.60
0.80
1.00
1.20
1.40
-
10
20
30
40
50
60
70
MW
/ M
inu
te o
f R
am
p /
100 M
W o
f O
nli
ne C
ap
acit
y
Ram
p D
efi
cie
ncy I
nte
rvals
UP Ramp Deficiency Intervals DOWN Ramp Deficiency Intervals MW / Minute / 100 MW of Online Capacity
0.00
0.20
0.40
0.60
0.80
1.00
1.20
1.40
2008 2009 2010 2011 12 mo

Southwest Power Pool, Inc. SPP Market Monitoring Unit
Monthly State of the Market Report 18 November 2012
Figure 15 – Dispatchable Range
Nov
11
Dec
11
Jan
12
Feb
12
Mar
12
Apr
12
May
12
Jun
12
Jul
12
Aug
12
Sep
12
Oct
12
Nov
12 last 12
mo
Average 37.7% 41.2% 42.1% 42.7% 43.6% 40.2% 38.0% 40.3% 38.4% 40.3% 41.6% 43.4% 41.5% 41.1%
Dispatchable Range is calculated as the average dispatachable range available (in MW)
divided by the average of the daily peak demand (MW) for the month.
32%
36%
40%
44%
Avg Dispatchable Range / Peak Demand
32%
36%
40%
44%
2008 2009 2010 2011 last 12 mo

Southwest Power Pool, Inc. SPP Market Monitoring Unit
Monthly State of the Market Report 19 November 2012
Figure 16 – Transmission Owner Revenue
in millions $ JAN FEB MAR APR MAY JUN JUL AUG SEP OCT NOV DEC
2009 35.7 34.2 33.4 43.8 41.0 43.1 43.4 43.7 42.7 41.3 40.0 43.5
2010 44.7 43.9 46.6 54.3 52.0 52.3 53.8 65.1 55.8 52.9 52.5 53.8
2011 62.3 76.8 76.4 65.4 69.8 67.5 74.7 77.7 83.7 69.8 68.6 71.6
2012 72.5 81.2 80.5 81.6 87.1 89.2 88.3 91.7 91.1 84.6 83.5
$0
$20
$40
$60
$80
$100
Mil
lio
ns

Southwest Power Pool, Inc. SPP Market Monitoring Unit
Monthly State of the Market Report 20 November 2012
Figure 17 – Average Transmission Reservations and Schedules
in thousands
MWh Nov
11
Dec
11
Jan
12
Feb
12
Mar
12
Apr
12
May
12
Jun
12
Jul
12
Aug
12
Sep
12
Oct
12
Nov
12
12 month
average
Average Daily
Reservations 506 479 476 468 389 483 499 505 532 467 453 500 515 481
Average Daily
Schedules 101 104 96 89 91 91 107 103 118 91 75 81 90 95
% 19.9% 21.8% 20.1% 18.9% 23.5% 18.9% 21.4% 20.4% 22.2% 19.5% 16.7% 16.3% 17.4% 19.8%
0%
10%
20%
30%
40%
50%
60%
0
100
200
300
400
500
600
Th
ou
san
ds M
Wh
Avg. Daily Transmission Reservations Schedules as a % of Reservations
0%
10%
20%
30%
40%
50%
60%
0
100
200
300
400
500
600

Southwest Power Pool, Inc. SPP Market Monitoring Unit
Monthly State of the Market Report 21 November 2012
Figure 18 – RNU Components
$ (thousands) Nov
11
Dec
11
Jan
12
Feb
12
Mar
12
Apr
12
May
12
Jun
12
Jul
12
Aug
12
Sep
12
Oct
12
Nov
12
EIS 1,035 -521 -985 -546 -618 -414 351 -222 -521 -149 -578 1,271 -410
O/S -68 -38 -25 -33 -53 -103 -41 -27 -28 -41 -101 -117 -60
U/S -48 -86 -170 -169 -200 -730 -32 -99 -202 -327 -213 -169 -567
UDC -33 -31 -24 -20 -23 -24 -50 -54 -76 -67 -47 -43 -37
SP Loss -1 -1 1 4 0 1 5 3 11 3 0 -5 -3
Net RNU 886 -677 -1,203 -764 -896 -1,269 233 -399 -815 -580 -938 937 -1,077
Absolute
RNU 2,539 2,096 2,072 1,790 2,612 3,115 2,400 1,602 2,572 2,536 2,814 4,098 3,126
EIS (Energy Imbalance Charge/Credit) – All energy deviations between actual generation or load and schedules are settled as (EIS).
O/S (Over-Scheduling Charge) - During any hour, if Locational Imbalance Prices diverge and a Market Participant’s Load imbalance is more than 4% (but at least 2 MW) at an applicable Settlement Location in that hour, that MP may be subject to an Over-Scheduling Charge.
U/S (Under-Scheduling Charge) - During any hour, if Locational Imbalance Prices diverge and a Market Participant’s Load imbalance is more than 4% (but at least 2 MW) at an applicable Settlement Location in that hour, that MP may be subject to an Under-Scheduling Charge.
UDC (Uninstructed Resource Deviation) – the difference between the dispatch instructions and the actual performance of a Resource.
SP Loss - Self-Provided Losses
-$4
-$2
$0
$2
$4
$6
Mil
lio
ns
SP LOSS UDC U/S O/S EIS Net RNU Absolute RNU
-$20
$0
$20
$40
$60
$80
Millions
Net RNU Absolute RNU