monthly performance review september 2021
TRANSCRIPT

Monthly Performance ReviewSeptember 2021
Prepared for the New York City Teachers’ Retirement System
11.2021
THE CITY OF NEW YORKOFFICE OF THE COMPTROLLER

TABLE OF CONTENTS
Market Indicators for September & October ....................................................................................................................... 1
Contribution to Returns ...................................................................................................................................................... 7
Asset Allocation: Growth, Deflation, Inflation; New Policy Weights & Adjusted Policy Weight Mixes .............................. 8
Classification of Investments. ............................................................................................................................................ 14
Teachers’ Market Values 2020-2021 ............................................................................................................................... 18
Teachers’ Market Values 2012-2021 ............................................................................................................................... 19
Manager /Benchmark Comparison Report ....................................................................................................................... 20
Private Equity Fund Supplemental Details ....................................................................................................................... 33
Private Equity Cash Flow Tracker .................................................................................................................................... 35
Real Estate Fund Supplemental Details ............................................................................................................................ 36
Real Estate Cash Flow Tracker ........................................................................................................................................ 37
Infrastructure Fund Supplemental Details……………………………………………………………………………………………………….….38
Infrastructure Cash Flow Tracker………………………………………………………………………………………………………………..…….39

MARKET INDICATORS1 Month 3 Month Fiscal YTD 1 Year 2 Year 3 Year 5 Year 10 Year
S&P 500 (4.65) 0.58 0.58 30.00 22.35 15.99 16.90 16.63S&P 400 (3.97) (1.76) (1.76) 43.68 18.57 11.08 12.97 14.72RUSSELL 1000 (4.59) 0.21 0.21 30.96 23.26 16.43 17.11 16.76RUSSELL 2000 (2.95) (4.36) (4.36) 47.68 21.76 10.54 13.45 14.63RUSSELL 3000 (4.49) (0.10) (0.10) 31.88 23.15 16.00 16.85 16.60RUSSELL 3000 GROWTH (5.49) 0.69 0.69 27.57 31.78 21.27 22.30 19.40RUSSELL 3000 VALUE (3.38) (0.93) (0.93) 36.64 13.53 9.94 10.94 13.48
MSCI EAFE NET (2.90) (0.45) (0.45) 25.73 12.41 7.62 8.81 8.10MSCI EMF NET (3.97) (8.09) (8.09) 18.20 14.31 8.58 9.23 6.09FTSE CUSTOM TEACHERS (4.02) (3.05) (3.05) 37.60 17.21 10.87 10.14MSCI WORLD NET (4.15) (0.01) (0.01) 28.82 19.26 13.14 13.74 12.68MSCI EUROPE SMID CAP NET (6.06) (1.07) (1.07) 32.06 18.95 10.00 11.02 11.32MSCI AC WORLD ex US NET (3.20) (2.99) (2.99) 23.92 12.98 8.03 8.94 7.48FTSE ALL WORLD EX US (3.04) (2.62) (2.62) 25.06 13.95 8.80 9.59 8.18MSCI World ex USA IMI NR (2.95) (0.45) (0.45) 27.05 13.33 8.10 9.09 8.17
1 Year Treasury Bill Yield + 4% 0.33 1.02 1.02 4.21 5.27 5.93 5.53 4.95HFRI Fund of Funds Composite Index + 1% 0.31 1.08 1.08 15.54 11.07 7.59 6.87 5.51
NYC - TREASURY AGENCY PLUS FIVE (2.17) (0.10) (0.10) (6.85) 2.29 7.01 2.76 3.28FTSE USBIG Treasury 1-3 Y Index (0.10) 0.06 0.06 0.03 1.78 2.63 1.62 1.15FTSE USBIG Treasury/Agency 1-10 y (0.64) (0.06) (0.06) (1.34) 2.25 3.95 1.98 1.79
CITY OF NEW YORK NYC Teachers' Retirement System
Market Indicator ReportSeptember 30, 2021
*NCREIF NFI - ODCE NET index return calculated on a quarterly basis Prepared by State Street Investment Analytics
1
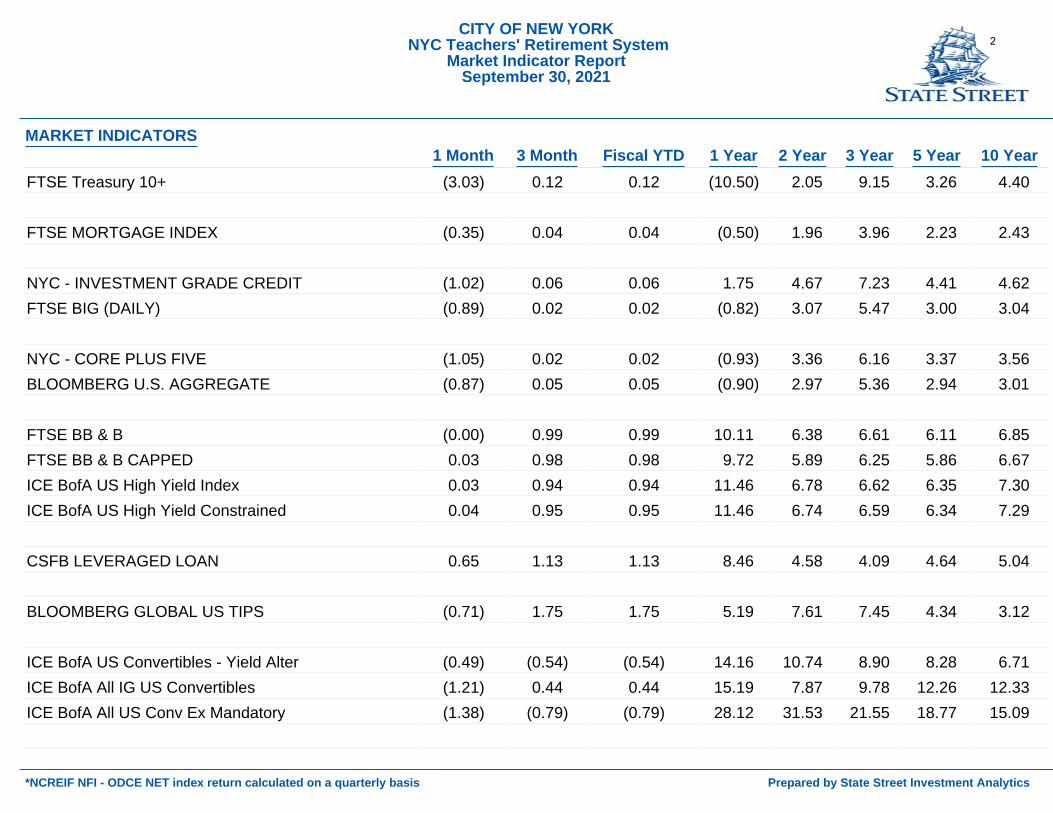
MARKET INDICATORS1 Month 3 Month Fiscal YTD 1 Year 2 Year 3 Year 5 Year 10 Year
FTSE Treasury 10+ (3.03) 0.12 0.12 (10.50) 2.05 9.15 3.26 4.40
FTSE MORTGAGE INDEX (0.35) 0.04 0.04 (0.50) 1.96 3.96 2.23 2.43
NYC - INVESTMENT GRADE CREDIT (1.02) 0.06 0.06 1.75 4.67 7.23 4.41 4.62FTSE BIG (DAILY) (0.89) 0.02 0.02 (0.82) 3.07 5.47 3.00 3.04
NYC - CORE PLUS FIVE (1.05) 0.02 0.02 (0.93) 3.36 6.16 3.37 3.56BLOOMBERG U.S. AGGREGATE (0.87) 0.05 0.05 (0.90) 2.97 5.36 2.94 3.01
FTSE BB & B (0.00) 0.99 0.99 10.11 6.38 6.61 6.11 6.85FTSE BB & B CAPPED 0.03 0.98 0.98 9.72 5.89 6.25 5.86 6.67ICE BofA US High Yield Index 0.03 0.94 0.94 11.46 6.78 6.62 6.35 7.30ICE BofA US High Yield Constrained 0.04 0.95 0.95 11.46 6.74 6.59 6.34 7.29
CSFB LEVERAGED LOAN 0.65 1.13 1.13 8.46 4.58 4.09 4.64 5.04
BLOOMBERG GLOBAL US TIPS (0.71) 1.75 1.75 5.19 7.61 7.45 4.34 3.12
ICE BofA US Convertibles - Yield Alter (0.49) (0.54) (0.54) 14.16 10.74 8.90 8.28 6.71ICE BofA All IG US Convertibles (1.21) 0.44 0.44 15.19 7.87 9.78 12.26 12.33ICE BofA All US Conv Ex Mandatory (1.38) (0.79) (0.79) 28.12 31.53 21.55 18.77 15.09
CITY OF NEW YORK NYC Teachers' Retirement System
Market Indicator ReportSeptember 30, 2021
*NCREIF NFI - ODCE NET index return calculated on a quarterly basis Prepared by State Street Investment Analytics
2

MARKET INDICATORS1 Month 3 Month Fiscal YTD 1 Year 2 Year 3 Year 5 Year 10 Year
DJ US SELECT REAL ESTATE (5.52) 1.25 1.25 40.56 4.49 8.32 5.68 10.52NCREIF NFI - ODCE NET* 6.41 6.41 6.41 13.64 6.88 6.13 6.56 8.92CPI + 4% 0.74 2.16 2.16 9.57 7.50 6.92 6.71
91 DAY TREASURY BILL 0.01 0.01 0.01 0.07 0.58 1.18 1.16 0.63
CITY OF NEW YORK NYC Teachers' Retirement System
Market Indicator ReportSeptember 30, 2021
*NCREIF NFI - ODCE NET index return calculated on a quarterly basis Prepared by State Street Investment Analytics
3

MARKET INDICATORS1 Month 3 Month Fiscal YTD 1 Year 2 Year 3 Year 5 Year 10 Year
S&P 500 7.01 5.13 7.63 42.91 25.22 21.48 18.93 16.21S&P 400 5.89 3.66 4.02 48.90 21.32 17.07 14.89 13.90RUSSELL 1000 6.94 4.98 7.16 43.51 26.14 22.01 19.16 16.30RUSSELL 2000 4.25 3.44 (0.29) 50.80 22.72 16.47 15.52 13.50RUSSELL 3000 6.76 4.88 6.65 43.90 25.90 21.62 18.91 16.10RUSSELL 3000 GROWTH 8.41 6.16 9.16 42.81 35.31 28.66 24.96 19.08RUSSELL 3000 VALUE 4.99 3.50 4.02 44.97 15.49 13.85 12.41 12.79
MSCI EAFE NET 2.46 1.24 2.00 34.18 11.79 11.54 9.79 7.37MSCI EMF NET 0.99 (0.49) (7.19) 16.96 12.52 12.30 9.39 4.88FTSE CUSTOM TEACHERS (0.88) (1.25) (3.90) 35.89 14.13 13.49 9.67MSCI WORLD NET 5.66 3.80 5.66 40.42 21.06 18.20 15.45 12.19MSCI EUROPE SMID CAP NET 3.43 (0.97) 2.33 43.09 18.32 15.11 12.89 10.53MSCI AC WORLD ex US NET 2.39 0.99 (0.67) 29.66 12.37 12.00 9.77 6.66FTSE ALL WORLD EX US 2.18 1.04 (0.49) 30.58 13.18 12.74 10.36 7.33MSCI World ex USA IMI NR 2.83 1.56 2.37 35.84 13.04 12.26 10.16 7.49
1 Year Treasury Bill Yield + 4% 0.29 0.97 1.31 4.16 5.07 5.84 5.51 4.95HFRI Fund of Funds Composite Index + 1% 1.71 3.33 2.75 16.99 11.66 9.22 7.27 5.57
NYC - TREASURY AGENCY PLUS FIVE 0.62 (1.81) 0.52 (4.44) 2.74 7.70 3.35 3.54FTSE USBIG Treasury 1-3 Y Index (0.31) (0.42) (0.25) (0.24) 1.46 2.47 1.58 1.11FTSE USBIG Treasury/Agency 1-10 y (0.50) (1.27) (0.56) (1.47) 1.84 3.77 1.98 1.76
CITY OF NEW YORK NYC Teachers' Retirement System
Market Indicator ReportOctober 31, 2021
*NCREIF NFI - ODCE NET index return calculated on a quarterly basis Prepared by State Street Investment Analytics
4

MARKET INDICATORS1 Month 3 Month Fiscal YTD 1 Year 2 Year 3 Year 5 Year 10 Year
FTSE Treasury 10+ 2.04 (1.28) 2.16 (5.83) 3.53 11.02 4.54 5.01
FTSE MORTGAGE INDEX (0.24) (0.74) (0.20) (0.69) 1.64 4.11 2.23 2.41
NYC - INVESTMENT GRADE CREDIT 0.16 (1.04) 0.22 2.13 4.49 7.73 4.61 4.49FTSE BIG (DAILY) (0.01) (1.05) 0.01 (0.38) 2.91 5.74 3.16 3.03
NYC - CORE PLUS FIVE 0.12 (1.11) 0.15 (0.27) 3.27 6.58 3.59 3.56BLOOMBERG U.S. AGGREGATE (0.03) (1.08) 0.02 (0.48) 2.80 5.63 3.10 3.00
FTSE BB & B (0.13) 0.42 0.85 9.45 6.19 7.09 6.04 6.29FTSE BB & B CAPPED (0.17) 0.40 0.81 9.00 5.68 6.72 5.78 6.10ICE BofA US High Yield Index (0.18) 0.40 0.76 10.74 6.56 7.15 6.25 6.66ICE BofA US High Yield Constrained (0.19) 0.40 0.76 10.75 6.52 7.11 6.23 6.65
CSFB LEVERAGED LOAN 0.24 1.38 1.37 8.53 4.96 4.17 4.53 4.80
BLOOMBERG GLOBAL US TIPS 1.13 0.24 2.91 7.07 8.08 8.37 4.66 3.05
ICE BofA US Convertibles - Yield Alter 1.48 1.41 0.93 15.97 11.12 10.23 8.74 6.56ICE BofA All IG US Convertibles 3.21 2.73 3.67 17.38 8.58 11.76 13.25 12.15ICE BofA All US Conv Ex Mandatory 3.34 3.80 2.53 34.01 32.59 25.48 19.93 14.81
CITY OF NEW YORK NYC Teachers' Retirement System
Market Indicator ReportOctober 31, 2021
*NCREIF NFI - ODCE NET index return calculated on a quarterly basis Prepared by State Street Investment Analytics
5

MARKET INDICATORS1 Month 3 Month Fiscal YTD 1 Year 2 Year 3 Year 5 Year 10 Year
DJ US SELECT REAL ESTATE 8.18 4.00 9.53 56.10 8.10 12.15 8.61 9.86NCREIF NFI - ODCE NET* 0.00 6.41 6.41 13.64 6.88 6.13 6.56 8.92CPI + 4% 1.27 2.64 3.46 10.49 7.87 7.19 6.86
91 DAY TREASURY BILL (0.00) 0.01 0.01 0.06 0.48 1.12 1.15 0.63
CITY OF NEW YORK NYC Teachers' Retirement System
Market Indicator ReportOctober 31, 2021
*NCREIF NFI - ODCE NET index return calculated on a quarterly basis Prepared by State Street Investment Analytics
6

NYC Teachers' Retirement System Contribution to Return - September 2021
1 Month - Total Fund 3 Months - Total Fund FYTD - Total Fund FY Ending 6/30/21 Total FY Ending 6/30/20 Total Return: (2.50)% Return: 0.15% Return: 0.15% Return: 24.80% Return: 4.89%
(1.62)
0.21 0.21
0.71 0.71
2.82
0.10 0.10
0.78
0.06 0.06
0.35 (0.22)
3.22
(0.23)
(0.44)
(0.79) (0.79)
4.90
(0.69)
(0.48)
(0.16) (0.16)
4.16
(1.35)
12.49
1.97
DOMESTIC EQUITY
WORLD EX-USA
EMERGING MARKETS
INTL FOF
GLOBAL EQUITY
REITS
CORE + 5
TIPS
HIGH YIELD
BANK LOANS
CONVERTIBLE BONDS
OPPORTUNISTIC FIXED
TARGETED
OTHER FIXED
PRIVATE EQUITY
PRIVATE REAL ESTATE
INFRASTRUCTURE
RESIDUAL
(0.02)-Global Eq 0.00-REITS(0.02)-TIPS0.01-HY0.00-BL0.00-Conv0.02-Opp FI(0.00)-ETI0.00-Oth FI0.02-PE0.01-RE0.00-Infra0.01-Res
(0.02)-Dom Eq(0.02)-Intl FoF0.00-Global Eq0.00-REITS0.03-Core+50.04-HY0.00-BL0.00-Conv0.00-ETI0.00-Oth FI0.02-Infra(0.04)-Res
(0.02)-Dom Eq(0.02)-Intl FoF0.00-Global Eq0.00-REITS0.03-Core+50.04-HY0.00-BL0.00-Conv0.00-ETI0.00-Oth FI0.02-Infra(0.04)-Res
0.30-Intl FoF0.16-Global Eq0.00-REITS(0.62)-Core+50.24-TIPS(0.00)-BL0.00-Conv0.61-Opp FI0.00-ETI0.01-Oth FI0.32-RE0.23-Infra
0.16-World ex(0.02)-Intl FoF0.02-Global Eq0.02-HY(0.04)-BL0.00-Conv(0.07)-Opp FI0.07-ETI0.02-Oth FI0.13-PE0.01-RE0.08-Infra(0.10)-Res
7

3.2%0.6%
-0.1%-0.2%
-2.3% -2.0%
0.6%0.0% 0.0%
0.8% 0.4%
-8.00%-6.00%-4.00%-2.00%0.00%2.00%4.00%6.00%8.00%
10.00%Relative Mix to New Policy Weights
$28.528.1%
Domestic US Equity World ex-USA Emerging Markets Private Equity
$10.710.6%
$9.59.4%
$6.96.8%
$1.71.7%
$3.03.0%
$0.00.0%
Private Real Estate – Non-Core Opportunistic FI
High Yield REITS Convertible Bonds
$101.2B Under ManagementPortfolio Asset Allocation – Growth : September 30, 2021
Asset Allocation
Note: Brackets represent rebalancing ranges versus Policy.
Teachers’ Retirement System of the City of New YorkPerformance Overview as of September 30, 2021Prepared by State Street
$0.00.0%
Int’l Emerging Managers FoF
$5.15.1%
Global Equity
$0.40.4%
8

$101.2B Under ManagementPortfolio Asset Allocation – Growth : September 30, 2021
Asset Allocation
Note: Brackets represent rebalancing ranges versus Policy.
0.8% 0.8% 0.0%0.0% 0.0% 0.0%
-0.5%
0.0% 0.0% 0.0% 0.1%
-8.00%-6.00%-4.00%-2.00%0.00%2.00%4.00%6.00%8.00%
10.00%Relative Mix to Adjusted Policy Weights
Asset Allocation
Teachers’ Retirement System of the City of New YorkPerformance Overview as of September 30, 2021Prepared by State Street
Note: On September 30, 2021 TRS' combined Fixed Income and Cash portfolioshave a duration of 5.9 years. The duration of the Barclays US Aggregate Indexwas 6.7 years on that date.
Domestic US Equity World ex-USA Private Equity Private Real Estate – Non-Core Opportunistic FI
High Yield REITS Convertible Bonds Int’l Emerging Managers FoF Global Equity
$28.528.1%
$10.710.6%
$9.59.4%
$6.96.8%
$1.71.7%
$3.03.0%
$0.00.0%
$0.00.0%
$0.80.8%
$5.15.1%
$0.40.4%
9

Asset Allocation
US Government Treasuries
$14.514.3%
0.3% 0.1% 0.1% 0.9%0.0%
0.3%
-8.00%-6.00%-4.00%-2.00%0.00%2.00%4.00%6.00%8.00%
10.00%
$5.75.6%
Mortgages Investment Grade Corporate Short Term
$5.75.6%
$0.90.9%
Relative Mix to New Policy Weights
$101.2B Under ManagementPortfolio Asset Allocation – Deflation Protection : September 30, 2021
$0.00.0%
$0.30.3%
Core Fixed Income-Emerging ManagersCore Fixed Income-Developing Managers
Teachers’ Retirement System of the City of New YorkPerformance Overview as of September 30, 2021Prepared by State Street
10

$101.2B Under ManagementPortfolio Asset Allocation – Deflation Protection : September 30, 2021
Asset Allocation
-1.5% -0.5% -0.5%
0.9%0.0%
0.3%
-8.00%-6.00%-4.00%-2.00%0.00%2.00%4.00%6.00%8.00%
10.00%
Relative Mix to Adjusted Policy Weights
US Government Treasuries Mortgages Short TermCore Fixed Income-Emerging ManagersCore Fixed Income-Developing Managers
Teachers’ Retirement System of the City of New YorkPerformance Overview as of September 30, 2021Prepared by State Street
$14.514.3%$5.7
5.6%
$5.75.6%
$0.90.9%
$0.00.0%
$0.30.3%
Investment Grade Corporate
11
Note: On September 30, 2021 TRS' combined Fixed Income and Cash portfolioshave a duration of 5.9 years. The duration of the Barclays US Aggregate Indexwas 6.7 years on that date.
Asset Allocation
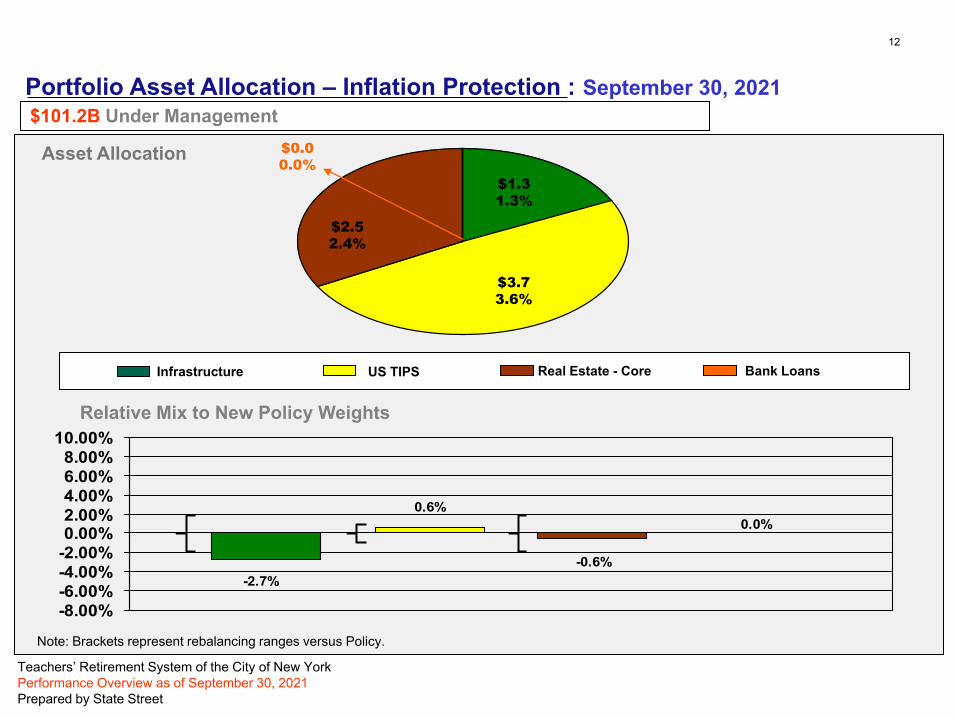
Infrastructure
$3.7 3.6%
US TIPS Real Estate - Core Bank Loans
$2.52.4%
$0.00.0%
Relative Mix to New Policy Weights
$1.31.3%
Note: Brackets represent rebalancing ranges versus Policy.
$101.2B Under Management
Teachers’ Retirement System of the City of New YorkPerformance Overview as of September 30, 2021Prepared by State Street
Portfolio Asset Allocation – Inflation Protection : September 30, 2021
-2.7%
0.6%
-0.6%
0.0%
-8.00%-6.00%-4.00%-2.00%0.00%2.00%4.00%6.00%8.00%
10.00%
12

Asset Allocation
Note: Brackets represent rebalancing ranges versus Policy.
$101.2B Under Management
Infrastructure
0.0%-0.1%
0.0% 0.0%
-8.00%-6.00%-4.00%-2.00%0.00%2.00%4.00%6.00%8.00%
10.00%
US TIPS Real Estate - Core Bank Loans
Relative Mix to Adjusted Policy Weights
Teachers’ Retirement System of the City of New YorkPerformance Overview as of September 30, 2021Prepared by State Street
Portfolio Asset Allocation – Inflation Protection : September 30, 2021
$3.7 3.6%
$2.52.4%
$1.31.3%
$0.00.0%
Note: On September 30, 2021 TRS' combined Fixed Income and Cash portfolioshave a duration of 5.9 years. The duration of the Barclays US Aggregate Indexwas 6.7 years on that date.
13
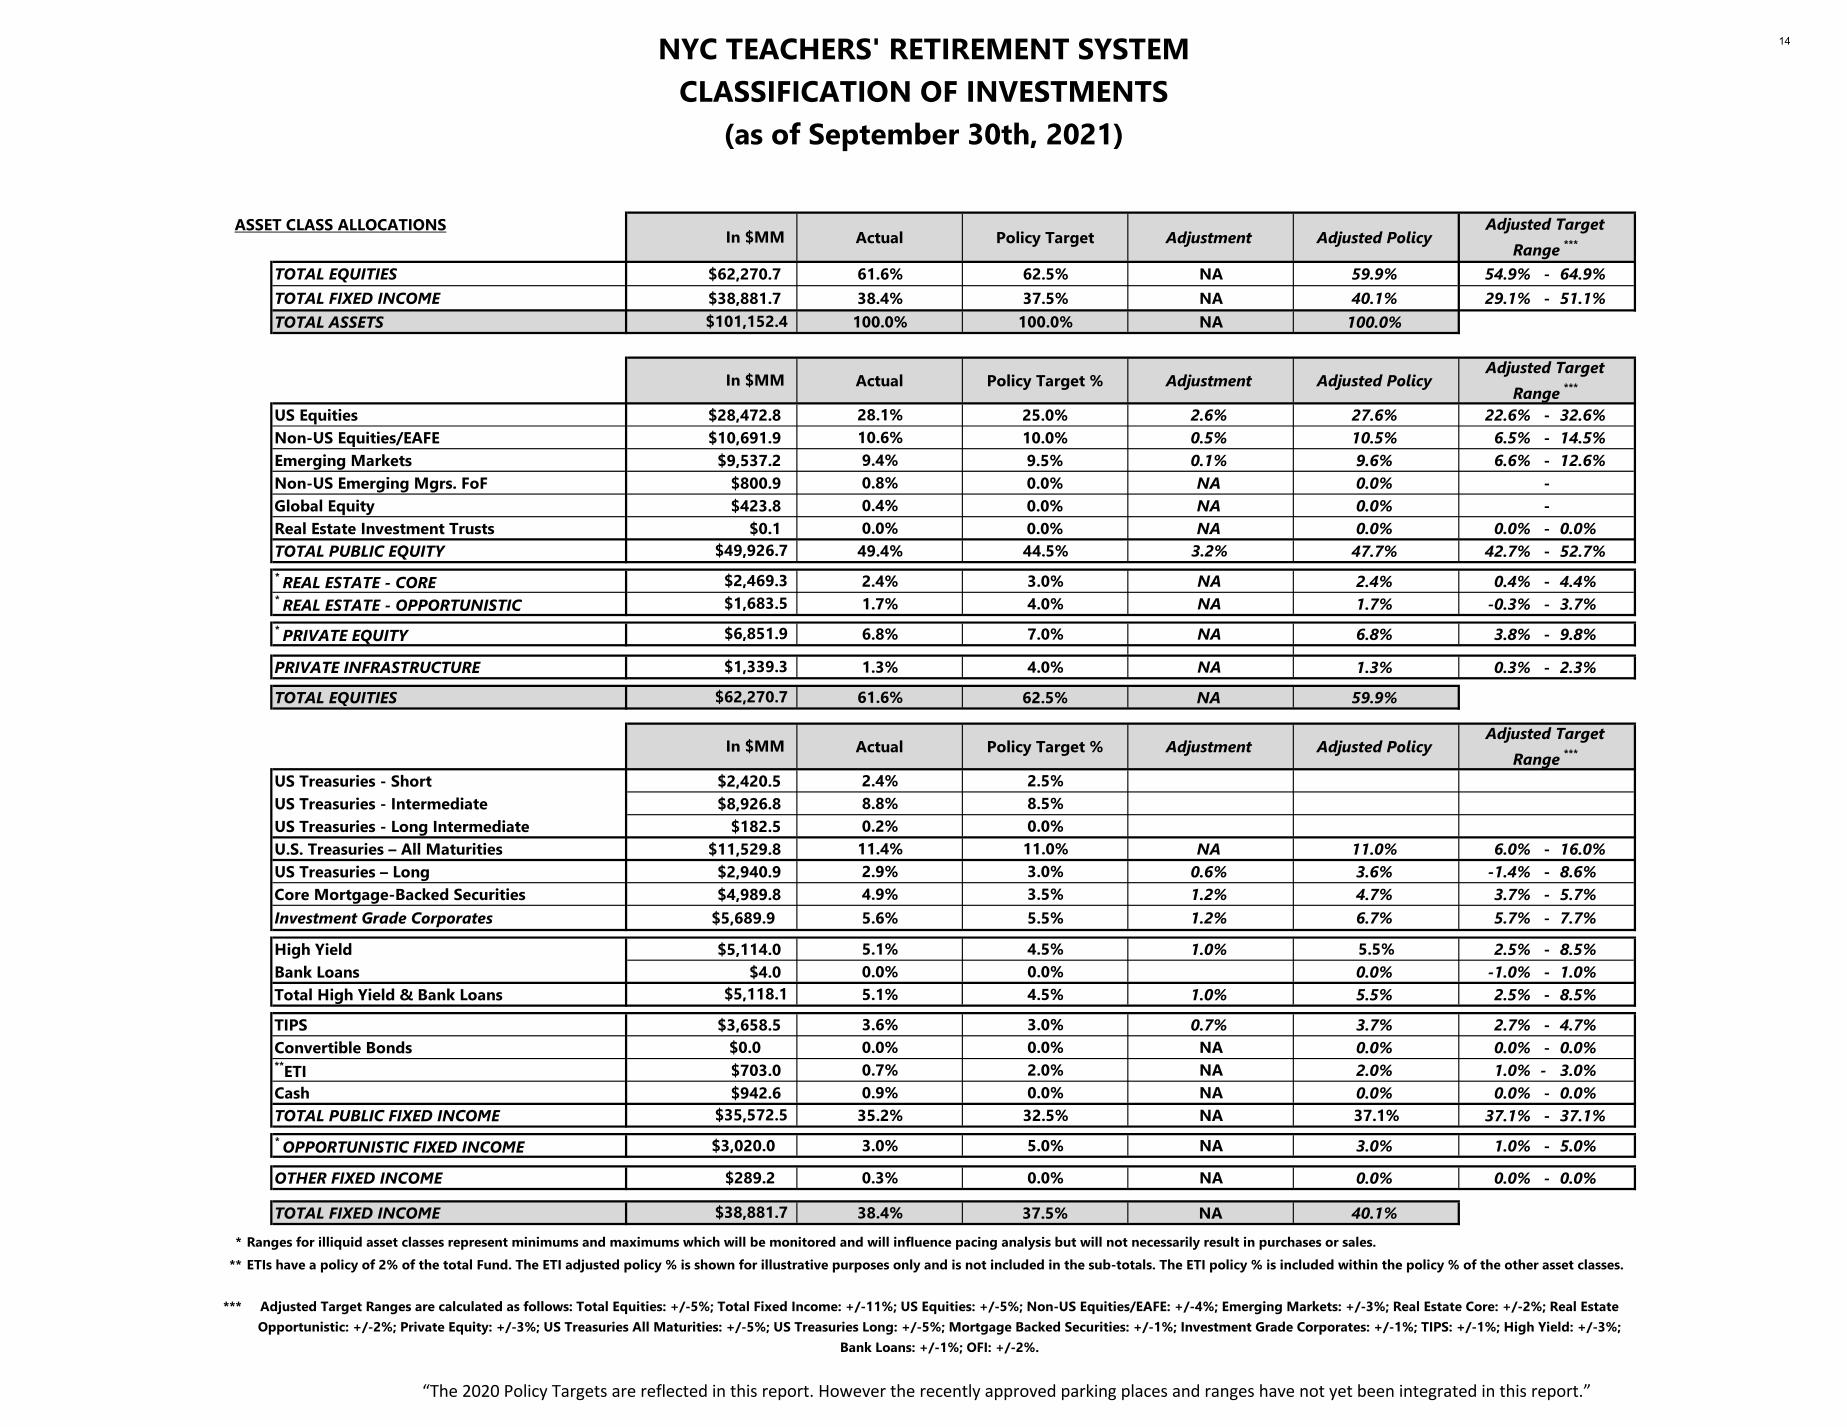
NYC TEACHERS' RETIREMENT SYSTEMCLASSIFICATION OF INVESTMENTS
(as of September 30th, 2021)
ASSET CLASS ALLOCATIONSActual Policy Target Adjustment Adjusted Policy
TOTAL EQUITIES $62,270.7 61.6% 62.5% NA 59.9% 54.9% - 64.9%TOTAL FIXED INCOME $38,881.7 38.4% 37.5% NA 40.1% 29.1% - 51.1%TOTAL ASSETS 100.0% 100.0% NA 100.0%
Actual Policy Target % Adjustment Adjusted Policy
US Equities $28,472.8 28.1% 25.0% 2.6% 27.6% 22.6% - 32.6%Non-US Equities/EAFE $10,691.9 10.6% 10.0% 0.5% 10.5% 6.5% - 14.5%Emerging Markets $9,537.2 9.4% 9.5% 0.1% 9.6% 6.6% - 12.6%Non-US Emerging Mgrs. FoF $800.9 0.8% 0.0% NA 0.0% -Global Equity $423.8 0.4% 0.0% NA 0.0% -Real Estate Investment Trusts $0.1 0.0% 0.0% NA 0.0% 0.0% - 0.0%TOTAL PUBLIC EQUITY 49.4% 44.5% 3.2% 47.7% 42.7% - 52.7%* REAL ESTATE - CORE 2.4% 3.0% NA 2.4% 0.4% - 4.4%* REAL ESTATE - OPPORTUNISTIC 1.7% 4.0% NA 1.7% -0.3% - 3.7%* PRIVATE EQUITY 6.8% 7.0% NA 6.8% 3.8% - 9.8%
PRIVATE INFRASTRUCTURE 1.3% 4.0% NA 1.3% 0.3% - 2.3%
TOTAL EQUITIES 61.6% 62.5% NA 59.9%
Actual Policy Target % Adjustment Adjusted Policy
US Treasuries - Short $2,420.5 2.4% 2.5%US Treasuries - Intermediate $8,926.8 8.8% 8.5%US Treasuries - Long Intermediate $182.5 0.2% 0.0%U.S. Treasuries – All Maturities $11,529.8 11.4% 11.0% NA 11.0% 6.0% - 16.0%US Treasuries – Long $2,940.9 2.9% 3.0% 0.6% 3.6% -1.4% - 8.6%Core Mortgage-Backed Securities $4,989.8 4.9% 3.5% 1.2% 4.7% 3.7% - 5.7%Investment Grade Corporates $5,689.9 5.6% 5.5% 1.2% 6.7% 5.7% - 7.7%
High Yield $5,114.0 5.1% 4.5% 1.0% 5.5% 2.5% - 8.5%Bank Loans $4.0 0.0% 0.0% 0.0% -1.0% - 1.0%Total High Yield & Bank Loans 5.1% 4.5% 1.0% 5.5% 2.5% - 8.5%
TIPS $3,658.5 3.6% 3.0% 0.7% 3.7% 2.7% - 4.7%Convertible Bonds $0.0 0.0% 0.0% NA 0.0% 0.0% - 0.0%**ETI $703.0 0.7% 2.0% NA 2.0% 1.0% - 3.0%Cash $942.6 0.9% 0.0% NA 0.0% 0.0% - 0.0%TOTAL PUBLIC FIXED INCOME 35.2% 32.5% NA 37.1% 37.1% - 37.1%* OPPORTUNISTIC FIXED INCOME $3,020.0 3.0% 5.0% NA 3.0% 1.0% - 5.0%
OTHER FIXED INCOME $289.2 0.3% 0.0% NA 0.0% 0.0% - 0.0%
TOTAL FIXED INCOME 38.4% 37.5% NA 40.1%
***
***
$5,118.1
$35,572.5
$38,881.7
Ranges for illiquid asset classes represent minimums and maximums which will be monitored and will influence pacing analysis but will not necessarily result in purchases or sales.ETIs have a policy of 2% of the total Fund. The ETI adjusted policy % is shown for illustrative purposes only and is not included in the sub-totals. The ETI policy % is included within the policy % of the other asset classes.
Adjusted Target Ranges are calculated as follows: Total Equities: +/-5%; Total Fixed Income: +/-11%; US Equities: +/-5%; Non-US Equities/EAFE: +/-4%; Emerging Markets: +/-3%; Real Estate Core: +/-2%; Real Estate Opportunistic: +/-2%; Private Equity: +/-3%; US Treasuries All Maturities: +/-5%; US Treasuries Long: +/-5%; Mortgage Backed Securities: +/-1%; Investment Grade Corporates: +/-1%; TIPS: +/-1%; High Yield: +/-3%;
Bank Loans: +/-1%; OFI: +/-2%.
$62,270.7
In $MM
In $MM Adjusted Target
Range ***
$101,152.4
In $MM Adjusted Target
Range ***
$49,926.7
$2,469.3$1,683.5
$6,851.9
$1,339.3
Adjusted Target Range ***
14
“The 2020 Policy Targets are reflected in this report. However the recently approved parking places and ranges have not yet been integrated in this report.”

NYC TEACHERS' RETIREMENT SYSTEMCLASSIFICATION OF INVESTMENTS
(as of September 30th, 2021)
Adjustments to Long-Term Asset Allocation
1) Private Equity
2) Real Estate Core
3) Real Estate Opportunistic
4) Infrastructure
5) Opportunistic Fixed Income
Impact of Adjustments
1) U.S. Treasuries - Long 3.0%Adjustment: 12% of uninvested Real Estate Core 0.1%Adjustment: 8% of uninvested Real Estate Opportunistic 0.2%Adjustment: 5% of uninvested Private Infrastructure 0.1%Adjustment: 10% of uninvested Opportunistic Fixed Income 0.2%Total U.S. Treasuries - Long 3.6%
2) Investment Grade Corporates 5.5%Adjustment: 24% of uninvested Real Estate Core 0.1%Adjustment: 16% of uninvested Real Estate Opportunistic 0.4%Adjustment: 10% of uninvested Private Infrastructure 0.3%Adjustment: 20% of uninvested Opportunistic Fixed Income 0.4%Total - Investment Grade Corporates 6.7%
3) Core Mortgage-Backed Securities 3.5%Adjustment: 24% of uninvested Real Estate Core 0.1%Adjustment: 16% of uninvested Real Estate Opportunistic 0.4%Adjustment: 10% of uninvested Private Infrastructure 0.3%Adjustment: 20% of uninvested Opportunistic Fixed Income 0.4%Total Core Mortgage-Backed Securities 4.7%
27% of uninvested commitments will be invested in US Equity, 18% of uninvested commitments will be invested in Developed Ex-US Equity, 5% of uninvested commitments will be invested inEmerging Markets Equity, 5% of uninvested commitments will be invested in US Treasuries, 10% of uninvested commitments will be invested in Investment Grade Corporates, 10% of uninvestedcommitments will be invested in Mortgage Backed Securities, and 25% of uninvested commitments will be invested in TIPS.
10% of uninvested commitments will be invested in US Treasuries, 20% of uninvested commitments will be invested in Investment Grade Corporates, 20% of uninvested commitments will beinvested in Mortgages Backed Securities, and 50% of uninvested commitments will be invested in High Yield.
100% of uninvested commitments will be invested in Domestic Equity.
40% of uninvested commitments will be invested in US Equity, 12% of uninvested commitments will be invested in US Treasuries, 24% of uninvested commitments will be invested in InvestmentGrade Corporates, and 24% of uninvested commitments will be invested in Mortgage Backed Securities.
60% of uninvested commitments will be invested in US Equity, 8% of uninvested commitments will be invested in US Treasuries, 16% of uninvested commitments will be invested in InvestmentGrade Corporates, and 16% of uninvested commitments will be invested in Mortgage Backed Securities.
15
“The 2020 Policy Targets are reflected in this report. However the recently approved parking places and ranges have not yet been integrated in this report.”

NYC TEACHERS' RETIREMENT SYSTEMCLASSIFICATION OF INVESTMENTS
(as of September 30th, 2021)
4) Treasury Inflation Protected Securities 3.0%Adjustment: 25% of uninvested Private Infrastructure 0.7%Total Treasury Inflation Protected Securities 3.7%
5) High Yield Securities 4.5%Adjustment: 50% of uninvested Opportunistic Fixed Income 1.0%Adjustment: ** Existing Convertibles holdings to be placeholder for HY SecuritiesTotal High Yield Securities 5.5%
6) Domestic Equity 25.0%Adjustment: 100% of uninvested Private Equity 0.2%Adjustment: 60% of uninvested Real Estate Opportunistic 1.4%Adjustment: 27% of uninvested Private Infrastructure 0.7%Adjustment: 40% of uninvested of uninvested Real Estate Core 0.2%Total Domestic Equity 27.6%
7) Non-U.S. Equity - Developed Markets 10.0%Adjustment: 18% of uninvested Private Infrastructure 0.5%Total Non-U.S. Equity - Developed Markets 10.5%
8) Non-U.S. Equity - Emerging Markets 9.5%Adjustment: 5% of uninvested Private Infrastructure 0.1%Total Non-U.S. Equity - Emerging Markets 9.6%
16
“The 2020 Policy Targets are reflected in this report. However the recently approved parking places and ranges have not yet been integrated in this report.”

NYC TEACHERS' RETIREMENT SYSTEMCLASSIFICATION OF INVESTMENTS
(as of September 30th, 2021)
Note: Totals may not equal 100% due to rounding
US Equities57%
Non-US Equities/EAFE
21%
Emerging Markets
19%
Non-US Emerging Mgrs.
FoF2%
Global Equity1%
Real Estate Investment
Trusts0%
Total Public Equities
US Treasuries -Short
6%
US Treasuries -Intermediate
23% US Treasuries - Long
Intermediate 0%
US Treasuries –Long 8%
Core Mortgage-Backed Securities
13%
Investment Grade Corporates
15%
High Yield13%
Bank Loans…
TIPS9%
Convertible Bonds0%
**ETI2%
Cash2%
*OPPORTUNISTIC FIXED INCOME
8%
OTHER FIXED INCOME
1%
Total Fixed Income
17
“The 2020 Policy Targets are reflected in this report. However the recently approved parking places and ranges have not yet been integrated in this report.”

$85,681
$91,426 $94,280
$94,498 $95,379$96,189
$99,172 $100,387 101,090
$102,194 $103,711
$101,152
$80,000 $81,500 $83,000 $84,500 $86,000 $87,500 $89,000 $90,500 $92,000 $93,500 $95,000 $96,500 $98,000 $99,500
$101,000 $102,500 $104,000 $105,500
TEACHERS - MARKET VALUESOCTOBER 2020 - SEPTEMBER 2021
18

$44,083
$49,201 $58,257 $60,111 $61,649
$65,965
$71,973 $77,754
$81,231
$101,090 $101,152
$25,000 $29,000 $33,000 $37,000 $41,000 $45,000 $49,000 $53,000 $57,000 $61,000 $65,000 $69,000 $73,000 $77,000 $81,000 $85,000 $89,000 $93,000 $97,000
$101,000 $105,000 $109,000
TEACHERS - MARKET VALUES2012 - 2021
THE 10 YEAR RETURN FOR TEACHERS' MV AS OF SEPTEMBER 30, 2021 IS 10.45%.
19
Assets
($MM)
%
of Total
Trailing
1 Month
Trailing
3 Month FYTD CYTD
FYE
6/30/21
FYE
6/30/20
CYE
12/31/19
CYE
12/31/18
Trailing
1 Year
Trailing
3 Year
Inception
Date
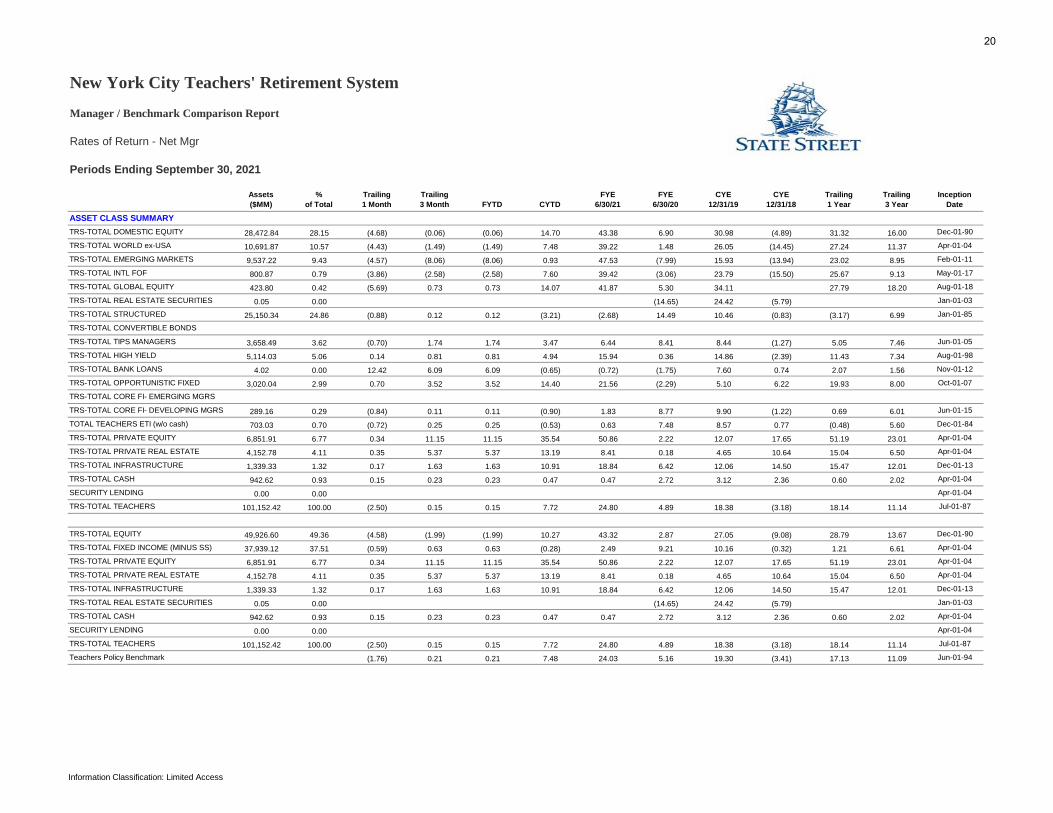
ASSET CLASS SUMMARY
TRS-TOTAL DOMESTIC EQUITY 28,472.84 28.15 (4.68) (0.06) (0.06) 14.70 43.38 6.90 30.98 (4.89) 31.32 16.00 Dec-01-90
TRS-TOTAL WORLD ex-USA 10,691.87 10.57 (4.43) (1.49) (1.49) 7.48 39.22 1.48 26.05 (14.45) 27.24 11.37 Apr-01-04
TRS-TOTAL EMERGING MARKETS 9,537.22 9.43 (4.57) (8.06) (8.06) 0.93 47.53 (7.99) 15.93 (13.94) 23.02 8.95 Feb-01-11
TRS-TOTAL INTL FOF 800.87 0.79 (3.86) (2.58) (2.58) 7.60 39.42 (3.06) 23.79 (15.50) 25.67 9.13 May-01-17
TRS-TOTAL GLOBAL EQUITY 423.80 0.42 (5.69) 0.73 0.73 14.07 41.87 5.30 34.11 27.79 18.20 Aug-01-18
TRS-TOTAL REAL ESTATE SECURITIES 0.05 0.00 (14.65) 24.42 (5.79) Jan-01-03
TRS-TOTAL STRUCTURED 25,150.34 24.86 (0.88) 0.12 0.12 (3.21) (2.68) 14.49 10.46 (0.83) (3.17) 6.99 Jan-01-85
TRS-TOTAL CONVERTIBLE BONDS
TRS-TOTAL TIPS MANAGERS 3,658.49 3.62 (0.70) 1.74 1.74 3.47 6.44 8.41 8.44 (1.27) 5.05 7.46 Jun-01-05
TRS-TOTAL HIGH YIELD 5,114.03 5.06 0.14 0.81 0.81 4.94 15.94 0.36 14.86 (2.39) 11.43 7.34 Aug-01-98
TRS-TOTAL BANK LOANS 4.02 0.00 12.42 6.09 6.09 (0.65) (0.72) (1.75) 7.60 0.74 2.07 1.56 Nov-01-12
TRS-TOTAL OPPORTUNISTIC FIXED 3,020.04 2.99 0.70 3.52 3.52 14.40 21.56 (2.29) 5.10 6.22 19.93 8.00 Oct-01-07
TRS-TOTAL CORE FI- EMERGING MGRS
TRS-TOTAL CORE FI- DEVELOPING MGRS 289.16 0.29 (0.84) 0.11 0.11 (0.90) 1.83 8.77 9.90 (1.22) 0.69 6.01 Jun-01-15
TOTAL TEACHERS ETI (w/o cash) 703.03 0.70 (0.72) 0.25 0.25 (0.53) 0.63 7.48 8.57 0.77 (0.48) 5.60 Dec-01-84
TRS-TOTAL PRIVATE EQUITY 6,851.91 6.77 0.34 11.15 11.15 35.54 50.86 2.22 12.07 17.65 51.19 23.01 Apr-01-04
TRS-TOTAL PRIVATE REAL ESTATE 4,152.78 4.11 0.35 5.37 5.37 13.19 8.41 0.18 4.65 10.64 15.04 6.50 Apr-01-04
TRS-TOTAL INFRASTRUCTURE 1,339.33 1.32 0.17 1.63 1.63 10.91 18.84 6.42 12.06 14.50 15.47 12.01 Dec-01-13
TRS-TOTAL CASH 942.62 0.93 0.15 0.23 0.23 0.47 0.47 2.72 3.12 2.36 0.60 2.02 Apr-01-04
SECURITY LENDING 0.00 0.00 Apr-01-04
TRS-TOTAL TEACHERS 101,152.42 100.00 (2.50) 0.15 0.15 7.72 24.80 4.89 18.38 (3.18) 18.14 11.14 Jul-01-87
TRS-TOTAL EQUITY 49,926.60 49.36 (4.58) (1.99) (1.99) 10.27 43.32 2.87 27.05 (9.08) 28.79 13.67 Dec-01-90
TRS-TOTAL FIXED INCOME (MINUS SS) 37,939.12 37.51 (0.59) 0.63 0.63 (0.28) 2.49 9.21 10.16 (0.32) 1.21 6.61 Apr-01-04
TRS-TOTAL PRIVATE EQUITY 6,851.91 6.77 0.34 11.15 11.15 35.54 50.86 2.22 12.07 17.65 51.19 23.01 Apr-01-04
TRS-TOTAL PRIVATE REAL ESTATE 4,152.78 4.11 0.35 5.37 5.37 13.19 8.41 0.18 4.65 10.64 15.04 6.50 Apr-01-04
TRS-TOTAL INFRASTRUCTURE 1,339.33 1.32 0.17 1.63 1.63 10.91 18.84 6.42 12.06 14.50 15.47 12.01 Dec-01-13
TRS-TOTAL REAL ESTATE SECURITIES 0.05 0.00 (14.65) 24.42 (5.79) Jan-01-03
TRS-TOTAL CASH 942.62 0.93 0.15 0.23 0.23 0.47 0.47 2.72 3.12 2.36 0.60 2.02 Apr-01-04
SECURITY LENDING 0.00 0.00 Apr-01-04
TRS-TOTAL TEACHERS 101,152.42 100.00 (2.50) 0.15 0.15 7.72 24.80 4.89 18.38 (3.18) 18.14 11.14 Jul-01-87
Teachers Policy Benchmark (1.76) 0.21 0.21 7.48 24.03 5.16 19.30 (3.41) 17.13 11.09 Jun-01-94
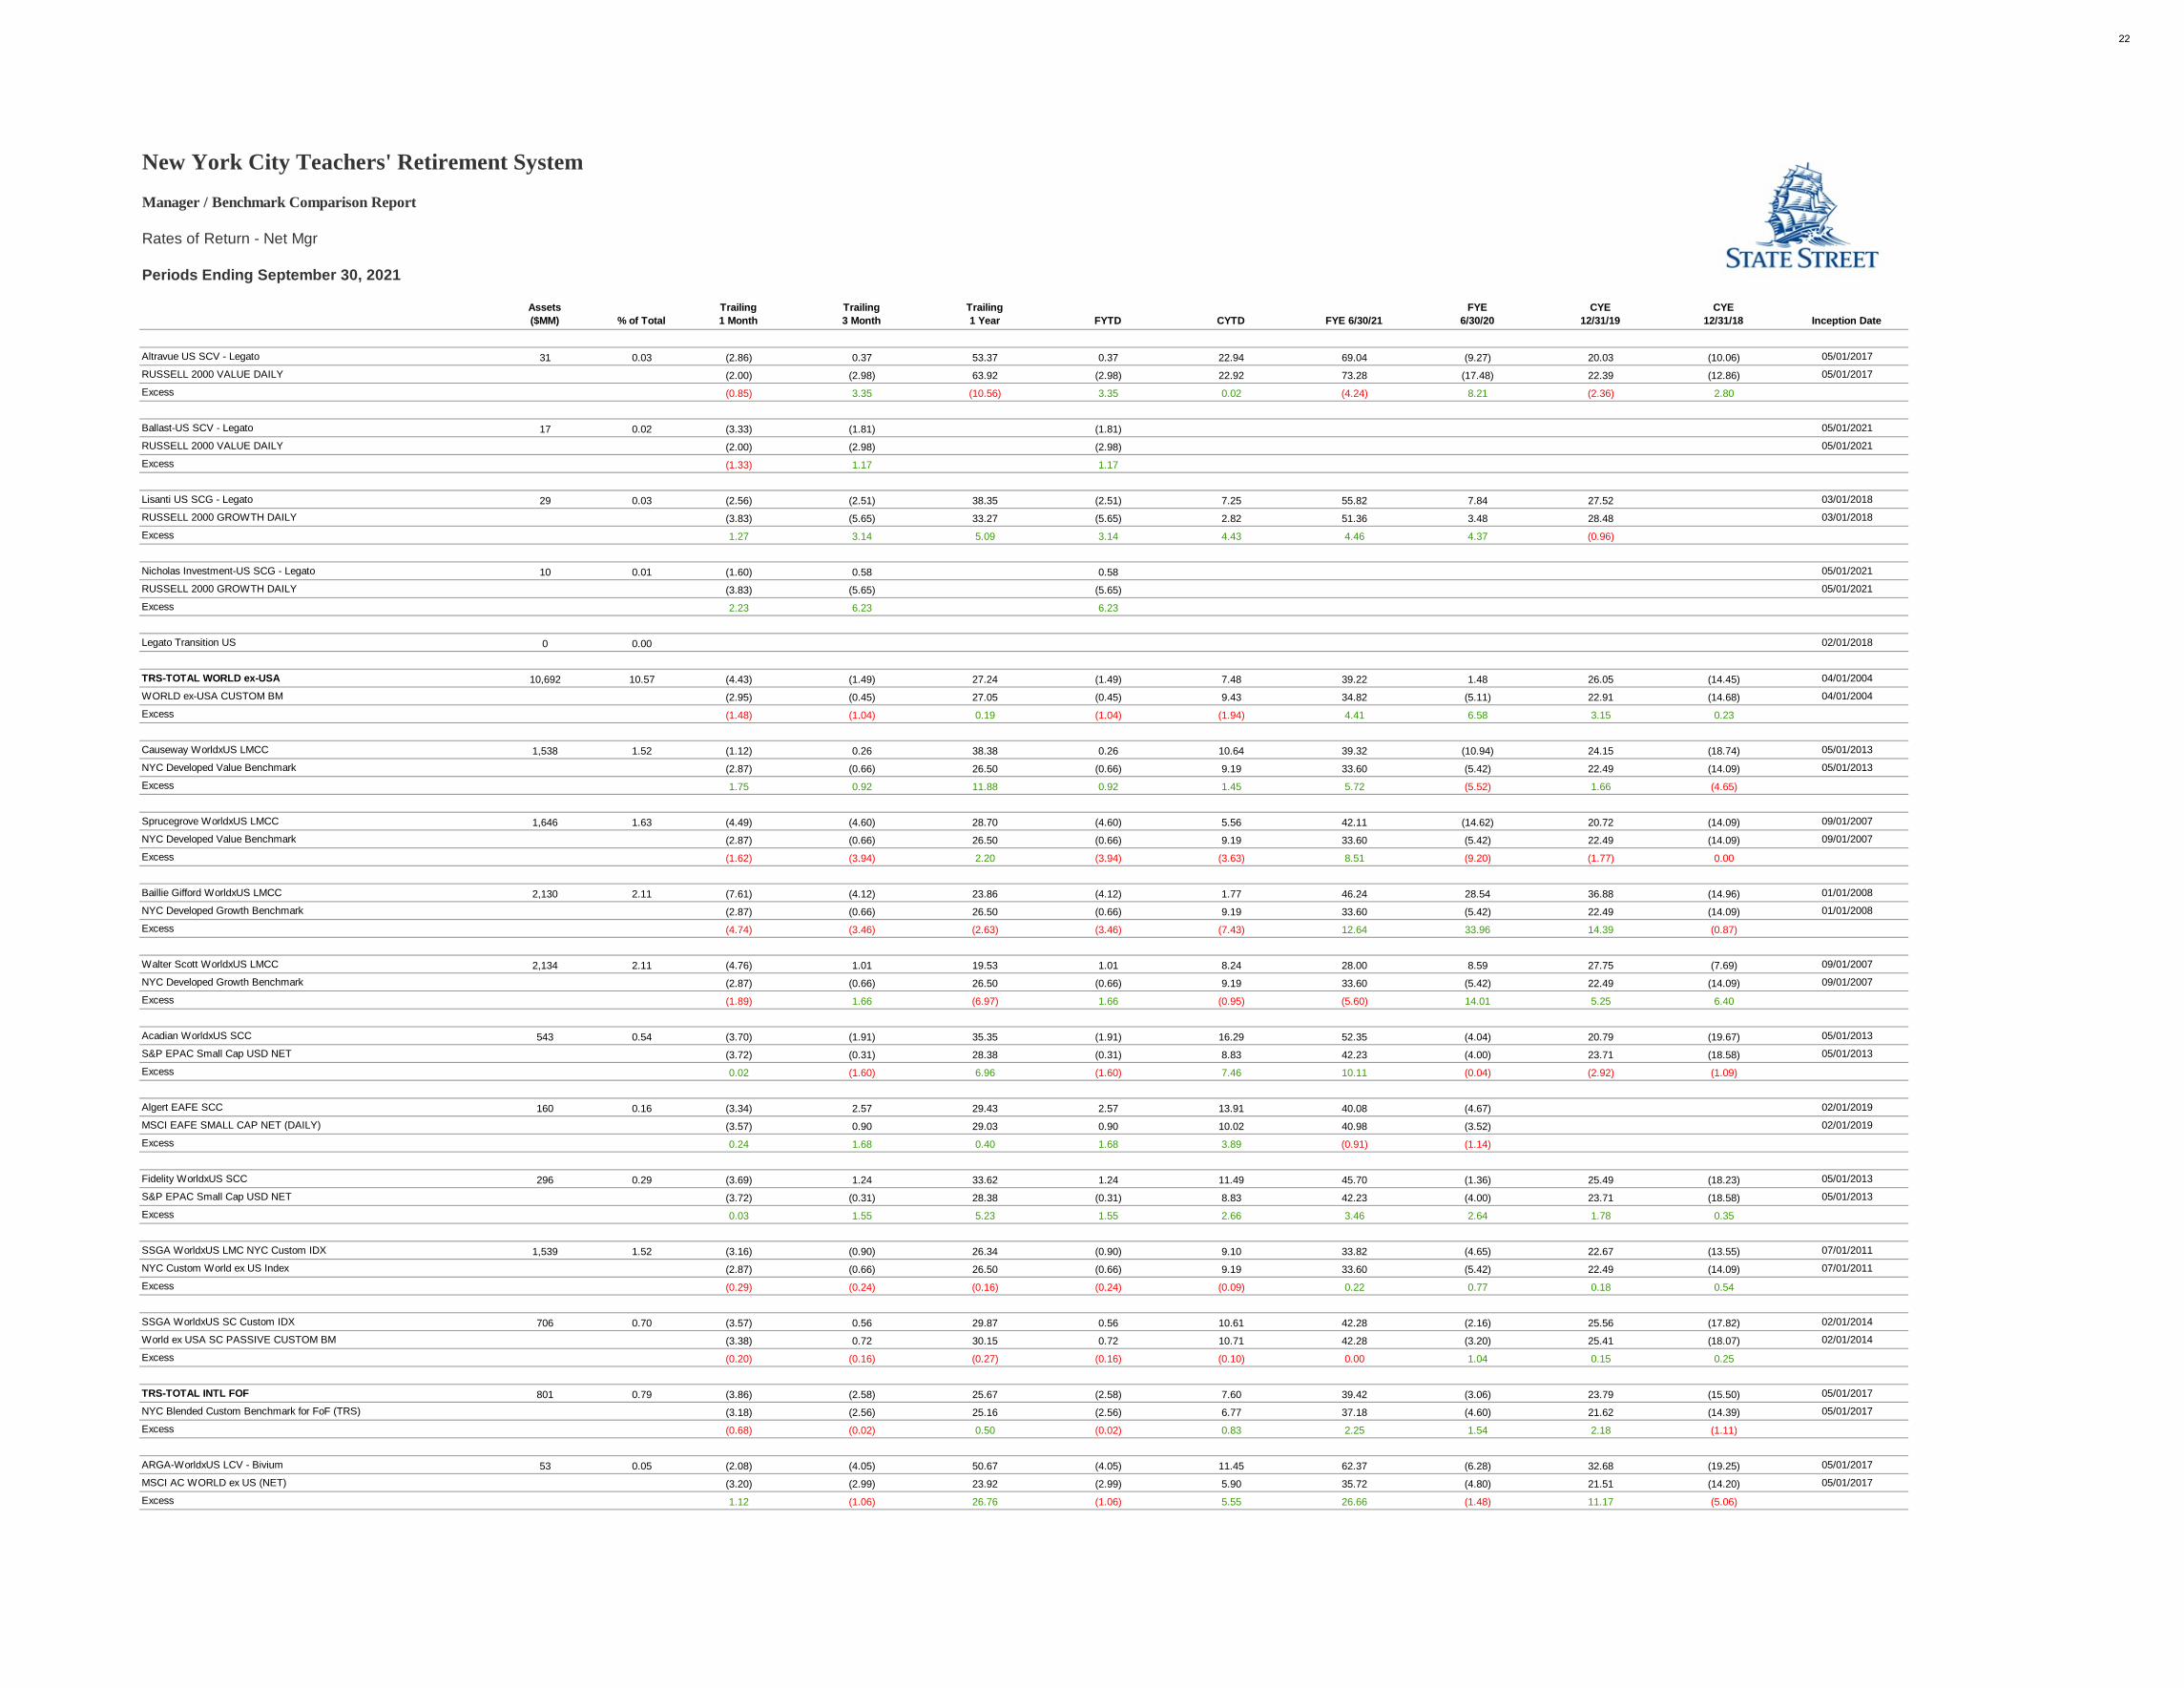
New York City Teachers' Retirement System
Manager / Benchmark Comparison Report
Rates of Return - Net Mgr
Periods Ending September 30, 2021
Information Classification: Limited Access
20

Assets
($MM) % of Total
Trailing
1 Month
Trailing
3 Month
Trailing
1 Year FYTD CYTD FYE 6/30/21
FYE
6/30/20
CYE
12/31/19
CYE
12/31/18 Inception Date
ASSET CLASS SUMMARY
TRS-TOTAL TEACHERS 101,152 100.00 (2.50) 0.15 18.14 0.15 7.72 24.80 4.89 18.38 (3.18) 07/01/1987
Teachers Policy Benchmark (1.76) 0.21 17.13 0.21 7.48 24.03 5.16 19.30 (3.41) 07/01/1987
Excess (0.73) (0.06) 1.02 (0.06) 0.24 0.77 (0.28) (0.93) 0.23
TRS-TOTAL EQUITY (INCL ALTS + REITS) 62,271 61.56 (3.65) (0.16) 29.83 (0.16) 12.79 40.88 2.23 23.74 (5.40) 04/01/2004
TRS-TOTAL FIXED INCOME 38,880 38.44 (0.58) 0.62 1.16 0.62 (0.20) 2.39 9.05 10.04 (0.28) 02/01/1980
EQUITY SUMMARY
TRS-TOTAL DOMESTIC EQUITY 28,473 28.15 (4.68) (0.06) 31.32 (0.06) 14.70 43.38 6.90 30.98 (4.89) 12/01/1990
RUSSELL 3000 (DAILY) (4.49) (0.10) 31.88 (0.10) 14.99 44.16 6.53 31.02 (5.24) 12/01/1990
Excess (0.19) 0.05 (0.55) 0.05 (0.29) (0.78) 0.37 (0.04) 0.35
BlackRock US SCG R2000 43 0.04 (3.99) (5.60) 34.10 (5.60) 3.49 52.26 3.34 28.70 (9.26) 10/01/2013
RUSSELL 2000 GROWTH DAILY (3.83) (5.65) 33.27 (5.65) 2.82 51.36 3.48 28.48 (9.31) 10/01/2013
Excess (0.16) 0.05 0.84 0.05 0.67 0.90 (0.13) 0.22 0.05
BlackRock US SCV R2000 489 0.48 (2.59) (3.50) 63.09 (3.50) 22.18 73.45 (17.27) 22.73 (12.74) 10/01/2013
RUSSELL 2000 VALUE DAILY (2.00) (2.98) 63.92 (2.98) 22.92 73.28 (17.48) 22.39 (12.86) 10/01/2013
Excess (0.59) (0.51) (0.83) (0.51) (0.74) 0.17 0.21 0.34 0.13
Cooke and Bieler-US SCV 137 0.14 (3.45) (3.89) 46.03 (3.89) 12.71 53.08 01/01/2020
RUSSELL 2000 VALUE DAILY (2.00) (2.98) 63.92 (2.98) 22.92 73.28 01/01/2020
Excess (1.45) (0.90) (17.89) (0.90) (10.21) (20.20)
T Rowe Price-US SCV 141 0.14 (1.99) (0.03) 49.94 (0.03) 16.44 55.10 02/01/2020
RUSSELL 2000 VALUE DAILY (2.00) (2.98) 63.92 (2.98) 22.92 73.28 02/01/2020
Excess 0.01 2.95 (13.98) 2.95 (6.48) (18.18)
PanAgora-US SCC 279 0.28 (1.19) (2.12) 45.98 (2.12) 15.25 56.84 02/01/2020
RUSSELL 2000 (DAILY) (2.95) (4.36) 47.68 (4.36) 12.41 62.03 02/01/2020
Excess 1.76 2.24 (1.70) 2.24 2.83 (5.18)
Brown Asset Mgmt US SCG 758 0.75 (5.28) (1.80) 14.01 (1.80) (4.74) 22.17 16.68 30.13 1.18 05/01/2009
RUSSELL 2000 GROWTH DAILY (3.83) (5.65) 33.27 (5.65) 2.82 51.36 3.48 28.48 (9.31) 05/01/2009
Excess (1.44) 3.86 (19.26) 3.86 (7.57) (29.19) 13.20 1.64 10.49
BlackRock US LMC R1000 Core 26,452 26.15 (4.77) 0.12 30.97 0.12 15.17 43.18 7.55 31.38 04/01/2018
RUSSELL 1000 (DAILY) (4.59) 0.21 30.96 0.21 15.19 43.07 7.48 31.43 04/01/2018
Excess (0.17) (0.08) 0.00 (0.08) (0.02) 0.11 0.07 (0.05)
FUND OF FUNDS
Essex US SCG - Legato 26 0.03 (3.20) (4.75) 65.06 (4.75) 27.04 93.76 (7.10) 26.80 (5.16) 05/01/2017
RUSSELL 2000 GROWTH DAILY (3.83) (5.65) 33.27 (5.65) 2.82 51.36 3.48 28.48 (9.31) 05/01/2017
Excess 0.64 0.90 31.79 0.90 24.21 42.40 (10.58) (1.68) 4.14
Dean US SCV - Legato 39 0.04 (1.86) (0.19) 57.87 (0.19) 23.39 62.66 (19.33) 21.87 (12.49) 05/01/2017
RUSSELL 2000 VALUE DAILY (2.00) (2.98) 63.92 (2.98) 22.92 73.28 (17.48) 22.39 (12.86) 05/01/2017
Excess 0.15 2.79 (6.05) 2.79 0.47 (10.62) (1.85) (0.52) 0.37
Bridge City US SCG - Legato 20 0.02 (4.98) (4.61) 40.37 (4.61) 11.66 55.12 (1.93) 24.49 0.88 05/01/2017
RUSSELL 2000 GROWTH DAILY (3.83) (5.65) 33.27 (5.65) 2.82 51.36 3.48 28.48 (9.31) 05/01/2017
Excess (1.15) 1.04 7.11 1.04 8.83 3.76 (5.41) (3.99) 10.19
Bowling US SCV - Legato (21.80)RUSSELL 2000 VALUE DAILY (2.00) (2.98) 63.92 (2.98) 22.92 73.28 (17.48) 22.39 (12.86)Excess (4.32)
Periods Ending September 30, 2021
New York City Teachers' Retirement SystemManager / Benchmark Comparison Report
Rates of Return - Net Mgr
21
Assets
($MM) % of Total
Trailing
1 Month
Trailing
3 Month
Trailing
1 Year FYTD CYTD FYE 6/30/21
FYE
6/30/20
CYE
12/31/19
CYE
12/31/18 Inception Date
Periods Ending September 30, 2021
New York City Teachers' Retirement SystemManager / Benchmark Comparison Report
Rates of Return - Net Mgr
Altravue US SCV - Legato 31 0.03 (2.86) 0.37 53.37 0.37 22.94 69.04 (9.27) 20.03 (10.06) 05/01/2017
RUSSELL 2000 VALUE DAILY (2.00) (2.98) 63.92 (2.98) 22.92 73.28 (17.48) 22.39 (12.86) 05/01/2017
Excess (0.85) 3.35 (10.56) 3.35 0.02 (4.24) 8.21 (2.36) 2.80
Ballast-US SCV - Legato 17 0.02 (3.33) (1.81) (1.81) 05/01/2021
RUSSELL 2000 VALUE DAILY (2.00) (2.98) (2.98) 05/01/2021
Excess (1.33) 1.17 1.17
Lisanti US SCG - Legato 29 0.03 (2.56) (2.51) 38.35 (2.51) 7.25 55.82 7.84 27.52 03/01/2018
RUSSELL 2000 GROWTH DAILY (3.83) (5.65) 33.27 (5.65) 2.82 51.36 3.48 28.48 03/01/2018
Excess 1.27 3.14 5.09 3.14 4.43 4.46 4.37 (0.96)
Nicholas Investment-US SCG - Legato 10 0.01 (1.60) 0.58 0.58 05/01/2021
RUSSELL 2000 GROWTH DAILY (3.83) (5.65) (5.65) 05/01/2021
Excess 2.23 6.23 6.23
Legato Transition US 0 0.00 02/01/2018
TRS-TOTAL WORLD ex-USA 10,692 10.57 (4.43) (1.49) 27.24 (1.49) 7.48 39.22 1.48 26.05 (14.45) 04/01/2004
WORLD ex-USA CUSTOM BM (2.95) (0.45) 27.05 (0.45) 9.43 34.82 (5.11) 22.91 (14.68) 04/01/2004
Excess (1.48) (1.04) 0.19 (1.04) (1.94) 4.41 6.58 3.15 0.23
Causeway WorldxUS LMCC 1,538 1.52 (1.12) 0.26 38.38 0.26 10.64 39.32 (10.94) 24.15 (18.74) 05/01/2013
NYC Developed Value Benchmark (2.87) (0.66) 26.50 (0.66) 9.19 33.60 (5.42) 22.49 (14.09) 05/01/2013
Excess 1.75 0.92 11.88 0.92 1.45 5.72 (5.52) 1.66 (4.65)
Sprucegrove WorldxUS LMCC 1,646 1.63 (4.49) (4.60) 28.70 (4.60) 5.56 42.11 (14.62) 20.72 (14.09) 09/01/2007
NYC Developed Value Benchmark (2.87) (0.66) 26.50 (0.66) 9.19 33.60 (5.42) 22.49 (14.09) 09/01/2007
Excess (1.62) (3.94) 2.20 (3.94) (3.63) 8.51 (9.20) (1.77) 0.00
Baillie Gifford WorldxUS LMCC 2,130 2.11 (7.61) (4.12) 23.86 (4.12) 1.77 46.24 28.54 36.88 (14.96) 01/01/2008
NYC Developed Growth Benchmark (2.87) (0.66) 26.50 (0.66) 9.19 33.60 (5.42) 22.49 (14.09) 01/01/2008
Excess (4.74) (3.46) (2.63) (3.46) (7.43) 12.64 33.96 14.39 (0.87)
Walter Scott WorldxUS LMCC 2,134 2.11 (4.76) 1.01 19.53 1.01 8.24 28.00 8.59 27.75 (7.69) 09/01/2007
NYC Developed Growth Benchmark (2.87) (0.66) 26.50 (0.66) 9.19 33.60 (5.42) 22.49 (14.09) 09/01/2007
Excess (1.89) 1.66 (6.97) 1.66 (0.95) (5.60) 14.01 5.25 6.40
Acadian WorldxUS SCC 543 0.54 (3.70) (1.91) 35.35 (1.91) 16.29 52.35 (4.04) 20.79 (19.67) 05/01/2013
S&P EPAC Small Cap USD NET (3.72) (0.31) 28.38 (0.31) 8.83 42.23 (4.00) 23.71 (18.58) 05/01/2013
Excess 0.02 (1.60) 6.96 (1.60) 7.46 10.11 (0.04) (2.92) (1.09)
Algert EAFE SCC 160 0.16 (3.34) 2.57 29.43 2.57 13.91 40.08 (4.67) 02/01/2019
MSCI EAFE SMALL CAP NET (DAILY) (3.57) 0.90 29.03 0.90 10.02 40.98 (3.52) 02/01/2019
Excess 0.24 1.68 0.40 1.68 3.89 (0.91) (1.14)
Fidelity WorldxUS SCC 296 0.29 (3.69) 1.24 33.62 1.24 11.49 45.70 (1.36) 25.49 (18.23) 05/01/2013
S&P EPAC Small Cap USD NET (3.72) (0.31) 28.38 (0.31) 8.83 42.23 (4.00) 23.71 (18.58) 05/01/2013
Excess 0.03 1.55 5.23 1.55 2.66 3.46 2.64 1.78 0.35
SSGA WorldxUS LMC NYC Custom IDX 1,539 1.52 (3.16) (0.90) 26.34 (0.90) 9.10 33.82 (4.65) 22.67 (13.55) 07/01/2011
NYC Custom World ex US Index (2.87) (0.66) 26.50 (0.66) 9.19 33.60 (5.42) 22.49 (14.09) 07/01/2011
Excess (0.29) (0.24) (0.16) (0.24) (0.09) 0.22 0.77 0.18 0.54
SSGA WorldxUS SC Custom IDX 706 0.70 (3.57) 0.56 29.87 0.56 10.61 42.28 (2.16) 25.56 (17.82) 02/01/2014
World ex USA SC PASSIVE CUSTOM BM (3.38) 0.72 30.15 0.72 10.71 42.28 (3.20) 25.41 (18.07) 02/01/2014
Excess (0.20) (0.16) (0.27) (0.16) (0.10) 0.00 1.04 0.15 0.25
TRS-TOTAL INTL FOF 801 0.79 (3.86) (2.58) 25.67 (2.58) 7.60 39.42 (3.06) 23.79 (15.50) 05/01/2017
NYC Blended Custom Benchmark for FoF (TRS) (3.18) (2.56) 25.16 (2.56) 6.77 37.18 (4.60) 21.62 (14.39) 05/01/2017
Excess (0.68) (0.02) 0.50 (0.02) 0.83 2.25 1.54 2.18 (1.11)
ARGA-WorldxUS LCV - Bivium 53 0.05 (2.08) (4.05) 50.67 (4.05) 11.45 62.37 (6.28) 32.68 (19.25) 05/01/2017
MSCI AC WORLD ex US (NET) (3.20) (2.99) 23.92 (2.99) 5.90 35.72 (4.80) 21.51 (14.20) 05/01/2017
Excess 1.12 (1.06) 26.76 (1.06) 5.55 26.66 (1.48) 11.17 (5.06)
22
Assets
($MM) % of Total
Trailing
1 Month
Trailing
3 Month
Trailing
1 Year FYTD CYTD FYE 6/30/21
FYE
6/30/20
CYE
12/31/19
CYE
12/31/18 Inception Date
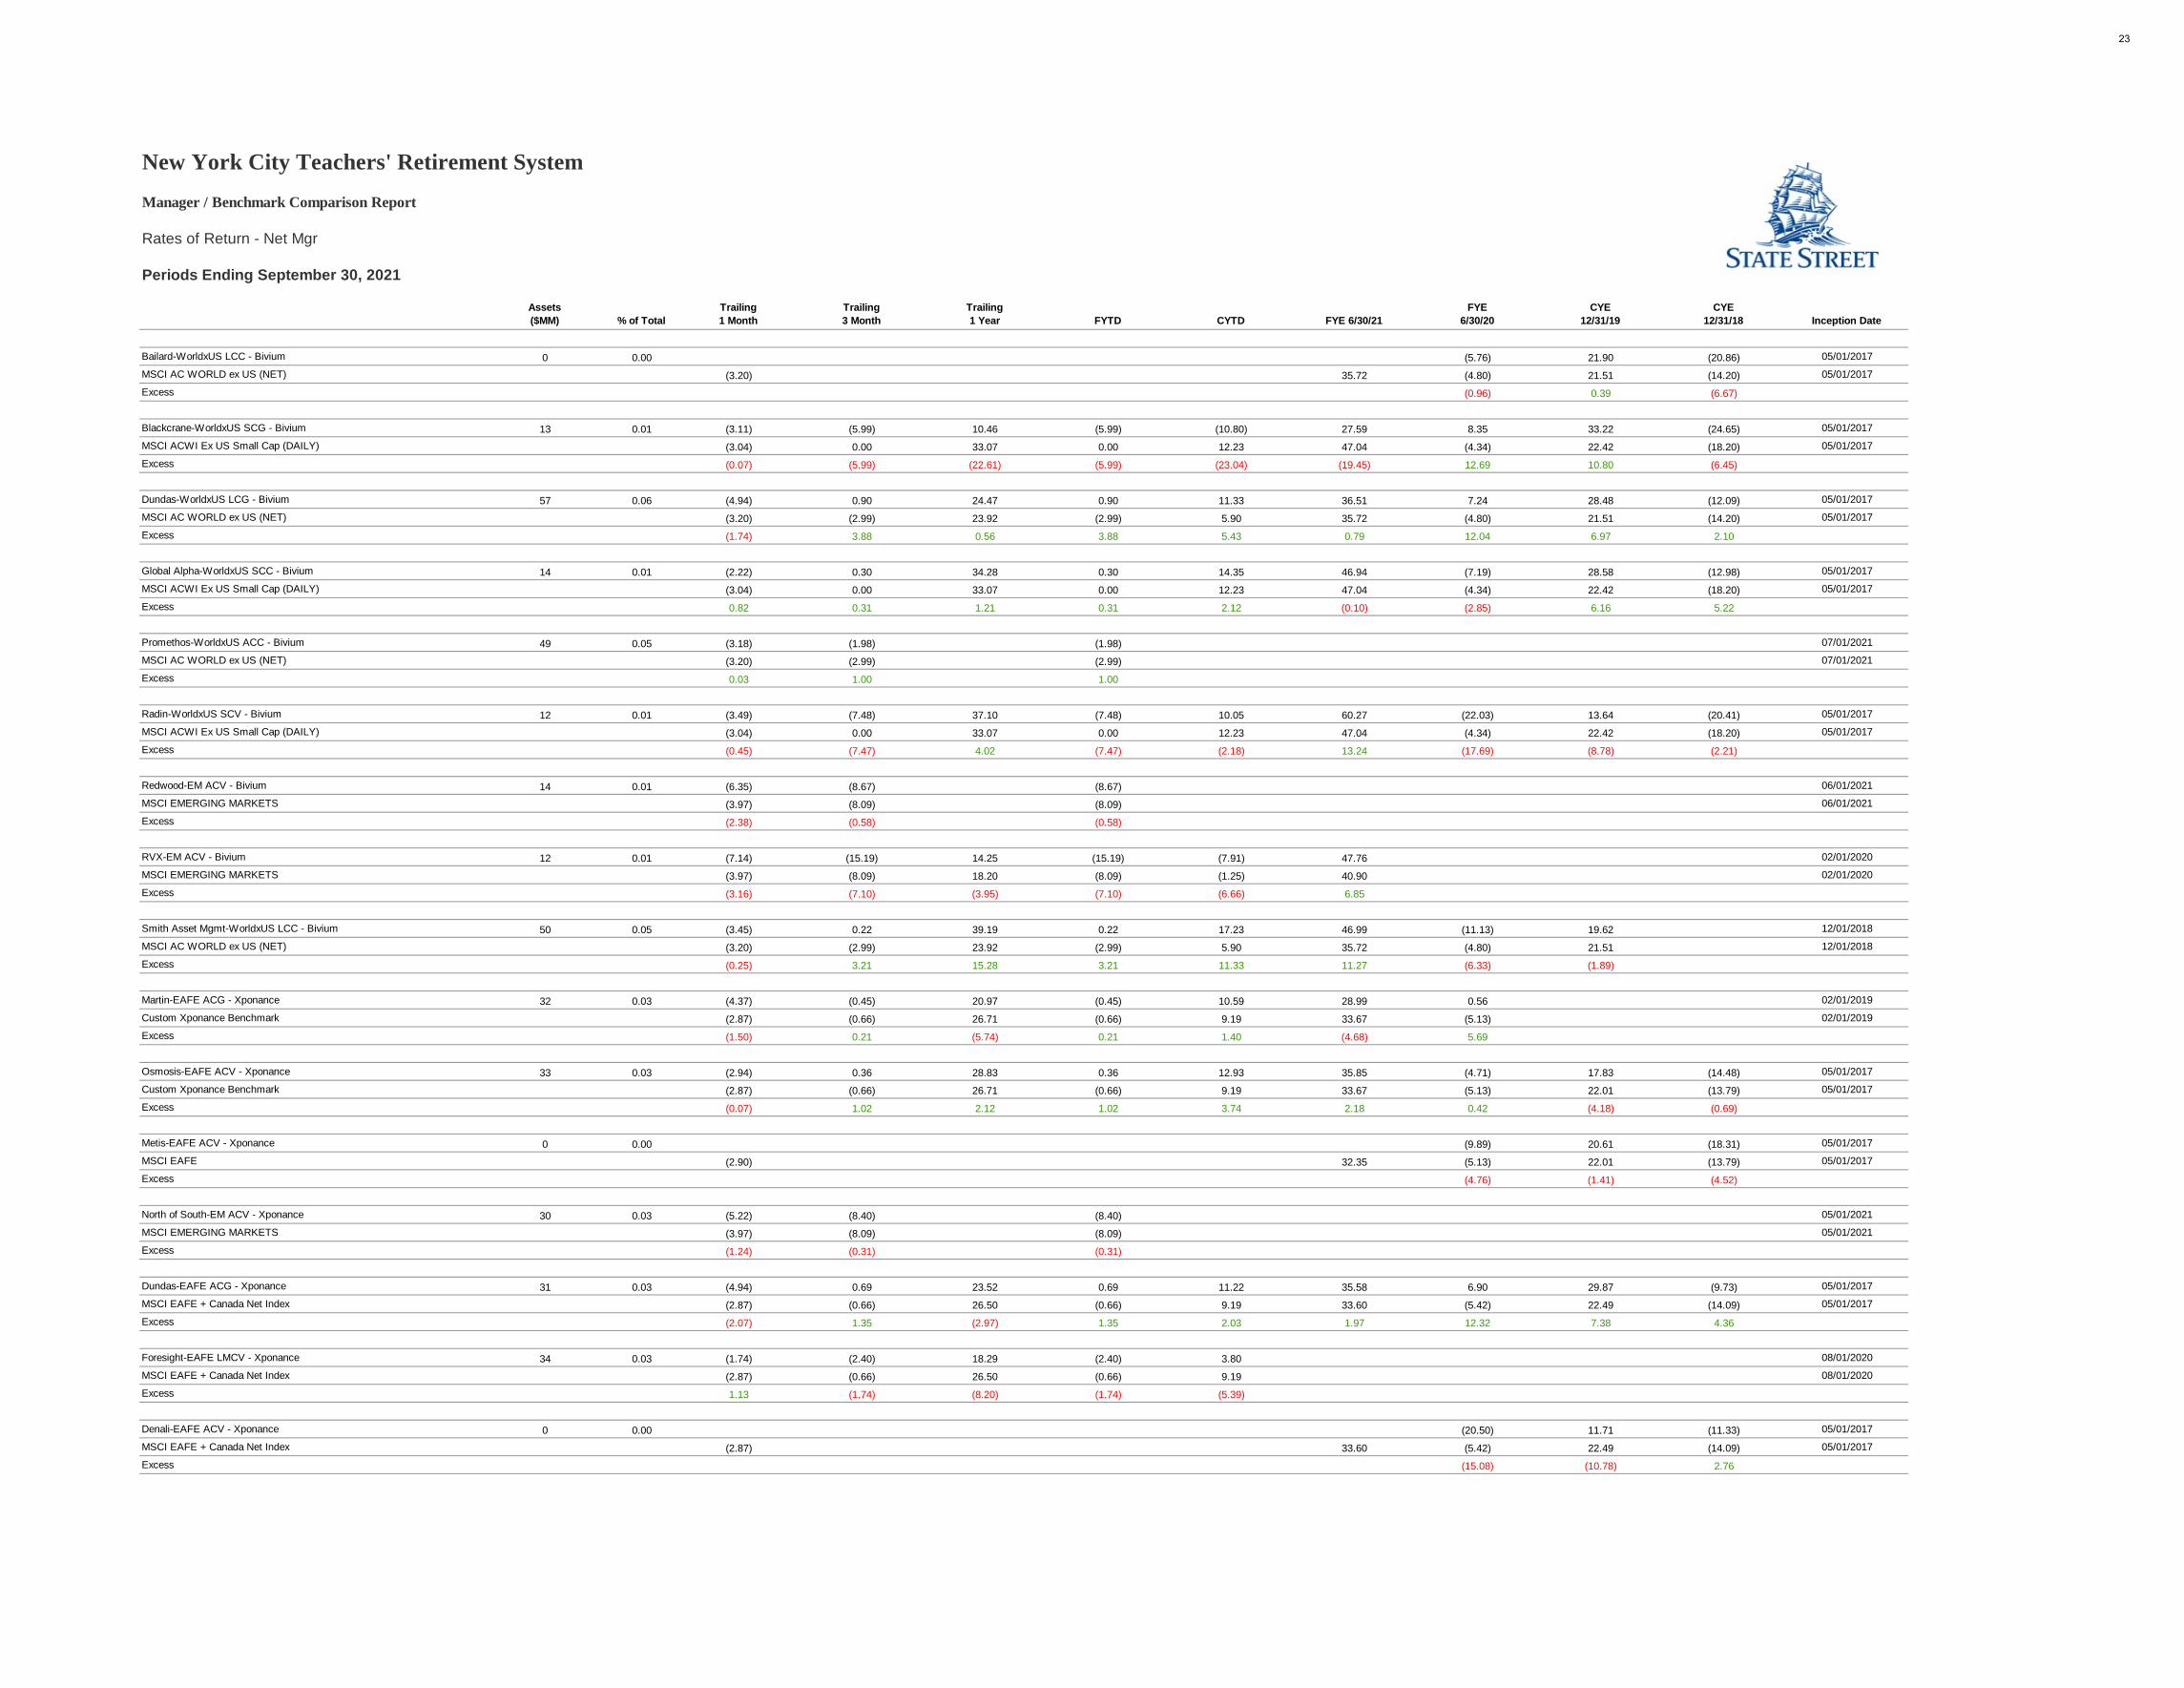
Periods Ending September 30, 2021
New York City Teachers' Retirement SystemManager / Benchmark Comparison Report
Rates of Return - Net Mgr
Bailard-WorldxUS LCC - Bivium 0 0.00 (5.76) 21.90 (20.86) 05/01/2017
MSCI AC WORLD ex US (NET) (3.20) 35.72 (4.80) 21.51 (14.20) 05/01/2017
Excess (0.96) 0.39 (6.67)
Blackcrane-WorldxUS SCG - Bivium 13 0.01 (3.11) (5.99) 10.46 (5.99) (10.80) 27.59 8.35 33.22 (24.65) 05/01/2017
MSCI ACWI Ex US Small Cap (DAILY) (3.04) 0.00 33.07 0.00 12.23 47.04 (4.34) 22.42 (18.20) 05/01/2017
Excess (0.07) (5.99) (22.61) (5.99) (23.04) (19.45) 12.69 10.80 (6.45)
Dundas-WorldxUS LCG - Bivium 57 0.06 (4.94) 0.90 24.47 0.90 11.33 36.51 7.24 28.48 (12.09) 05/01/2017
MSCI AC WORLD ex US (NET) (3.20) (2.99) 23.92 (2.99) 5.90 35.72 (4.80) 21.51 (14.20) 05/01/2017
Excess (1.74) 3.88 0.56 3.88 5.43 0.79 12.04 6.97 2.10
Global Alpha-WorldxUS SCC - Bivium 14 0.01 (2.22) 0.30 34.28 0.30 14.35 46.94 (7.19) 28.58 (12.98) 05/01/2017
MSCI ACWI Ex US Small Cap (DAILY) (3.04) 0.00 33.07 0.00 12.23 47.04 (4.34) 22.42 (18.20) 05/01/2017
Excess 0.82 0.31 1.21 0.31 2.12 (0.10) (2.85) 6.16 5.22
Promethos-WorldxUS ACC - Bivium 49 0.05 (3.18) (1.98) (1.98) 07/01/2021
MSCI AC WORLD ex US (NET) (3.20) (2.99) (2.99) 07/01/2021
Excess 0.03 1.00 1.00
Radin-WorldxUS SCV - Bivium 12 0.01 (3.49) (7.48) 37.10 (7.48) 10.05 60.27 (22.03) 13.64 (20.41) 05/01/2017
MSCI ACWI Ex US Small Cap (DAILY) (3.04) 0.00 33.07 0.00 12.23 47.04 (4.34) 22.42 (18.20) 05/01/2017
Excess (0.45) (7.47) 4.02 (7.47) (2.18) 13.24 (17.69) (8.78) (2.21)
Redwood-EM ACV - Bivium 14 0.01 (6.35) (8.67) (8.67) 06/01/2021
MSCI EMERGING MARKETS (3.97) (8.09) (8.09) 06/01/2021
Excess (2.38) (0.58) (0.58)
RVX-EM ACV - Bivium 12 0.01 (7.14) (15.19) 14.25 (15.19) (7.91) 47.76 02/01/2020
MSCI EMERGING MARKETS (3.97) (8.09) 18.20 (8.09) (1.25) 40.90 02/01/2020
Excess (3.16) (7.10) (3.95) (7.10) (6.66) 6.85
Smith Asset Mgmt-WorldxUS LCC - Bivium 50 0.05 (3.45) 0.22 39.19 0.22 17.23 46.99 (11.13) 19.62 12/01/2018
MSCI AC WORLD ex US (NET) (3.20) (2.99) 23.92 (2.99) 5.90 35.72 (4.80) 21.51 12/01/2018
Excess (0.25) 3.21 15.28 3.21 11.33 11.27 (6.33) (1.89)
Martin-EAFE ACG - Xponance 32 0.03 (4.37) (0.45) 20.97 (0.45) 10.59 28.99 0.56 02/01/2019
Custom Xponance Benchmark (2.87) (0.66) 26.71 (0.66) 9.19 33.67 (5.13) 02/01/2019
Excess (1.50) 0.21 (5.74) 0.21 1.40 (4.68) 5.69
Osmosis-EAFE ACV - Xponance 33 0.03 (2.94) 0.36 28.83 0.36 12.93 35.85 (4.71) 17.83 (14.48) 05/01/2017
Custom Xponance Benchmark (2.87) (0.66) 26.71 (0.66) 9.19 33.67 (5.13) 22.01 (13.79) 05/01/2017
Excess (0.07) 1.02 2.12 1.02 3.74 2.18 0.42 (4.18) (0.69)
Metis-EAFE ACV - Xponance 0 0.00 (9.89) 20.61 (18.31) 05/01/2017
MSCI EAFE (2.90) 32.35 (5.13) 22.01 (13.79) 05/01/2017
Excess (4.76) (1.41) (4.52)
North of South-EM ACV - Xponance 30 0.03 (5.22) (8.40) (8.40) 05/01/2021
MSCI EMERGING MARKETS (3.97) (8.09) (8.09) 05/01/2021
Excess (1.24) (0.31) (0.31)
Dundas-EAFE ACG - Xponance 31 0.03 (4.94) 0.69 23.52 0.69 11.22 35.58 6.90 29.87 (9.73) 05/01/2017
MSCI EAFE + Canada Net Index (2.87) (0.66) 26.50 (0.66) 9.19 33.60 (5.42) 22.49 (14.09) 05/01/2017
Excess (2.07) 1.35 (2.97) 1.35 2.03 1.97 12.32 7.38 4.36
Foresight-EAFE LMCV - Xponance 34 0.03 (1.74) (2.40) 18.29 (2.40) 3.80 08/01/2020
MSCI EAFE + Canada Net Index (2.87) (0.66) 26.50 (0.66) 9.19 08/01/2020
Excess 1.13 (1.74) (8.20) (1.74) (5.39)
Denali-EAFE ACV - Xponance 0 0.00 (20.50) 11.71 (11.33) 05/01/2017
MSCI EAFE + Canada Net Index (2.87) 33.60 (5.42) 22.49 (14.09) 05/01/2017
Excess (15.08) (10.78) 2.76
23

Assets
($MM) % of Total
Trailing
1 Month
Trailing
3 Month
Trailing
1 Year FYTD CYTD FYE 6/30/21
FYE
6/30/20
CYE
12/31/19
CYE
12/31/18 Inception Date
Periods Ending September 30, 2021
New York City Teachers' Retirement SystemManager / Benchmark Comparison Report
Rates of Return - Net Mgr
Change Global-EM ACV - Xponance 0 0.00 (17.36) 14.54 (15.84) 05/01/2017
NYC Blended Custom Benchmark for FoF (TRS) (3.18) 37.18 (4.60) 21.62 (14.39) 05/01/2017
Excess (12.76) (7.07) (1.45)
Ativo-EAFE ACG - Xponance 0 0.00 (7.89) 22.62 (11.98) 05/01/2017
MSCI EAFE + Canada Net Index (2.87) 33.60 (5.42) 22.49 (14.09) 05/01/2017
Excess (2.47) 0.13 2.11
ARGA-WorldxUS LMCV - Xponance 41 0.04 (1.66) (3.54) 52.57 (3.54) 11.94 08/01/2020
MSCI AC WORLD ex US (NET) (3.20) (2.99) 23.92 (2.99) 5.90 08/01/2020
Excess 1.55 (0.56) 28.66 (0.56) 6.04
Redwood-EAFE ACG - Xponance 27 0.03 (4.41) (2.20) 26.85 (2.20) 9.21 41.49 5.84 25.79 11/01/2018
MSCI EAFE + Canada Net Index (2.87) (0.66) 26.50 (0.66) 9.19 33.60 (5.42) 22.49 11/01/2018
Excess (1.53) (1.54) 0.35 (1.54) 0.01 7.89 11.26 3.30
Aubrey-EM ACG - Xponance 43 0.04 (2.08) (0.42) 25.80 (0.42) 5.62 51.24 02/01/2020
MSCI EMERGING MARKETS (3.97) (8.09) 18.20 (8.09) (1.25) 40.90 02/01/2020
Excess 1.90 7.67 7.60 7.67 6.87 10.33
Xponance Transition-WorldxUS 0 0.00 04/01/2017
Applied Rsch-WorldxUS LCG - Leading Edge 33 0.03 (5.73) (2.80) 13.28 (2.80) 1.16 29.08 02/01/2020
MSCI ACWI ex USA IMI Net (3.18) (2.56) 25.16 (2.56) 6.77 37.18 02/01/2020
Excess (2.55) (0.24) (11.88) (0.24) (5.62) (8.10)
Ativo-WorldxUS ACC - Leading Edge 42 0.04 (4.72) (1.58) 19.89 (1.58) 9.78 30.12 (5.95) 23.98 (12.27) 05/01/2017
MSCI ACWI ex USA IMI Net (3.18) (2.56) 25.16 (2.56) 6.77 37.18 (4.74) 21.63 (14.76) 05/01/2017
Excess (1.54) 0.98 (5.28) 0.98 3.01 (7.06) (1.21) 2.35 2.49
Blackcrane-WorldxUS ACC - Leading Edge 32 0.03 (4.31) (5.36) 8.12 (5.36) (4.82) 19.78 5.53 27.85 (22.87) 05/01/2017
MSCI ACWI ex USA IMI Net (3.18) (2.56) 25.16 (2.56) 6.77 37.18 (4.74) 21.63 (14.76) 05/01/2017
Excess (1.14) (2.80) (17.05) (2.80) (11.59) (17.39) 10.27 6.21 (8.12)
Denali-EAFE LCC - Leading Edge 0 0.00 (20.80) 11.93 (11.81) 12/01/2017
MSCI World ex USA IMI Net Return (2.95) 34.82 (5.11) 22.91 (14.68) 12/01/2017
Excess (15.70) (10.98) 2.87
Haven-WorldxUS LMCV - Leading Edge 49 0.05 (3.05) (1.30) 25.54 (1.30) 10.22 36.43 (2.82) 02/01/2019
MSCI ACWI ex USA IMI Net (3.18) (2.56) 25.16 (2.56) 6.77 37.18 (4.74) 02/01/2019
Excess 0.13 1.26 0.38 1.26 3.45 (0.74) 1.91
Henry James-WorldxUS LMCC - Leading Edge 49 0.05 (4.86) (1.21) 20.40 (1.21) 5.82 31.03 3.21 28.10 (13.70) 05/01/2017
MSCI ACWI ex USA IMI Net (3.18) (2.56) 25.16 (2.56) 6.77 37.18 (4.74) 21.63 (14.76) 05/01/2017
Excess (1.68) 1.35 (4.76) 1.35 (0.95) (6.15) 7.95 6.47 1.05
John Hsu-WorldxUS - Leading Edge
MSCI ACWI ex USA IMI Net (3.18) (2.56) 25.16 (2.56) 6.77 37.18 (4.74) 21.63 (14.76)Excess
Redwood-WorldxUS LMCC - Leading Edge 52 0.05 (5.30) (5.37) 24.62 (5.37) 8.54 49.65 5.50 30.02 (13.22) 05/01/2017
MSCI ACWI ex USA IMI Net (3.18) (2.56) 25.16 (2.56) 6.77 37.18 (4.74) 21.63 (14.76) 05/01/2017
Excess (2.12) (2.81) (0.54) (2.81) 1.76 12.48 10.24 8.39 1.54
TRS-TOTAL EMERGING MARKETS 9,537 9.43 (4.57) (8.06) 23.02 (8.06) 0.93 47.53 (7.99) 15.93 (13.94) 02/01/2011
TRS Custom EM Index (3.97) (8.09) 18.20 (8.09) (1.25) 40.90 (3.47) 15.98 (13.39) 02/01/2011
Excess (0.59) 0.04 4.82 0.04 2.18 6.62 (4.52) (0.04) (0.55)
Acadian EM 1,572 1.55 (5.00) (6.94) 26.42 (6.94) 7.21 46.80 (4.29) 19.36 04/01/2018
TRS Custom EM Index (3.97) (8.09) 18.20 (8.09) (1.25) 40.90 (3.47) 15.98 04/01/2018
Excess (1.02) 1.16 8.21 1.16 8.46 5.90 (0.82) 3.38
24

Assets
($MM) % of Total
Trailing
1 Month
Trailing
3 Month
Trailing
1 Year FYTD CYTD FYE 6/30/21
FYE
6/30/20
CYE
12/31/19
CYE
12/31/18 Inception Date
Periods Ending September 30, 2021
New York City Teachers' Retirement SystemManager / Benchmark Comparison Report
Rates of Return - Net Mgr
AQR-EM SCC 459 0.45 (3.29) (5.06) (5.06) 20.34 11/01/2020
MSCI EMERGING MARKETS (3.97) (8.09) (8.09) (1.25) 11/01/2020
Excess 0.68 3.03 3.03 21.58
Baillie Gifford EM 2,634 2.60 (5.88) (12.03) 18.54 (12.03) (6.29) 53.45 (2.47) 23.71 (14.39) 12/01/2013
TRS Custom EM Index (3.97) (8.09) 18.20 (8.09) (1.25) 40.90 (3.47) 15.98 (13.39) 12/01/2013
Excess (1.91) (3.94) 0.34 (3.94) (5.05) 12.54 1.00 7.73 (1.00)
DFA EM 1,509 1.49 (2.70) (4.53) 35.87 (4.53) 10.95 50.00 (18.13) 9.16 (13.17) 04/01/2012
TRS Custom EM Index (3.97) (8.09) 18.20 (8.09) (1.25) 40.90 (3.47) 15.98 (13.39) 04/01/2012
Excess 1.28 3.56 17.67 3.56 12.20 9.10 (14.67) (6.82) 0.23
Parametric EM 0 0.00 (17.75) 10.51 (14.52) 06/01/2012
TRS Custom EM Index (3.97) 40.90 (3.47) 15.98 (13.39) 06/01/2012
Excess (14.28) (5.47) (1.12)
RBC-EM ACG 679 0.67 (4.48) (7.71) 13.94 (7.71) (4.14) 34.97 07/01/2020
MSCI EMERGING MARKETS (3.97) (8.09) 18.20 (8.09) (1.25) 40.90 07/01/2020
Excess (0.51) 0.38 (4.26) 0.38 (2.90) (5.93)
Sands-EM LCG 795 0.79 (4.54) (3.04) 26.93 (3.04) 3.55 08/01/2020
MSCI EMERGING MARKETS (3.97) (8.09) 18.20 (8.09) (1.25) 08/01/2020
Excess (0.56) 5.05 8.73 5.05 4.80
UBS-EM ACC 753 0.74 (4.06) (9.12) 14.71 (9.12) (6.50) 37.86 06/01/2020
MSCI EMERGING MARKETS (3.97) (8.09) 18.20 (8.09) (1.25) 40.90 06/01/2020
Excess (0.09) (1.03) (3.49) (1.03) (5.25) (3.05)
Lazard EM
TRS Custom EM Index (3.97) (8.09) 18.20 (8.09) (1.25) 40.90 (3.47) 15.98 (13.39)Excess
BlackRock MSCI EM Core 1,136 1.12 (4.23) (8.46) 18.26 (8.46) (1.20) 41.48 (3.97) 15.70 (12.87) 04/01/2011
TRS Custom EM Passive Index (3.97) (8.09) 18.20 (8.09) (1.25) 40.90 (3.47) 15.98 (12.99) 04/01/2011
Excess (0.26) (0.37) 0.06 (0.37) 0.04 0.58 (0.50) (0.27) 0.12
TRS-TOTAL GLOBAL EQUITY 424 0.42 (5.69) 0.73 27.79 0.73 14.07 41.87 5.30 34.11 08/01/2018
MSCI World Index (4.15) (0.01) 28.82 (0.01) 13.04 39.04 2.84 27.67 08/01/2018
Excess (1.54) 0.74 (1.03) 0.74 1.03 2.82 2.45 6.44
Fiera-Global 424 0.42 (5.69) 0.73 27.79 0.73 14.07 41.87 5.30 34.11 08/01/2018
MSCI World Index (4.15) (0.01) 28.82 (0.01) 13.04 39.04 2.84 27.67 08/01/2018
Excess (1.54) 0.74 (1.03) 0.74 1.03 2.82 2.45 6.44
TRS-TOTAL REAL ESTATE SECURITIES 0 0.00 (14.65) 24.42 (5.79) 01/01/2003
DJ US SELECT REAL ESTATE SECURITIES INDEX (5.52) 39.98 (17.71) 23.10 (4.22) 01/01/2003
Excess 3.05 1.31 (1.57)
Adelante REITS (9.53)DJ US SELECT REAL ESTATE SECURITIES INDEX (5.52) 1.25 40.56 1.25 24.48 39.98 (17.71) 23.10 (4.22)Excess 8.18
CenterSquare REITS (12.90)DJ US SELECT REAL ESTATE SECURITIES INDEX (5.52) 1.25 40.56 1.25 24.48 39.98 (17.71) 23.10 (4.22)Excess 4.81
Cohen Steers REITS (13.46)DJ US SELECT REAL ESTATE SECURITIES INDEX (5.52) 1.25 40.56 1.25 24.48 39.98 (17.71) 23.10 (4.22)Excess 4.25
TRS-TOTAL MORGAN STANLEY REITS 0 0.00 (22.24) 19.02 (7.88) 04/01/2004
Morgan Stanley Custom RESI Index (5.52) 39.98 (17.71) 23.10 (4.22) 04/01/2004
Excess (4.53) (4.08) (3.66)
25

Assets
($MM) % of Total
Trailing
1 Month
Trailing
3 Month
Trailing
1 Year FYTD CYTD FYE 6/30/21
FYE
6/30/20
CYE
12/31/19
CYE
12/31/18 Inception Date
Periods Ending September 30, 2021
New York City Teachers' Retirement SystemManager / Benchmark Comparison Report
Rates of Return - Net Mgr
FIXED INCOME SUMMARY
TRS-TOTAL STRUCTURED 25,150 24.86 (0.88) 0.12 (3.17) 0.12 (3.21) (2.68) 14.49 10.46 (0.83) 01/01/1985
NYC Custom Structured Index-TRS (0.90) 0.03 (3.28) 0.03 (3.13) (2.88) 18.24 12.99 (1.23) 01/01/1985
Excess 0.03 0.09 0.12 0.09 (0.08) 0.20 (3.75) (2.54) 0.40
BlackRock Mortgages 2,654 2.62 (0.24) 0.33 (0.07) 0.33 (0.43) 0.12 6.32 6.88 1.00 09/01/2000
NYC Custom Mortgage Benchmark (0.36) 0.10 (0.43) 0.10 (0.67) (0.48) 5.96 6.68 1.01 09/01/2000
Excess 0.12 0.24 0.36 0.24 0.24 0.60 0.35 0.21 (0.01)
BlackRock Mortgages NA 7 0.01 (0.36) 0.94 3.64 0.94 2.59 3.22 5.67 16.58 3.51 10/01/2008
NYC Custom Mortgage Benchmark (0.36) 0.10 (0.43) 0.10 (0.67) (0.48) 5.96 6.68 1.01 10/01/2008
Excess 0.00 0.84 4.07 0.84 3.27 3.69 (0.29) 9.90 2.50
PIMCO MORT 1,526 1.51 (0.35) 0.16 0.58 0.16 (0.68) 10/01/2020
Bloomberg US Mortgage Backed Securities (0.36) 0.10 (0.43) 0.10 (0.67) 10/01/2020
Excess 0.01 0.07 1.01 0.07 (0.01)
Wellington Mortgages 803 0.79 (0.35) 0.11 (0.02) 0.11 (0.33) 10/01/2020
Bloomberg US Mortgage Backed Securities (0.36) 0.10 (0.43) 0.10 (0.67) 10/01/2020
Excess 0.01 0.02 0.41 0.02 0.34
BlackRock Corporate 855 0.84 (1.03) 0.09 1.89 0.09 (1.12) 3.35 14.06 (1.99) 10/01/2000
NYC Custom IGC Benchmark (1.05) 0.00 1.74 0.00 (1.07) 3.34 9.26 13.40 (1.90) 10/01/2000
Excess 0.02 0.09 0.15 0.09 (0.05) 0.01 0.66 (0.09)
Neuberger Berman-Corporate 1,610 1.59 (0.98) 0.12 0.12 03/01/2021
Bloomberg U.S. Corporate Inv Grade (1.05) 0.00 0.00 03/01/2021
Excess 0.07 0.12 0.12
Pinebridge-Corporate 876 0.87 (1.10) 09/01/2021
NYC Custom IGC Benchmark (1.05) 09/01/2021
Excess (0.04)
Taplin Corporate 9.92NYC - Investment Grade Credit (1.02) 0.06 1.75 0.06 (1.07) 3.28 9.26 13.40 (1.90)Excess 0.66
T Rowe Price-Corporate 2,350 2.32 (1.10) 0.11 2.22 0.11 (0.90) 3.76 14.61 (2.41) 01/01/1987
NYC Custom IGC Benchmark (1.05) 0.00 1.74 0.00 (1.07) 3.34 9.26 13.40 (1.90) 01/01/1987
Excess (0.04) 0.11 0.49 0.11 0.17 0.42 1.22 (0.51)
Prudential Corporate 0 0.00 3.53 9.17 13.59 (1.94) 08/01/2009
NYC - Investment Grade Credit (1.02) 3.28 9.26 13.40 (1.90) 08/01/2009
Excess 0.25 (0.09) 0.19 (0.03)
Barrow Hanley Corporate 10.74NYC - Investment Grade Credit (1.02) 0.06 1.75 0.06 (1.07) 3.28 9.26 13.40 (1.90)Excess 1.48
SSGA LI Treasury 116 0.12 (2.05) 0.06 (6.40) 0.06 (4.79) (6.34) 17.91 10.50 (0.20) 08/01/2009
NYC - Treasury Agency Plus Five (2.17) (0.10) (6.85) (0.10) (5.14) (6.52) 17.08 10.40 (0.05) 08/01/2009
Excess 0.12 0.16 0.45 0.16 0.35 0.18 0.83 0.11 (0.15)
SSgA Int Gov Bond Index * 8,927 8.83 (0.61) 0.00 (1.41) 0.00 (1.19) (1.20) 7.02 5.08 2.05 03/01/2017
FTSE USBIG Treasury/Agency 1-10 y (0.64) (0.06) (1.34) (0.06) (1.12) (1.09) 6.99 5.18 1.42 03/01/2017
Excess 0.03 0.05 (0.07) 0.05 (0.07) (0.12) 0.03 (0.09) 0.63* Assets were in transition from 9/29/17 to 2/11/19
BlackRock LI Treasury 66 0.07 (1.98) 0.13 (6.46) 0.13 (4.85) (6.34) 16.52 10.35 (0.18) 08/01/2009
NYC - Treasury Agency Plus Five (2.17) (0.10) (6.85) (0.10) (5.14) (6.52) 17.08 10.40 (0.05) 08/01/2009
Excess 0.19 0.23 0.39 0.23 0.29 0.18 (0.56) (0.05) (0.13)
SSGA ST Treasury 1-3Y 2,421 2.39 (0.10) 0.06 0.01 0.06 (0.04) 0.04 3.60 3.56 1.51 01/01/2017
FTSE USBIG Treasury 1-3 Y Index (0.10) 0.06 0.03 0.06 (0.02) 0.07 4.06 3.56 1.56 01/01/2017
Excess 0.00 0.00 (0.03) 0.00 (0.03) (0.02) (0.46) 0.00 (0.05)
26

Assets
($MM) % of Total
Trailing
1 Month
Trailing
3 Month
Trailing
1 Year FYTD CYTD FYE 6/30/21
FYE
6/30/20
CYE
12/31/19
CYE
12/31/18 Inception Date
Periods Ending September 30, 2021
New York City Teachers' Retirement SystemManager / Benchmark Comparison Report
Rates of Return - Net Mgr
SSGA LT Treasury 10Y Plus 2,941 2.91 (2.85) 0.40 (10.27) 0.40 (7.38) (10.48) 25.46 14.88 (1.84) 11/01/2016
FTSE Treasury 10+ (3.03) 0.12 (10.50) 0.12 (7.72) (10.50) 25.45 14.89 (1.89) 11/01/2016
Excess 0.19 0.29 0.24 0.29 0.34 0.02 0.00 (0.01) 0.05
TRS-TOTAL HIGH YIELD 5,114 5.06 0.14 0.81 11.43 0.81 4.94 15.94 0.36 14.86 (2.39) 08/01/1998
High Yield Custom Benchmark (0.01) 0.89 11.27 0.89 4.54 15.34 0.00 14.32 (2.34) 08/01/1998
Excess 0.15 (0.08) 0.16 (0.08) 0.40 0.61 0.36 0.54 (0.06)
Neuberger Berman High Yield 854 0.84 (0.10) 0.35 9.95 0.35 3.71 14.81 (0.39) 14.16 (2.01) 09/01/2012
Bloomberg U.S. HY - 2% Issuer Cap (0.01) 0.89 11.27 0.89 4.54 15.34 0.00 14.32 (2.08) 09/01/2012
Excess (0.09) (0.54) (1.32) (0.54) (0.83) (0.53) (0.39) (0.16) 0.08
Oaktree High Yield 527 0.52 0.15 0.80 10.26 0.80 3.84 14.17 0.63 14.01 (3.49) 02/01/2013
Bloomberg U.S. HY - 2% Issuer Cap (0.01) 0.89 11.27 0.89 4.54 15.34 0.00 14.32 (2.08) 02/01/2013
Excess 0.16 (0.09) (1.02) (0.09) (0.70) (1.17) 0.63 (0.31) (1.41)
Stone Harbor High Yield 0 0.00 (2.65) 10/01/2003
Bloomberg U.S. HY - 2% Issuer Cap (0.01) 15.34 0.00 14.32 (2.08) 10/01/2003
Excess (0.56)
T Rowe Price High Yield 681 0.67 0.12 1.02 11.84 1.02 5.19 15.87 0.76 15.55 (2.30) 10/01/2003
Bloomberg U.S. HY - 2% Issuer Cap (0.01) 0.89 11.27 0.89 4.54 15.34 0.00 14.32 (2.08) 10/01/2003
Excess 0.12 0.12 0.57 0.12 0.65 0.53 0.77 1.23 (0.22)
Brigade High Yield 692 0.68 0.55 0.89 15.56 0.89 7.80 21.43 (0.94) 15.73 12/01/2018
Bloomberg U.S. HY - 2% Issuer Cap (0.01) 0.89 11.27 0.89 4.54 15.34 0.00 14.32 12/01/2018
Excess 0.56 (0.01) 4.29 (0.01) 3.26 6.09 (0.94) 1.41
Mackay Shields High Yield 850 0.84 0.19 1.07 10.04 1.07 4.75 14.12 2.12 13.96 12/01/2018
Bloomberg U.S. HY - 2% Issuer Cap (0.01) 0.89 11.27 0.89 4.54 15.34 0.00 14.32 12/01/2018
Excess 0.20 0.18 (1.23) 0.18 0.21 (1.22) 2.12 (0.36)
Nomura High Yield 686 0.68 0.19 0.89 13.81 0.89 5.90 18.85 (0.24) 13.99 12/01/2018
Bloomberg U.S. HY - 2% Issuer Cap (0.01) 0.89 11.27 0.89 4.54 15.34 0.00 14.32 12/01/2018
Excess 0.19 0.00 2.54 0.00 1.36 3.51 (0.24) (0.33)
Eaton Vance High Yield 823 0.81 (0.03) 0.73 10.04 0.73 4.09 14.19 (0.03) 14.52 12/01/2018
Bloomberg U.S. HY - 2% Issuer Cap (0.01) 0.89 11.27 0.89 4.54 15.34 0.00 14.32 12/01/2018
Excess (0.02) (0.16) (1.23) (0.16) (0.45) (1.14) (0.03) 0.21
Transition High Yield
TRS-TOTAL BANK LOANS 4 0.00 12.42 6.09 2.07 6.09 (0.65) (0.72) (1.75) 7.60 0.74 11/01/2012
CSFB LEVERAGED LOAN INDEX 0.65 1.13 8.46 1.13 4.65 11.67 (2.27) 8.17 1.14 11/01/2012
Excess 11.77 4.95 (6.39) 4.95 (5.31) (12.38) 0.52 (0.57) (0.41)
Barings Bank Loans 2 0.00 (3.08) 7.82 0.38 12/01/2012
CSFB LEVERAGED LOAN INDEX 0.65 11.67 (2.27) 8.17 1.14 12/01/2012
Excess (0.81) (0.36) (0.76)
Credit Suisse Bank Loans 2 0.00 (0.96) 8.31 1.04 02/01/2013
CSFB LEVERAGED LOAN INDEX 0.65 11.67 (2.27) 8.17 1.14 02/01/2013
Excess 1.31 0.13 (0.10)
Guggenheim Bank Loans
CSFB LEVERAGED LOAN INDEX 0.65 1.13 8.46 1.13 4.65 11.67 (2.27) 8.17 1.14Excess
Pinebridge Bank Loans 0 0.00 (0.68) 07/01/2019
CSFB LEVERAGED LOAN INDEX 0.65 11.67 (2.27) 07/01/2019
Excess 1.59
27

Assets
($MM) % of Total
Trailing
1 Month
Trailing
3 Month
Trailing
1 Year FYTD CYTD FYE 6/30/21
FYE
6/30/20
CYE
12/31/19
CYE
12/31/18 Inception Date
Periods Ending September 30, 2021
New York City Teachers' Retirement SystemManager / Benchmark Comparison Report
Rates of Return - Net Mgr
Voya Bank Loans 1 0.00 (0.13) (0.20) (7.64) (0.20) (10.04) (5.20) (2.43) 7.74 0.33 11/01/2012
CSFB LEVERAGED LOAN INDEX 0.65 1.13 8.46 1.13 4.65 11.67 (2.27) 8.17 1.14 11/01/2012
Excess (0.78) (1.33) (16.10) (1.33) (14.69) (16.87) (0.17) (0.44) (0.81)
Wells Capital Bank Loans
CSFB LEVERAGED LOAN INDEX 0.65 1.13 8.46 1.13 4.65 11.67 (2.27) 8.17 1.14Excess
TRS-TOTAL TIPS MANAGERS 3,658 3.62 (0.70) 1.74 5.05 1.74 3.47 6.44 8.41 8.44 (1.27) 06/01/2005
Bloomberg Global Infl-Linked: U.S. TIPS (0.71) 1.75 5.19 1.75 3.51 6.51 8.28 8.43 (1.26) 06/01/2005
Excess 0.01 (0.01) (0.13) (0.01) (0.04) (0.08) 0.13 0.01 (0.01)
SSGA TIPS 2,701 2.67 (0.71) 1.75 5.10 1.75 3.50 6.48 8.44 8.44 (1.30) 08/01/2005
Bloomberg Global Infl-Linked: U.S. TIPS (0.71) 1.75 5.19 1.75 3.51 6.51 8.28 8.43 (1.26) 08/01/2005
Excess 0.01 0.00 (0.08) 0.00 (0.01) (0.04) 0.16 0.02 (0.04)
BlackRock TIPS 957 0.95 (0.69) 1.70 4.92 1.70 3.37 6.32 8.39 8.42 (1.18) 11/01/2005
Bloomberg Global Infl-Linked: U.S. TIPS (0.71) 1.75 5.19 1.75 3.51 6.51 8.28 8.43 (1.26) 11/01/2005
Excess 0.02 (0.05) (0.27) (0.05) (0.14) (0.20) 0.11 (0.01) 0.08
TRS-TOTAL CONVERTIBLE BONDS
ICE BofA All US Conv Ex Mandatory (1.38) (0.79) 28.12 (0.79) 5.88 48.00 17.79 22.89 0.65Excess
Advent Convertible Bonds
ICE BofA US Convertibles - Yield Alter (0.49) (0.54) 14.16 (0.54) 3.91 22.15 2.92 15.40 (0.42)Excess
Victory Convertible Bonds
ICE BofA All IG US Convertibles (1.21) 0.44 15.19 0.44 5.09 20.73 1.15 20.88 3.35Excess
TRS-TOTAL CORE FI- EMERGING MGRS
Bloomberg U.S. Aggregate (0.87) 0.05 (0.90) 0.05 (1.55) (0.33) 8.74 8.72 0.01Excess
Optimum Quantvest-Core - Progress
Bloomberg U.S. Aggregate (0.87) 0.05 (0.90) 0.05 (1.55) (0.33) 8.74 8.72 0.01Excess
Integrity-Core - Progress
Bloomberg U.S. Aggregate (0.87) 0.05 (0.90) 0.05 (1.55) (0.33) 8.74 8.72 0.01Excess
New Century-Core Plus - Progress
Bloomberg U.S. Aggregate (0.87) 0.05 (0.90) 0.05 (1.55) (0.33) 8.74 8.72 0.01Excess
Ramirez-Core - Progress
Bloomberg U.S. Aggregate (0.87) 0.05 (0.90) 0.05 (1.55) (0.33) 8.74 8.72 0.01Excess
Pugh-Core Plus - Progress
Bloomberg U.S. Aggregate (0.87) 0.05 (0.90) 0.05 (1.55) (0.33) 8.74 8.72 0.01Excess
TRS-TOTAL CORE FI- DEVELOPING MGRS 289 0.29 (0.84) 0.11 0.69 0.11 (0.90) 1.83 8.77 9.90 (1.22) 06/01/2015
Bloomberg U.S. Aggregate (0.87) 0.05 (0.90) 0.05 (1.55) (0.33) 8.74 8.72 0.01 06/01/2015
Excess 0.03 0.06 1.58 0.06 0.66 2.16 0.03 1.19 (1.23)
LM Capital-Core Plus 130 0.13 (0.87) 0.07 0.83 0.07 (0.89) 2.16 8.56 9.76 (1.35) 06/01/2015
Bloomberg U.S. Aggregate (0.87) 0.05 (0.90) 0.05 (1.55) (0.33) 8.74 8.72 0.01 06/01/2015
Excess (0.01) 0.02 1.72 0.02 0.66 2.49 (0.18) 1.04 (1.36)
28

Assets
($MM) % of Total
Trailing
1 Month
Trailing
3 Month
Trailing
1 Year FYTD CYTD FYE 6/30/21
FYE
6/30/20
CYE
12/31/19
CYE
12/31/18 Inception Date
Periods Ending September 30, 2021
New York City Teachers' Retirement SystemManager / Benchmark Comparison Report
Rates of Return - Net Mgr
Pugh-CorePlus 62 0.06 (0.86) 0.10 0.07 0.10 (1.17) 0.73 06/01/2020
Bloomberg U.S. Aggregate (0.87) 0.05 (0.90) 0.05 (1.55) (0.33) 06/01/2020
Excess 0.01 0.05 0.96 0.05 0.38 1.06
GIA-Core Plus 97 0.10 (0.79) 0.17 0.90 0.17 (0.72) 2.11 7.57 10.13 (1.01) 07/01/2015
Bloomberg U.S. Aggregate (0.87) 0.05 (0.90) 0.05 (1.55) (0.33) 8.74 8.72 0.01 07/01/2015
Excess 0.08 0.11 1.79 0.11 0.83 2.44 (1.17) 1.41 (1.02)
TRS-TOTAL OPPORTUNISTIC FIXED 3,020 2.99 0.70 3.52 19.93 3.52 14.40 21.56 (2.29) 5.10 6.22 10/01/2007
Opportunistic Fixed Income JPMGHY / CSFB 50/50 Blend Plus 300 0.54 1.60 13.24 1.60 6.95 17.35 0.88 14.66 2.36 10/01/2007
Excess 0.17 1.92 6.69 1.92 7.46 4.21 (3.17) (9.56) 3.86
Ave Special Situation Fund VI 7 0.01 0.00 (0.46) 81.73 (0.46) 85.98 84.04 (2.71) (0.31) 12.41 08/01/2011
Opportunistic Fixed Income JPMGHY / CSFB 50/50 Blend Plus 300 0.54 1.60 13.24 1.60 6.95 17.35 0.88 14.66 2.36 08/01/2011
Excess (0.54) (2.06) 68.49 (2.06) 79.03 66.69 (3.59) (14.97) 10.05
Brightwood Capital Advisors III, LP 10 0.01 0.00 3.02 39.56 3.02 32.05 38.33 (8.74) 2.92 11.00 04/01/2015
Opportunistic Fixed Income JPMGHY / CSFB 50/50 Blend Plus 300 0.54 1.60 13.24 1.60 6.95 17.35 0.88 14.66 2.36 04/01/2015
Excess (0.54) 1.43 26.32 1.43 25.10 20.97 (9.63) (11.74) 8.64
Brightwood Capital Advisors FD IV, LP 78 0.08 0.00 3.51 28.41 3.51 24.64 23.15 (7.97) 3.77 6.94 11/01/2016
Opportunistic Fixed Income JPMGHY / CSFB 50/50 Blend Plus 300 0.54 1.60 13.24 1.60 6.95 17.35 0.88 14.66 2.36 11/01/2016
Excess (0.54) 1.91 15.17 1.91 17.69 5.80 (8.86) (10.90) 4.58
Fortress Ctr St Ptnrs 143 0.14 0.00 3.75 21.36 3.75 13.93 23.98 (5.36) 8.55 10.99 05/01/2012
Opportunistic Fixed Income JPMGHY / CSFB 50/50 Blend Plus 300 0.54 1.60 13.24 1.60 6.95 17.35 0.88 14.66 2.36 05/01/2012
Excess (0.54) 2.15 8.12 2.15 6.99 6.63 (6.24) (6.11) 8.63
ICG Centre St Partner 98 0.10 0.00 1.92 11.17 1.92 6.86 26.53 7.73 11.66 9.02 07/01/2017
Opportunistic Fixed Income JPMGHY / CSFB 50/50 Blend Plus 300 0.54 1.60 13.24 1.60 6.95 17.35 0.88 14.66 2.36 07/01/2017
Excess (0.54) 0.32 (2.07) 0.32 (0.08) 9.18 6.85 (3.00) 6.66
Lone Star Fd VIII 26 0.03 0.00 1.47 10.51 1.47 5.00 13.39 (23.87) (4.95) 3.61 11/01/2013
Opportunistic Fixed Income JPMGHY / CSFB 50/50 Blend Plus 300 0.54 1.60 13.24 1.60 6.95 17.35 0.88 14.66 2.36 11/01/2013
Excess (0.54) (0.12) (2.73) (0.12) (1.95) (3.96) (24.75) (19.61) 1.25
Oaktree Opp Fd IX 70 0.07 0.00 8.22 38.37 8.22 32.14 41.29 (16.38) 7.21 4.57 04/01/2013
Opportunistic Fixed Income JPMGHY / CSFB 50/50 Blend Plus 300 0.54 1.60 13.24 1.60 6.95 17.35 0.88 14.66 2.36 04/01/2013
Excess (0.54) 6.62 25.12 6.62 25.19 23.94 (17.27) (7.45) 2.21
Torchlight Debt Oppy Fund III, LLC 0 0.00 07/01/2009
Opportunistic Fixed Income JPMGHY / CSFB 50/50 Blend Plus 300 0.54 17.35 0.88 14.66 2.36 07/01/2009
Excess
Torchlight Debt Opp V 14 0.01 0.57 2.04 11.30 2.04 10.42 12.31 1.19 6.54 14.55 08/01/2015
Opportunistic Fixed Income JPMGHY / CSFB 50/50 Blend Plus 300 0.54 1.60 13.24 1.60 6.95 17.35 0.88 14.66 2.36 08/01/2015
Excess 0.04 0.44 (1.94) 0.44 3.47 (5.04) 0.31 (8.12) 12.19
TORCHLIGHT DEBT OPP VI 78 0.08 0.00 2.07 8.66 2.07 7.24 6.45 2.21 06/01/2019
Opportunistic Fixed Income JPMGHY / CSFB 50/50 Blend Plus 300 0.54 1.60 13.24 1.60 6.95 17.35 0.88 06/01/2019
Excess (0.54) 0.48 (4.59) 0.48 0.30 (10.90) 1.33
Torchlight Debt Opportunity Fund VII 23 0.02 (0.05) 0.60 0.60 8.49 11/01/2020
Opportunistic Fixed Income JPMGHY / CSFB 50/50 Blend Plus 300 0.54 1.60 1.60 6.95 11/01/2020
Excess (0.59) (1.00) (1.00) 1.54
400 Capital Centre Street 23 0.02 0.00 0.58 0.58 04/01/2021
Opportunistic Fixed Income JPMGHY / CSFB 50/50 Blend Plus 300 0.54 1.60 1.60 04/01/2021
Excess (0.54) (1.01) (1.01)
Angelo Gordon Ct St Ptnrs 236 0.23 0.58 0.93 19.03 0.93 12.61 20.35 (1.47) 0.10 7.97 07/01/2012
Opportunistic Fixed Income JPMGHY / CSFB 50/50 Blend Plus 300 0.54 1.60 13.24 1.60 6.95 17.35 0.88 14.66 2.36 07/01/2012
Excess 0.04 (0.67) 5.79 (0.67) 5.67 2.99 (2.35) (14.57) 5.61
29

Assets
($MM) % of Total
Trailing
1 Month
Trailing
3 Month
Trailing
1 Year FYTD CYTD FYE 6/30/21
FYE
6/30/20
CYE
12/31/19
CYE
12/31/18 Inception Date
Periods Ending September 30, 2021
New York City Teachers' Retirement SystemManager / Benchmark Comparison Report
Rates of Return - Net Mgr
Apollo Centre Street Partnership 265 0.26 0.91 2.28 16.16 2.28 10.67 18.83 6.85 6.70 8.32 05/01/2012
Opportunistic Fixed Income JPMGHY / CSFB 50/50 Blend Plus 300 0.54 1.60 13.24 1.60 6.95 17.35 0.88 14.66 2.36 05/01/2012
Excess 0.37 0.68 2.92 0.68 3.72 1.48 5.97 (7.96) 5.96
Ares Centre Street 233 0.23 0.83 3.18 14.09 3.18 10.46 13.97 2.48 8.59 9.71 01/01/2015
Opportunistic Fixed Income JPMGHY / CSFB 50/50 Blend Plus 300 0.54 1.60 13.24 1.60 6.95 17.35 0.88 14.66 2.36 01/01/2015
Excess 0.29 1.58 0.85 1.58 3.51 (3.38) 1.60 (6.07) 7.35
Contrarian Partnership, L.P 112 0.11 1.42 5.05 32.33 5.05 20.82 35.50 (16.12) (8.48) (4.51) 07/01/2013
Opportunistic Fixed Income JPMGHY / CSFB 50/50 Blend Plus 300 0.54 1.60 13.24 1.60 6.95 17.35 0.88 14.66 2.36 07/01/2013
Excess 0.88 3.45 19.09 3.45 13.87 18.15 (17.00) (23.15) (6.87)
FCO MA Centre Street II ER 79 0.08 0.00 4.02 24.21 4.02 12.80 31.47 01/01/2020
Opportunistic Fixed Income JPMGHY / CSFB 50/50 Blend Plus 300 0.54 1.60 13.24 1.60 6.95 17.35 01/01/2020
Excess (0.54) 2.42 10.97 2.42 5.85 14.12
FCO MA Centre Street II EXP ER 11 0.01 0.00 5.79 5.79 4.66 01/01/2021
Opportunistic Fixed Income JPMGHY / CSFB 50/50 Blend Plus 300 0.54 1.60 1.60 6.95 01/01/2021
Excess (0.54) 4.19 4.19 (2.28)
GCM Grosvenor NYCRS Emerging OFI Manager 68 0.07 4.03 4.03 8.25 4.03 7.92 08/01/2020
Opportunistic Fixed Income JPMGHY / CSFB 50/50 Blend Plus 300 0.54 1.60 13.24 1.60 6.95 08/01/2020
Excess 3.50 2.44 (4.99) 2.44 0.97
Golden Tree OD 262 0.26 0.47 1.72 13.05 1.72 6.28 17.24 (0.64) 11.60 (1.71) 01/01/2012
Opportunistic Fixed Income JPMGHY / CSFB 50/50 Blend Plus 300 0.54 1.60 13.24 1.60 6.95 17.35 0.88 14.66 2.36 01/01/2012
Excess (0.06) 0.13 (0.19) 0.13 (0.67) (0.11) (1.53) (3.06) (4.08)
KKR NYC CREDIT A & B 228 0.23 0.00 5.54 21.59 5.54 15.74 19.71 (0.97) 2.38 26.56 12/01/2017
Opportunistic Fixed Income JPMGHY / CSFB 50/50 Blend Plus 300 0.54 1.60 13.24 1.60 6.95 17.35 0.88 14.66 2.36 12/01/2017
Excess (0.54) 3.95 8.35 3.95 8.79 2.36 (1.85) (12.28) 24.20
KKR NYC Credit C 16 0.02 0.00 0.33 25.24 0.33 19.40 09/01/2020
Opportunistic Fixed Income JPMGHY / CSFB 50/50 Blend Plus 300 0.54 1.60 13.24 1.60 6.95 09/01/2020
Excess (0.54) (1.26) 12.00 (1.26) 12.45
Maranon Partnership 119 0.12 0.93 3.81 24.47 3.81 13.35 13.53 0.83 7.72 09/01/2018
Opportunistic Fixed Income JPMGHY / CSFB 50/50 Blend Plus 300 0.54 1.60 13.24 1.60 6.95 17.35 0.88 14.66 09/01/2018
Excess 0.39 2.22 11.23 2.22 6.41 (3.82) (0.06) (6.94)
Marathon Centre Street Partnership, L.P. 420 0.41 1.37 7.20 31.20 7.20 29.21 31.03 (8.92) 1.39 3.76 01/01/2012
Opportunistic Fixed Income JPMGHY / CSFB 50/50 Blend Plus 300 0.54 1.60 13.24 1.60 6.95 17.35 0.88 14.66 2.36 01/01/2012
Excess 0.84 5.60 17.96 5.60 22.27 13.68 (9.80) (13.27) 1.40
Oak Hill Centre Street Partnership 402 0.40 0.81 2.40 17.37 2.40 11.97 23.28 (2.14) 6.70 7.72 10/01/2012
Opportunistic Fixed Income JPMGHY / CSFB 50/50 Blend Plus 300 0.54 1.60 13.24 1.60 6.95 17.35 0.88 14.66 2.36 10/01/2012
Excess 0.28 0.80 4.13 0.80 5.02 5.93 (3.02) (7.97) 5.36
TOTAL TEACHERS ETI (w/o cash) 703 0.70 (0.72) 0.25 (0.48) 0.25 (0.53) 0.63 7.48 8.57 0.77 12/01/1984
Teachers Custom Benchmark (No Cash) (0.58) 0.11 (0.48) 0.11 (0.98) (0.20) 7.51 7.65 0.86 12/01/1984
Excess (0.14) 0.14 0.01 0.14 0.46 0.83 (0.04) 0.91 (0.09)
AFL-CIO Housing Investment Trust 323 0.32 (0.84) (0.15) (0.83) (0.15) (0.88) 0.12 7.03 7.78 0.16 10/01/2002
Bloomberg U.S. Aggregate (0.87) 0.05 (0.90) 0.05 (1.55) (0.33) 8.74 8.72 0.01 10/01/2002
Excess 0.03 (0.20) 0.06 (0.20) 0.67 0.45 (1.70) (0.94) 0.15
RBC Access MBS 160 0.16 (0.41) 0.46 (0.32) 0.46 (0.36) 0.08 7.55 7.21 0.49 03/01/2007
Access RBC Benchmark (0.50) 0.00 (0.88) 0.00 (0.99) (0.76) 6.29 6.05 1.17 03/01/2007
Excess 0.09 0.47 0.56 0.47 0.64 0.84 1.26 1.16 (0.69)
CPC Construction Facility 11 0.01 0.10 1.02 3.01 1.02 3.30 2.64 3.12 4.98 4.14 08/01/2014
CPC CONST BENCHMARK 0.20 0.60 2.43 0.60 1.81 2.45 3.44 4.09 3.99 08/01/2014
Excess (0.10) 0.42 0.58 0.42 1.49 0.20 (0.32) 0.89 0.15
30

Assets
($MM) % of Total
Trailing
1 Month
Trailing
3 Month
Trailing
1 Year FYTD CYTD FYE 6/30/21
FYE
6/30/20
CYE
12/31/19
CYE
12/31/18 Inception Date
Periods Ending September 30, 2021
New York City Teachers' Retirement SystemManager / Benchmark Comparison Report
Rates of Return - Net Mgr
TRS-CPC PPAR GNMA 54 0.05 (0.28) 0.27 0.31 0.27 (0.06) 1.90 5.68 4.89 0.77 11/01/2001
GNMA Plus 65bps (0.19) 0.15 0.17 0.15 (0.51) (0.14) 6.00 6.73 1.63 11/01/2001
Excess (0.08) 0.11 0.15 0.11 0.44 2.04 (0.32) (1.85) (0.86)
CPC PPAR FNMA 86 0.08 (1.02) 0.86 (0.60) 0.86 0.23 1.54 7.80 13.18 2.31 08/01/2013
FNMA Plus 85bps (0.28) 0.30 0.36 0.30 (0.13) 0.51 7.21 7.80 1.86 08/01/2013
Excess (0.74) 0.57 (0.95) 0.57 0.36 1.03 0.60 5.38 0.45
ECLF PPAR FNMA 2 0.00 (1.18) 0.86 (3.79) 0.86 (1.64) (0.03) 06/01/2020
FNMA Plus 85bps (0.28) 0.30 0.36 0.30 (0.13) 0.51 06/01/2020
Excess (0.91) 0.56 (4.15) 0.56 (1.51) (0.55)
BOA PPAR FNMA 8 0.01 (1.12) 0.62 (3.34) 0.62 (1.71) (1.21) 9.05 13.54 2.33 12/01/2013
FNMA Plus 85bps (0.28) 0.30 0.36 0.30 (0.13) 0.51 7.21 7.80 1.86 12/01/2013
Excess (0.84) 0.32 (3.70) 0.32 (1.58) (1.72) 1.85 5.74 0.47
CFSB PPAR FNMA 1 0.00 (1.32) 0.78 17.93 0.78 (1.95) 10/01/2020
FNMA Plus 85bps (0.28) 0.30 0.36 0.30 (0.13) 10/01/2020
Excess (1.04) 0.48 17.57 0.48 (1.82)
CFSB PPAR GNMA 2 0.00 (0.29) 0.77 1.01 0.77 0.60 2.07 5.97 5.91 0.99 10/01/2006
GNMA Plus 65bps (0.19) 0.15 0.17 0.15 (0.51) (0.14) 6.00 6.73 1.63 10/01/2006
Excess (0.10) 0.62 0.84 0.62 1.10 2.22 (0.03) (0.82) (0.65)
Citibank PPAR GNMA 4 0.00 (0.31) (0.33) (0.25) (0.33) (0.57) 2.05 5.89 5.33 1.90 12/01/2006
GNMA Plus 65bps (0.19) 0.15 0.17 0.15 (0.51) (0.14) 6.00 6.73 1.63 12/01/2006
Excess (0.11) (0.48) (0.42) (0.48) (0.06) 2.19 (0.10) (1.41) 0.27
Citibank PPAR FNMA 25 0.02 (1.12) 0.77 (3.09) 0.77 (1.45) (0.97) 15.33 19.71 2.63 12/01/2013
FNMA Plus 85bps (0.28) 0.30 0.36 0.30 (0.13) 0.51 7.21 7.80 1.86 12/01/2013
Excess (0.84) 0.47 (3.45) 0.47 (1.31) (1.48) 8.12 11.91 0.77
LIIF PPAR GNMA 2 0.00 (0.07) 0.72 1.54 0.72 1.14 2.04 5.68 5.54 2.53 08/01/2009
GNMA Plus 65bps (0.19) 0.15 0.17 0.15 (0.51) (0.14) 6.00 6.73 1.63 08/01/2009
Excess 0.13 0.57 1.37 0.57 1.65 2.18 (0.32) (1.19) 0.89
LIIF PPAR FNMA 12 0.01 (1.10) 0.72 (3.14) 0.72 (1.61) (1.01) 11.85 16.35 2.27 11/01/2013
FNMA Plus 85bps (0.28) 0.30 0.36 0.30 (0.13) 0.51 7.21 7.80 1.86 11/01/2013
Excess (0.82) 0.42 (3.49) 0.42 (1.48) (1.52) 4.64 8.55 0.41
LISC PPAR FNMA 3 0.00 (1.19) 0.82 15.41 0.82 (1.65) 17.94 14.27 14.95 11/01/2018
FNMA Plus 85bps (0.28) 0.30 0.36 0.30 (0.13) 0.51 7.21 7.80 11/01/2018
Excess (0.91) 0.52 15.05 0.52 (1.51) 17.42 7.06 7.15
NCBCI PPAR GNMA 1 0.00 (0.11) 0.85 2.24 0.85 1.49 3.07 5.39 3.69 1.23 08/01/2009
GNMA Plus 65bps (0.19) 0.15 0.17 0.15 (0.51) (0.14) 6.00 6.73 1.63 08/01/2009
Excess 0.08 0.70 2.07 0.70 2.00 3.21 (0.61) (3.04) (0.41)
NCBCI PPAR FNMA 0 0.00 (0.17) 0.86 0.28 0.86 1.23 2.86 6.88 4.08 2.00 11/01/2013
FNMA Plus 85bps (0.28) 0.30 0.36 0.30 (0.13) 0.51 7.21 7.80 1.86 11/01/2013
Excess 0.11 0.56 (0.08) 0.56 1.37 2.35 (0.33) (3.72) 0.15
NHS PPAR GNMA 0 0.00 (0.06) 0.95 2.62 0.95 1.79 3.39 3.60 2.90 0.54 09/01/2007
GNMA Plus 65bps (0.19) 0.15 0.17 0.15 (0.51) (0.14) 6.00 6.73 1.63 09/01/2007
Excess 0.14 0.80 2.45 0.80 2.29 3.53 (2.40) (3.84) (1.09)
Wells Fargo PPAR FNMA 7 0.01 (1.27) 0.81 17.09 0.81 (1.81) 19.77 9.39 21.71 01/01/2017
FNMA Plus 85bps (0.28) 0.30 0.36 0.30 (0.13) 0.51 7.21 7.80 1.86 01/01/2017
Excess (0.99) 0.52 16.73 0.52 (1.68) 19.25 2.18 13.91
31

Assets
($MM) % of Total
Trailing
1 Month
Trailing
3 Month
Trailing
1 Year FYTD CYTD FYE 6/30/21
FYE
6/30/20
CYE
12/31/19
CYE
12/31/18 Inception Date
Periods Ending September 30, 2021
New York City Teachers' Retirement SystemManager / Benchmark Comparison Report
Rates of Return - Net Mgr
TRS-TOTAL CASH 943 0.93 0.15 0.23 0.60 0.23 0.47 0.47 2.72 3.12 2.36 04/01/2004
ICE BofA US 3-Month Treasury Bill 0.01 0.01 0.07 0.01 0.04 0.09 1.63 2.28 1.87 04/01/2004
Excess 0.14 0.21 0.53 0.21 0.43 0.38 1.10 0.84 0.49
Short Term TRS 941 0.93 0.00 0.05 0.18 0.05 0.13 0.19 1.46 2.25 1.96 04/01/1982
ICE BofA US 3-Month Treasury Bill 0.01 0.01 0.07 0.01 0.04 0.09 1.63 2.28 1.87 04/01/1982
Excess 0.00 0.04 0.11 0.04 0.09 0.10 (0.17) (0.03) 0.09
Cash Account 1 0.00 04/04/2004
KKR Cash Account
Securities Lending 0 0.00 04/01/2004
TRS-TOTAL PRIVATE EQUITY 6,852 6.77 0.34 11.15 51.19 11.15 35.54 50.86 2.22 12.07 17.65 04/01/2004
TRS-TOTAL PRIVATE REAL ESTATE 4,153 4.11 0.35 5.37 15.04 5.37 13.19 8.41 0.18 4.65 10.64 04/01/2004
TRS-TOTAL INFRASTRUCTURE 1,339 1.32 0.17 1.63 15.47 1.63 10.91 18.84 6.42 12.06 14.50 12/01/2013
32

Vintage
YearInvestment
First
Drawdown
Committed
CapitalPaid-In Capital Distributed Capital Market Value Multiple IRR
2 PME
Benchmark3 PME Spread
4
Active Investments
1999 Cypress Merchant Banking Partners II, LP 7/8/1999 $50,000,000 $53,983,573 $50,623,035 $22,365 0.94x (1.18%) 5.55% (6.72%)1999 Lincolnshire Equity Fund II, L.P. 2/26/2001 15,000,000 14,446,100 28,316,507 252,218 1.98x 24.58% 7.00% 17.58%2000 SCP Private Equity Partners II, L.P. 1/19/2001 20,000,000 22,196,012 8,429,680 1,094,462 0.43x (9.91%) 5.57% (15.47%)2001 Apollo Investment Fund V, L.P. 8/23/2001 30,000,000 46,758,049 92,244,552 257,836 1.98x 38.77% 8.34% 30.43%2001 RRE Ventures III, L.P. 6/13/2002 20,000,000 26,269,971 34,025,652 1,276,415 1.34x 5.42% 6.61% (1.19%)2002 Thomas McNerney & Partners, L.P. 11/26/2002 15,000,000 15,000,000 7,543,579 1,592,093 0.61x (7.30%) 10.59% (17.89%)2003 Ares Corporate Opportunities Fund, L.P. 5/4/2004 15,000,000 18,004,666 26,835,382 155,987 1.50x 13.11% 7.41% 5.70%2003 Blackstone Capital Partners IV, L.P. 1/10/2003 30,000,000 30,690,321 77,506,027 206,917 2.53x 37.80% 8.24% 29.56%2003 FS Equity Partners V, L.P. 5/30/2003 25,000,000 20,204,332 40,645,843 2,266,062 2.12x 15.36% 5.16% 10.20%2003 Leeds Weld Equity Partners IV, L.P. 12/13/2004 15,000,000 15,441,454 20,171,550 25,103 1.31x 4.23% 5.50% (1.27%)2004 FdG Capital Partners II, L.P. 8/30/2004 35,000,000 37,720,808 44,959,148 802,770 1.21x 3.68% 6.75% (3.07%)2004 Lincolnshire Equity Fund III, L.P. 12/23/2004 25,000,000 25,003,156 35,566,467 8,233,831 1.75x 27.61% 12.16% 15.45%2004 Markstone Capital Partners, L.P. 7/21/2004 35,000,000 40,766,689 17,074,753 163,685 0.42x (37.50%) 10.82% (48.32%)2004 New York/Fairview Emerging Managers (Tranche A), L.P. 10/21/2004 24,000,000 24,646,553 25,847,632 1,759,112 1.12x 1.88% 8.71% (6.83%)2004 Yucaipa American Alliance Fund I, L.P. 10/1/2004 55,000,000 80,825,203 95,185,290 503,145 1.18x 4.00% 10.71% (6.71%)2005 JP Morgan Fleming (Tranche A), L.P. 12/21/2005 31,000,000 31,347,079 35,369,803 8,044,642 1.38x 5.78% 11.09% (5.31%)2005 New Mountain Partners II, L.P. 1/12/2005 23,225,800 21,482,843 40,969,939 245,756 1.92x 13.60% 4.46% 9.14%2005 Palladium Equity Partners III, L.P. 8/10/2005 35,000,000 37,593,450 70,021,849 244,135 1.87x 14.66% 11.10% 3.56%2005 Snow Phipps Group, L.P. 8/2/2007 15,000,000 18,279,058 15,590,643 6,975,044 1.23x 4.41% 11.67% (7.26%)2005 USPF II Institutional Fund, L.P. 11/23/2005 35,000,000 46,164,567 53,817,886 4,148,786 1.26x 3.81% 7.78% (3.97%)2006 Aisling Capital II, L.P. 1/12/2006 4,500,000 5,099,563 5,112,601 152,303 1.03x 0.59% 7.98% (7.39%)2006 Ampersand 2006, L.P. 7/6/2007 15,000,000 15,000,000 46,844,870 354,287 3.15x 16.95% 8.95% 8.00%2006 Apollo Investment Fund VI, L.P. 5/10/2006 35,000,000 45,048,207 67,409,336 663,743 1.51x 8.66% 7.60% 1.06%2006 Ares Corporate Opportunities Fund II, L.P. 5/23/2006 30,000,000 32,905,774 54,882,374 38,557 1.67x 13.05% 3.80% 9.25%2006 Arsenal Capital Partners II, L.P. 12/19/2006 13,500,000 16,525,966 31,930,803 135,353 1.94x 12.08% 11.99% 0.09%2006 BDCM Opportunity Fund II, L.P. 12/28/2006 25,000,000 37,325,097 101,591,326 2,794,833 2.80x 18.40% 11.77% 6.63%2006 Blackstone Capital Partners V, L.P. 4/13/2006 75,600,000 76,527,599 127,604,487 1,998,981 1.69x 8.49% 8.40% 0.09%2006 Catterton Partners VI, L.P. 12/14/2006 30,000,000 34,300,531 55,451,382 9,648,679 1.90x 11.47% 9.21% 2.26%2006 Cinven Fourth Fund 1/22/2007 43,264,875 45,626,616 65,913,468 31,924 1.45x 7.37% 7.65% (0.28%)2006 Fairview Ventures Fund III, L.P. 7/13/2007 20,000,000 21,297,659 37,756,071 17,714,845 2.60x 15.76% 13.03% 2.74%2006 First Reserve Fund XI, L.P. 12/22/2006 30,000,000 34,241,400 22,606,219 279,128 0.67x (9.96%) 6.18% (16.15%)2006 GF Capital Private Equity Fund, L.P. 3/20/2008 15,000,000 15,773,790 20,491,630 6,810,213 1.73x 11.36% 12.78% (1.43%)2006 Landmark Equity Partners XIII, L.P. 5/15/2006 25,000,000 23,702,196 31,569,537 12,144 1.33x 5.02% 6.91% (1.89%)2006 MidOcean Partners III, L.P. 6/19/2007 40,000,000 46,531,512 94,161,035 6,355,743 2.16x 13.33% 9.97% 3.36%2006 RRE Ventures IV, L.P. 10/25/2006 25,000,000 31,745,125 25,386,731 45,037,493 2.22x 9.54% 11.83% (2.29%)2006 Terra Firma Capital Partners III, L.P. 2/26/2007 31,062,553 31,617,341 14,313,105 122,918 0.46x (9.28%) 10.04% (19.31%)2006 Thomas, McNerney & Partners II, L.P. 11/30/2006 15,000,000 14,867,607 32,724,518 1,297,664 2.29x 16.58% 11.60% 4.97%2007 Carlyle Partners V, L.P. 9/28/2007 50,000,000 50,852,090 84,820,455 6,407,849 1.79x 13.27% 11.08% 2.19%2007 Co-Investment Partners Europe, L.P. 12/5/2008 26,450,112 29,219,332 35,608,493 867,506 1.25x 4.39% 15.22% (10.83%)2007 Constellation Ventures III, L.P. 11/20/2008 15,000,000 17,295,938 8,712,259 6,302,127 0.87x (1.99%) 16.46% (18.44%)2007 FTVentures III, L.P. 3/1/2007 14,081,947 14,882,466 25,170,138 3,707,681 1.94x 11.22% 10.34% 0.87%2007 GSO Capital Opportunities Fund, L.P. 8/15/2008 30,000,000 48,291,339 67,124,625 444,237 1.40x 17.31% 10.15% 7.16%2007 Halyard Capital Fund II, L.P. 11/2/2007 15,000,000 13,049,651 15,892,840 3,555,180 1.49x 6.84% 10.15% (3.31%)2007 Montreux Equity Partners IV, L.P. 3/27/2007 15,000,000 14,930,359 8,224,849 12,242,758 1.37x 4.20% 10.89% (6.69%)2007 Nautic Partners VI, L.P. 6/30/2008 20,000,000 21,690,958 48,235,098 4,616,149 2.44x 18.64% 12.18% 6.46%2007 New Mountain Partners III, L.P. 9/25/2007 35,000,000 36,096,218 61,631,034 26,077,428 2.43x 14.74% 13.14% 1.60%2007 PCG Clean Energy & Technology Fund East, L.P. 4/25/2008 60,000,000 51,863,265 15,962,869 2,523,075 0.36x (13.79%) 12.92% (26.71%)2007 Pegasus Partners IV, L.P. 10/9/2007 20,000,000 26,382,521 20,483,112 3,876,373 0.92x (1.58%) 11.33% (12.91%)2007 Pine Brook Capital Partners, L.P. 4/7/2008 22,500,000 24,872,461 33,545,188 298,011 1.36x 8.08% 12.09% (4.01%)2007 Quaker BioVentures II, L.P. 4/18/2008 15,000,000 14,977,775 15,516,569 2,493,973 1.20x 3.83% 12.73% (8.89%)2007 RLJ Equity Partners Fund I, L.P. 4/14/2009 15,000,000 15,524,067 19,169,909 5,123,965 1.56x 9.41% 14.06% (4.65%)2007 SCP Vitalife Partners II, L.P. 1/10/2008 15,000,000 15,074,774 1,184 3,890,949 0.26x (12.94%) 4.15% (17.09%)2007 StarVest Partners II, L.P. 12/8/2008 20,000,000 20,106,956 9,298,483 9,070,997 0.91x (1.16%) 13.81% (14.98%)2007 Trilantic Capital Partners IV L.P. 10/22/2007 53,311,339 55,744,551 83,401,072 3,242,445 1.55x 13.44% 11.29% 2.15%2007 USPF III Institutional Fund, L.P. 7/10/2007 30,000,000 35,493,985 36,671,765 7,949,105 1.26x 3.92% 9.71% (5.79%)2007 Vista Equity Partners Fund III, L.P. 11/30/2007 25,000,000 26,920,742 63,887,396 2,073,632 2.45x 26.85% 9.94% 16.91%2008 Aisling Capital III, L.P. 11/20/2008 10,500,000 11,845,455 28,147,445 112,143 2.39x 26.48% 14.33% 12.15%2008 Apollo Investment Fund VII, L.P. 4/16/2008 50,000,000 61,235,950 101,566,819 3,965,835 1.72x 23.01% 13.72% 9.29%2008 Ares Corporate Opportunities Fund III, L.P. 7/30/2008 60,000,000 71,462,853 155,210,131 4,412,355 2.23x 21.13% 12.16% 8.97%2008 Avista Capital Partners II, L.P. 12/31/2008 50,000,000 65,983,085 103,339,707 3,889,232 1.63x 14.37% 14.81% (0.44%)2008 Blue Wolf Capital Fund II, L.P. 11/14/2008 20,000,000 22,198,437 36,555,548 433,868 1.67x 10.55% 15.36% (4.80%)2008 Bridgepoint Europe IV, L.P. 9/30/2008 26,631,010 25,122,867 33,847,774 4,774,848 1.54x 9.61% 14.95% (5.34%)2008 First Reserve Fund XII, L.P. 11/14/2008 30,000,000 33,919,785 17,372,325 1,863,694 0.57x (15.80%) 17.17% (32.97%)2008 GCM Grosvenor TRSCNY Emerging Manager Fund, L.P. 8/22/2008 59,373,737 74,657,288 74,151,332 35,337,266 1.47x 9.74% 14.11% (4.37%)2008 GI Partners III, L.P. 7/29/2008 30,000,000 32,411,558 50,818,605 32,907 1.57x 12.96% 15.32% (2.36%)2008 Landmark Equity Partners XIV, L.P. 9/19/2008 50,000,000 48,646,718 57,097,435 7,251,909 1.32x 8.98% 13.29% (4.31%)2008 Leeds Equity Partners V, L.P. 7/28/2008 40,000,000 40,739,807 70,220,452 32,054,300 2.51x 19.10% 14.03% 5.06%2008 Levine Leichtman Capital Partners IV, L.P. 9/22/2008 25,000,000 26,635,586 42,262,426 3,524,608 1.72x 18.30% 14.40% 3.90%2008 New York/Fairview Emerging Managers (Tranche B), L.P. 5/28/2008 35,000,000 35,461,815 69,629,165 34,917,331 2.95x 19.92% 13.81% 6.11%2008 NGN BioMed Opportunity II, L.P. 10/31/2008 15,000,000 14,363,866 10,009,657 7,060,841 1.19x 2.39% 15.31% (12.92%)2008 Onex Partners III, L.P. 3/31/2009 40,000,000 43,880,706 60,077,987 10,879,690 1.62x 11.37% 15.24% (3.87%)2008 Paladin III (NY City), L.P. 1/8/2008 20,000,000 26,725,893 48,758,329 25,836,280 2.79x 16.47% 12.82% 3.65%2008 Riverstone/Carlyle Global Energy & Power Fund IV 9/29/2008 32,500,000 35,107,279 37,928,141 1,531,785 1.12x 3.11% 13.86% (10.75%)2008 Yucaipa American Alliance Fund II, L.P. 3/28/2008 75,000,000 104,448,677 109,978,666 63,973,531 1.67x 8.64% 12.91% (4.27%)2008 Yucaipa Corporate Initiatives Fund II, L.P. 6/23/2008 35,000,000 32,157,997 19,205,889 8,802,749 0.87x (1.93%) 12.36% (14.30%)2009 Lincolnshire Equity Fund IV, L.P. 8/7/2009 12,500,000 12,827,632 14,882,536 3,595,711 1.44x 8.30% 13.88% (5.57%)2009 Welsh, Carson, Anderson & Stowe XI, L.P. 2/10/2009 30,000,000 30,000,000 41,241,446 8,276,385 1.65x 11.69% 15.11% (3.42%)2010 JP Morgan Fleming (Tranche B), L.P. 3/31/2008 10,000,000 10,523,354 10,593,927 8,867,250 1.85x 11.66% 14.15% (2.49%)2010 Trident V, L.P. 12/30/2010 35,000,000 41,282,039 49,201,447 22,936,342 1.75x 11.61% 13.26% (1.65%)2011 American Securities Partners VI, L.P. 1/10/2012 100,000,000 110,849,763 166,476,481 75,146,210 2.18x 22.55% 14.05% 8.51%2011 Ampersand 2011, L.P. 3/11/2011 17,500,000 17,500,000 56,677,681 477,311 3.27x 21.89% 13.02% 8.87%2011 AXA Secondary Fund V L.P. 8/11/2011 160,000,000 85,770,811 131,626,667 471,556 1.54x 13.52% 15.33% (1.81%)2011 BC European Capital IX, L.P. 9/19/2011 70,934,544 74,739,931 73,956,964 78,910,968 2.05x 16.61% 14.57% 2.05%2011 Blackstone Capital Partners VI, L.P. 1/24/2011 60,000,000 61,831,638 63,227,682 35,792,019 1.60x 11.01% 13.12% (2.11%)2011 EQT VI, L.P. 8/1/2011 48,690,253 52,345,637 74,251,457 14,818,984 1.70x 13.46% 12.77% 0.69%2011 Pegasus Partners V, L.P. 8/16/2011 20,789,916 26,111,208 15,150,824 20,323,668 1.36x 7.01% 15.07% (8.06%)2011 Vista Equity Partners IV, L.P. 11/30/2011 100,000,000 99,606,080 127,781,687 65,881,688 1.94x 15.66% 14.41% 1.26%2012 Green Equity Investors VI, L.P. 11/30/2012 100,000,000 110,788,089 83,730,305 123,318,771 1.87x 15.22% 14.15% 1.07%2012 Ares Corporate Opportunities Fund IV, L.P. 11/5/2012 105,000,000 115,840,388 143,657,263 67,672,873 1.82x 15.66% 12.74% 2.93%2011 Platinum Equity Capital Partners III, L.P. 1/14/2013 115,000,000 112,379,693 198,212,437 32,376,061 2.05x 36.86% 13.81% 23.05%2012 Trilantic Capital Partners V (North America), L.P. 9/20/2012 70,000,000 74,577,626 76,089,167 42,331,797 1.59x 16.04% 13.93% 2.11%2012 Warburg Pincus Private Equity XI, L.P. 5/24/2012 175,000,000 177,964,925 197,889,302 97,597,609 1.66x 12.42% 13.74% (1.32%)2012 NYCTRS - 2012 Emerging Manager Program* 2/7/2013 158,050,000 166,336,017 135,323,557 220,243,313 2.14x 14.12% 13.44% 0.68%2013 Apollo Investment Fund VIII, L.P. 12/11/2013 200,000,000 190,199,234 117,998,150 174,089,520 1.54x 12.52% 14.66% (2.14%)2013 Carlyle Partners VI, L.P. 7/3/2013 125,000,000 133,892,517 84,320,529 158,349,900 1.81x 16.65% 14.22% 2.43%2014 CVC Capital Partners VI, L.P. 2/18/2014 206,659,750 182,068,177 89,761,805 223,580,392 1.72x 16.76% 15.01% 1.75%2013 Landmark Equity Partners XV, L.P. 10/30/2013 113,000,000 90,758,387 68,702,337 56,726,272 1.38x 13.15% 13.92% (0.77%)2013 Landmark Equity Partners XV, L.P. - Side Car 12/24/2013 37,000,000 33,561,925 26,272,196 30,981,939 1.71x 19.77% 13.29% 6.48%2013 Crestview Partners III, L.P. 3/3/2015 75,000,000 60,787,123 33,476,840 54,686,625 1.45x 13.72% 15.61% (1.90%)2014 Crestview Partners III (Co-Investment B), L.P. 12/17/2015 25,000,000 25,908,372 1,253,803 28,073,174 1.13x 3.41% 17.36% (13.95%)2014 Carlyle Partners VI, L.P. - Side Car 9/23/2014 13,750,000 10,016,720 4,713,428 15,919,661 2.06x 15.32% 14.68% 0.64%2014 Olympus Growth Fund VI, L.P. 1/21/2014 100,000,000 95,350,483 61,027,757 81,712,692 1.50x 13.91% 15.33% (1.41%)2013 ASF VI, L.P. 5/9/2014 112,000,000 88,126,972 109,814,232 16,574,089 1.43x 12.14% 12.60% (0.45%)2014 ASF VI NYC Co-Invest, L.P. 5/9/2014 38,000,000 30,975,418 35,776,969 12,336,861 1.55x 14.11% 10.61% 3.50%2015 Centerbridge Capital Partners III, L.P. 5/21/2015 33,500,000 37,937,760 20,490,026 38,356,601 1.55x 20.00% 16.16% 3.83%2014 Lexington Capital Partners VIII, L.P. 1/8/2015 150,000,000 136,208,391 95,500,192 114,071,760 1.54x 18.97% 15.50% 3.47%2014 Vista Equity Partners Fund V, L.P. 9/8/2014 125,000,000 153,933,970 150,243,916 160,738,880 2.02x 21.15% 13.78% 7.37%2015 Siris Partners III, L.P. 5/4/2015 45,000,000 46,558,766 24,656,009 42,872,648 1.45x 14.67% 15.21% (0.54%)2016 American Securities Partners VII, L.P. 7/8/2016 111,000,000 106,299,939 18,514,706 118,927,261 1.29x 9.79% 17.77% (7.98%)2015 ASF VII, L.P. 12/29/2015 134,000,000 74,225,695 40,920,389 67,333,051 1.46x 17.12% 19.01% (1.89%)2015 ASF VII B NYC Co-Invest, L.P. 12/29/2015 67,000,000 37,589,585 26,804,464 36,659,629 1.69x 22.56% 15.03% 7.53%2014 Bridgepoint Europe V, L.P. 2/8/2016 88,748,709 78,731,731 52,901,571 86,053,729 1.76x 19.43% 16.22% 3.20%2016 FTV V, L.P. 5/1/2017 24,000,000 24,527,395 8,334,589 52,309,218 2.47x 44.07% 18.70% 25.37%2015 Stellex Capital Partners, L.P. 2/22/2016 28,000,000 25,269,156 21,132,222 16,116,178 1.47x 21.58% 17.85% 3.73%2018 ICV Partners IV, L.P. 5/30/2018 20,000,000 8,451,364 166,836 9,493,440 1.14x 10.37% 26.33% (15.96%)2018 Heartwood Partners III, LP 5/30/2018 18,000,000 11,387,705 1,433,382 12,648,628 1.24x 15.82% 19.99% (4.17%)
Teachers' Retirement System of the City of New York
Private Equity Portfolio
As of March 31, 2021 (in USD)
33
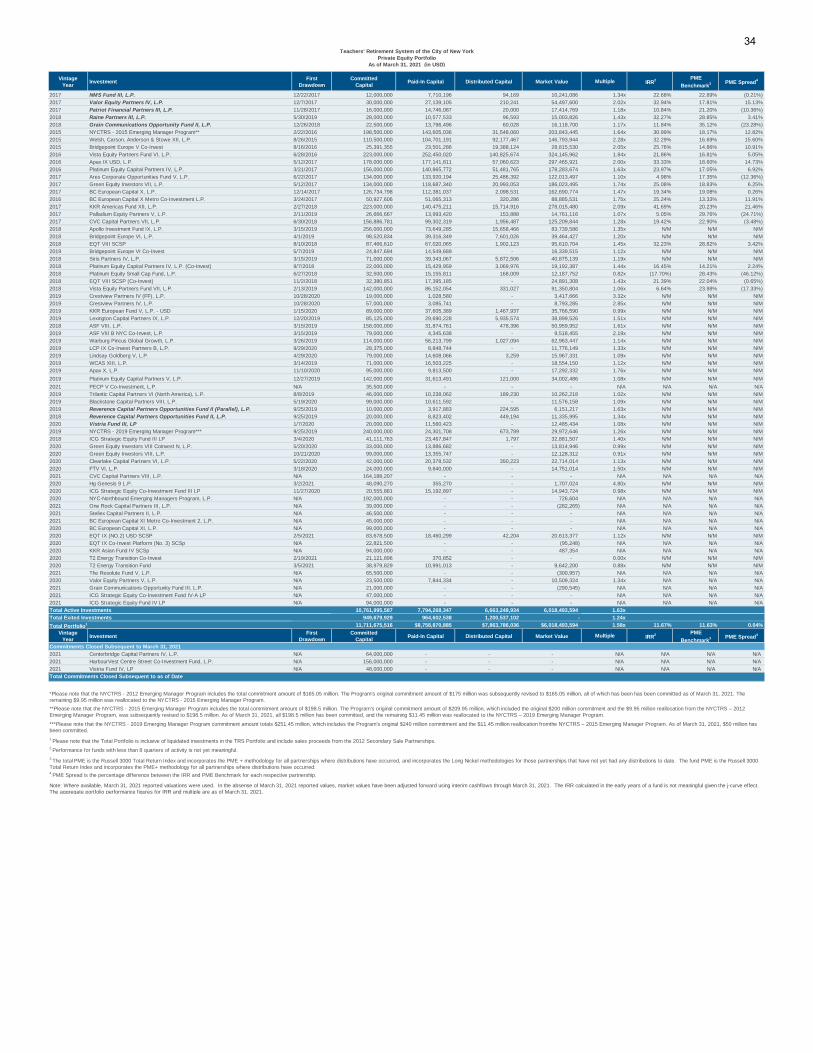
Vintage
YearInvestment
First
Drawdown
Committed
CapitalPaid-In Capital Distributed Capital Market Value Multiple IRR
2 PME
Benchmark3 PME Spread
4
Teachers' Retirement System of the City of New York
Private Equity Portfolio
As of March 31, 2021 (in USD)
2017 NMS Fund III, L.P. 12/22/2017 12,000,000 7,710,196 94,169 10,241,086 1.34x 22.68% 22.89% (0.21%)2017 Valor Equity Partners IV, L.P. 12/7/2017 30,000,000 27,139,105 210,241 54,497,600 2.02x 32.94% 17.81% 15.13%2017 Patriot Financial Partners III, L.P. 11/28/2017 16,000,000 14,746,087 20,000 17,414,769 1.18x 10.84% 21.20% (10.36%)2018 Raine Partners III, L.P. 5/30/2019 28,000,000 10,577,533 96,593 15,003,826 1.43x 32.27% 28.85% 3.41%2018 Grain Communications Opportunity Fund II, L.P. 12/26/2018 22,500,000 13,796,496 60,028 16,118,700 1.17x 11.84% 35.12% (23.28%)2015 NYCTRS - 2015 Emerging Manager Program** 2/22/2016 198,500,000 143,605,036 31,548,060 203,843,445 1.64x 30.99% 18.17% 12.82%2015 Welsh, Carson, Anderson & Stowe XII, L.P. 8/26/2015 110,500,000 104,701,191 92,177,467 146,793,944 2.28x 32.29% 16.69% 15.60%2015 Bridgepoint Europe V Co-Invest 8/16/2016 25,391,355 23,501,286 19,388,124 28,815,530 2.05x 25.76% 14.86% 10.91%2016 Vista Equity Partners Fund VI, L.P. 6/28/2016 223,000,000 252,450,020 140,825,674 324,145,962 1.84x 21.86% 16.81% 5.05%2016 Apax IX USD, L.P. 5/12/2017 178,000,000 177,141,811 57,060,623 297,465,921 2.00x 33.33% 18.60% 14.73%2016 Platinum Equity Capital Partners IV, L.P. 3/21/2017 156,000,000 140,865,772 51,481,765 178,283,674 1.63x 23.97% 17.05% 6.92%2017 Ares Corporate Opportunities Fund V, L.P. 6/22/2017 134,000,000 133,920,194 25,486,392 122,013,497 1.10x 4.98% 17.35% (12.36%)2017 Green Equity Investors VII, L.P. 5/12/2017 134,000,000 118,687,340 20,993,053 186,023,495 1.74x 25.08% 18.83% 6.25%2017 BC European Capital X, L.P. 12/14/2017 126,734,798 112,381,037 2,098,531 162,690,774 1.47x 19.34% 19.08% 0.26%2016 BC European Capital X Metro Co-Investment L.P. 3/24/2017 50,927,606 51,065,313 320,286 88,885,531 1.75x 25.24% 13.33% 11.91%2017 KKR Americas Fund XII, L.P. 2/27/2018 223,000,000 140,475,211 15,714,916 278,015,480 2.09x 41.69% 20.23% 21.46%2017 Palladium Equity Partners V, L.P. 2/11/2019 26,666,667 13,993,420 153,888 14,761,116 1.07x 5.05% 29.76% (24.71%)2017 CVC Capital Partners VII, L.P. 6/30/2018 156,886,781 99,302,319 1,956,487 125,209,844 1.28x 19.42% 22.90% (3.48%)2018 Apollo Investment Fund IX, L.P. 3/15/2019 256,000,000 73,649,285 15,658,466 83,739,586 1.35x N/M N/M N/M2018 Bridgepoint Europe VI, L.P. 4/1/2019 98,520,834 39,316,349 7,601,026 39,464,427 1.20x N/M N/M N/M2018 EQT VIII SCSP 8/10/2018 87,466,610 67,020,065 1,902,123 95,610,704 1.45x 32.23% 28.82% 3.42%2019 Bridgepoint Europe VI Co-Invest 5/7/2019 24,847,694 14,549,689 - 16,339,515 1.12x N/M N/M N/M2018 Siris Partners IV, L.P. 3/15/2019 71,000,000 39,343,067 5,872,506 40,875,139 1.19x N/M N/M N/M2018 Platinum Equity Capital Partners IV, L.P. (Co-Invest) 9/7/2018 22,000,000 15,429,959 3,069,976 19,192,387 1.44x 16.45% 14.21% 2.24%2018 Platinum Equity Small Cap Fund, L.P. 6/27/2018 32,500,000 15,155,811 168,009 12,187,752 0.82x (17.70%) 28.43% (46.12%)2018 EQT VIII SCSP (Co-Invest) 11/2/2018 32,380,851 17,395,185 - 24,891,308 1.43x 21.39% 22.04% (0.65%)2018 Vista Equity Partners Fund VII, L.P. 2/13/2019 142,000,000 86,152,054 331,027 91,350,804 1.06x 6.64% 23.98% (17.33%)2019 Crestview Partners IV (FF), L.P. 10/28/2020 19,000,000 1,028,580 - 3,417,666 3.32x N/M N/M N/M2019 Crestview Partners IV, L.P. 10/28/2020 57,000,000 3,085,741 - 8,793,285 2.85x N/M N/M N/M2019 KKR European Fund V, L.P. - USD 1/15/2020 89,000,000 37,605,389 1,467,937 35,766,590 0.99x N/M N/M N/M2019 Lexington Capital Partners IX, L.P. 12/20/2019 85,125,000 29,690,228 5,935,574 38,899,526 1.51x N/M N/M N/M2018 ASF VIII, L.P. 3/15/2019 158,000,000 31,874,761 478,396 50,959,952 1.61x N/M N/M N/M2019 ASF VIII B NYC Co-Invest, L.P. 3/15/2019 79,000,000 4,345,638 - 9,518,455 2.19x N/M N/M N/M2019 Warburg Pincus Global Growth, L.P. 3/26/2019 114,000,000 56,213,799 1,027,094 62,963,447 1.14x N/M N/M N/M2019 LCP IX Co-Invest Partners B, L.P. 9/29/2020 28,375,000 8,848,744 - 11,776,149 1.33x N/M N/M N/M2019 Lindsay Goldberg V, L.P. 4/29/2020 79,000,000 14,608,066 3,259 15,967,331 1.09x N/M N/M N/M2019 WCAS XIII, L.P. 3/14/2019 71,000,000 16,503,225 - 18,554,150 1.12x N/M N/M N/M2019 Apax X, L.P. 11/10/2020 95,000,000 9,813,500 - 17,292,332 1.76x N/M N/M N/M2019 Platinum Equity Capital Partners V, L.P. 12/27/2019 142,000,000 31,613,491 121,000 34,002,486 1.08x N/M N/M N/M2021 PECP V Co-Investment, L.P. N/A 35,500,000 - - - N/A N/A N/A N/A2019 Trilantic Capital Partners VI (North America), L.P. 8/8/2019 46,000,000 10,238,062 189,230 10,262,218 1.02x N/M N/M N/M2019 Blackstone Capital Partners VIII, L.P. 5/19/2020 99,000,000 10,611,592 - 11,576,158 1.09x N/M N/M N/M2019 Reverence Capital Partners Opportunities Fund II (Parallel), L.P. 9/25/2019 10,000,000 3,917,883 224,595 6,151,217 1.63x N/M N/M N/M2018 Reverence Capital Partners Opportunities Fund II, L.P. 9/25/2019 20,000,000 8,823,402 449,194 11,335,995 1.34x N/M N/M N/M2020 Vistria Fund III, LP 1/7/2020 20,000,000 11,560,423 - 12,485,434 1.08x N/M N/M N/M2019 NYCTRS - 2019 Emerging Manager Program*** 9/25/2019 240,000,000 24,301,708 673,789 29,972,646 1.26x N/M N/M N/M2018 ICG Strategic Equity Fund III LP 3/4/2020 41,111,763 23,467,847 1,797 32,881,507 1.40x N/M N/M N/M2020 Green Equity Investors VIII Coinvest N, L.P. 5/20/2020 33,000,000 13,886,682 - 13,814,946 0.99x N/M N/M N/M2020 Green Equity Investors VIII, L.P. 10/21/2020 99,000,000 13,355,747 - 12,128,312 0.91x N/M N/M N/M2020 Clearlake Capital Partners VI, L.P. 5/22/2020 42,000,000 20,378,532 350,223 22,714,014 1.13x N/M N/M N/M2020 FTV VI, L.P. 3/18/2020 24,000,000 9,840,000 - 14,751,014 1.50x N/M N/M N/M2021 CVC Capital Partners VIII, L.P. N/A 164,188,207 - - - N/A N/A N/A N/A2020 Hg Genesis 9 L.P. 3/2/2021 48,090,270 355,270 - 1,707,024 4.80x N/M N/M N/M2020 ICG Strategic Equity Co-Investment Fund III LP 11/27/2020 20,555,881 15,192,897 - 14,943,724 0.98x N/M N/M N/M2020 NYC-Northbound Emerging Managers Program, L.P. N/A 192,000,000 - - 726,604 N/A N/A N/A N/A2021 One Rock Capital Partners III, L.P. N/A 39,000,000 - - (282,265) N/A N/A N/A N/A2021 Stellex Capital Partners II, L.P. N/A 46,500,000 - - - N/A N/A N/A N/A2021 BC European Capital XI Metro Co-Investment 2, L.P. N/A 45,000,000 - - - N/A N/A N/A N/A2020 BC European Capital XI, L.P. N/A 99,000,000 - - - N/A N/A N/A N/A2020 EQT IX (NO.2) USD SCSP 2/5/2021 83,678,500 18,460,299 42,204 20,613,377 1.12x N/M N/M N/M2020 EQT IX Co-Invest Platform (No. 3) SCSp N/A 22,821,500 - - (95,248) N/A N/A N/A N/A2020 KKR Asian Fund IV SCSp N/A 94,000,000 - - 487,354 N/A N/A N/A N/A2020 T2 Energy Transition Co-Invest 2/19/2021 21,121,896 370,852 - - 0.00x N/M N/M N/M2020 T2 Energy Transition Fund 3/5/2021 38,979,829 10,991,013 - 9,642,200 0.88x N/M N/M N/M2021 The Resolute Fund V, L.P. N/A 65,500,000 - - (300,957) N/A N/A N/A N/A2020 Valor Equity Partners V, L.P. N/A 23,500,000 7,844,334 - 10,509,324 1.34x N/A N/A N/A2021 Grain Communications Opportunity Fund III, L.P. N/A 21,000,000 - - (290,545) N/A N/A N/A N/A2021 ICG Strategic Equity Co-Investment Fund IV-A LP N/A 47,000,000 - - - N/A N/A N/A N/A2021 ICG Strategic Equity Fund IV LP N/A 94,000,000 - - - N/A N/A N/A N/ATotal Active Investments 10,761,995,587 7,794,268,347 6,663,248,934 6,018,493,594 1.63x
Total Exited Investments 949,679,929 964,602,538 1,200,537,102 - 1.24x
Total Portfolio1 11,711,675,516 $8,758,870,885 $7,863,786,036 $6,018,493,594 1.58x 11.67% 11.63% 0.04%
Vintage
YearInvestment
First
Drawdown
Committed
CapitalPaid-In Capital Distributed Capital Market Value Multiple IRR
2 PME
Benchmark3 PME Spread
4
Commitments Closed Subsequent to March 31, 2021
2021 Centerbridge Capital Partners IV, L.P. N/A 64,000,000 - - - N/A N/A N/A N/A2021 HarbourVest Centre Street Co-Investment Fund, L.P. N/A 156,000,000 - - - N/A N/A N/A N/A2021 Vistria Fund IV, LP N/A 48,000,000 - - - N/A N/A N/A N/A
Note: Where available, March 31, 2021 reported valuations were used. In the absense of March 31, 2021 reported values, market values have been adjusted forward using interim cashflows through March 31, 2021. The IRR calculated in the early years of a fund is not meaningful given the j-curve effect.The aggregate portfolio performance figures for IRR and multiple are as of March 31, 2021.
1 Please note that the Total Portfolio is inclusive of liquidated investments in the TRS Portfolio and include sales proceeds from the 2012 Secondary Sale Partnerships.
4 PME Spread is the percentage difference between the IRR and PME Benchmark for each respective partnership.
2 Performance for funds with less than 8 quarters of activity is not yet meaningful.3 The total PME is the Russell 3000 Total Return Index and incorporates the PME + methodology for all partnerships where distributions have occurred, and incorporates the Long Nickel methodologies for those partnerships that have not yet had any distributions to date. The fund PME is the Russell 3000 Total Return Index and incorporates the PME+ methodology for all partnerships where distributions have occurred.
*Please note that the NYCTRS - 2012 Emerging Manager Program includes the total commitment amount of $165.05 million. The Program’s original commitment amount of $175 million was subsequently revised to $165.05 million, all of which has been has been committed as of March 31, 2021. The remaining $9.95 million was reallocated to the NYCTRS - 2015 Emerging Manager Program.**Please note that the NYCTRS - 2015 Emerging Manager Program includes the total commitment amount of $198.5 million. The Program’s original commitment amount of $209.95 million, which included the original $200 million commitment and the $9.95 million reallocation from the NYCTRS – 2012 Emerging Manager Program, was subsequently revised to $198.5 million. As of March 31, 2021, all $198.5 million has been committed, and the remaining $11.45 million was reallocated to the NYCTRS – 2019 Emerging Manager Program.
***Please note that the NYCTRS - 2019 Emerging Manager Program commitment amount totals $251.45 million, which includes the Program’s original $240 million commitment and the $11.45 million reallocation fromthe NYCTRS – 2015 Emerging Manager Program. As of March 31, 2021, $50 million hasbeen committed.
Total Commitments Closed Subsequent to as of Date
34

-$275.0-$250.0-$225.0-$200.0-$175.0-$150.0-$125.0-$100.0
-$75.0-$50.0-$25.0
$0.0$25.0$50.0$75.0
$100.0$125.0$150.0$175.0$200.0$225.0$250.0$275.0
($ m
m)
NYC Teachers Monthly PE Cash Flow Summary(as of September 30, 2021)
Contributions Distributions Net Cash Flow
35

Teachers’ Retirement System of the City of New York 1Q 2021
Investments by Strategy Vintage Year First Draw-down Committed Capital Contributions Distributions Market Value Unfunded Commitment Equity Multiple3 IRR3
Almanac Realty Securities VI 2012 6/2012 100,000,000 62,409,719 68,779,049 12,033,257 - 1.29x 9.1%Almanac Realty Securities VI (Sidecar III) 2012 8/2012 35,000,000 11,751,378 10,959,011 4,362,360 - 1.30x 8.6%Almanac Realty Securities VII 2015 4/2015 65,000,000 57,745,804 45,818,302 32,972,616 16,207,876 1.36x 13.0%Almanac Realty Securities VII (Sidecar III) 2015 12/2015 20,000,000 14,560,366 10,871,779 9,552,387 6,116,024 1.40x 14.8%Almanac Realty Securities VIII 2018 8/2018 51,000,000 12,757,206 871,710 12,621,495 38,542,027 1.06x 5.9%Almanac Realty Securities VIII (Sidecar II) 2018 8/2018 34,000,000 8,581,317 511,573 9,754,635 25,507,152 1.20x 19.5%Artemis Co-Investment1 2016 2/2016 70,000,000 81,300,052 31,612,407 72,216,889 5,194,193 1.28x 11.9%Artemis Income and Growth Fund 2019 8/2018 101,000,000 31,086,246 1,522,938 28,177,700 71,410,424 0.96x -4.0%Brookfield Premier Real Estate Partners 2016 11/2016 171,000,000 153,941,336 23,047,105 179,459,314 40,105,769 1.32x 8.5%Carlyle Property Investors 2017 7/2017 119,000,000 137,938,046 18,938,046 158,022,875 - 1.28x 8.5%Cortland Growth and Income, L.P. 2020 4/2020 123,000,000 126,411,779 3,411,779 130,943,064 - 1.06x NMExeter Core Industrial Club Fund II 2016 5/2016 37,000,000 36,036,053 8,338,289 45,974,396 963,947 1.51x 15.6%Exeter Core Industrial Fund III 2020 5/2019 84,800,000 23,040,160 900,000 23,979,450 61,759,840 1.08x NMHarrison Street Core Property Fund 2019 5/2019 100,000,000 106,194,632 6,194,632 108,596,393 - 1.08x 5.7%Harrison Street Core Property Fund Co-Investment 2019 5/2019 50,000,000 33,301,854 1,751,958 34,041,387 18,446,602 1.07x 4.5%Heitman America Real Estate Trust, L.P. 2007 3/2007 48,000,000 85,680,771 37,680,771 108,271,019 - 1.70x 6.7%Heitman Core Real Estate Debt Income Trust2 2018 10/2017 112,000,000 68,107,859 9,107,859 66,848,236 53,000,000 1.12x 5.7%Jamestown Premier Property Fund 2016 2/2016 64,961,594 75,961,391 28,371,124 54,107,494 0 1.09x 3.0%JP Morgan Special Situation Property Fund 2007 1/2007 15,000,000 25,649,430 15,464,583 22,302,405 - 1.47x 4.7%JP Morgan Strategic Property Fund 2006 12/2006 86,000,000 137,426,375 100,372,594 148,240,887 - 1.81x 7.1%LaSalle Property Fund 2010 7/2010 104,000,000 103,620,297 26,598,634 126,041,616 0 1.47x 8.5%Lion Industrial Trust 2017 1/2017 98,000,000 117,068,714 19,068,716 163,766,046 - 1.56x 14.3%MetLife Core Property Fund 2014 7/2014 80,000,000 80,000,000 23,410,046 101,159,464 - 1.56x 8.1%NYC Asset Investor #2 2013 7/2013 145,000,000 147,467,377 62,588,614 101,946,494 4,655,372 1.12x 2.4%PRISA 2006 9/2006 36,000,000 38,793,503 18,048,740 51,633,279 - 1.80x 4.7%PRISA II 2007 6/2007 63,374,139 67,585,272 27,493,022 96,109,718 - 1.83x 5.5%Prologis Targeted US Logistics Fund 2006 10/2006 20,000,000 13,942,075 6,175,426 22,876,880 10,000,000 2.08x 6.7%RREEF America REIT II 2006 10/2006 85,000,000 47,527,452 27,793,278 52,973,568 49,000,000 1.70x 5.1%UBS Trumbull Property Fund 2006 9/2006 106,000,000 164,763,074 175,003,500 73,131,388 - 1.51x 5.9%USAA Eagle Real Estate Fund 2015 12/2015 98,000,000 109,502,628 11,984,032 119,831,029 - 1.20x 5.1%Core / Core Plus Portfolio3 2,322,135,733 2,180,152,165 822,689,518 2,171,947,742 400,909,226 1.37x 6.7%Aermont Capital Real Estate Fund IV 2019 8/2018 86,073,248 19,898,753 - 15,221,961 66,174,495 0.76x -19.7%American Value Partners Fund I1 2007 10/2007 25,000,000 17,872,806 18,806,245 687,833 7,127,194 1.09x 1.9%Apollo Real Estate Investment Fund V 2006 6/2006 5,000,000 5,000,000 5,811,917 5,653 500,000 1.16x 1.9%Avanath Affordable Housing II1 2015 7/2015 10,000,000 10,364,833 4,358,261 13,192,442 277,614 1.69x 11.1%Basis Investment Group Real Estate Fund I1,2 2017 11/2017 19,400,000 15,503,888 5,819,933 13,113,071 6,969,373 1.22x 12.7%Blackstone Real Estate Partners Europe III - USD 2008 10/2008 50,000,000 42,789,207 71,186,708 1,969,445 10,199,839 1.71x 16.0%Blackstone Real Estate Partners Europe VI L.P. 2019 5/2019 111,000,000 33,259,498 90,642 36,059,111 79,050,289 1.09x 13.0%Blackstone Real Estate Partners IV L.P. 2004 5/2004 25,000,000 31,994,609 45,093,879 604,478 - 1.43x 10.3%Blackstone Real Estate Partners IX L.P. 2019 1/2019 184,000,000 68,150,043 10,001,047 72,458,541 125,091,372 1.21x 22.0%Blackstone Real Estate Partners VI L.P. 2007 7/2006 50,000,000 54,622,277 108,908,482 364,250 3,912,723 2.00x 13.4%Brookfield Strategic Real Estate Partners 2012 9/2012 125,000,000 132,593,780 173,771,148 39,527,240 23,192,465 1.61x 14.2%Brookfield Strategic Real Estate Partners III, L.P. 2019 1/2018 193,000,000 110,110,672 25,256,774 97,264,246 84,271,639 1.11x 10.9%Capri Urban Investors 2008 6/2008 40,000,000 40,000,000 18,350,614 7,743,481 - 0.65x -5.6%Carlyle Realty Partners V, L.P. 2007 8/2007 12,750,000 19,060,772 25,122,803 2,569,749 1,248,131 1.45x 8.7%Carlyle Realty Partners VI, L.P. 2011 9/2011 70,000,000 75,993,040 108,600,411 5,250,850 23,025,206 1.50x 20.1%Carlyle Realty Partners VII, L.P. 2014 7/2014 120,000,000 110,166,773 109,554,685 45,419,726 57,624,199 1.41x 12.9%Cerberus Institutional Real Estate Partners V SMA 2021 3/2021 106,000,000 - - (126,097) 106,000,000 0.00x NMDivcoWest Fund IV 2014 1/2014 25,000,000 24,750,416 38,059,186 3,553,569 2,247,328 1.68x 25.3%DivcoWest Fund V 2016 12/2016 78,000,000 56,838,686 12,187,042 52,590,635 21,161,314 1.14x 5.3%DivcoWest Fund VI 2020 1/2020 93,000,000 5,590,914 - 4,975,816 87,409,086 0.89x NMDRA Growth and Income Fund IX 2017 3/2017 56,000,000 58,490,915 22,643,132 52,777,119 6,520,661 1.29x 13.6%DRA Growth and Income Fund VIII 2014 9/2014 75,000,000 91,692,603 71,583,616 43,536,735 1,555,555 1.26x 8.0%DRA Growth and Income Fund X 2020 2/2020 67,000,000 16,420,462 3,213,143 15,189,771 52,276,009 1.12x NMElmTree U.S. Net Lease Fund IV, L.P. 2020 7/2020 58,000,000 12,128,278 54,469 11,706,702 45,871,766 0.97x NMExeter Industrial Value Fund IV, L.P. 2017 9/2017 34,000,000 32,106,667 3,466,667 46,682,574 1,893,333 1.56x 21.6%Exeter Industrial Value Fund V, L.P. 2020 2/2020 56,000,000 14,000,000 - 15,825,445 42,000,000 1.13x NMGreenOak Asia III 2020 11/2019 99,000,000 47,580,291 32,612,058 16,487,904 83,831,002 1.03x NMGrosvenor Real Estate Emerging Manager SMA1 2019 12/2019 264,000,000 44,660,305 - 43,671,921 220,060,913 0.98x NMH2 Special Opportunities Fund II2 2011 2/2011 40,000,000 40,045,335 58,344,882 730,842 - 1.48x 13.3%H2 Special Opportunities III2 2014 12/2014 65,000,000 67,503,668 57,415,260 23,597,109 - 1.20x 6.8%H2 Special Opportunities IV2 2016 11/2016 119,000,000 119,915,211 968,067 135,303,412 - 1.14x 8.6%KKR RE Europe II 2020 2/2020 89,000,000 - - 2,815,917 89,000,000 0.00x NMKKR Real Estate Partners Americas II 2018 2/2018 135,380,000 125,740,204 40,012,361 110,810,887 28,579,333 1.20x 15.2%KKR Real Estate Partners Americas III SCSp 2021 3/2021 150,000,000 - - - 150,000,000 0.00x NMKKR Real Estate Securities Dislocation Opportunity Co-Investment Strategy 2020 8/2020 113,000,000 51,219,037 10,185,800 55,464,812 71,966,763 1.28x NMLone Star Real Estate Fund III, L.P.2 2013 5/2014 190,000,000 181,714,995 234,815,945 9,086,514 11,891,059 1.34x 14.0%Metropolitan Workforce Housing Fund1 2007 7/2007 10,500,000 10,509,770 12,558,389 192,893 - 1.21x 3.9%NYC Asset Investor #1 2013 6/2013 60,000,000 69,829,432 33,958,987 41,194,870 17,110,184 1.08x 1.7%NYC Asset Investor #3 2013 9/2013 96,000,000 67,338,008 12,153,173 71,896,385 28,661,991 1.25x 5.4%NYC Hudson Multifamily Green Fund 2021 2/2021 134,000,000 - - - 134,000,000 0.00x NMNYCRS-KKR CMBS Retention Partners2 2017 9/2017 159,000,000 143,817,825 35,860,955 131,426,871 17,189,236 1.16x 6.1%Pramerica Real Estate Capital VI2 2017 4/2017 68,663,822 65,332,840 38,062,087 37,855,169 17,651,135 1.16x 10.9%Pramerica Real Estate Capital VII2 2020 2/2020 99,000,000 7,494,126 - 7,402,978 91,505,874 0.99x NMPW Real Estate Fund III 2016 10/2016 66,559,393 48,482,910 20,743,420 75,629,840 18,076,482 1.99x 28.4%Rialto Real Estate Fund IV - Debt, LP2 2021 10/2020 120,000,000 18,344,892 1,925,331 19,923,079 102,000,000 1.19x NMSilverpeak Legacy Partners III 2008 6/2008 30,000,000 12,297,805 4,245,727 1,132,495 - 0.44x -11.7%Stockbridge Real Estate III 2008 9/2008 22,500,000 22,498,458 14,024,794 13,825,793 1,542 1.24x 2.7%Taconic New York City Investment Fund 2012 7/2012 70,000,000 29,272,728 47,996,467 3,404,692 40,727,272 1.76x 15.4%The City Investment Fund I 2004 3/2004 120,000,000 118,337,757 119,671,892 186,056 - 1.01x 0.3%Thor Urban Property Fund II 2008 10/2008 12,500,000 17,123,783 17,546,236 537,535 928,471 1.06x 1.8%Tristan European Property Investors Special Opp IV 2015 12/2015 65,639,153 59,315,022 16,122,760 62,727,339 9,252,030 1.33x 10.7%Westbrook Real Estate Fund VIII, L.P. 2009 6/2010 50,000,000 59,760,616 68,952,803 7,086,510 4,310,561 1.27x 9.9%Westbrook Real Estate Fund X 2016 7/2016 47,000,000 45,186,212 28,078,099 25,688,072 3,791,519 1.19x 10.6%Westbrook Real Estate Fund XI 2019 5/2019 92,000,000 8,404,997 - 9,107,893 84,205,606 1.08x NMNon-Core Portfolio3 4,361,965,616 2,581,126,118 1,788,196,299 1,505,352,137 2,080,340,566 1.28x 9.0%Emerging Manager 3 2007 398,900,000 180,211,654 73,155,235 143,075,049 239,629,287 1.20x 7.3%Debt 3 2011 992,063,822 727,780,640 442,320,319 445,287,282 300,206,677 1.22x 10.3%Total Portfolio3 6,684,101,349 4,761,278,283 2,610,885,816 3,677,299,878 2,481,249,791 1.32x 7.6%1 Emerging managers2 Debt investments3 Core, Non-Core and Total Portfolio IRRs do not include liquidated investments
36

-$200,000,000
-$150,000,000
-$100,000,000
-$50,000,000
$0
$50,000,000
$100,000,000
$150,000,000
Amou
ntTRS Monthly Real Estate Cash Flow Summary
(as of September 30, 2021)
Contributions Distributions Net Cash Flow
37

Vintage Year Investment Closing Date CommittedCapital
Contributed Capital
Distributed Capital
Market Value
TVPI IRR
Active Investments:2013 Brookfield Infrastructure Fund II, L.P. 7/8/2013 $140,000,000 $115,558,818 $52,510,097 $157,733,045 1.8x 13.2%2014 IFM Global Infrastructure Fund 1/2/2014 $140,000,000 $196,505,133 $85,280,380 $211,807,541 1.5x 10.1%2014 Global Energy & Power Infrastructure Fund II 4/16/2014 $90,000,000 $95,040,001 $77,987,064 $52,551,824 1.4x 20.7%2014 KKR Global Infrastructure Investors II L.P. 6/12/2015 $100,000,000 $106,560,500 $94,270,890 $84,803,749 1.7x 18.3%2016 Global Infrastructure Partners III-A/B, L.P. 1/29/2016 $139,000,000 $124,888,772 $27,122,109 $123,848,975 1.2x 7.2%2016 Brookfield Infrastructure Fund III, L.P. 4/15/2016 $119,000,000 $67,614,613 $20,198,832 $66,262,960 1.3x 10.3%2016 Actis Energy 4 12/16/2016 $72,600,000 $55,800,856 $16,533,159 $55,544,000 1.3x 12.3%2017 EQT Infrastructure III (No.2) SCSp 2/18/2017 $63,270,397 $66,503,873 $9,850,353 $90,507,356 1.5x 19.2%2016 ASF VII Infrastructure L.P. 4/24/2017 $65,000,000 $36,443,707 $2,819,792 $43,767,325 1.3x 16.9%2017 Axium Infrastructure North America (2017) 8/14/2017 $66,030,248 $67,785,072 $12,843,050 $70,554,258 1.2x 9.9%2017 NYCRS EIG Energy Partners, L.P. 8/14/2017 $64,710,000 $24,816,145 $5,964,891 $22,047,665 1.1x 7.9%2021 NYCRS EIG Energy Partners Co-Investment, L.P. 1/12/2018 $16,180,000 - - - - 0.0%2018 KKR Global Infrastructure Investors III L.P. 3/29/2018 $75,000,000 $37,080,643 $2,643,059 $28,019,457 0.8x -14.4%2019 Global Energy & Power Infrastructure Fund III, L.P. 7/3/2018 $75,000,000 $28,821,218 $4,282,238 $27,157,515 1.1x 11.0%2018 Cardinal NR Sidecar Holdings L.P. 10/5/2018 $9,000,000 $9,057,683 $2,236,331 $11,288,072 1.5x 18.8%2018 EQT Infrastructure IV (No.2) USD SCSp 12/20/2018 $87,000,000 $52,793,249 $2,058,640 $57,635,353 1.1x 11.0%2019 Ardian Infrastructure Fund V B 3/4/2019 $75,340,565 $8,947,421 $446,705 $9,242,477 1.1x 6.5%2018 Global Infrastructure Partners IV-A/B, L.P. 3/11/2019 $113,200,000 $11,065,612 $1 $7,627,806 0.7x -64.6%2019 Brookfield Infrastructure Fund IV, L.P. 5/10/2019 $97,000,000 $48,684,222 $5,861,370 $49,142,717 1.1x 12.0%2020 EQT Infrastructure IV Co-Investment (B) SCSp (Saber) 7/30/2019 $8,100,000 $8,181,000 $491,627 $9,176,341 1.2x 16.9%2019 Brookfield Infrastructure Fund IV Co-Investment (Snow) 10/25/2019 $10,000,000 $10,042,230 $665,269 $11,053,032 1.2x 12.5%2020 EQT Infrastructure IV Co-Investment (G) SCSp (Lightspeed) 6/11/2020 $16,658,113 $16,712,983 - $16,949,038 NM NM2020 Actis Energy 5 6/30/2020 $148,000,000 - - - NM NM2020 BIS NYC Infrastructure Emerging Manager Opportunities Fund, L.P. 7/3/2020 $69,500,000 $3,784,653 - $3,734,252 NM NM2020 EQT Infrastructure IV Co-Investment (F) SCSp (Connect) 8/18/2020 $12,700,000 $12,745,357 - $14,408,231 NM NM2020 EQT Infrastructure V (No.2) USD SCSp 10/29/2020 $177,000,000 - - ($2,460,265) NM NM2021 Basalt Infrastructure Partners III 2/5/2021 $140,000,000 - - - NM NM2021 Stonepeak Infrastructure Fund IV, L.P. 2/16/2021 $207,000,000 - - ($1,313,776) NM NMTotal $2,396,289,324 $1,205,433,762 $424,065,857 $1,221,088,947 1.4x 12.1%
Teachers' Retirement System of the City of New YorkInfrastructure Portfolio
As of March 31, 2021
Note: IRRs presented are interim estimates and may not be indicative of the ultimate performance of fund investments due to a number of factors, such as the lack of industry valuation standards and the differences in the investment pace and strategy of various funds. Until a fund is liquidated, typically over 10 to 12 years, the IRR is only an interim estimated return. The IRR calculated in the early years of a fund is usually not meaningful given the J-Curve effect. The actual IRR performance of any fund is not known until all capital contributed and earnings have been distributed to the investor. The IRRs contained in this report are calculated by StepStone Group LP, a consultant to the New York City Retirement Systems, based on information provided by the general partners of each investment (e.g. cash flows and valuations). The IRR calculations and other information contained in this report have not been reviewed or confirmed by the general partners. The result of the IRR calculation may differ from that generated by the general partner or other limited partners. Differences in IRR calculations can be affected by cash-flow timing, the accounting treatment of carried interest, fund management fees, advisory fees, organizational fees, other fund expenses, sale of distributed stock, and valuations.
38

($97,500,000)($90,000,000)($82,500,000)($75,000,000)($67,500,000)($60,000,000)($52,500,000)($45,000,000)($37,500,000)($30,000,000)($22,500,000)($15,000,000)
($7,500,000)$0
$7,500,000$15,000,000$22,500,000$30,000,000$37,500,000$45,000,000$52,500,000$60,000,000$67,500,000$75,000,000$82,500,000
Amou
nt
TRS Monthly Infrastructure Cash Flow Summary (as of September 30, 2021)
Contributions Distributions Net Cash Flow
39