monthly labor review, november 2012: stop, drop, and roll
TRANSCRIPT

18 Monthly Labor Review • November 2012
Workplace Hazards of Government Firefighters
Stop, drop, and roll: workplace hazards of local government firefighters, 2009
When compared with all workers, firefighters are injured in similar ways but at a much higher rate, with work-related injuries caused by “stress, exertion, and other medical-related issues” accounting for the largest number of deaths and with risks of fatal injuries 25.7 percent higher and nonfatal injuries and illnesses over two times greater
Gary M. Kurlick
Gary M. Kurlick is an economist in the Office of Compensation and Working Conditions, Division of Safety and Health Statistics, at the Bureau of Labor Statistics. Email: [email protected].
Unlike those in many other profes-sions, firefighters regularly face hazardous working conditions.
Candidates undergo rigorous training and generally must pass written, physical, and medical examinations before they are al-lowed to work in hazardous working en-vironments. Despite the prerequisites, the risk of fatal injuries is 25.7 percent higher and the risk of nonfatal injuries and ill-nesses to firefighters is over two times greater than to all workers. This article uses data from the Bureau of Labor Statistics (BLS) Survey of Occupational Injuries and Illnesses (SOII) and Census of Fatal Oc-cupational Injuries (CFOI) to observe how often firefighters are injured at work, when they are hurt, where they are injured, and how their injuries compare with those of workers in other professions.
Since 1992, the CFOI has collected data on fatal occupational injuries, including volunteer workers who are exposed to the same work environments and perform the same work-related duties as paid em-ployees.1 CFOI data come from a variety of data sources, such as death certificates, state workers’ compensation records, news media reports, and Occupational Safety and Health Administration (OSHA) re-ports. CFOI counts include only fatal in-
juries and exclude illness-related deaths, such as heart attacks and strokes, unless precipitated by an injury event.2 CFOI data, to include all fatality data, cover workers in both private and government sectors.
In its study of the most frequent causes of fatalities in firefighting, the National Fire Pro-tection Association (NFPA)3 found that “stress, exertion, and other medical-related issues” ac-counted for the largest number of deaths. In addition, these events or exposures generally resulted in “heart attacks or other sudden car-diac events.”4
Each year, the SOII collects nonfatal data covering private wage and salary workers5
from a sample of about 230,000 private indus-try establishments across the United States.6 The nonfatal data in this article cover cases with days away from work due to injuries or illnesses to career firefighters in local govern-ment as defined by SOII and does not include unpaid workers. Days-away-from-work cases are those that result in at least 1 full day of missed work, not including the day of injury or the beginning of the illness, and also may in-clude days of job transfer or restricted activity. Nonvolunteer firefighters accounted for 29.3 percent of all firefighters in 2009 according to the NFPA.7 Data from the SOII are collected us-ing the OSHA recordkeeping standards. Before the 2008 survey year, BLS did not produce the

Monthly Labor Review • November 2012 19
national estimates of work-related injuries and illnesses among the public sector (state and local government).8 In 2010 (survey year 2009), the BLS published national inci-dence rates for occupations in state and local government for the first time.
Nature of firefighters’ work
Firefighters are prone to injury with incidence rates over two times higher than for all workers combined.9 The Unit-ed States reportedly had nearly 1.4 million fires in 2009, amounting to $12.5 billion in property damage.10 Fire de-partments in the United States responded to a fire every 23 seconds.11 Because of the varied work, firefighters must be alert and ready throughout their shifts; they are frequently the first responders to a fire or other emergency. The fol-lowing are examples of a career firefighter’s nature of work based on the BLS Occupational Outlook Handbook:12
• Firefighters often stay for multiple days at a location where an emergency occurred, “rescuing trapped survi-vors and assisting with medical treatment.”
• Because firefighters may routinely encounter haz-ardous conditions, in addition to fire, that are dan-gerous to their health, heavy personal protective equipment is required to help shield their bodies from toxic or combustible gases and chemicals and materials emitting radiation.
• Firefighters require specific training and certifica-tions before they are able to respond to emergencies.
• A firefighter’s role is likely to change numerous times while the fire department is responding to an emer-gency.
In 2009, 197,660 nonfatal injuries and illnesses oc-curred in all occupations in local government; the figure for 2008 was 206,580. In addition, 13,900 nonfatal occu-pational injuries and illnesses to firefighters involving days
away from work were reported in 2009 in local govern-ment and 16,800 reported in 2008. (See table 1.)
Demographics
The highest percentage of injury and illness cases in all the government sectors was the protective service occupa-tions, in which firefighters are included. Protective service occupations had an incidence rate of 505.0 days of away-from-work cases per 10,000 full-time workers in 2009. As expected, men accounted for a large portion of injuries within the protective service occupational group. Of the 22.3 percent of women employed in the protective ser-vice occupational group, a more detailed look reveals that only 3.4 percent of them were employed as firefighters in 2009.13 Consequently, men sustained over 94.4 percent of the workplace injuries and illnesses that occurred among firefighters in 2009. Firefighters with more than 5 years of service accounted for 65.2 percent of the total injuries and illnesses in 2009. For all workers, 58.1 percent of inju-ries and illnesses occurred to workers who have been with their employer for more than 5 years.
Nonfatal injuries and illnesses
The BLS developed the Occupational Injury and Illness Classification System (OIICS) to present a reliable set of procedures for recording the characteristics of workplace injuries, illnesses, and fatalities. The SOII publishes four case characteristics to describe each incident that leads to an injury or illness resulting in at least 1 day away from work; in addition to these four characteristics, the CFOI publishes an additional characteristic (secondary source) to describe a fatal workplace injury. The circumstances of each case are classified on the basis of the BLS OIICS manual and the characteristics described in the following paragraphs.
Part of body affected is the part of body directly affect-ed by the injury or illness, such as the back, fingers, or knees. Injuries and illnesses to the trunk, which includes the chest, back, shoulders, and abdomen, accounted for
Table 1. Percent change of injuries and illnesses with days away from work for firefighters in local government compared with all occupations in local government combined, 2008–2009
CharacteristicAll occupations Percent change
from 2008–2009
Firefighters Percent change from 2008–20092009 2008 2009 2008
Total injuries and illnesses 197,660 206,580 –4.3 13,900 16,800 –17.3
SOURCE: U.S. Bureau of Labor Statistics, Survey of Occupational Injuries and Illnesses.

Workplace Safety and Health
20 Monthly Labor Review • November 2012
the most nonfatal injuries and illnesses to firefighters in 2009. The number of days away from work due to injuries and illnesses to the trunk among firefighters was 6,450 in 2008 and 5,670 in 2009. More than 40.0 percent of inju-ries and illnesses to firefighters were to the trunk, whereas only 30.5 percent occurred to all workers in 2009. More specifically, when the trunk is considered, firefighters with injuries to the back accounted for 3,780 injuries in 2009 and 3,850 in 2008.
Event or exposure is the way in which the injury or ill-ness was produced or inflicted. In 2009, most of the injuries and illnesses to firefighters were due to overexertion (28.6 percent) or from a particular incident of free bodily mo-tion, which imposed stress or strain on some part of the body (18.1 percent).14 The duties of a firefighter may in-volve carrying, pushing, pulling, holding, turning, wielding,
throwing, or lifting, all of which may lead to overexertion. Firefighters had an incidence rate of 146.6 cases per 10,000 full-time workers for overexertion, while the incidence rate was 33.4 among all workers. Overexertion made up 18.1 percent of total injuries and illnesses for all local govern-ment workers in 2009, but 28.6 percent for firefighters. The total number of instances of overexertion involving days away from work fell from 5,100 in 2008 to 3,980 in 2009. A more detailed look at overexertion shows that overexer-tion in lifting accounted for 8.5 percent of total injuries and illnesses for all local government workers and was 13.6 per-cent for firefighters. As seen in table 2, contact with object or equipment, an event that would seem typical during a firefighter’s work environment, occurs about as often as in all occupations combined.
Nature is the physical characteristics of the disabling
Table 2. Number and percent of nonfatal injuries and illnesses to firefighters in local government compared with all workers in local government, by event or exposure, 2009
Event or exposureAll workers Firefighters
Number Percent Number Percent Median days
Total nonfatal injuries and illnesses 197,660 100.0 13,900 100.0 11
Contacts with object equipment 33,060 16.7 2,350 16.9 8
Struck by object 16,250 8.2 1,180 8.5 8
Struck against object 11,220 5.7 890 6.4 5
Falls 47,760 24.2 2,480 17.8 19
Falls to lower level 12,400 6.3 1,030 7.4 20
Falls on same level 32,780 16.6 1,360 9.8 17
Bodily reaction and exertion 73,160 37.0 6,940 49.9 12
Bodily reaction 29,740 15.0 2,520 18.1 11
Bending, climbing, crawling, reaching, twisting 10,460 5.3 790 5.7 20
Slip, trip, loss of balance without fall 8,460 4.3 780 5.6 11
Bodily reaction, n.e.c. 5,940 3.0 630 4.5 9
Overexertion 35,740 18.1 3,980 28.6 11
Overexertion in lifting 16,860 8.5 1,890 13.6 6
Repetitive motion 3,670 1.9 220 1.6 22
Exposed to harmful substance 9,130 4.6 1,170 8.4 10
Transportation accidents 13,650 6.9 420 3.0 111
Fires and explosions 390 — 220 1.6 10
Fire, unintended or uncontrolled 290 — 180 1.3 27
Fire, unspecified 160 — 140 1.0 32
Fire in residence, building, or other structure 100 — 30 — 4
Explosion 80 — 30 — 2
All other 31,460 15.9 2,330 16.8 NA
NOTES: Dashes indicate numbers are less than 1 percent. n.e.c. = not elsewhere classified. NA = not applicable.
SOURCE: U.S. Bureau of Labor Statistics, Survey of Occupational Injuries and Illnesses.

Monthly Labor Review • November 2012 21
injury or illness, such as heat burns, sprains and strains, or bruises. Not surprisingly, on the basis of firefighters’ job du-ties, sprains and strains were the top nature of injury and illness to firefighters in 2009. (See table 3.) Firefighters fre-quently climb ladders, carry hoses, and maneuver through doors, walls, and debris, all while carrying heavy protective equipment, which makes them more susceptible to sprains and strains compared with all workers. In 2009, sprains and strains for all workers in the local government made up of 42.5 percent of injuries. As shown in table 3, sprains and strains among firefighters accounted for 50.4 percent of all injuries. In addition, firefighters had an incidence rate of 257.9 per 10,000 full-time workers for sprains and strains, compared with 78.6 for all workers in the local government. Heat burns in 2009 made up only 1.3 percent of all injuries for all workers. But in firefighting the proportion of heat burns (6.3 percent) was nearly five times that of all occupa-tions combined.
Source is the object, substance, exposure, or bodily mo-tion that directly produced or inflicted the disabling condi-tion, such as persons, vehicles, or floors. Firefighters’ unique work environment differs compared with that of all workers and may include working in or on smoky conditions, slip-pery and uneven surfaces, collapsing floors, and collapsing structures. Vehicle accidents and exposure to flames and carbon monoxide smoke are also frequently experienced.15 Firefighters experience hazardous working conditions when locating and rescuing occupants who are unable to leave the building without assistance. As seen in table 4, “injured or ill
worker”16 (2,380) was followed by “other than injured or ill worker”17 (1,220) and, together, accounted for the majority of injuries or illnesses to firefighters. Nearly 20.9 percent of injuries or illnesses to firefighters were from floors, walk-ways, or ground surfaces compared with 24.2 percent of those to all workers.
Nature-part-source-event
Firefighters typically work in unique environments, and their nonfatal injuries and illnesses reflect that. One of the hazardous job duties of firefighters includes putting out fires, which increases their risk to burns, and the combina-tions that further examine how firefighters typically are injured while at work. The combinations of nature, part of body affected, source of the injury or illness, and event or exposure can better explain how an injury or illness occurs from start to finish.
Sprains and strains were the most widespread nature of injury to firefighters in 2009, as mentioned previously, and further investigating this nature will help explain nonfatal injuries to this occupation. A few examples, common for firefighters, help explain the occupational hazards to these workers. The first common combination involves the bodily motion or position of the injured or ill worker. Among fire-fighters, 970 injuries and illnesses were found with sprains or strains, of which the part of body was the lower extremi-ties, the source was bodily motion or position of the injured or ill worker, and the event was bodily reaction and exer-
Nonfatal injuries and illnesses involving days away from work to firefighters in local government, by nature, 2009
Nature of the injury or illness Total cases Percent
All selected natures 13,900 100.0
Traumatic injuries and disorders 12,940 93.1
Traumatic injuries to bones, nerves, spinal cord 670 4.8
Traumatic injuries to muscles, tendons, ligaments, joints, etc. 7,030 50.6
Sprains and strains 7,010 50.4
Open wounds 640 4.6
Cuts, lacerations 600 4.3
Surface wounds and bruises 1,130 8.1
Bruises, contusions 1,050 7.6
Burns 870 6.3
Heat burns, scalds 870 6.3
Other traumatic injuries and disorders 1,930 13.9
Nonspecified injuries and disorders 1,840 13.2
Back pain, hurt back 560 4.0
Soreness, pain, hurt, except the back 860 6.2
SOURCE: U.S. Bureau of Labor Statistics, Survey of Occupational Injuries and Illnesses.
Table 3.

Workplace Safety and Health
22 Monthly Labor Review • November 2012
tion. Common occurrences that led firefighters to bodily reaction and exertion were sprains or strains to the lower extremities of the body induced by a free movement of the body or its parts with no impact involved. (See table 5.) Another common combination for firefighters was overex-ertion, resulting in sprains and strains to the trunk section of the body, while trying to rescue a person from hazardous environments. Among firefighters, 870 injuries and illness-es occurred, in which the nature was sprains or strains, of which the part of body was the trunk, the source was person other than injured or ill worker, and the event was overexer-tion (590 of which were overexertion in lifting). The final firefighter combination includes an injury that rarely occurs in most other occupations—heat burns. Among firefighters in which 380 injuries and illnesses were found, the nature was heat burns, the part of body was multiple body parts, the source was steam, and the event was contact with hot objects or substances.
Median days away from work
In 2009, firefighters had a median number of days (11) away from work that was 3 days longer than the num-
ber of days (8) of all other workers in local government. Table 6 displays the number of injuries and illnesses to lo-cal government firefighters that involved days away from work by event or exposure in 2009.
Fatal injuries and illnesses
In 2009, firefighters had 2918 fatal work-related injuries compared with 44 in 2008. As with nonfatal injuries and illnesses, men accounted for a majority of fatal injuries to firefighters. In fact, all the firefighters who were fatally in-jured in 2009 were men. Fatal injuries to firefighters oc-curred mostly in the government sector (96.6 percent), with 86.2 percent (25) occurring in local government. Older firefighters ages 55 to 64 and 65 and over incurred 20.7 and 10.3 percent, respectively, of all fatal occupational injuries to firefighting in 2009. However, firefighters in these age groups experienced a much lower percentage of nonfatal injuries and illnesses in 2009 than in 2008. Only 3.8 per-cent of all nonfatal injuries and illnesses to firefighters were ages 55 to 64, while 0.4 percent were age 65 or over.
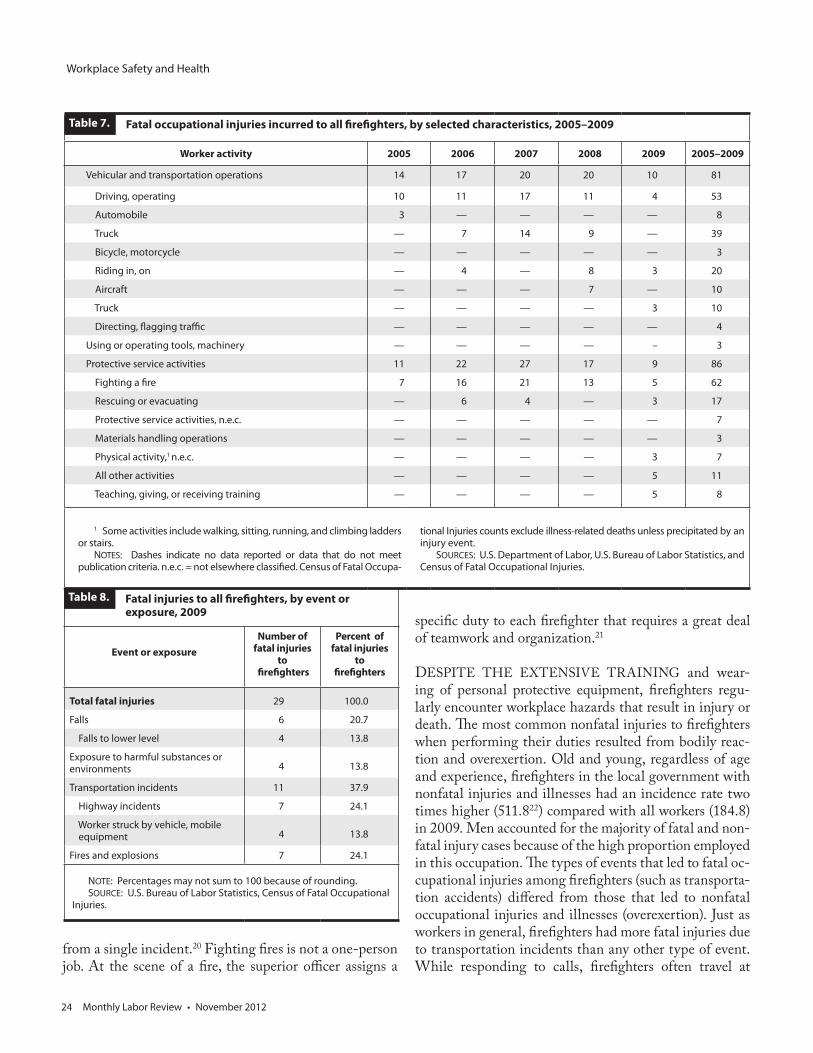
White non-Hispanic firefighters constituted 86.2 per-cent of all fatal injuries to firefighters in 2009. While fire-fighters typically are associated with putting out fires or entering burning buildings as their call of duty, 10 fatal injuries that occurred to firefighters resulted from vehicular and transportation operations. (See table 7.) Firefighters frequently travel at high speeds, responding to calls, in-creasing the likelihood of collisions.
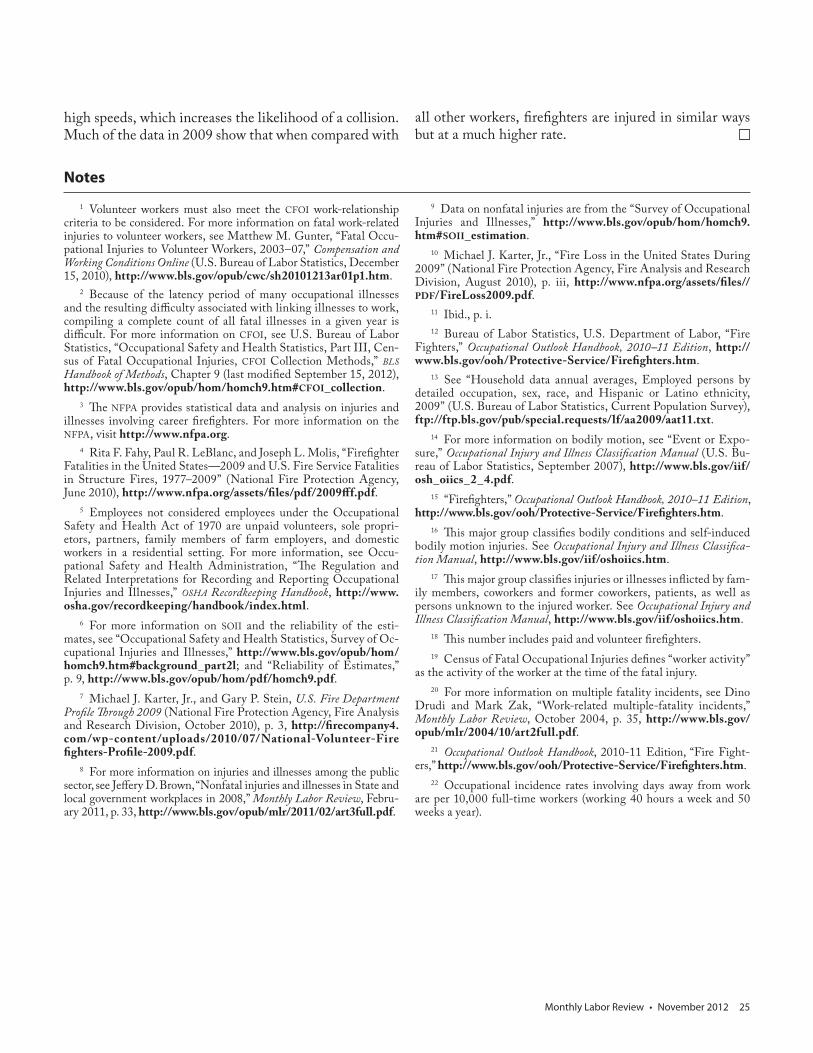
Among firefighters, the typical nonfatal injury or ill-ness is different from a typical fatal injury. A majority of nonfatal injuries and illnesses to firefighters result from falls, contact with objects or equipment, overexertion, and bodily reaction. Of the 29 firefighters who were fa-tally injured, over one-third were killed in transportation incidents, which resulted from highway incidents and firefighters struck by a vehicle or mobile equipment. (See table 8.) Seven fatal injuries were caused by fires and ex-plosions, of which six were the result of a fire in a resi-dence, building, or other structure.
As seen in table 7, the worker activity19 of the deceased firefighters included vehicular and transportation opera-tions, protective service activities, and all other activities. A closer look at protective service activities shows that in 2009, five firefighters lost their lives while fighting a fire and three died while rescuing or evacuating. Surprisingly, five firefighters died while teaching or giving/receiving training. From 2005 to 2009, 50 firefighters died in 24 different multiple-fatality incidents. A multiple-fatality incident is when the death of at least two workers results
Nonfatal injuries and illnesses involving days away from work to firefighters in local government, by source, 2009
Source of the injury or illness Total cases
All Selected Sources 13,900Containers 840Persons, plants, animals, and minerals 4,160
Person—injured or ill worker 2,380 Bodily motion or position of injured, ill worker 2,230 Person—other than injured or ill worker 1,220 Health care patient or resident of health care facility 980Structures and surfaces 3,270 Floors, walkways, ground surfaces 2,900 Floors 1,080 Floor of building 930 Ground 940Tools, instruments, and equipment 2,440 Tools, instruments, and equipment, unspecified 650 Other tools, instruments, and equipment 550Vehicles 910 Highway vehicle, motorized 880Other sources 1,300 Atmospheric and environmental conditions 610
Fire, flame, smoke 540
SOURCE: U.S. Bureau of Labor Statistics, Survey of Occupational Injuries and Illnesses.
Table 4.

Monthly Labor Review • November 2012 23
The narrative behind the nature-part-source-event characteristics of injuries and illnesses to firefighters in local government, 2009
Nature Part of body affected
Source of the injury or illness
Event or exposure
Total cases
Narrative1
Sprains and strains Lower extremities Bodily motion or position of injured, ill worker
Bodily reaction and exertion
970 A firefighter had a sprain or strain to his lower extremities (lower limbs) induced by a free movement of the body or its parts, with no impact involved.
Sprains and strains Trunk Person—other than injured or ill worker
Overexertion 870 A firefighter sprains his trunk from overexertion with a person
Sprains and strains Trunk Person—other than injured or ill worker
Overexertion in lifting
590 A firefighter sprains his trunk from over-exertion in lifting a person
Heat burns, scalds Multiple body parts Steam, vapors, liquids, n.e.c.
Contact with hot objects or substances
380 A firefighter burns multiple body parts from coming into contact with hot objects or substances involving steam, vapors, or liquids
Heat burns, scalds Head Fire, flame, smoke Contact with hot objects or substances
320 A firefighter burns his head from coming into contact with fire, flame, or smoke
1 Narratives are examples of what might occur and are not actual occurrences.
NOTE: n.e.c. = not elsewhere classified. SOURCE: U.S. Bureau of Labor Statistics, Survey of Occupational
Injuries and Illnesses.
Table 5.
Median days firefighters in local government were away from work, by selected events in local government, 2009
Event or exposure Median days Total cases Percent of total
All selected events 11 13,900 100.0
Contact with objects and equipment 8 2,350 16.9
Struck against object or equipment 5 890 6.4
Struck by object or equipment 8 1,180 8.5
Falls 19 2,480 17.8
Falls to lower level 20 1,030 7.4
Falls on same level 17 1,360 9.8
Falls to floor, walkway, or other surface 18 1,240 8.9
Bodily reaction and exertion 12 6,940 49.9
Bodily reaction 11 2,520 18.1
Bending, climbing, crawling, reaching, twisting 20 790 5.7
Slip, trip, and loss of balance without fall 11 780 5.6
Bodily reaction, n.e.c. 9 630 4.5
Overexertion 11 3,980 28.6
Overexertion in lifting 6 1,890 13.6
Overexertion in pulling or pushing objects 12 630 4.5
Overexertion in holding, carrying, turning, or wielding objects 30 1,130 8.1
Exposure to harmful substances or environments 10 1,170 8.4
Contact with temperature extremes 7 800 5.8
Contact with hot objects or substances 18 750 5.4
NOTE: n.e.c. = not elsewhere classified. SOURCE: U.S. Bureau of Labor Statistics, Survey of Occupational Injuries and Illnesses.
Table 6.
Workplace Safety and Health
24 Monthly Labor Review • November 2012
from a single incident.20 Fighting fires is not a one-person job. At the scene of a fire, the superior officer assigns a
Fatal occupational injuries incurred to all firefighters, by selected characteristics, 2005–2009
Worker activity 2005 2006 2007 2008 2009 2005–2009
Vehicular and transportation operations 14 17 20 20 10 81
Driving, operating 10 11 17 11 4 53
Automobile 3 — — — — 8
Truck — 7 14 9 — 39
Bicycle, motorcycle — — — — — 3
Riding in, on — 4 — 8 3 20
Aircraft — — — 7 — 10
Truck — — — — 3 10
Directing, flagging traffic — — — — — 4
Using or operating tools, machinery — — — — – 3
Protective service activities 11 22 27 17 9 86
Fighting a fire 7 16 21 13 5 62
Rescuing or evacuating — 6 4 — 3 17
Protective service activities, n.e.c. — — — — — 7
Materials handling operations — — — — — 3
Physical activity,1 n.e.c. — — — — 3 7
All other activities — — — — 5 11
Teaching, giving, or receiving training — — — — 5 8
1 Some activities include walking, sitting, running, and climbing ladders or stairs.
NOTES: Dashes indicate no data reported or data that do not meet publication criteria. n.e.c. = not elsewhere classified. Census of Fatal Occupa-
tional Injuries counts exclude illness-related deaths unless precipitated by an injury event.
SOURCES: U.S. Department of Labor, U.S. Bureau of Labor Statistics, and Census of Fatal Occupational Injuries.
Table 7.
Fatal injuries to all firefighters, by event or exposure, 2009
Event or exposureNumber of
fatal injuries to
firefighters
Percent of fatal injuries
to firefighters
Total fatal injuries 29 100.0
Falls 6 20.7
Falls to lower level 4 13.8
Exposure to harmful substances orenvironments 4 13.8
Transportation incidents 11 37.9
Highway incidents 7 24.1
Worker struck by vehicle, mobile equipment 4 13.8
Fires and explosions 7 24.1
NOTE: Percentages may not sum to 100 because of rounding. SOURCE: U.S. Bureau of Labor Statistics, Census of Fatal Occupational
Injuries.
Table 8.
specific duty to each firefighter that requires a great deal of teamwork and organization.21
DESPITE THE EXTENSIVE TRAINING and wear-ing of personal protective equipment, firefighters regu-larly encounter workplace hazards that result in injury or death. The most common nonfatal injuries to firefighters when performing their duties resulted from bodily reac-tion and overexertion. Old and young, regardless of age and experience, firefighters in the local government with nonfatal injuries and illnesses had an incidence rate two times higher (511.822) compared with all workers (184.8) in 2009. Men accounted for the majority of fatal and non-fatal injury cases because of the high proportion employed in this occupation. The types of events that led to fatal oc-cupational injuries among firefighters (such as transporta-tion accidents) differed from those that led to nonfatal occupational injuries and illnesses (overexertion). Just as workers in general, firefighters had more fatal injuries due to transportation incidents than any other type of event. While responding to calls, firefighters often travel at
Monthly Labor Review • November 2012 25
high speeds, which increases the likelihood of a collision. Much of the data in 2009 show that when compared with
all other workers, firefighters are injured in similar ways but at a much higher rate.
Notes
1 Volunteer workers must also meet the CFOI work-relationship criteria to be considered. For more information on fatal work-related injuries to volunteer workers, see Matthew M. Gunter, “Fatal Occu-pational Injuries to Volunteer Workers, 2003–07,” Compensation and Working Conditions Online (U.S. Bureau of Labor Statistics, December 15, 2010), http://www.bls.gov/opub/cwc/sh20101213ar01p1.htm.
2 Because of the latency period of many occupational illnesses and the resulting difficulty associated with linking illnesses to work, compiling a complete count of all fatal illnesses in a given year is difficult. For more information on CFOI, see U.S. Bureau of Labor Statistics, “Occupational Safety and Health Statistics, Part III, Cen-sus of Fatal Occupational Injuries, CFOI Collection Methods,” BLS Handbook of Methods, Chapter 9 (last modified September 15, 2012), http://www.bls.gov/opub/hom/homch9.htm#CFOI_collection.
3 The NFPA provides statistical data and analysis on injuries and illnesses involving career firefighters. For more information on the NFPA, visit http://www.nfpa.org.
4 Rita F. Fahy, Paul R. LeBlanc, and Joseph L. Molis, “Firefighter Fatalities in the United States—2009 and U.S. Fire Service Fatalities in Structure Fires, 1977–2009” (National Fire Protection Agency, June 2010), http://www.nfpa.org/assets/files/pdf/2009fff.pdf.
5 Employees not considered employees under the Occupational Safety and Health Act of 1970 are unpaid volunteers, sole propri-etors, partners, family members of farm employers, and domestic workers in a residential setting. For more information, see Occu-pational Safety and Health Administration, “The Regulation and Related Interpretations for Recording and Reporting Occupational Injuries and Illnesses,” OSHA Recordkeeping Handbook, http://www.osha.gov/recordkeeping/handbook/index.html.
6 For more information on SOII and the reliability of the esti-mates, see “Occupational Safety and Health Statistics, Survey of Oc-cupational Injuries and Illnesses,” http://www.bls.gov/opub/hom/homch9.htm#background_part2l; and “Reliability of Estimates,” p. 9, http://www.bls.gov/opub/hom/pdf/homch9.pdf.
7 Michael J. Karter, Jr., and Gary P. Stein, U.S. Fire Department Profile Through 2009 (National Fire Protection Agency, Fire Analysis and Research Division, October 2010), p. 3, http://firecompany4.com/wp-content/uploads/2010/07/National-Volunteer-Fire fighters-Profile-2009.pdf.
8 For more information on injuries and illnesses among the public sector, see Jeffery D. Brown, “Nonfatal injuries and illnesses in State and local government workplaces in 2008,” Monthly Labor Review, Febru-ary 2011, p. 33, http://www.bls.gov/opub/mlr/2011/02/art3full.pdf.
9 Data on nonfatal injuries are from the “Survey of Occupational Injuries and Illnesses,” http://www.bls.gov/opub/hom/homch9.htm#SOII_estimation.
10 Michael J. Karter, Jr., “Fire Loss in the United States During 2009” (National Fire Protection Agency, Fire Analysis and Research Division, August 2010), p. iii, http://www.nfpa.org/assets/files//PDF/FireLoss2009.pdf.
11 Ibid., p. i.12 Bureau of Labor Statistics, U.S. Department of Labor, “Fire
Fighters,” Occupational Outlook Handbook, 2010–11 Edition, http://www.bls.gov/ooh/Protective-Service/Firefighters.htm.
13 See “Household data annual averages, Employed persons by detailed occupation, sex, race, and Hispanic or Latino ethnicity, 2009” (U.S. Bureau of Labor Statistics, Current Population Survey), ftp://ftp.bls.gov/pub/special.requests/lf/aa2009/aat11.txt.
14 For more information on bodily motion, see “Event or Expo-sure,” Occupational Injury and Illness Classification Manual (U.S. Bu-reau of Labor Statistics, September 2007), http://www.bls.gov/iif/osh_oiics_2_4.pdf.
15 “Firefighters,” Occupational Outlook Handbook, 2010–11 Edition, http://www.bls.gov/ooh/Protective-Service/Firefighters.htm.
16 This major group classifies bodily conditions and self-induced bodily motion injuries. See Occupational Injury and Illness Classifica-tion Manual, http://www.bls.gov/iif/oshoiics.htm.
17 This major group classifies injuries or illnesses inflicted by fam-ily members, coworkers and former coworkers, patients, as well as persons unknown to the injured worker. See Occupational Injury and Illness Classification Manual, http://www.bls.gov/iif/oshoiics.htm.
18 This number includes paid and volunteer firefighters.19 Census of Fatal Occupational Injuries defines “worker activity”
as the activity of the worker at the time of the fatal injury.20 For more information on multiple fatality incidents, see Dino
Drudi and Mark Zak, “Work-related multiple-fatality incidents,” Monthly Labor Review, October 2004, p. 35, http://www.bls.gov/opub/mlr/2004/10/art2full.pdf.
21 Occupational Outlook Handbook, 2010-11 Edition, “Fire Fight-ers,” http://www.bls.gov/ooh/Protective-Service/Firefighters.htm.
22 Occupational incidence rates involving days away from work are per 10,000 full-time workers (working 40 hours a week and 50 weeks a year).