month 2 hammersmith & fulham ccg finance report … · executive summary page appendices page...
TRANSCRIPT

Month 2 Hammersmith & Fulham CCG Finance Report
12-July-16

Acronym Full Provider Name
ASP Ashford And St Peter's Hospitals NHS Foundation Trust
BLT Bart's Health NHS Trust
C&W Chelsea And Westminster Hospital NHS Foundation Trust
CLCH Central London Community Healthcare NHS Trust
CNWL Central And North West London MH NHS Foundation Trust
EHT Ealing Hospital NHS Trust
ESH Epsom And St Helier University Hospitals NHS Trust
GOSH Great Ormond Street Hospital For Children NHS Foundation Trust
GSTT Guys And St Thomas NHS Foundation Trust
HRCH Hounslow And Richmond Community Healthcare NHS Trust
HUH Homerton University Hospital NHS Foundation Trust
HWP Heatherwood And Wrexham Park Hosps NHS Foundation Trust
ICHT Imperial College Healthcare NHS Trust
KCH Kings College Hospital NHS Foundation Trust
KHT Kingston Hospital NHS Trust
MEH Moorefield's Eye Hospital NHS Foundation Trust
NWLHT North West London Hospitals NHS Trust
RBH Royal Brompton And Harefield NHS Foundation Trust
RMH The Royal Marsden Hospital NHS Foundation Trust
RNOH Royal National Orthopaedic Hospital NHS Trust
RSC Royal Surrey County NHS Foundation Trust
SGT St George's Healthcare NHS Trust
SLAM South London And Maudsley NHS Foundation Trust
SWL&StG South West London And St George's Mental Health NHS Trust
THH The Hillingdon Hospital NHS Foundation Trust
UCLH University College London NHS Foundation Trust
WHH The Whittington Hospital NHS Trust
WLMH West London Mental Health NHS Trust
WMUH West Middlesex University Hospital NHS Trust
Key message
The following acronyms are used throughout this pack.
Contract Acronyms
Acronyms
Executive summary Page Appendices Page
Executive summary 2 Appendix 1.1: Revenue resource limit 13
CCG finance dashboard 3
Risks and opportunities 4
Underlying position 5
Key issues and actions - financial position 6
Overall financial position Page
Surplus/deficit including running costs 7
Movement of variances including running costs 8
Reserves 9
Quality, Improvement, Productivity Plan 10
Capital, Creditor, Payments and Cash 11
Acute contracts: year to date performance 12
Contents
1

Status
Green
Risks and
opportunitiesGreen
Underlying
positionAmber
Contract
performanceGreen
QIPP Amber
Source: Team analysis
Reserves
Overall
financial
position
GreenThe CCG is holding reserves of £9.34m at month 2. These are largely committed eg to fund the NWL Strategy contribution, contingency and 1% uncommitted
required by NHSE. Those reserves available have been factored into the risks and opportunities assessment.
At month 2 the CCG is reporting a year to date surplus of £0.47m, which is slightly ahead of plan and is forecasting delivery of the planned £2.72m surplus.
Whilst it is early in the financial year, there are some emerging pressures to highlight:
(1) Continuing Healthcare Placement budgets are overspending by £0.12m at month 2 as both the average number of clients and average cost per client has
increased compared to 2015/16. A number of issues are causing this, specifically the weekly cap on St Vincent admissions and the proportion of H&F clients on
the highest RHND tariff.
(2) Community budgets are overspending by £0.15m year to date. This is mainly the waiting list initiative with Connect Health for the MSK backlog and is a
planned overspend. This is non recurrent and therefore not expected to affect the run rate.
(3) Acute contracts are underperforming by £0.17m year to date. This is based on activity data for only one month and so the position has not been extrapolated
into the forecast outturn which remains on plan. This will be reviewed next month.
The overspends that have emerged in the opening months of 2016/17 are currently being offset by underspends elsewhere in the position, and at this stage no
contingency funding has been required to balance the position.
The CCG has identified risks of £10.67m in the most likely case. Mitigations of £11.01m have been found locally. The CCG has an overall likely opportunity of
£0.34m and the range of risk is assessed to be an upside of £9.17m to a worsening in the forecast surplus of £8.88m.
The year to date contract position at month 2 is based on activity data received for month 1 extrapolated forward. Overall the acute contracts are
underperforming by £0.17m year to date. As this is only based on 1 month of data the forecast remains on plan but will be reviewed next month.
The forecast outturn reflects the QIPP position reported to NHS England which overall is below plan at month 2. The transformational schemes are showing
delivery of 69% in the year to date position. The QIPP forecast should be treated with caution as delivery relies on schemes yet to be identified, and non
recurrent measures of £2.69m.
Green
As the forecast outturn is on plan, there is no movement away from the planned underlying surplus of £6.29m. However, if we review the risk adjusted forecast
outturn this shows a significant worsening in the underlying position as the majority of risks faced are recurrent in nature and only managed in 2016/17 through
non recurrent mitigations. Action is required to manage the risks and strengthen the underlying position.
Executive summary
2

On plan
Take note
Action required
Indicator Target Actual
Rating this
month
Financial position year to date Agreed surplus £454k £475k 4.6%
Financial position forecast outturn Agreed surplus £2,722k £2,722k 0.0%
Running costs outturn £3,885k £3,885k 0.0%
Underlying position £6,293k £6,293k 0.0%
QIPP year to date £413k £327k (20.8%) variance from plan
QIPP forecast outturn £7,794k £7,794k 0.0% variance from plan
Risks and opportunities Risk/opportunity £0k £341k 0.0% net (risk) / opportunity outside reported position
Creditors - Better Payment Practice Code 95.0% 90.9% (4.3%) of invoice value paid in 30 days
Capital forecast outturn £850k £850k 0.0% subject to business case
Cash £42,700k £43,200k 1.2% variance from plan
Key
CCG Finance Dashboard
3

Key Message
Amount
£000s Probability £000s Probability £000s Probability £000s
Acute Commissioning Recurrent (3,961) 48% (1,884) -9% 338 100% (3,961)
Community Health Recurrent (1,832) 75% (1,376) 17% (320) 100% (1,832)
Community Health Non recurrent (150) 67% (100) 0% 0 100% (150)
Continuing Healthcare Recurrent (1,901) 68% (1,301) 53% (1,001) 100% (1,901)
Primary Care Non recurrent (645) 68% (439) 50% (323) 100% (645)
QIPP Recurrent (7,012) 76% (5,324) 70% (4,902) 100% (7,012)
Other Risks Non recurrent (500) 50% (250) 0% 0 100% (500)
Total (16,001) 67% (10,674) 39% (6,208) 100% (16,001)
Contingency Recurrent 1,408 100% 1,408 100% 1,408 100% 1,408
Non recurrent measures Non recurrent 5,991 74% 4,453 100% 5,991 49% 2,915
Other mitigations Recurrent 2,596 91% 2,353 100% 2,596 62% 1,598
Other mitigations Non recurrent 5,386 52% 2,800 100% 5,386 22% 1,200
Total 15,381 72% 11,014 100% 15,381 46% 7,121
Overall net (risk)/ opportunity (620) 341 9,173 (8,880)
This shows the potential risks and opportunities the CCG faces at M02 which are not yet reflected in the forecast outturn. Whilst the CCG is able to mitigate the
risks in year, the risks are largely recurrent with only non recurrent mitigations which will lead to a worsening of the underling position.
After the collaborative risk share there is a likely net opportunity of £0.34m.
Likely Case Best Case Worst Case
CCG Risks
CCG Opportunities
Recurrent / Non
recurrent
Risks and Opportunities
4.

Annual
BudgetFOT
Less Non
Recurrent
Items
Add Part
Year Effects
Underlying
PositionNon Recurrent / Part Year Items
Resource Allocation 272,209 272,209 (9,154) 0 263,055 Return of 15/16 surplus
Acute Contracts 136,743 136,743 0 0 136,743
Mental Health 34,501 34,501 (345) 0 34,156 £114k DPMS, £97k Perinatal uplift, £75k CAMHS OOH, £59k MST pilot
Community Health 32,005 32,005 (304) 0 31,701
Continuing Care 19,055 19,055 0 0 19,055
Prescribing 21,502 21,502 0 0 21,502
Primary Care 7,643 7,643 (527) 0 7,116 GP IT treated non recurrently
Other 14,153 14,153 (11,549) 0 2,604
Corporate Costs 3,885 3,885 0 0 3,885
Total Expenditure 269,487 269,487 (12,725) 0 256,762
Surplus/Deficit 2,722 2,722 3,571 0 6,293
Surplus/Deficit % 1.00% 1.00% N/A N/A 2.39%
Risk Adjusted Position
Impact
£'000s
Recurrent Net (risk) / opportunity (6,124)
Non recurrent Net (risk) / opportunity 6,464
Total net opportunity 340
Planned underlying surplus 16/17 6,293
Surplus after net recurrent risk 169
The underlying position shown below is the plan position, given at month 02 there has been no change in the forecast outturn for the CCG. The notes explain those items of spend which are planned to be non recurrent.
Key Messages
Expenditure
16/17 (£'000s)
£1361k contingency, £4206k NWLFS, £2677k 1% uncommited for NHSE
£236k Proactive care home pilot, £50k CIS mgt, £18k Homeless Health
However, if we consider the risks and opportunities identified on the previous slide it is clear that the risks are recurrent but the mitigations which will provide cover in 2016/17 are mainly non recurrent in nature.
Should these risks materialise it will have a significant impact on the undelying position, as shown below which reduces from £6.29m to £0.02m.
Underlying Position
5

Issue Key drivers Financial impact
YTD, £m
Action Owner Timeline
CHC
Overspend
Placements £0.11m adverse Review of the drivers of the variance and forecasting methodology Mary
Neckles /
Louise
Maile
July F&P
Acute over-
performance
LNWH and
OOA Trusts
£0.17m adverse The Operational Group have reviewed Acute performance at month 02 and
requested further information regarding the referrals being made to these Trusts
Shelley
Martin
July F&P
Act
ion
s
Key Issues and Actions Relating to Financial Position
6

5 6 8 9
Budget Actual Variance Budget Forecast Variance
Allocation Resource Limit 43,292 43,292 0 272,209 272,209 0 0 0
Acute Contracts 19,702 19,536 166 120,602 120,602 0 0 0
Other Acute Services 2,451 2,407 44 16,140 16,140 0 0 0
Total Acute Services 22,153 21,943 210 136,742 136,742 0 0 0
Continuing Care 3,176 3,290 (115) 19,055 19,055 0 0 0
Community Health 5,271 5,420 (149) 32,005 32,005 0 0 0
Mental Health 5,724 5,656 68 34,501 34,501 0 0 0
Prescribing 3,500 3,500 0 21,502 21,502 0 0 0
Primary Care 1,274 1,274 (0) 7,643 7,643 0 0 0
Total Non Acute Services 18,945 19,141 (196) 114,706 114,706 0 0 0
Commissioning Non Acute 107 110 (2) 644 644 0 0 0
Commissioning Reserves 0 0 0 4,919 4,919 0 0 0
Programme Projects 401 401 0 2,408 2,408 0 0 0
Other Commissioned Services 584 575 10 6,183 6,183 0 0 0
Total Other 1,093 1,086 7 14,154 14,154 0 0 0
Total Commissioning Spend 42,191 42,170 21 265,602 265,602 0 0 0
Running Costs Corporate Costs 648 648 0 3,885 3,885 0 0 0
Total Expenditure 42,838 42,817 21 269,487 269,487 0 0 0
Surplus/Deficit Position 454 475 21 2,722 2,722 0 0 0
Commissioned
Services
Key message
At month 2 the CCG is reporting a year to date surplus of £0.47m and is forecasting delivery of the planned £2.72m surplus.
Year to date (£'000s) Full year (£'000s) Forecast
Variance at
M1
Change in
FOT
Variance
Surplus/Deficit including Running Costs
7

Initiative Month 2 Month 1 Movement Month 2 Month 1 Movement Further detail
Acute Contracts 166 0 166 0 0 0 The acute contract position is based on Trust reported flex activity for April.
Acute Reserve 0 0 0 0 0 0
Other Acute Services 44 0 44 0 0 0 InHealth contract £48k underspent YTD
Continuing Care (115) 0 (115) 0 0 0 Data for M2 indicates YTD overspends on CHC Placements (£74k) and Phys Dis (£50k)
Community Health (149) 0 (149) 0 0 0 MSK YTD overspend - £138k non recurrent waiting list costs and £15k contract underfunded
Mental Health 68 0 68 0 0 0 Placements £49k underspend
Prescribing 0 0 0 0 0 0 To budget - annual phasing and April reports released in June
Primary Care (0) 0 (0) 0 0 0
Commissioning Non Acute (2) 0 (2) 0 0 0 Expert Patient Programme underfunded during budget setting
Commissioning Reserves 0 0 0 0 0 0
Programme Projects 0 0 0 0 0 0
Other Commissioned Services 10 0 10 0 0 0 Share of NHS 111 contract reduced in 16/17 due to reduction in population size
Corporate Costs 0 0 0 0 0 0
Total 21 (0) 21 0 (0) 0
Source: Financial ledger
Year to date variance (£'000s) Forecast outturn variance (£'000s)
Movement of Variances including Running Costs
8
Description
Reserve
16/17
£000
Recurrent
£000
Non-
Recurrent
£000
Comments
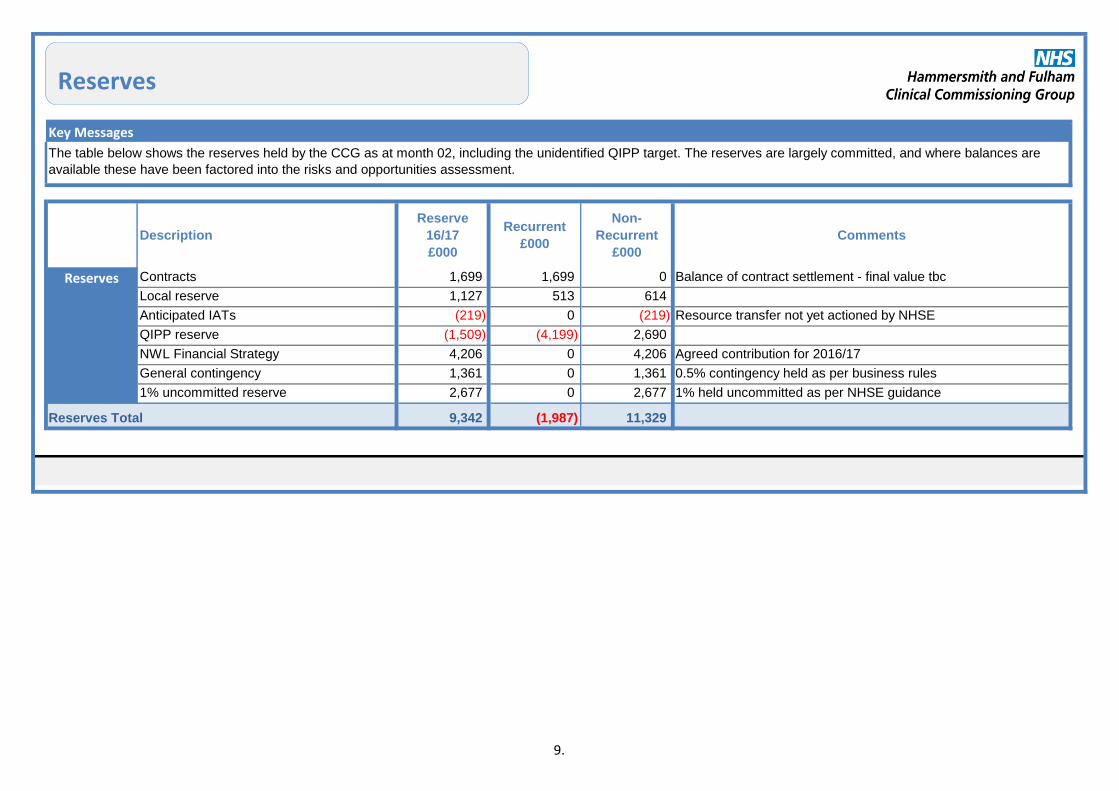
Contracts 1,699 1,699 0 Balance of contract settlement - final value tbc
Local reserve 1,127 513 614
Anticipated IATs (219) 0 (219) Resource transfer not yet actioned by NHSE
QIPP reserve (1,509) (4,199) 2,690
NWL Financial Strategy 4,206 0 4,206 Agreed contribution for 2016/17
General contingency 1,361 0 1,361 0.5% contingency held as per business rules
1% uncommitted reserve 2,677 0 2,677 1% held uncommitted as per NHSE guidance
Reserves Total 9,342 (1,987) 11,329
Reserves
Key Messages
The table below shows the reserves held by the CCG as at month 02, including the unidentified QIPP target. The reserves are largely committed, and where balances are
available these have been factored into the risks and opportunities assessment.
Reserves
9.

Area Plan Actual Variance Plan Actual Variance Comments
Acute Contracts 2 2 0 13 13 0
Mental Health 31 31 0 186 270 84
Community Health (6) 24 30 455 455 0
Total 27 57 30 654 738 84
Acute Contracts 67 38 (29) 407 407 0
Community Health 157 70 (87) 2,906 1,554 (1,352) Underdelivery of QIPP against CLCH contract
Prescribing 133 133 0 800 800 0
Other Commissioned Services 29 29 0 183 183 0
Total 386 270 (116) 4,296 2,944 (1,352)
Unidentified QIPP 0 0 0 2,844 1,422 (1,422) Assumes 50% will be identified
Non Recurrent Contingency 0 0 0 0 2,690 2,690 Release non recurrent QIPP contingency
Grand Total 413 327 (86) 7,794 7,794 0
Key Messages
The forecast outturn reflects the QIPP position reported to NHS England which overall is below plan at month 2. The transformational schemes are showing delivery of 69% in
the year to date position. The QIPP forecast should be treated with caution as delivery relies on schemes yet to be identified, and non recurrent measures of £2.69m.
YTD (£'000s) FOT (£'000s)
Transactional
Transformational
Quality, Improvement, Productivity plan (QIPP)
10

Capital • Grants with PID in progress: Parsons Green Health Centre £500k, Bridge House Centre for Health £250k, CCG IT Refresh £100k.
•
Invoice
Count
Invoice
Count
(Passed)
% Passed BPPC
Amount
Invoice
Amount
(Passed)
% Amount
Passed
NHS 472 439 93.0% 36,160 32,786 90.7%
Non NHS 1,591 1,498 94.2% 6,056 5,593 92.4%
Total 2,063 1,937 93.9% 42,216 38,379 90.9%
• Maximum Cash Drawdown Plan: £269.02m* Drawn Down to Date: £43.20m
Forecast Draw Down at Month 02: £42.70m Over Drawn: £0.5m
Source: team analysis
Key message
Cash
Creditor
payments
The CCG has not met the cumulative Better Payment Practice Code (BPPC) target for the invoice amount and invoice numbers. However the CCG has
met the NHS invoice number target. We are currently working with budget holders to ensure that invoices are coded and that outstanding queries are
dealt with promptly in order that invoices are paid within payment terms.
*The Maximum cash drawn (MCD) limit for 2016/17 is £269.02m as circulated by NHSE in the May 2016 cash report. This forecast is based on our planned net expenditure for
the year less any non cash expediture. The May 2016 cash report is showing a drawdown of £21.41m (£19.64m less drug prescribing). There was an over adverse variance
against planned cash drawn down year to date of £0.5m, this was due to extra cash requirement in oder that we settle outstanding prior year creditors. The forecast cash
drawdown is based on the Planned MCD of £269.02m.
Capital, Creditor Payments and Cash
80.0%
85.0%
90.0%
95.0%
100.0%
M01 M02
NHS Number
NHS Amount
Non NHS Number
Non NHS Amount
11

M1 SLAM
Provider Contract Status Actual (£k) Budget (£k) Actual (£k) Variance (£k) Budget (£k) Actual (£k) Variance (£k)
In Sector
Chelsea And Westminster Hospital NHS Foundation Trust CCG split TBC 2,835 5,647 5,499 148 34,387 34,387 0
Ealing Hospital NHS Trust Agreed 122 244 169 75 1,487 1,487 0
The Hillingdon Hospitals NHS Foundation Trust Agreed 49 98 89 9 588 588 0
Imperial College Healthcare NHS Trust Agreed 6,115 12,154 12,012 142 73,211 73,211 0
North West London Hospitals NHS Trust Agreed 59 117 160 (43) 721 721 0
Royal Brompton and Harefield NHS Foundation Trust Agreed 58 116 140 (24) 695 695 0
West Middlesex University Hospital NHS Trust CCG split TBC 36 73 87 (14) 443 443 0
Out of Sector
Guy's And St Thomas' NHS Foundation Trust Not agreed 106 211 260 (48) 1,417 1,417 0
King's College Hospital NHS Foundation Trust Not agreed 44 98 85 13 610 610 0
Moorfields Eye Hospital NHS Foundation Trust Agreed 57 114 136 (21) 684 684 0
Royal Free London NHS Foundation Trust Not agreed 32 66 72 (6) 414 414 0
St Georges University Hospitals Nhs Foundation Trust Not agreed 50 100 147 (47) 599 599 0
The Royal Marsden NHS Foundation Trust Not agreed 64 128 153 (25) 768 768 0
University College London Hospitals NHS Foundation Trust Not agreed 127 246 248 (2) 1,656 1,656 0
Other Out of Area Providers 82 289 278 12 1,736 1,736 0
Acute SLA Contract Total 9,836 19,702 19,536 166 119,416 119,416 0
Reserves
Acute SLA - Reserve 0 0 0 1,186 1,186 0
Grand Total 9,836 19,702 19,536 166 120,602 120,602 0
Key Messages
The year to date contract position at month 2 is based on activity data received for month 1 extrapolated forward.
Overall the acute contracts are underperforming by £0.17m YTD. As this is only based on 1 month of data the forecast remains on plan but will be reviewed next month.
The key in sector contracts have been agreed, however, the CCG split still needs to be finalised for C&W. Based on the current position below, the final contract values in aggregate have been settled
below envelope and enabled a reserve of £1.19m to be set to cover in year overperformance.
M2 YTD Position Full Year Outturn Position
Acute Contracts: Year to Date Performance
12.

Key Messages
Month Recurrent / non
recurrent
Allocation Confirmed
£'000s
Anticipated
£'000s
Total £'000s
Baseline Recurrent Initial CCG Programme Allocation 259,170 259,170
Baseline Non recurrent Return of Surplus/(Deficit) 9,154 9,154
Programme allocation total 268,324 0 268,324
Baseline Recurrent Initial CCG Running Cost Allocation 3,885 3,885
Running cost allocation 3,885 0 3,885
Total RRL 272,209 0 272,209
Source: Financial ledger
There was no change to the RRL in month 2.
Appendix 1.1: Revenue resource limit
13.