montgomery county demographics april 28, 2021
TRANSCRIPT

Montgomery County Demographics 104/28/2021
Montgomery County DemographicsGrowth and Change across Time and Place
Montgomery Planning Research & Strategic Projects Division 04/28/2021

Montgomery County Demographics 204/28/2021
Agenda• Population over time
✓Growth & growth rates
✓Components of growth
✓Social characteristics of population
• Population by place
✓ Density of population by place
✓ Population social characteristics by place
• Predominance of race by place over time

Montgomery County Demographics 304/28/2021
0
10,000
20,000
30,000
40,000
50,000
60,000
70,000
80,000
Total Population Increase, 2010-2019
Population Growth
Montgomery County is currently
home to over 1 Million residents.
It has had an estimated population
increase of over 75,000 since 2010.
Source: 2019 Population Estimates Program, U.S. Census Bureau

Montgomery County Demographics 404/28/2021
Growth at Decreasing Rate
0.0%
0.2%
0.4%
0.6%
0.8%
1.0%
1.2%
1.4%
1.6%
1.8%
800,000
850,000
900,000
950,000
1,000,000
1,050,000
1,100,000
2010 2011 2012 2013 2014 2015 2016 2017 2018 2019
Population, U.S. Census Bureau Population Estimates Program, 2019
Annual Growth Rate
Linear (Annual Growth Rate) Source: 2019 Population Estimates Program, U.S. Census Bureau

Montgomery County Demographics 504/28/2021
Components of Population Change
-3,724
5,896
-10,000
-5,000
0
5,000
10,000
15,000
20,000
-10,000
-5,000
0
5,000
10,000
15,000
20,000
2010- 2011- 2012- 2013- 2014- 2015- 2016- 2017- 2018-
2011 2012 2013 2014 2015 2016 2017 2018 2019
Net Migration Net Natural Increase Total Population Change
Source: 2019 Population Estimates Program, U.S. Census Bureau

Montgomery County Demographics 604/28/2021
Natural Increase
12,240
-6,344
-10,000
-5,000
0
5,000
10,000
-10,000
-5,000
0
5,000
10,000
15,000
2010- 2011- 2012- 2013- 2014- 2015- 2016- 2017- 2018-
2011 2012 2013 2014 2015 2016 2017 2018 2019
Births Deaths Net Natural Increase
Source: 2019 Population Estimates Program, U.S. Census Bureau

Montgomery County Demographics 704/28/2021
Declining Birth Rates
10.500
11.000
11.500
12.000
12.500
13.000
13.500
14.000
2010- 2011- 2012- 2013- 2014- 2015- 2016- 2017- 2018-
2011 2012 2013 2014 2015 2016 2017 2018 2019
Birth Rate Linear (Birth Rate)
Source: 2019 Population Estimates Program, U.S. Census Bureau

Montgomery County Demographics 804/28/2021
Declining Net Migration
-9,423
5,699
-15,000
-10,000
-5,000
0
5,000
10,000
15,000
-15,000
-10,000
-5,000
0
5,000
10,000
15,000
2010- 2011- 2012- 2013- 2014- 2015- 2016- 2017- 2018-
2011 2012 2013 2014 2015 2016 2017 2018 2019
Net Domestic Migration Net International Migration Net Migration
Source: 2019 Population Estimates Program, U.S. Census Bureau

Montgomery County Demographics 904/28/2021
Top Regions and Countries of Origin
Latin America,
39.1%
Asia, 35.9%
Africa, 16.4%
Europe, 7.8%Other, 0.9%
Country of Origin
El Salvador 12.9%
India 7.9%
China, excluding Hong Kong and Taiwan 6.7%
Ethiopia 5.2%
Guatemala 4.7%
Peru 3.9%
Philippines 3.0%
Vietnam 2.9%
Korea 2.9%
Honduras 2.4%
Source: 2019 American Community Survey, 1-year estimate, U.S. Census Bureau

Montgomery County Demographics 1004/28/2021
Top Languages Spoken at HomeSpeak only English 58.3%
Spanish 17.4%
Other Indo-European languages 5.3%
Unspecified languages 4.2%
Chinese (incl. Mandarin, Cantonese) 3.7%
French, Haitian, or Cajun 3.1%
Other Asian and Pacific Island languages 2.1%
Russian, Polish, or other Slavic languages 1.3%
Vietnamese 1.2%
Korean 1.1%
Tagalog (incl. Filipino) 0.9%
German or other West Germanic languages 0.7%
Arabic 0.6%
Source: 2019 American Community Survey, 1-year estimate, U.S. Census Bureau

Montgomery County Demographics 1104/28/2021
Racial and Ethnic Diversity
Source: 2019 American Community Survey & 2019 Population Estimates Program, U.S. Census Bureau
0
100,000
200,000
300,000
400,000
500,000
600,000
2000 2010 2019
59.5%49.3%
43.8%
11.5%
17.0%19.5%
14.8%16.6%
17.9%
11.3% 13.9% 14.7%
2.9% 3.2% 4.0%
2000 2010 2019
Non-HispanicWhite
Hispanic
Black or AfricanAm. Alone
Asian & Pacific Isl.
Other Race

Montgomery County Demographics 1204/28/2021
Racial and Ethnic Diversity
23% 18%31%
25%18%
14%12%
17%17%
13%
20%
17%
24%22%
24%
27%
30%
21%25%
30%
16%22%
7% 11% 15%
Montgomery White, notHispanic
Hispanic Black Asian
65+
45-64
30-44
18-29
<18
Source: 2019 American Community Survey, 1-year estimate, U.S. Census Bureau

Montgomery County Demographics 1304/28/2021
Agenda• Population over time
✓Growth & growth rates
✓Components of growth
✓Social characteristics of population
• Population by place
✓ Density of population by place
✓ Population social characteristics by place
• Predominance of race by place over time

Montgomery County Demographics 1404/28/2021
Population by Place
Source: 2019 American Community Survey, 5-year estimate, U.S. Census Bureau

Montgomery County Demographics 1504/28/2021
Growth by Place
Source: 2019 American Community Survey, 5-year estimate, U.S. Census Bureau
2010 – 2019 Clusters of Growth

Montgomery County Demographics 1604/28/2021
Median Age by Place
Source: 2019 American Community Survey, 5-year estimate, U.S. Census Bureau
Countywide Median Age: 39.2 Years
Leisure World

Montgomery County Demographics 1704/28/2021
Median Income by Place
Source: 2019 American Community Survey, 5-year estimate, U.S. Census Bureau
Countywide Median Household Income: $108,820

Montgomery County Demographics 1804/28/2021
Agenda• Population over time
✓Growth & growth rates
✓Components of growth
✓Social characteristics of population
• Population by place
✓ Density of population by place
✓ Population social characteristics by place
• Predominance of race by place over time

Montgomery County Demographics 1904/28/2021
What is a census tract?• Area roughly equivalent to a neighborhood established by the Census
Bureau for analyzing populations.
• Largest level of population division of a county
• Population between 2,500 to 8,000 people
• Contiguously drawn with the intention of being maintained over time
• Used for statistical analysis of basic population characteristics:
• Race, age, sex, marital status, household composition, family characteristics,
educational attainment and household size

Montgomery County Demographics 2004/28/2021
Census Geography Hierarchy
Southern Montgomery County
One Census Tract
Four Census Block Groups
79 Census Blocks

Montgomery County Demographics 2104/28/2021
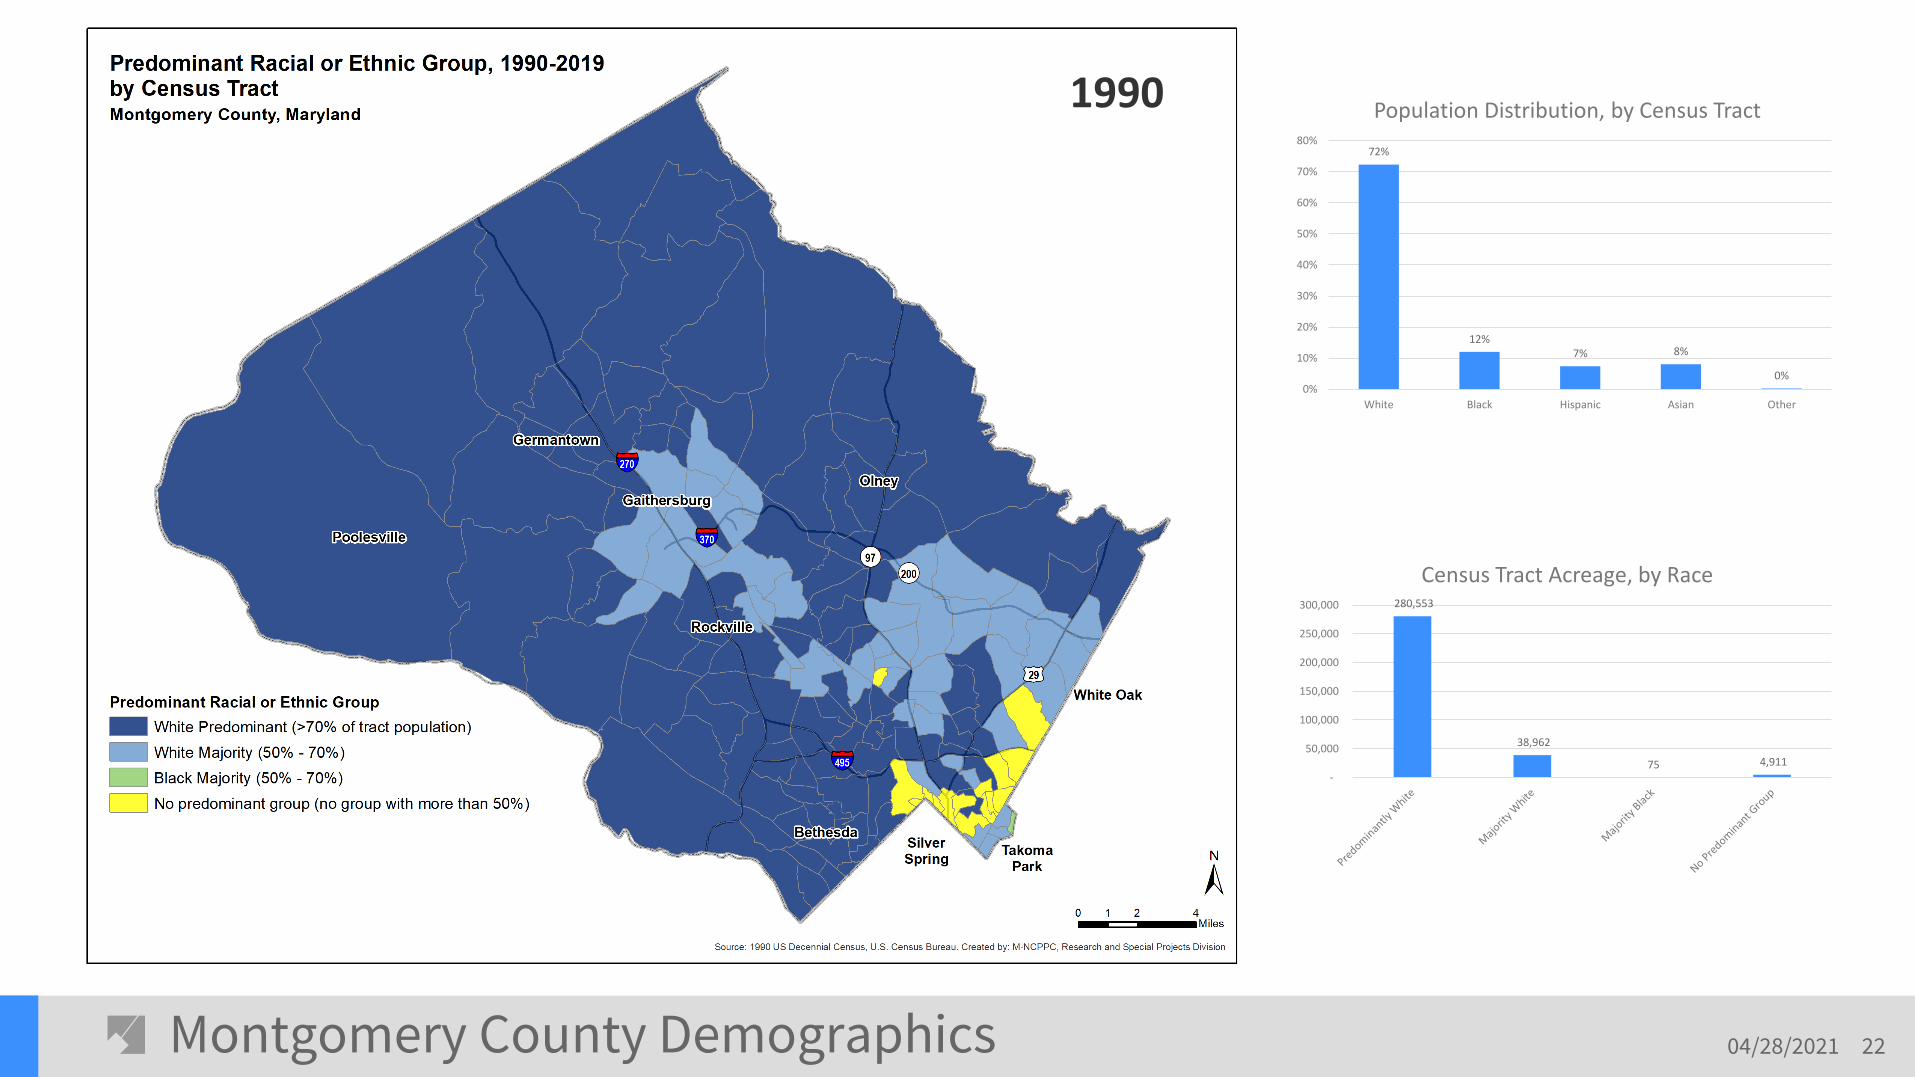
Montgomery County census tracts 1990-2019
• Things to observe
• Tract sizes are different (larger = less populated)
• Whiter and less dense farther upcounty
• Less racial predominance downcounty, eastern, and along I-270 corridor
• Generally becoming more diverse (no racial predominance)
• Tracts becoming “Minority-majority”
Montgomery County Demographics 2204/28/2021
1990
280,553
38,962
75 4,911
-
50,000
100,000
150,000
200,000
250,000
300,000
Census Tract Acreage, by Race
72%
12%7% 8%
0%0%
10%
20%
30%
40%
50%
60%
70%
80%
White Black Hispanic Asian Other
Population Distribution, by Census Tract

Montgomery County Demographics 2304/28/2021
2000
247,230
54,306
343 22,668
-
50,000
100,000
150,000
200,000
250,000
300,000
Census Tract Acreage, by Race
65%
15%12% 11%
5%
0%
10%
20%
30%
40%
50%
60%
70%
White Black Hispanic Asian Other
Population Distribution, by Census Tract

Montgomery County Demographics 2404/28/2021
2010
156,593
92,286
81 2,114 1,742
71,605
-
20,000
40,000
60,000
80,000
100,000
120,000
140,000
160,000
180,000
Census Tract Acreage, by Race
49%
17% 17%14%
3%
0%
10%
20%
30%
40%
50%
60%
White Black Hispanic Asian Other
Population Distribution, by Census Tract
Montgomery County Demographics 2504/28/2021
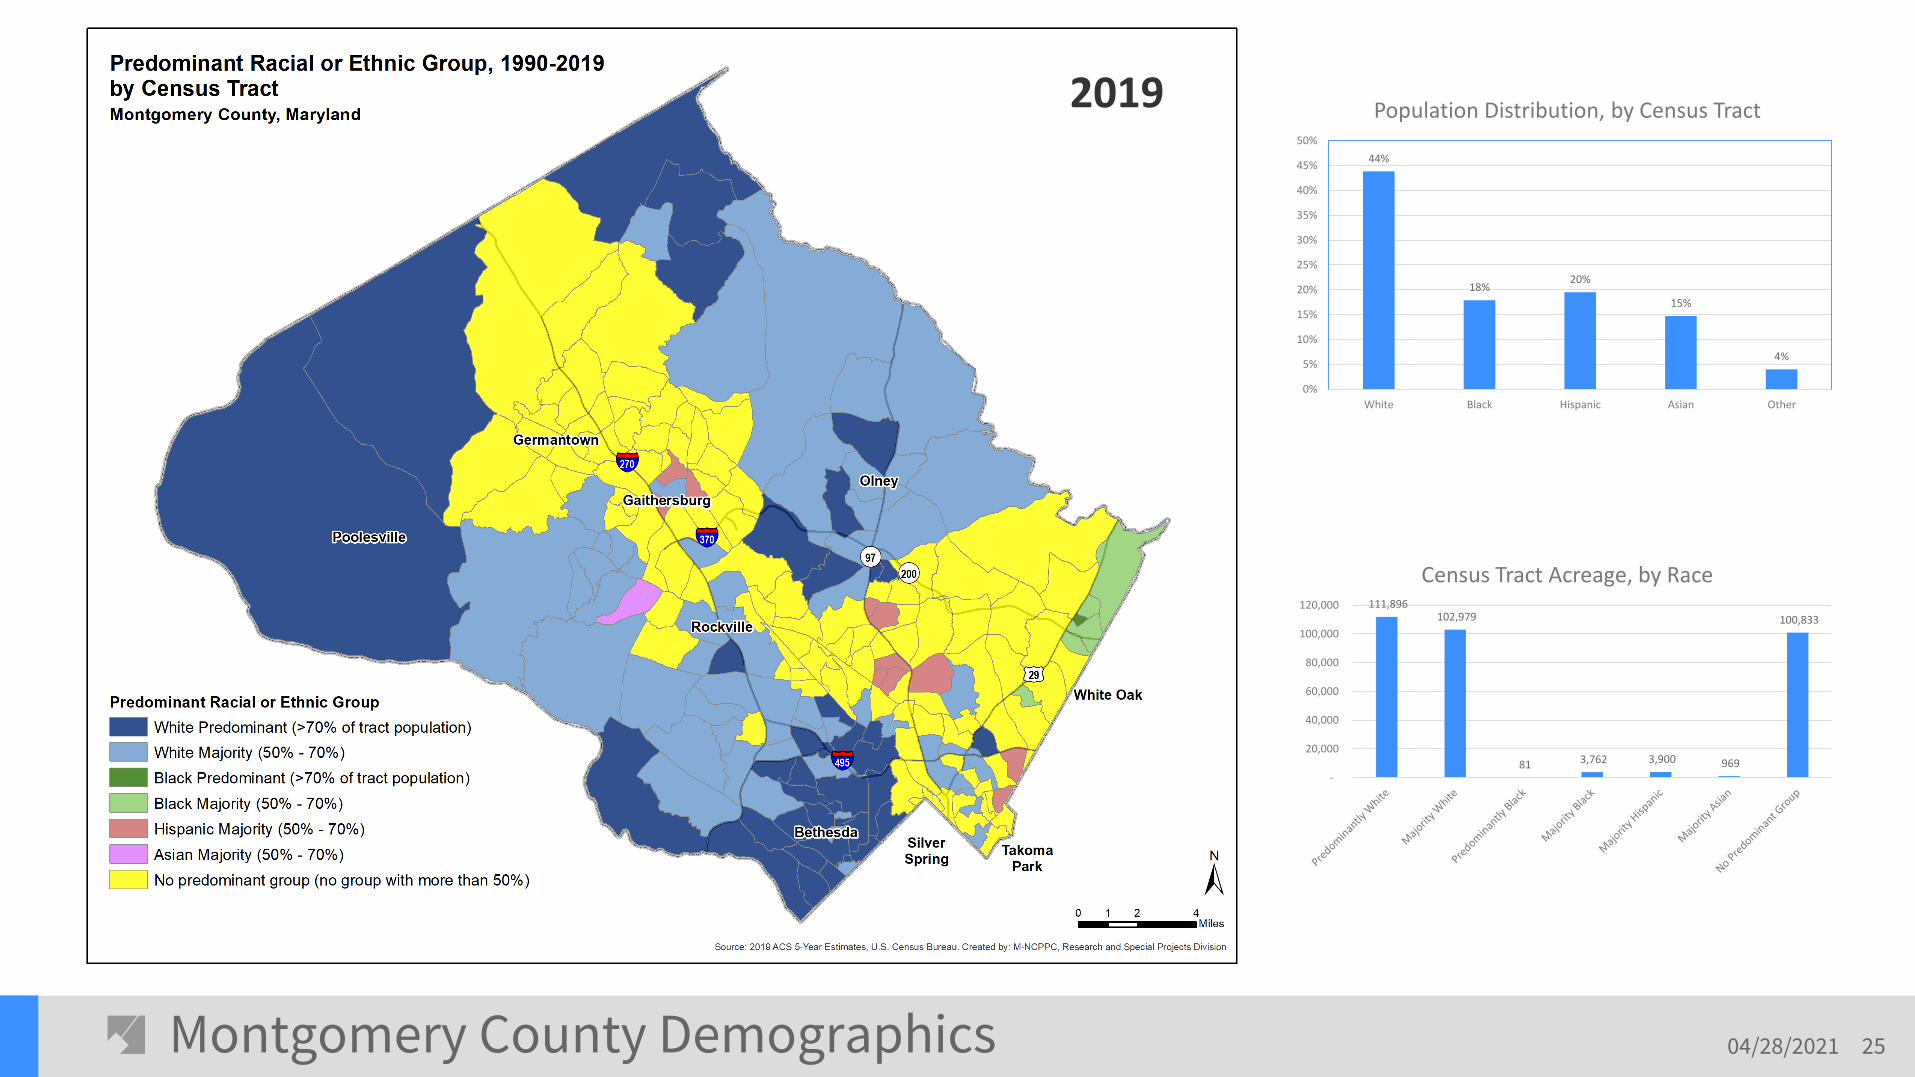
2019
111,896 102,979
81 3,762 3,900 969
100,833
-
20,000
40,000
60,000
80,000
100,000
120,000
Census Tract Acreage, by Race
44%
18%20%
15%
4%
0%
5%
10%
15%
20%
25%
30%
35%
40%
45%
50%
White Black Hispanic Asian Other
Population Distribution, by Census Tract

Montgomery County Demographics 2604/28/2021
1990 &2019
1990
2019

Montgomery County Demographics 2704/28/2021
Independent Place Acreage
Barnesville town 313
Brookeville town 89
Chevy Chase town 297
Chevy Chase Section Five village 68
Chevy Chase Section Three village 75
Chevy Chase View town 172
Chevy Chase Village town 269
Gaithersburg city 6,683
Garrett Park town 161
Glen Echo town 66
Kensington town 322
Laytonsville town 672
Leisure World 727
Martin's Additions village 88
North Chevy Chase village 74
Poolesville town 2,527
Rockville city 8,729
Somerset town 176
Takoma Park city 1,341

Montgomery County Demographics 2804/28/2021
2019
Independent Place 1990 2019
Barnesville town WP WP
Brookeville town WP WM
Chevy Chase town WP WP
Chevy Chase Section Five village WP WP
Chevy Chase Section Three village WP WP
Chevy Chase View town WP WP
Chevy Chase Village town WP WP
Gaithersburg city WM NP
Garrett Park town WP WP
Glen Echo town WP WP
Kensington town WP WP
Laytonsville town WP WM
Leisure World WP WP/NP
Martin's Additions village WP WP
North Chevy Chase village WP WP
Poolesville town WP WP
Rockville city WM NP
Somerset town WP WP
Takoma Park city NP NP
Racial Predominance

Montgomery County Demographics 2904/28/2021
2019
ADD EQUITY FOCUS AREA MAP
Population Percent of Total Pop Acreage Percent of Total Land
EFA 275,873 27% 25,201 8%
County 1,040,133 324,398
56 Tracts (26% of all tracts)

Montgomery County Demographics 3004/28/2021
20191990 2019 1990 2019
WP HM WM NP
WP NP WM NP
WP NP WM NP
WP NP WM NP
WP NP WM NP
WP NP WM NP
WP NP WM NP
WP NP WM NP
WP NP WM NP
WP NP WM NP
WP NP WM NP
WP NP WM NP
WP NP WM NP
WP NP WM NP
WP NP WM NP
WP NP WM BP
WP NP NP HM
WM HM NP HM
WM HM NP HM
WM HM NP HM
WM HM NP NP
WM HM NP NP
WM HM NP NP
WM HM NP NP
WM HM NP NP
WM HM NP NP
WM NP NP NP
WM NP
Racial Predominance Racial Predominance

Montgomery County Demographics 3104/28/2021
Demographic Changes Summary
Age:
Over 65 Population is up and rising
Under 5 Population is falling, as are birth rates
The younger population is more diverse
Race/Ethnicity:
Increasing diversity but geographic segregation along racial lines
Income/Race are correlated and share a geographic pattern

Montgomery County Demographics 3204/28/2021
Demographic Changes Summary
Geographic Distribution:
Upcounty is whiter and less densely populated
Downcounty, eastern county, and along I-270 corridor have less racial
predominance
Tracts becoming more racially diverse and changing to non-white
majority
Montgomery County Demographics 3304/28/2021
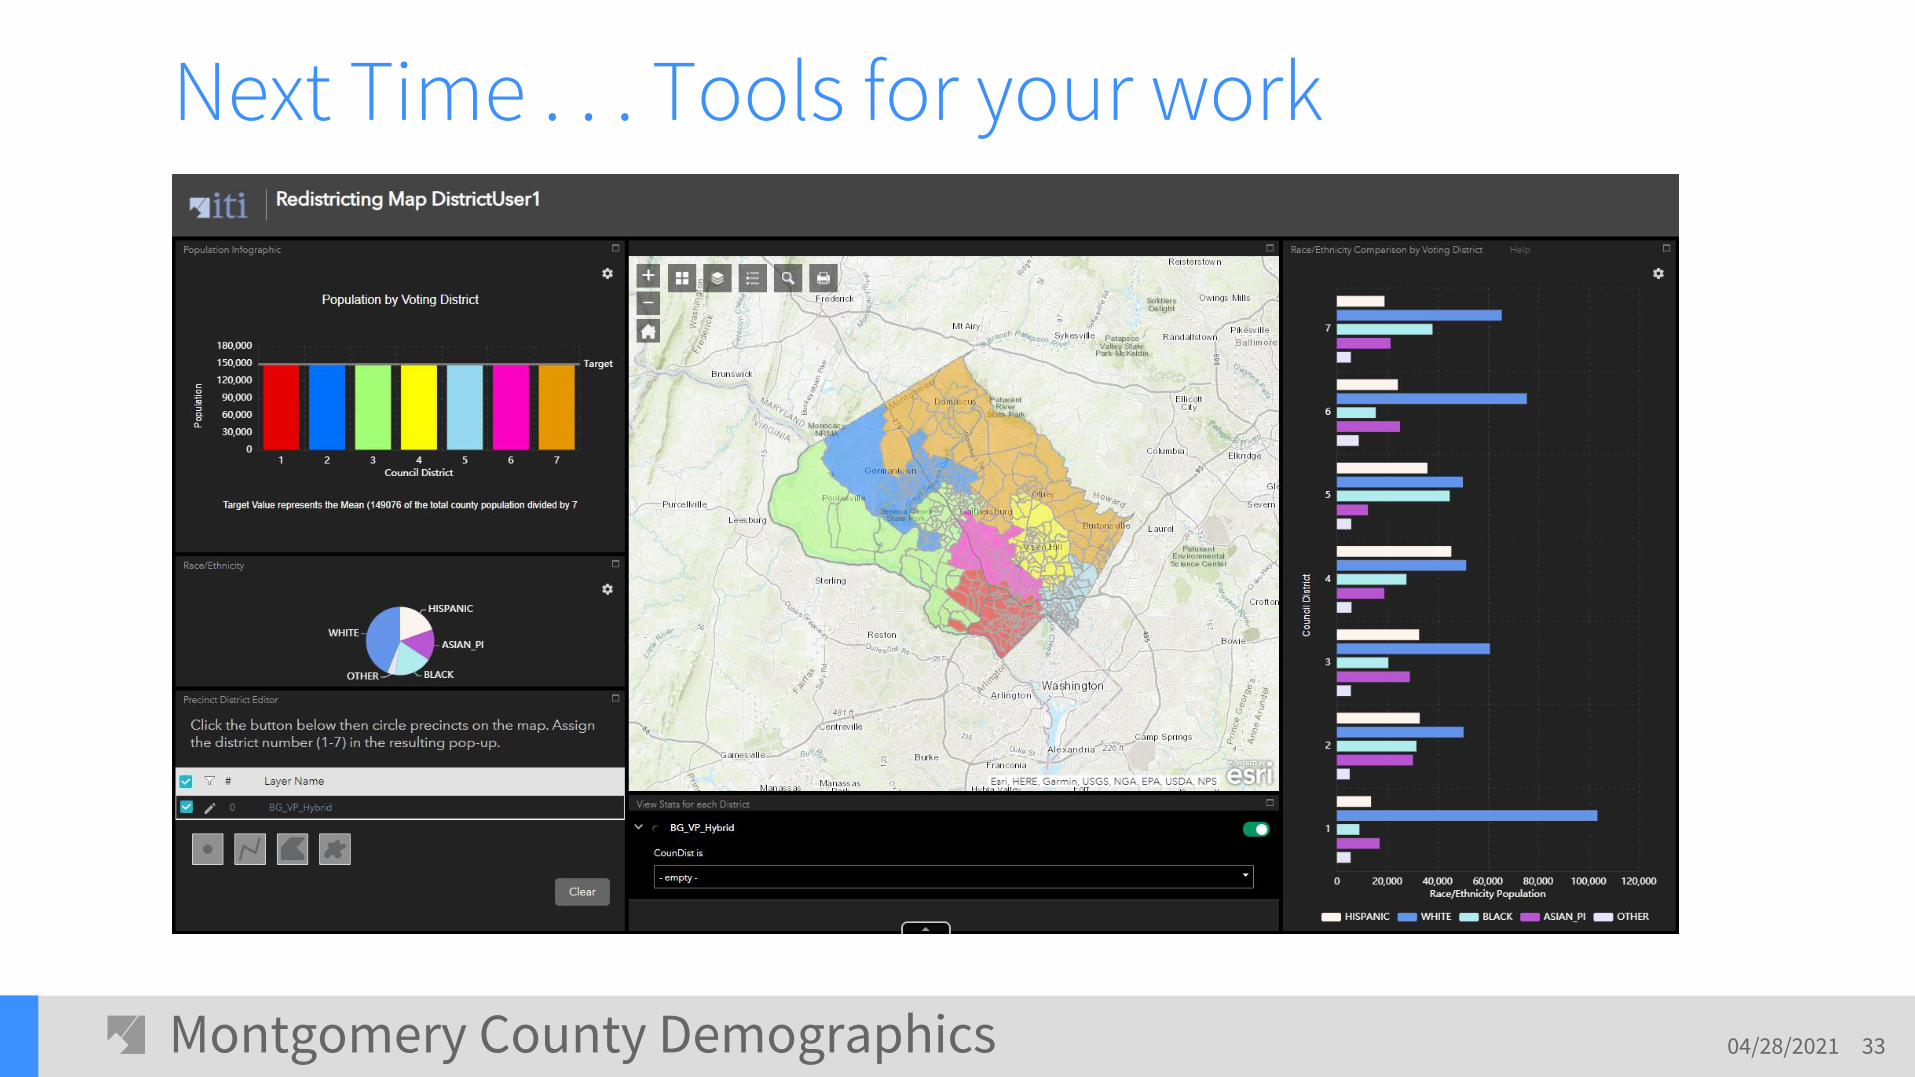
Next Time . . . Tools for your work