demographics report: and children birth to six county, maryland doc… · the montgomery county...
TRANSCRIPT
DemographicsReport:FamiliesandChildrenBirthtoSixMontgomeryCounty,Maryland
MontgomeryCountyDepartmentofHealthand
HumanResourcesChildren,YouthandFamiliesServices
EarlyChildhoodServices
Funded by a grant from the
Publication Date: Montgomery County Collaboration December, 2014 Council for Children, Youth and Families
IsiahLeggett,CountyExecutiveUmaS.Ahluwalia,DirectorJoAnnBarnes,ActingChief
MontgomeryCountyDepartmentofHealthandHumanServices
Children,YouthandFamiliesServicesEarlyChildhoodServices
7300CalhounPlace,Suite700Rockville,Maryland20855
240‐777‐4769Voice,240‐777‐1009TTY,240‐777‐1153FAX
Languagetranslationandalternativeformatsofthisreportareavailableuponrequest.Foradditionalinformationonthereportpleasecallorwriteattheaddressandtelephonenumberslisted
above.
MontgomeryCountydoesnotdiscriminateonthebasisofdisabilityinemploymentorintheadmissionoraccesstoitsprogramsorservice
240‐777‐GROW
TableofContents Population
o General Demographics (county) 1
o Population Change (state and county) 2
o Relative Growth Rates (county) 3
o Minority Population Change (county) 4
o Distribution by Race and Ethnicity (state and county) 5
o Race and Ethnicity (county subdivisions) 6
o Child Count by Age (county and county subdivisions) 7
o Children Under Age 6 (county subdivisions) 8
o Children Under Age 6 (selected cities) 9
o Children Under Age 6 by Household Type (state and county) 10
o Foreign Born Population (county) 12
o Language Spoken at Home (state and county) 14
o Language spoken at Home by Population Five Years and Older (county and county subdivisions)
16
o Language spoken at Home by Population Five Years and Older (selected cities) 17
o Projected Population Change of Chil dren Age 0 to 4 Years (county) 18
o Household Forecast (County Planning Area) 19
Economics
o Household Income and Self Sufficiency Standard (state and county) 20
o Median Income of Families with Children Under Age 18 (county subdivisions) 21
o Change in Median Income (census designated places) 22
o Children Under 6 by Poverty Category (county) 23
o Children Below 300% Federal Poverty Level (county subdivisions) 24
Indicators of Well‐Being
Children are Healthy
o Socio‐Economic Risk Factors (county subdivision) 25
o Women Receiving Prenatal Care During First Trimester (county) 28
o Asthma Prevalence (county) 29
o Death Rate of Infants and Children Age One to Four Years (state and county) 31
o Leading Cause of Death in Children Under One Year (county) 32
Children are Safe o Child Protective Services Cases (county) 33 Young Children Ready for School
o Kindergarten Readiness Rate (state and county) 34
Services for Young Children
o Calls for Child Care Resource & Referral Services (county) 36
o Demand for Child Care (county) 37
o Child Care Capacity (county) 38
o Child Care Cost (county) 40
o Montgomery County Infants & Toddlers Program (county) 41
o Healthy Families Montgomery Home Visiting (county) 42
o Judy Centers (state) 43
o Early Head Start, Prekindergarten, Head Start (county) 44
o Provider Training and Technical Assistance (county) 45
o Financial Assistance (state and county) 47
o Homeless Population (county) 50 Appendices Appendix 1: Montgomery County Subdivisions Detail Listing 52
Appendix 2: Montgomery County Subdivisions (map) 53
Appendix 3: Montgomery County Planning Areas 54
Appendix 4: Terms & Definitions 55
Preface
The Montgomery County Early Childhood Services Demographic Report provides an overview of
demographic data related to young children birth to age six and families living in Montgomery C ounty.
The report’s objective is to provide an overview of some factors affecting early learning planning and
delivery in Montgomery County. It originated as an update to the demographic section in the
Montgomery County Early Childhood Initiative’s Comprehensive Plan published in June 2000 and to
inform a new comprehensive plan for early childhood education. While many of the data points are consistent
between the two publications, readers should be cautioned against making direct comparisons as the
data source and calculation methods used to compile the tables may differ. In some cases, when
comparing data to the 2000 comprehensive plan, 2010 census information was used rather than using
more recent data. Multiple data sources were used to compile the data tables and analysis; each data source is identified
as a footnote. When possible, the primary data owner served as the data source; however, secondary
sources did serve as a data source when the data presentation served to further the report’s objective.
The majority of demographic data was obtained from U.S. Census Bureau sources. State and county‐
level sources provided program and service delivery data. Effort was made to obtain the most recent
data; however, the availability of data was affected by the geographic area reported, the program
reporting cycle, and specific reporting concerns. In all cases, the reader should consider the data source
and date before trying to compare data tables within the study and between reports. The appendices serve as references for Montgomery County sub ‐areas used in the report. In addition,
there is an appendix that describes some of the terms used throughout the report.
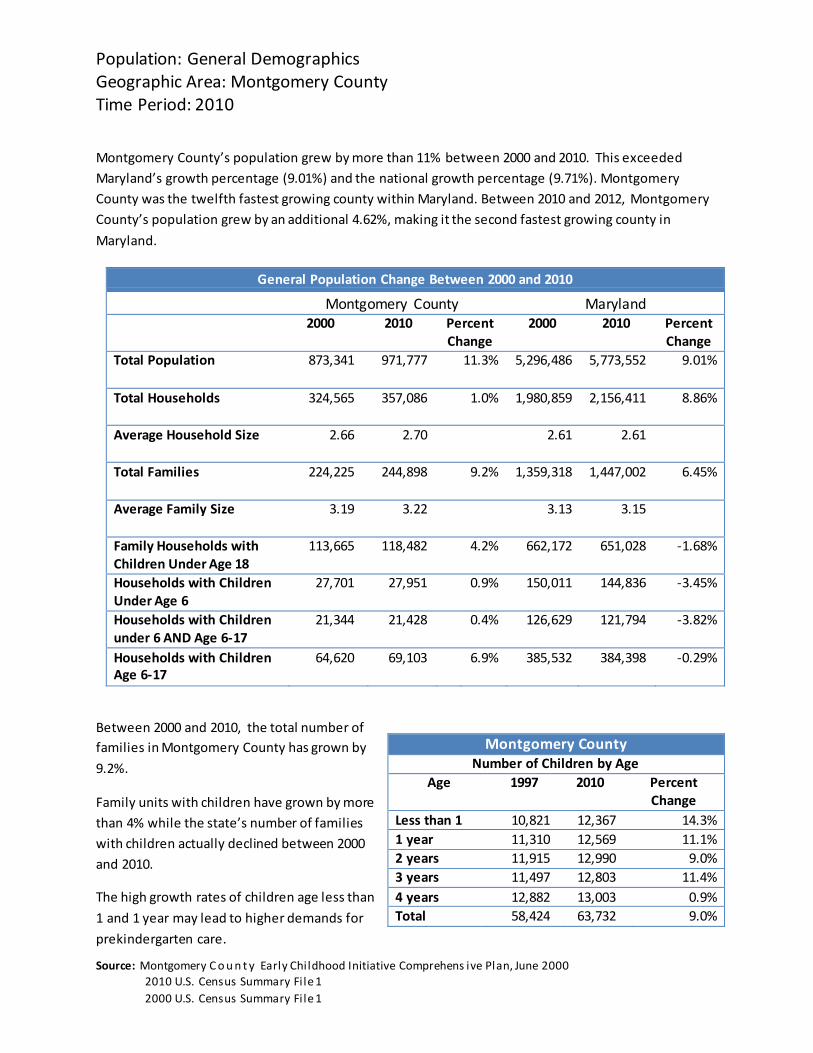
Population: General Demographics Geographic Area: Montgomery County Time Period: 2010
Montgomery County’s population grew by more than 11% between 2000 and 2010. This exceeded
Maryland’s growth percentage (9.01%) and the national growth percentage (9.71%). Montgomery
County was the twelfth fastest growing county within Maryland. Between 2010 and 2012, Montgomery
County’s population grew by an additional 4.62%, making it the second fastest growing county in
Maryland.
General Population Change Between 2000 and 2010
Montgomery County Maryland
2000 2010 Percent Change
2000 2010 Percent Change
Total Population 873,341 971,777 11.3% 5,296,486 5,773,552 9.01%
Total Households 324,565 357,086 1.0% 1,980,859 2,156,411 8.86%
Average Household Size 2.66 2.70 2.61 2.61
Total Families 224,225 244,898 9.2% 1,359,318 1,447,002 6.45%
Average Family Size 3.19 3.22 3.13 3.15
Family Households with Children Under Age 18
113,665 118,482 4.2% 662,172 651,028 ‐1.68%
Households with Children Under Age 6
27,701 27,951 0.9% 150,011 144,836 ‐3.45%
Households with Children under 6 AND Age 6‐17
21,344 21,428 0.4% 126,629 121,794 ‐3.82%
Households with Children Age 6‐17
64,620 69,103 6.9% 385,532 384,398 ‐0.29%
Montgomery County Number of Children by Age
Age 1997 2010 Percent Change
Less than 1 10,821 12,367 14.3%
1 year 11,310 12,569 11.1%
2 years 11,915 12,990 9.0%
3 years 11,497 12,803 11.4%
4 years 12,882 13,003 0.9%
Total 58,424 63,732 9.0%
Between 2000 and 2010, the total number of
families in Montgomery County has grown by
9.2%. Family units with children have grown by more
than 4% while the state’s number of families
with children actually declined between 2000
and 2010.
The high growth rates of children age less than
1 and 1 year may lead to higher demands for
prekindergarten care.
Source: Montgomery Coun t y Ea rl y Chi l dhood Initiative Comprehens i ve Pl a n, June 2000
2010 U.S. Cens us Summa ry Fi l e 1
2000 U.S. Cens us Summa ry Fi l e 1
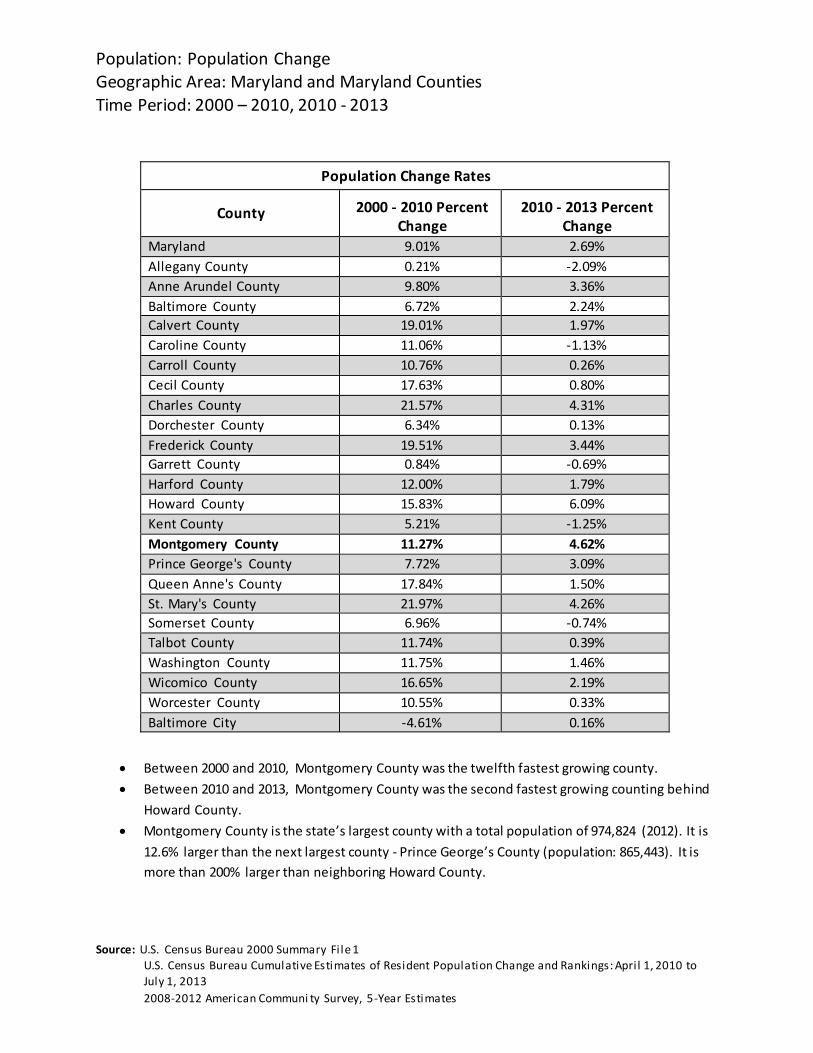
Population: Population Change Geographic Area: Maryland and Maryland Counties Time Period: 2000 – 2010, 2010 ‐ 2013
Population Change Rates
County
2000 ‐ 2010 Percent Change
2010 ‐ 2013 Percent Change
Maryland 9.01% 2.69%
Allegany County 0.21% ‐2.09%
Anne Arundel County 9.80% 3.36%
Baltimore County 6.72% 2.24%
Calvert County 19.01% 1.97%
Caroline County 11.06% ‐1.13%
Carroll County 10.76% 0.26%
Cecil County 17.63% 0.80%
Charles County 21.57% 4.31%
Dorchester County 6.34% 0.13%
Frederick County 19.51% 3.44%
Garrett County 0.84% ‐0.69%
Harford County 12.00% 1.79%
Howard County 15.83% 6.09%
Kent County 5.21% ‐1.25%
Montgomery County 11.27% 4.62%
Prince George's County 7.72% 3.09%
Queen Anne's County 17.84% 1.50%
St. Mary's County 21.97% 4.26%
Somerset County 6.96% ‐0.74%
Talbot County 11.74% 0.39%
Washington County 11.75% 1.46%
Wicomico County 16.65% 2.19%
Worcester County 10.55% 0.33%
Baltimore City ‐4.61% 0.16%
Between 2000 and 2010, Montgomery County was the twelfth fastest growing county.
Between 2010 and 2013, Montgomery County was the second fastest growing counting behind
Howard County.
Montgomery County is the state’s largest county with a total population of 974,824 (2012). It is
12.6% larger than the next largest county ‐ Prince George’s County (population: 865,443). It is
more than 200% larger than neighboring Howard County.
Source: U.S. Cens us Burea u 2000 Summa ry Fi l e 1
U.S. Cens us Burea u Cumul a ti ve Es ti ma tes of Res i dent Popul a ti on Cha nge a nd Ra nki ngs : Apri l 1, 2010 to
Jul y 1, 2013
2008‐2012 Ameri ca n Communi ty Survey, 5 ‐Yea r Es ti ma tes
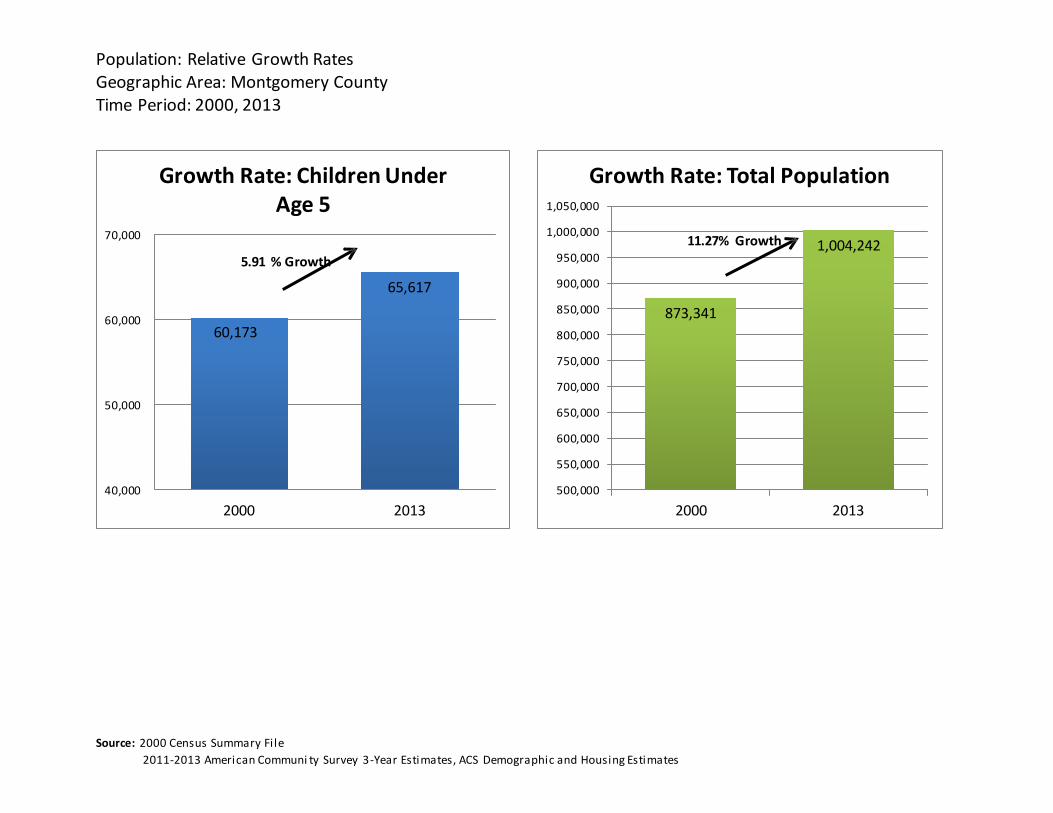
Population: Relative Growth Rates Geographic Area: Montgomery County Time Period: 2000, 2013
70,000
Growth Rate: Children Under Age 5
Growth Rate: Total Population
1,050, 000
1,000, 000
60,000
50,000
40,000
5.91 % Growth
60,173
65,617
950, 000
900, 000
850, 000
800, 000
750, 000
700, 000
650, 000
600, 000
550, 000
500, 000
11.27% Growth
873,341
1,004,242
2000 2013 2000 2013 Source: 2000 Cens us Summa ry Fi l e
2011‐2013 Ameri ca n Communi ty Survey 3 ‐Yea r Es ti ma tes , ACS Demogra phi c a nd Hous i ng Es ti ma tes
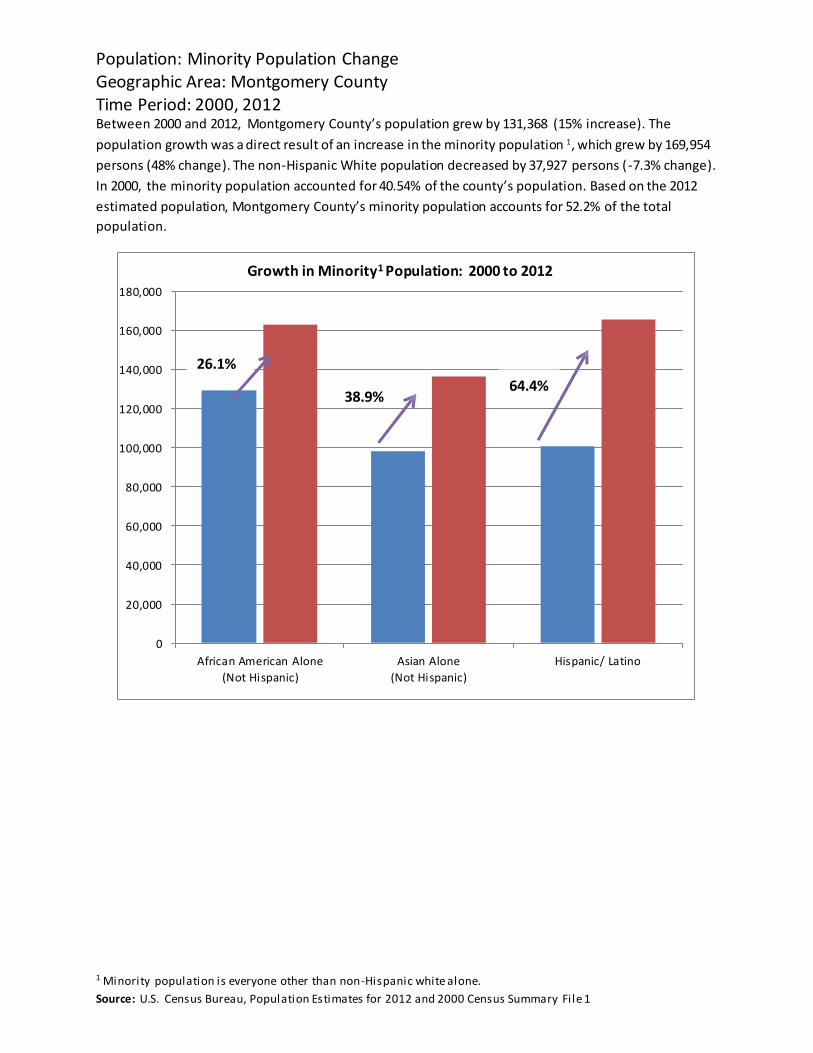
Population: Minority Population Change Geographic Area: Montgomery County Time Period: 2000, 2012 Between 2000 and 2012, Montgomery County’s population grew by 131,368 (15% increase). The
population growth was a direct result of an increase in the minority population 1, which grew by 169,954
persons (48% change ). The non‐Hispanic White population decreased by 37,927 persons ( ‐7.3% change).
In 2000, the minority population accounted for 40.54% of the county’s population. Based on the 2012
estimated population, Montgomery County’s minority population accounts for 52.2% of the total
population.
180, 000
Growth in Minority1 Population: 2000 to 2012
160, 000
140, 000
120, 000
26.1%
38.9%
64.4%
100, 000
80,000
60,000
40,000
20,000
0
Africa n American Alone
(Not Hi spanic)
Asian Alone
(Not Hi spanic)
His panic/ La tino
1 Mi nori ty popul a ti on i s everyone other tha n non ‐Hi s pa ni c whi te a l one.
Source: U.S. Cens us Burea u, Popul a ti on Es ti ma tes for 2012 a nd 2000 Cens us Summa ry Fi l e 1
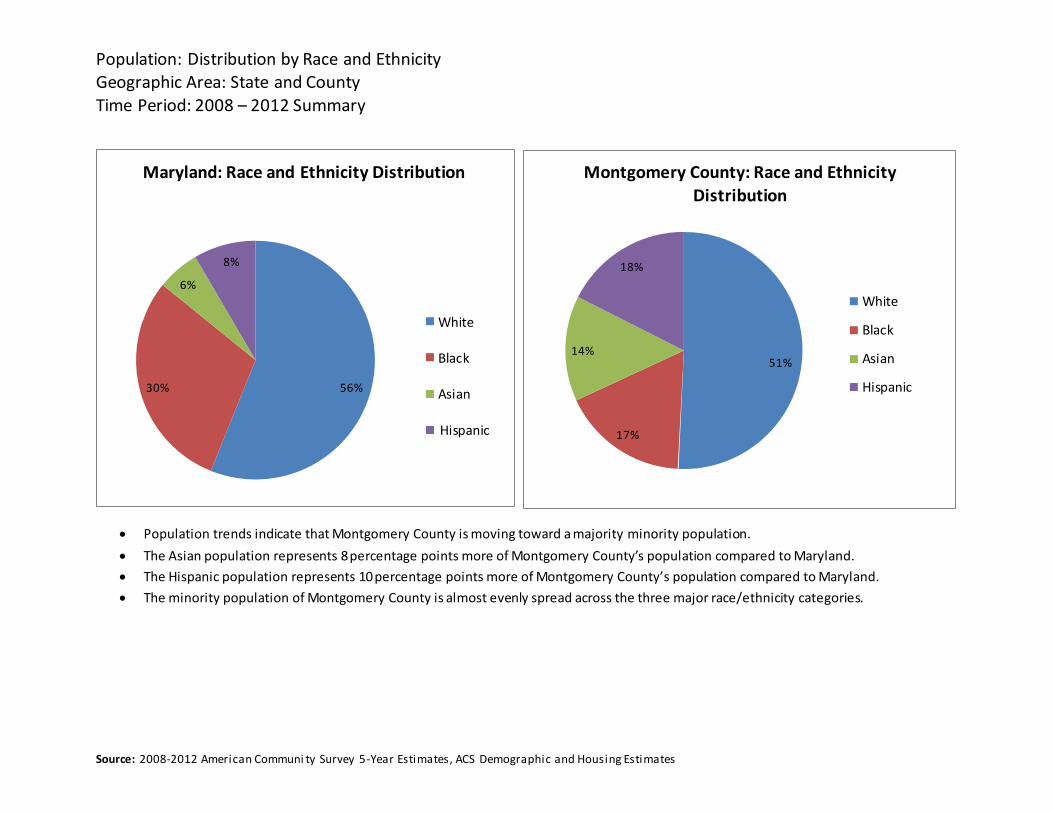
Population: Distribution by Race and Ethnicity Geographic Area: State and County Time Period: 2008 – 2012 Summary
Maryland: Race and Ethnicity Distribution Montgomery County: Race and Ethnicity
Distribution
8%
6%
30%
56%
White
Black
Asian
14%
18%
51%
White
Black
Asian
Hispanic
Hispanic
17%
Population trends indicate that Montgomery County is moving toward a majority minority population.
The Asian population represents 8 percentage points more of Montgomery County’s population compared to Maryland.
The Hispanic population represents 10 percentage points more of Montgomery County’s population compared to Maryland.
The minority population of Montgomery County is almost evenly spread across the three major race/ethnicity categories.
Source: 2008‐2012 Ameri ca n Communi ty Survey 5 ‐Yea r Es ti ma tes , ACS Demogra phi c a nd Hous i ng Es ti ma tes
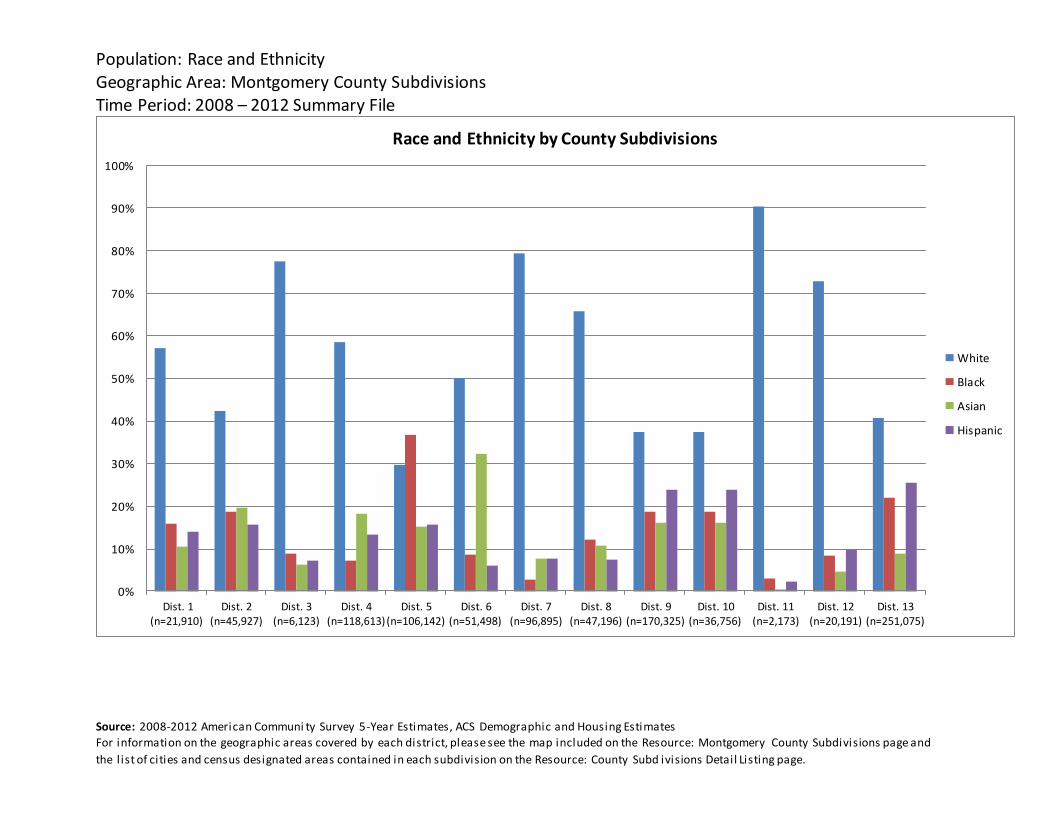
Population: Race and Ethnicity Geographic Area: Montgomery County Subdivisions Time Period: 2008 – 2012 Summary File
Race and Ethnicity by County Subdivisions
100%
90%
80%
70%
60%
50%
40%
White
Bla ck
Asian
His panic
30%
20%
10%
0% Dist. 1
Dist. 2
Dist. 3
Dist. 4
Dist. 5
Dist. 6
Dist. 7
Dist. 8
Dist. 9
Dist. 10
Dist. 11
Dist. 12
Dist. 13
(n=21,910) (n=45,927) (n=6,123) (n=118,613) (n=106,142) (n=51,498) (n=96,895) (n=47,196) (n=170,325) (n=36,756) (n=2,173) (n=20,191) (n=251,075)
Source: 2008‐2012 Ameri ca n Communi ty Survey 5 ‐Yea r Es ti ma tes , ACS Demogra phi c a nd Hous i ng Es ti ma tes
For i nforma ti on on the geogra phi c a rea s covered by ea ch di s tri ct, pl ea s e s ee the ma p i ncl uded on the Res ource: Montgomery County Subdi vi s ions pa ge a nd
the l i s t of ci ti es a nd cens us des i gna ted a rea s conta i ned i n ea ch s ubdi vi s ion on the Res ource: County Subd i vi s ions Deta i l Li s ti ng pa ge.
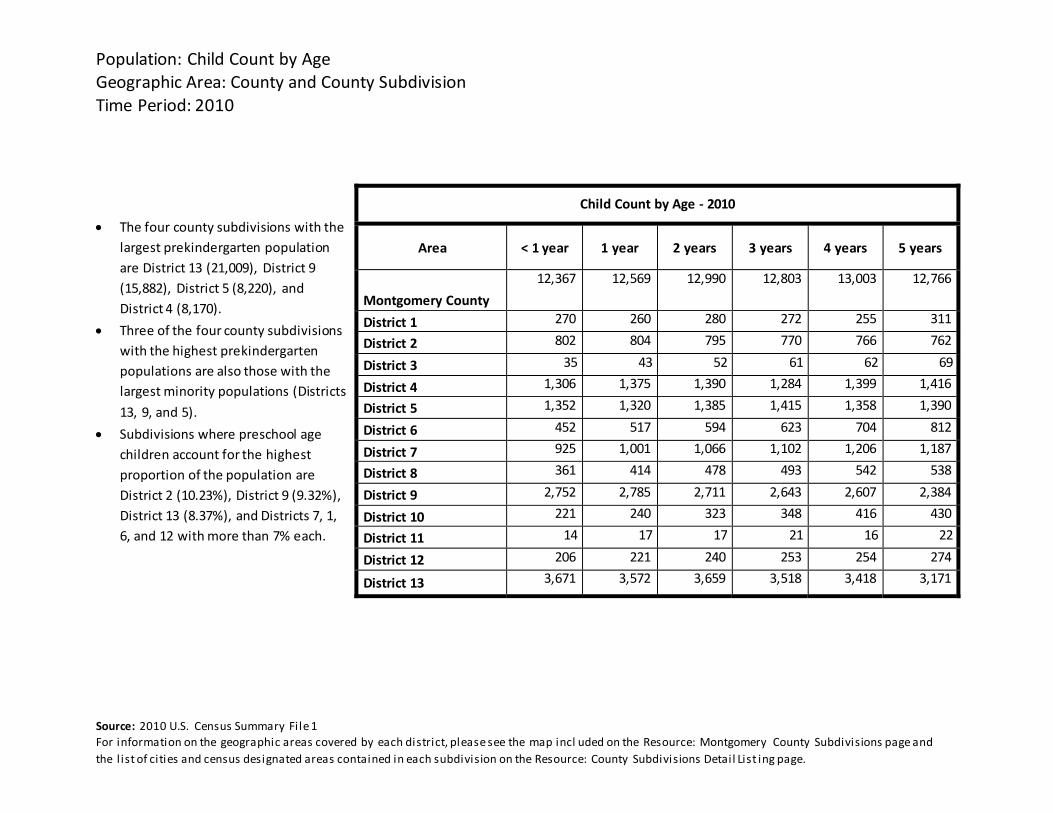
Population: Child Count by Age Geographic Area: County and County Subdivision Time Period: 2010
Child Count by Age ‐ 2010
Area
< 1 year
1 year
2 years
3 years
4 years
5 years
Montgomery County
12,367 12,569 12,990 12,803 13,003 12,766
District 1 270 260 280 272 255 311
District 2 802 804 795 770 766 762
District 3 35 43 52 61 62 69
District 4 1,306 1,375 1,390 1,284 1,399 1,416
District 5 1,352 1,320 1,385 1,415 1,358 1,390
District 6 452 517 594 623 704 812
District 7 925 1,001 1,066 1,102 1,206 1,187
District 8 361 414 478 493 542 538
District 9 2,752 2,785 2,711 2,643 2,607 2,384
District 10 221 240 323 348 416 430
District 11 14 17 17 21 16 22
District 12 206 221 240 253 254 274
District 13 3,671 3,572 3,659 3,518 3,418 3,171
The four county subdivisions with the
largest prekindergarten population
are District 13 (21,009), District 9
(15,882), District 5 (8,220), and
District 4 (8,170).
Three of the four county subdivisions
with the highest prekindergarten
populations are also those with the
largest minority populations (Districts
13, 9, and 5).
Subdivisions where preschool age
children account for the highest
proportion of the population are
District 2 (10.23%), District 9 (9.32%),
District 13 (8.37%), and Districts 7, 1,
6, and 12 with more than 7% each. Source: 2010 U.S. Cens us Summa ry Fi l e 1
For i nforma ti on on the geogra phi c a rea s covered by ea ch di s tri ct, pl ea s e s ee the ma p i ncl uded on the Res ource: Montgomery County Subdi vi s ions pa ge a nd
the l i s t of ci ti es a nd cens us des i gna ted a rea s conta i ned i n ea ch s ubdi vi s ion on the Res ource: County Subdi vi s ions Deta i l Li s t i ng pa ge.
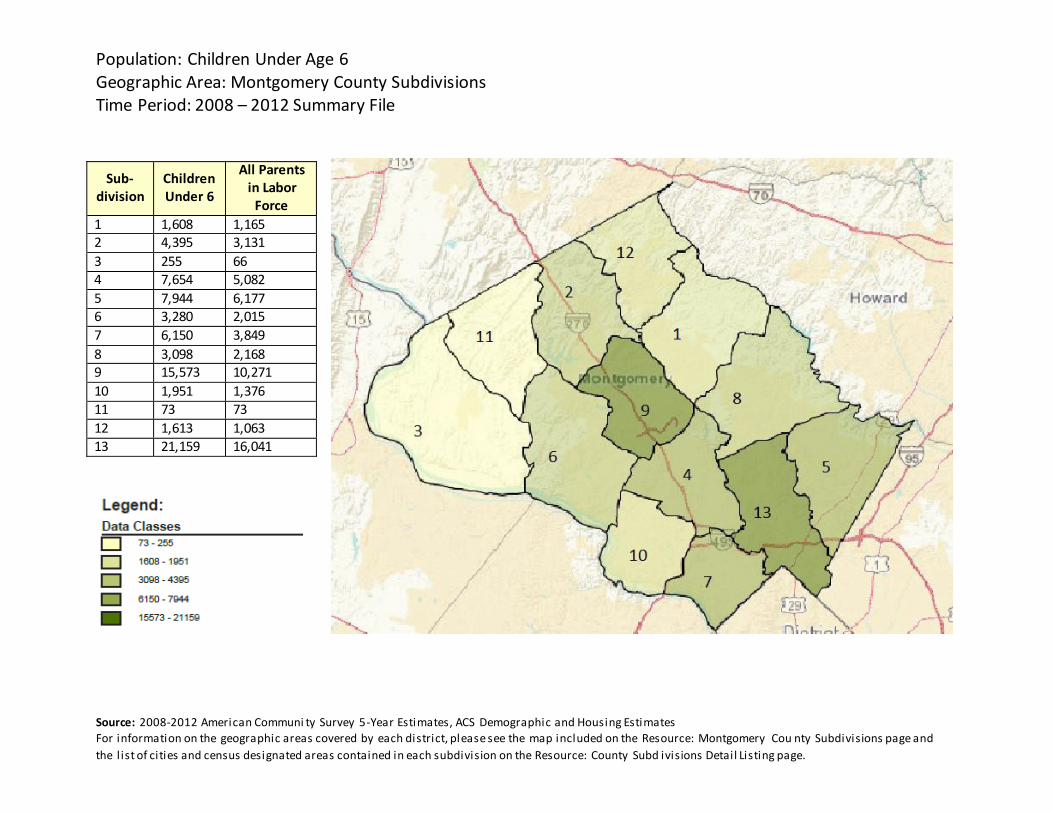
Population: Children Under Age 6 Geographic Area: Montgomery County Subdivisions Time Period: 2008 – 2012 Summary File
Sub‐ division
Children Under 6
All Parents in Labor Force
1 1,608 1,165 2 4,395 3,131
3 255 66 4 7,654 5,082 5 7,944 6,177 6 3,280 2,015 7 6,150 3,849
8 3,098 2,168 9 15,573 10,271
10 1,951 1,376 11 73 73 12 1,613 1,063 13 21,159 16,041
Source: 2008‐2012 Ameri ca n Communi ty Survey 5 ‐Yea r Es ti ma tes , ACS Demogra phi c a nd Hous i ng Es ti ma tes
For i nforma ti on on the geogra phi c a rea s covered by ea ch di s tri ct, pl ea s e s ee the ma p i ncl uded on the Res ource: Montgomery Cou nty Subdi vi s ions pa ge a nd
the l i s t of ci ti es a nd cens us des i gna ted a rea s conta i ned i n ea ch s ubdi vi s ion on the Res ource: County Subd i vi s ions Deta i l Li s ti ng pa ge.
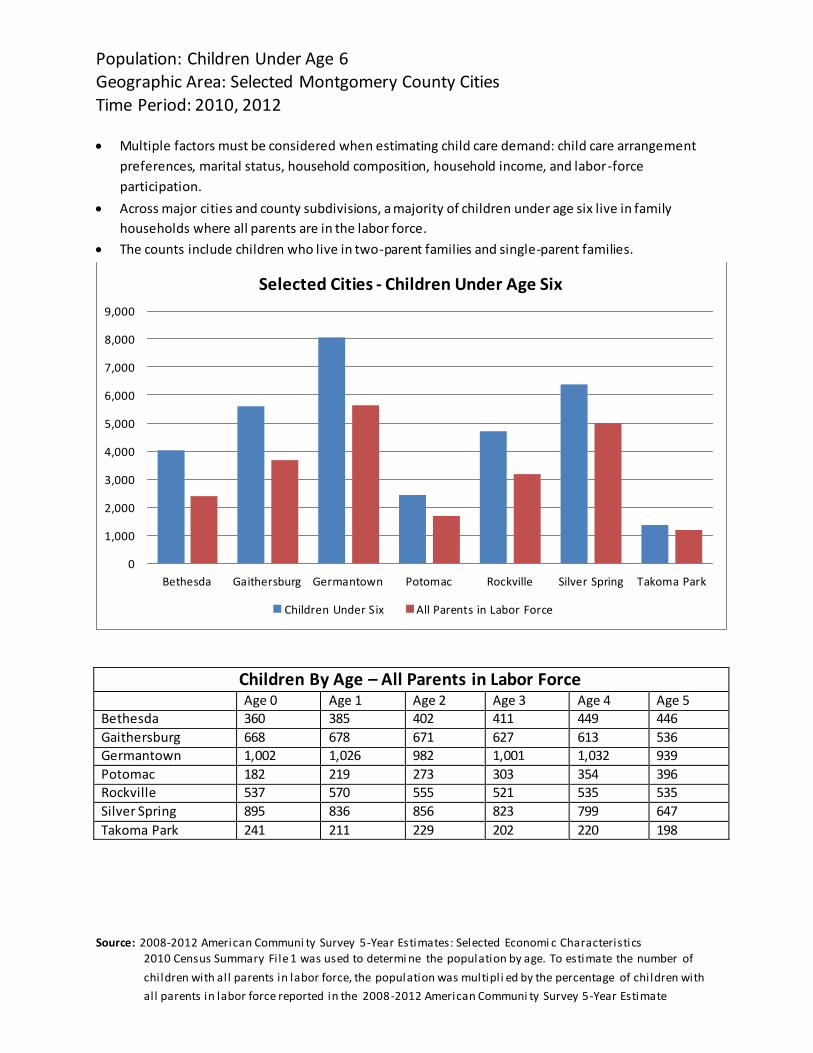
Population: Children Under Age 6 Geographic Area: Selected Montgomery County Cities Time Period: 2010, 2012 Multiple factors must be considered when estimating child care demand: child care arrangement
preferences, marital status, household composition, household income, and labor ‐force
participation.
Across major cities and county subdivisions, a majority of children under age six live in family
households where all parents are in the labor force.
The counts include children who live in two ‐parent families and single ‐parent families.
Selected Cities ‐ Children Under Age Six
9,000
8,000
7,000
6,000
5,000
4,000
3,000
2,000
1,000
0
Bethesda Ga ithersburg Germa ntown Potomac Rockville Silver Spring Takoma Park
Children Under S ix All Parents in Labor Force
Children By Age – All Parents in Labor Force Age 0 Age 1 Age 2 Age 3 Age 4 Age 5 Bethesda 360 385 402 411 449 446 Gaithersburg 668 678 671 627 613 536 Germantown 1,002 1,026 982 1,001 1,032 939 Potomac 182 219 273 303 354 396 Rockville 537 570 555 521 535 535 Silver Spring 895 836 856 823 799 647
Takoma Park 241 211 229 202 220 198 Source: 2008‐2012 Ameri ca n Communi ty Survey 5 ‐Yea r Es ti ma tes : Sel ected Economi c Cha ra cteri s ti cs
2010 Cens us Summa ry Fi l e 1 wa s us ed to determi ne the popul a ti on by a ge. To es ti ma te the number of
chi l dren wi th a l l pa rents i n l a bor force, the popul a ti on wa s mul ti pl i ed by the percenta ge of chi l dren wi th
a l l pa rents i n l a bor force reported i n the 2008 ‐2012 Ameri ca n Communi ty Survey 5 ‐Yea r Es ti ma te
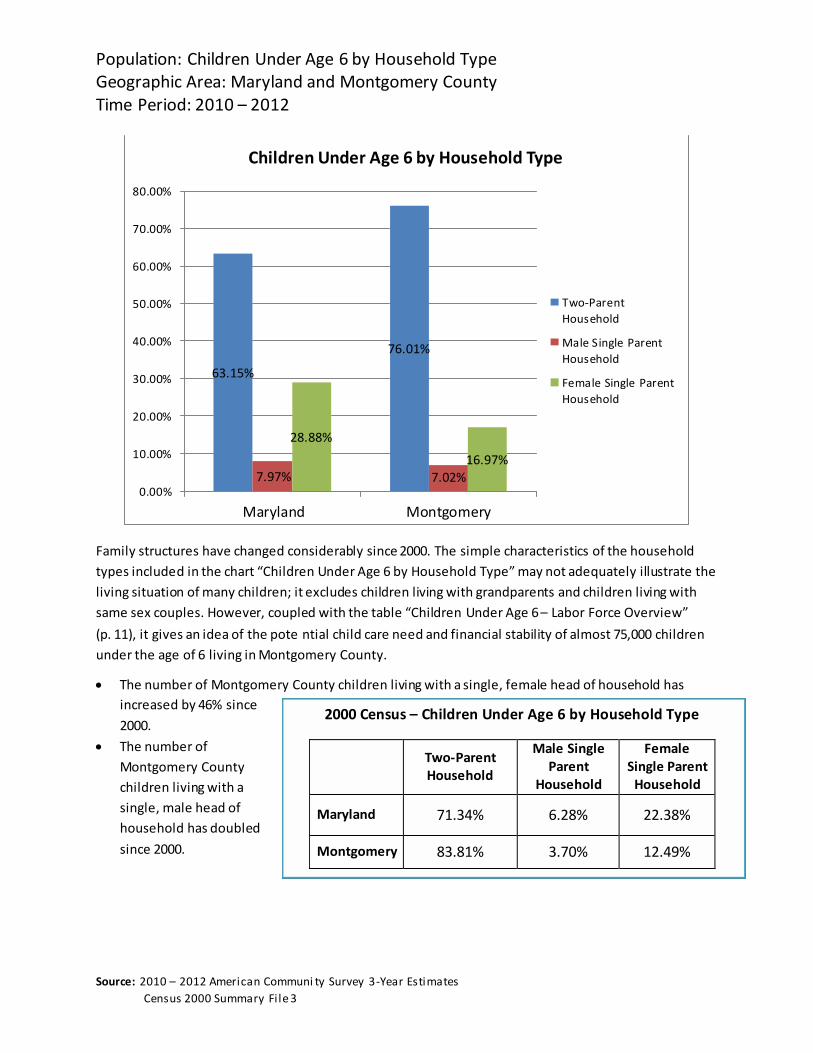
Population: Children Under Age 6 by Household TypeGeographic Area: Maryland and Montgomery County
Time Period: 2010 – 2012
Children Under Age 6 by Household Type
80.00%
70.00%
60.00%
50.00%
40.00%
30.00%
20.00%
10.00%
63.15%
28.88%
76.01%
16.97%
Two‐Parent
Hous ehold
Ma le S ingle Parent
Hous ehold
Fema le Single Parent
Hous ehold
0.00%
7.97% 7.02% Maryland Montgomery
Family structures have changed considerably since 2000. The simple characteristics of the household
types included in the chart “Children Under Age 6 by Household Type” may not adequately illustrate the
living situation of many children; it excludes children living with grandparents and children living with
same sex couples. However, coupled with the table “Children Under Age 6 – Labor Force Overview”
(p. 11), it gives an idea of the pote ntial child care need and financial stability of almost 75,000 children
under the age of 6 living in Montgomery County.
The number of Montgomery County children living with a single, female head of household has
increased by 46% since
2000.
The number of
Montgomery County
children living with a
single, male head of
household has doubled
Two‐Parent Household
Male Single Parent
Household
Female Single ParentHousehold
Maryland
71.34%
6.28%
22.38%
Montgomery 83.81% 3.70% 12.49% since 2000.
2000 Census – Children Under Age 6 by Household Type
Source: 2010 – 2012 Ameri ca n Communi ty Survey 3 ‐Yea r Es ti ma tes
Cens us 2000 Summa ry Fi l e 3
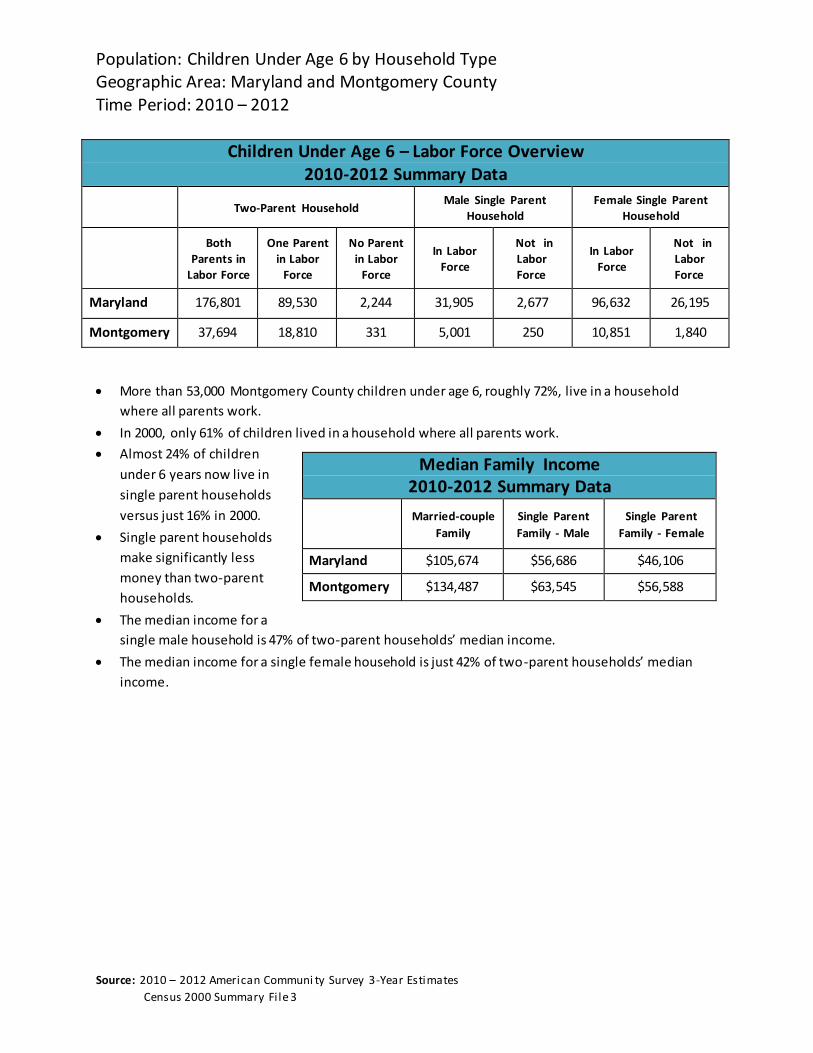
Population: Children Under Age 6 by Household TypeGeographic Area: Maryland and Montgomery County
Time Period: 2010 – 2012
Children Under Age 6 – Labor Force Overview 2010‐2012 Summary Data
Two‐Parent Household
Male Single Parent
Household
Female Single Parent
Household
Both
Parents in
Labor Force
One Parent
in Labor
Force
No Parent
in Labor
Force
In Labor
Force
Not in
Labor
Force
In Labor
Force
Not in
Labor
Force
Maryland 176,801 89,530 2,244 31,905 2,677 96,632 26,195
Montgomery 37,694 18,810 331 5,001 250 10,851 1,840
More than 53,000 Montgomery County children under age 6, roughly 72%, live in a household
where all parents work.
In 2000, only 61% of children lived in a household where all parents work.
Almost 24% of children
under 6 years now live in
single parent households
versus just 16% in 2000.
Median Family Income 2010‐2012 Summary Data
Married‐couple
Family
Single Parent
Family ‐ Male
Single Parent
Family ‐ Female
Maryland $105,674 $56,686 $46,106
Montgomery $134,487 $63,545 $56,588
Single parent households
make significantly less
money than two‐parent
households.
The median income for a
single male household is 47% of two‐parent households’ median income.
The median income for a single female household is just 42% of two ‐parent households’ median
income.
Source: 2010 – 2012 Ameri ca n Communi ty Survey 3 ‐Yea r Es ti ma tes
Cens us 2000 Summa ry Fi l e 3
Population: Foreign Born PopulationGeographic Area: Montgomery County
Time Period: 2000 ‐ 2009
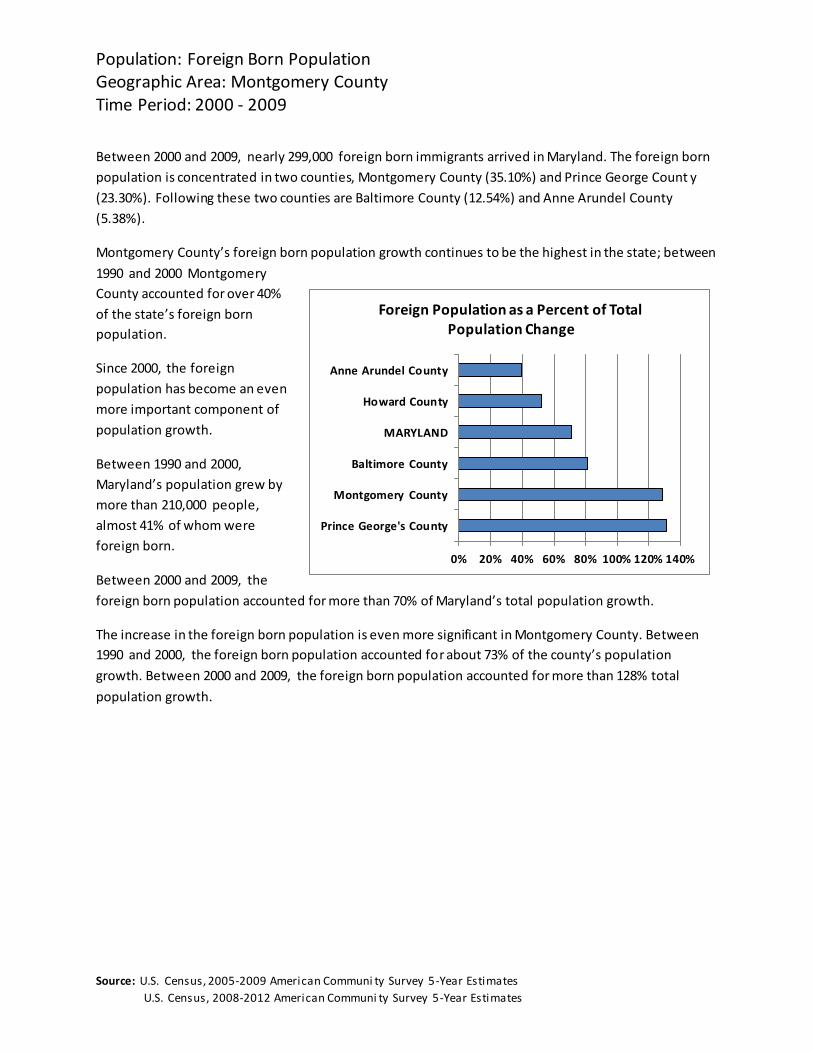
Between 2000 and 2009, nearly 299,000 foreign born immigrants arrived in Maryland. The foreign born
population is concentrated in two counties, Montgomery County (35.10%) and Prince George Count y
(23.30%). Following these two counties are Baltimore County (12.54%) and Anne Arundel County
(5.38%). Montgomery County’s foreign born population growth continues to be the highest in the state; between
1990 and 2000 Montgomery
County accounted for over 40%
of the state’s foreign born
population. Since 2000, the foreign
population has become an even
more important component of
population growth.
Foreign Population as a Percent of Total Population Change
Anne Arundel Co unty
Ho ward Coun ty
MARYLAND
Between 1990 and 2000,
Maryland’s population grew by
more than 210,000 people,
almost 41% of whom were
foreign born.
Between 2000 and 2009, the
Baltimore County
Montgomery County
Prince George's Cou nty
0% 20% 40% 60% 80% 100% 120% 140%
foreign born population accounted for more than 70% of Maryland’s total population growth. The increase in the foreign born population is even more significant in Montgomery County. Between
1990 and 2000, the foreign born population accounted fo r about 73% of the county’s population
growth. Between 2000 and 2009, the foreign born population accounted for more than 128% total
population growth. Source: U.S. Cens us , 2005‐2009 Ameri ca n Communi ty Survey 5 ‐Yea r Es ti ma tes
U.S. Cens us , 2008‐2012 Ameri ca n Communi ty Survey 5 ‐Yea r Es ti ma tes
Population: Foreign Born PopulationGeographic Area: Montgomery County
Time Period: 2000 ‐ 2009
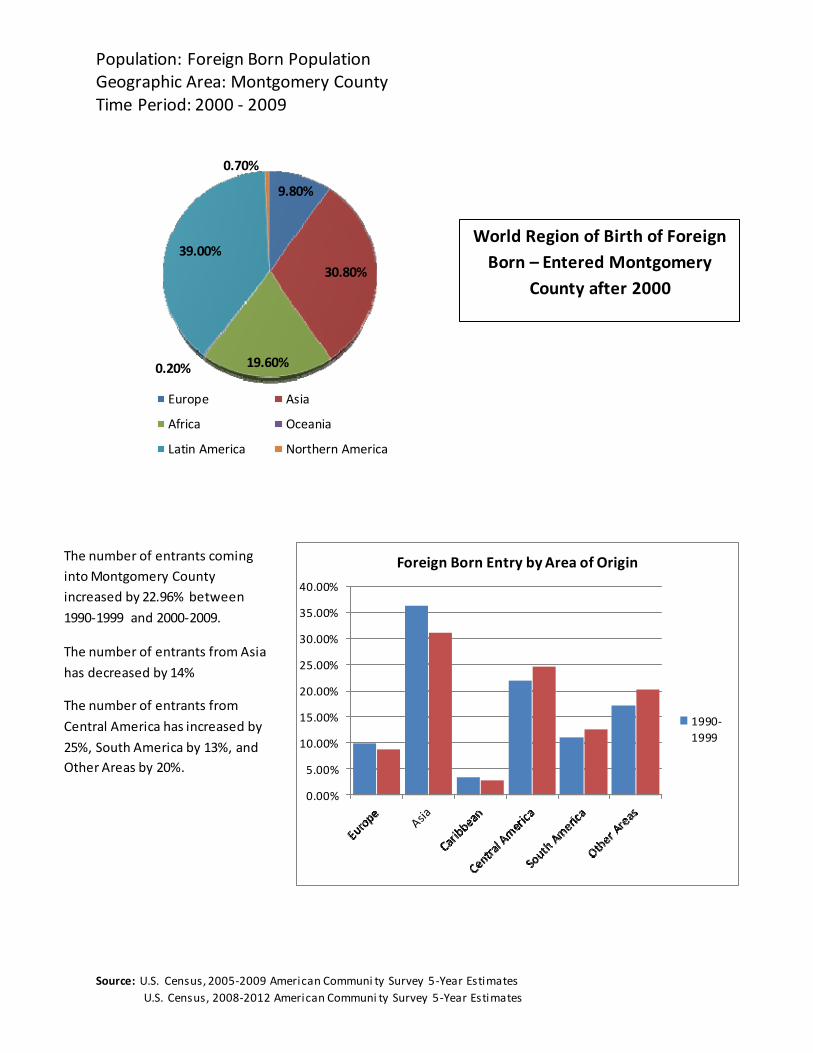
0.70%
9.80%
39.00%
30.80%
World Region of Birth of Foreign
Born – Entered Montgomery
County after 2000
0.20% 19.60%
Europe Asia
Africa Oceania
Latin America Northern America
The number of entrants coming
into Montgomery County
increased by 22.96% between
1990‐1999 and 2000‐2009. The number of entrants from Asia
has decreased by 14%
The number of entrants from
Central America has increased by
25%, South America by 13%, and
Other Areas by 20%.
40.00%
35.00%
30.00%
25.00%
20.00%
15.00%
10.00%
5.00%
Foreign Born Entry by Area of Origin
1990‐
1999
0.00%
Source: U.S. Cens us , 2005‐2009 Ameri ca n Communi ty Survey 5 ‐Yea r Es ti ma tes
U.S. Cens us , 2008‐2012 Ameri ca n Communi ty Survey 5 ‐Yea r Es ti ma tes
Population: Language Spoken at HomeGeographic Area: State and County ComparisonTime Period: 2010‐2012
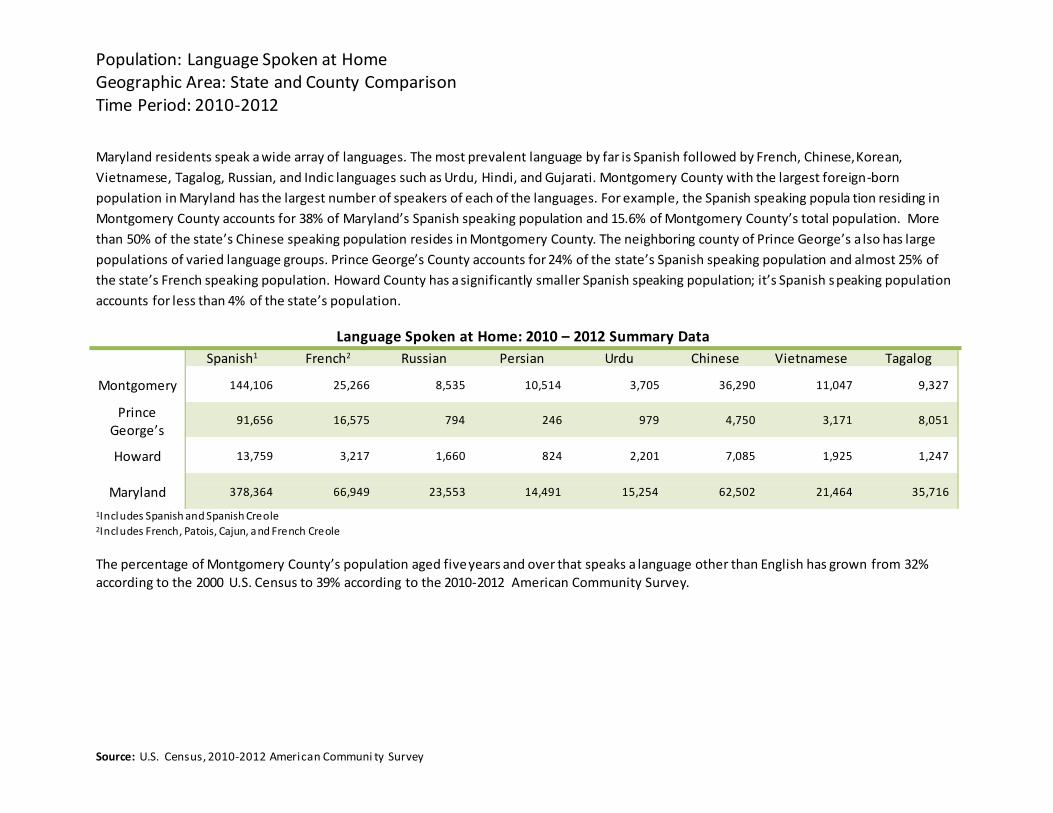
Maryland residents speak a wide array of languages. The most prevalent language by far is Spanish followed by French, Chinese, Korean,
Vietnamese, Tagalog, Russian, and Indic languages such as Urdu, Hindi, and Gujarati. Montgomery County with the largest foreign ‐born
population in Maryland has the largest number of speakers of each of the languages. For example, the Spanish speaking popula tion residing in
Montgomery County accounts for 38% of Maryland’s Spanish speaking population and 15.6% of Montgomery County’s total population. More
than 50% of the state’s Chinese speaking population resides in Montgomery County. The neighboring county of Prince George’s a lso has large
populations of varied language groups. Prince George’s County accounts for 24% of the state’s Spanish speaking population and almost 25% of
the state’s French speaking population. Howard County has a significantly smaller Spanish speaking population; it’s Spanish s peaking population
accounts for less than 4% of the state’s population.
Language Spoken at Home: 2010 – 2012 Summary Data
Spanish1 French2 Russian Persian Urdu Chinese Vietnamese Tagalog
144,106 25,266 8,535 10,514 3,705 36,290 11,047 9,327
91,656 16,575 794 246 979 4,750 3,171 8,051
13,759 3,217 1,660 824 2,201 7,085 1,925 1,247
Montgomery
Prince George’s
Howard
Maryland
378,364 66,949 23,553 14,491 15,254 62,502 21,464 35,716
1I n cl u des Spanish an d Spanish Cre ole 2I n cl u des French , Patois, Cajun, a nd Fre nch Cre ole
The percentage of Montgomery County’s population aged five years and over that speaks a language other than English has grown from 32%
according to the 2000 U.S. Census to 39% according to the 2010‐2012 American Community Survey.
Source: U.S. Cens us , 2010‐2012 Ameri ca n Communi ty Survey
Population: Language Spoken at HomeGeographic Area: State and County ComparisonTime Period: 2010‐2012
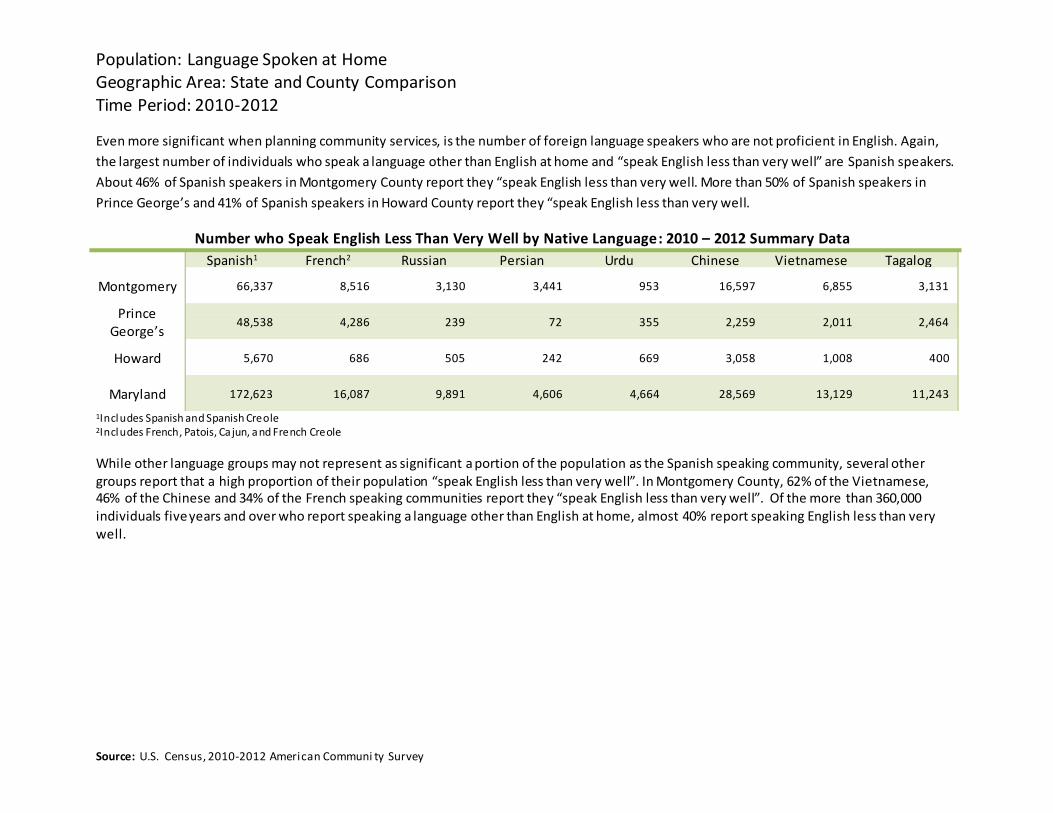
Even more significant when planning community services, is the number of foreign language speakers who are not proficient in English. Again,
the largest number of individuals who speak a language other than English at home and “speak English less than very well” are Spanish speakers.
About 46% of Spanish speakers in Montgomery County report they “speak English less than very well. More than 50% of Spanish speakers in
Prince George’s and 41% of Spanish speakers in Howard County report they “speak English less than very well.
Number who Speak English Less Than Very Well by Native Language : 2010 – 2012 Summary Data
Spanish1 French2 Russian Persian Urdu Chinese Vietnamese Tagalog
66,337 8,516 3,130 3,441 953 16,597 6,855 3,131
48,538 4,286 239 72 355 2,259 2,011 2,464
5,670 686 505 242 669 3,058 1,008 400
Montgomery
Prince George’s
Howard
Maryland
172,623 16,087 9,891 4,606 4,664 28,569 13,129 11,243
1I n cl u des Spanish an d Spanish Cre ole 2I n cl u des French , Patois, Ca jun, a nd Fre nch Cre ole
While other language groups may not represent as significant a portion of the population as the Spanish speaking community, several other groups report that a high proportion of their population “speak English less than very well”. In Montgomery County, 62% of the Vietnamese, 46% of the Chinese and 34% of the French speaking communities report they “speak English less than very well”. Of the more than 360,000 individuals five years and over who report speaking a language other than English at home, almost 40% report speaking English less than very well.
Source: U.S. Cens us , 2010‐2012 Ameri ca n Communi ty Survey
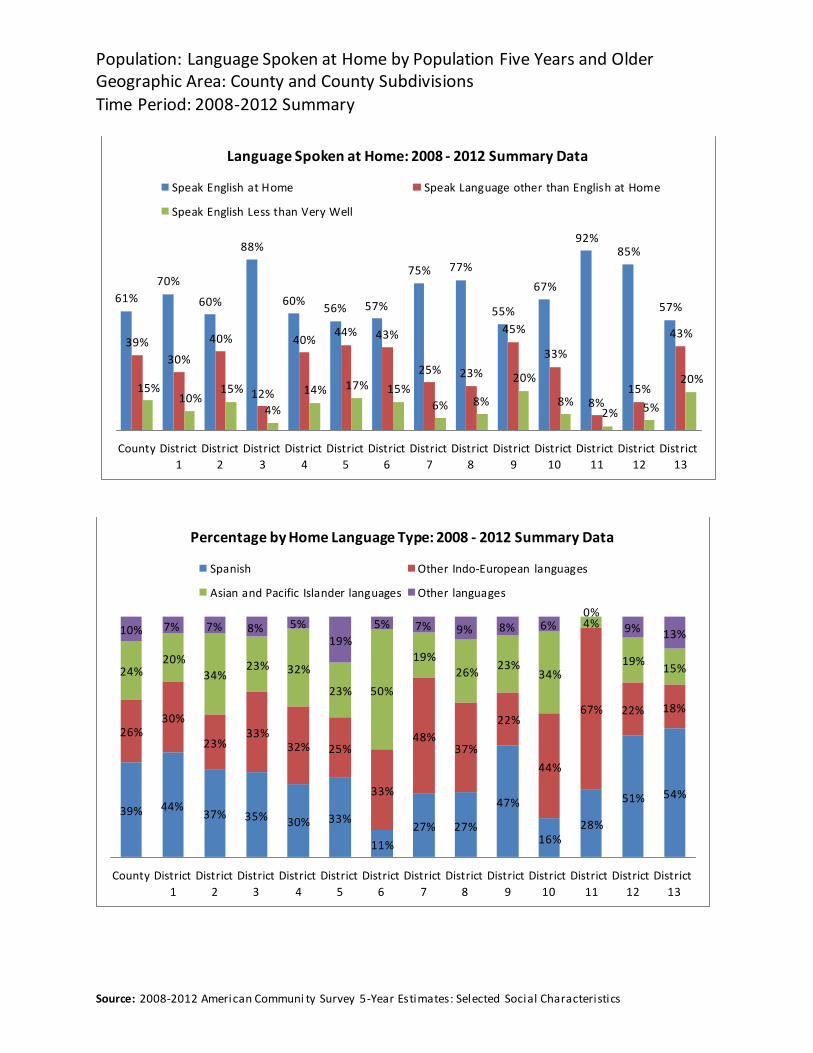
Population: Language Spoken at Home by Population Five Years and Older
Geographic Area: County and County Subdivisions Time Period: 2008‐2012 Summary
Language Spoken at Home: 2008 ‐ 2012 Summary Data
Speak English a t H ome Speak Lang uage other than Englis h at Home
Speak English Less than Very Well
32%
61%
39%
70%
30%
60%
40%
88% 60%
56% 57%
40% 44% 43%
75% 77%
55%
45%
67% 33%
92% 85%
57%
43%
15% 15%
10%
12%
4%
14%
17%
15%
25% 23%
6% 8%
20% 8% 8%
15%
20%
2% 5%
County District District District District District District District District District District District District District
1 2 3 4 5 6 7 8 9 10 11 12 13
Percentage by Home Language Type: 2008 ‐ 2012 Summary Data
Spa nish Other Indo‐European la nguag es
Asian a nd Pacific Isla nder lang uages Other langua ges
10% 7% 7% 8% 5%
20%
19%
5% 7% 9% 8% 6%
1 9%
0% 4% 9% 13%
19% 15%
24%
26%
30%
23% 34%
33%
23% 50%
48%
26% 23%
34%
22%
67% 22% 18%
23%
39% 44% 37% 35%
32% 25%
30% 33%
33% 11%
37%
27% 27%
47%
44% 16%
28%
51% 54%
County District District District District District District District District District District District District District
1 2 3 4 5 6 7 8 9 10 11 12 13
Source: 2008‐2012 Ameri ca n Communi ty Survey 5 ‐Yea r Es ti ma tes : Sel ected Soci a l Cha ra cteri sti cs
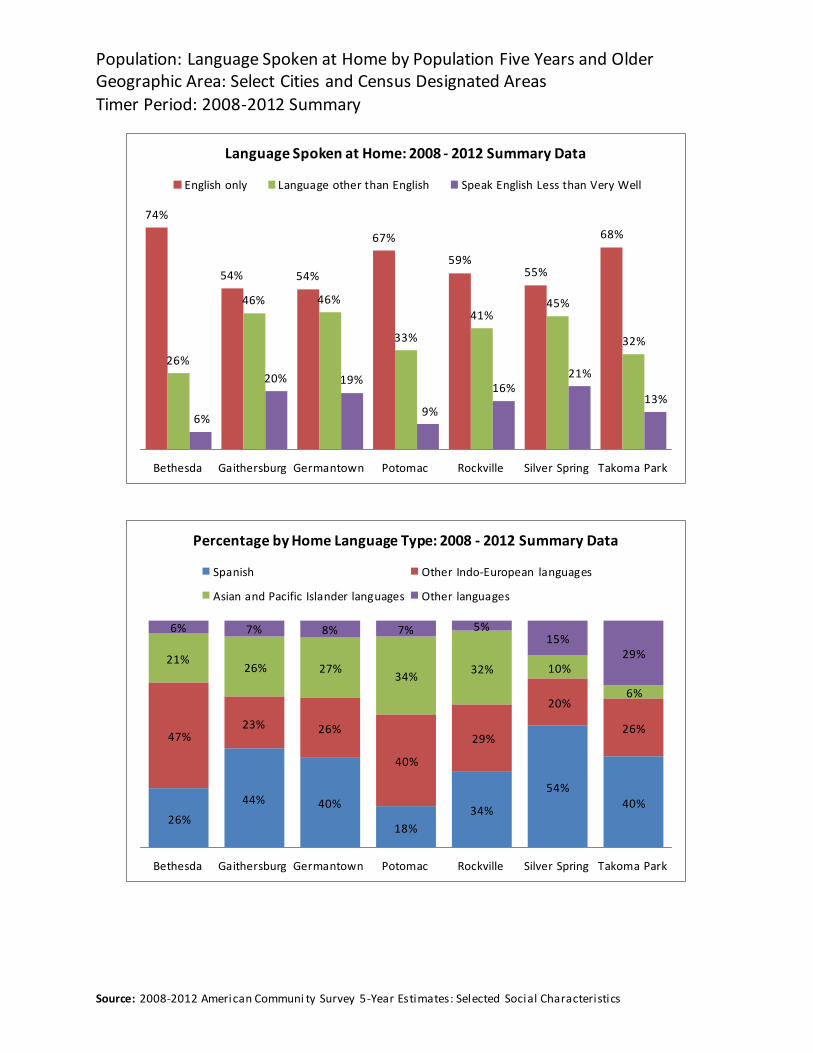
Population: Language Spoken at Home by Population Five Years and Older
Geographic Area: Select Cities and Census Designated Areas Timer Period: 2008‐2012 Summary
Language Spoken at Home: 2008 ‐ 2012 Summary Data
English only Langua ge other than English Speak English Less than Very Well
74%
26%
6%
54% 54%
46% 46%
20% 19%
67%
33%
9%
59%
41%
16%
55%
45%
21%
68%
32%
13%
Bethesda Ga ithersburg Germa ntow n Potomac Rockville Silver Spring Takoma Park
Percentage by Home Language Type: 2008 ‐ 2012 Summary Data
Spa nish Other Indo‐European la nguag es
Asian a nd Pacific Isla nder lang uages Other langua ges
6% 7% 8% 7% 5%
21%
15%
29%
47%
26% 27% 34%
32% 10%
20%
23% 26% 29%
40%
6%
26%
26%
44% 40%
18%
34%
54% 40%
Bethesda Ga ithersburg Germa ntown Potomac Rockville Silver Spring Takoma Park
Source: 2008‐2012 Ameri ca n Communi ty Survey 5 ‐Yea r Es ti ma tes : Sel ected Soci a l Cha ra cteri sti cs
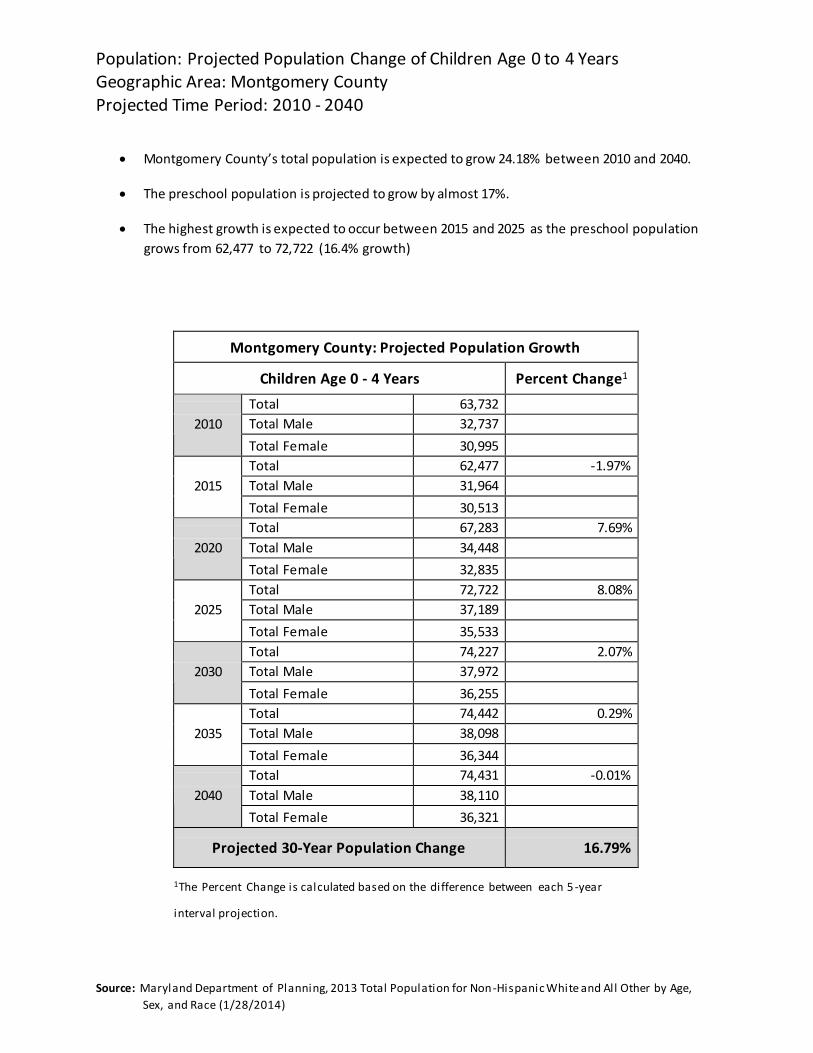
Population: Projected Population Change of Children Age 0 to 4 Years Geographic Area: Montgomery County Projected Time Period: 2010 ‐ 2040
Montgomery County’s total population is expected to grow 24.18% between 2010 and 2040.
The preschool population is projected to grow by almost 17%.
The highest growth is expected to occur between 2015 and 2025 as the preschool population
grows from 62,477 to 72,722 (16.4% growth)
Montgomery County: Projected Population Growth
Children Age 0 ‐ 4 Years Percent Change1
Total 63,732
Total Male 32,737
2010
Total Female 30,995
Total 62,477 ‐1.97%
Total Male 31,964
2015
Total Female 30,513
Total 67,283 7.69%
Total Male 34,448
2020
Total Female 32,835
Total 72,722 8.08%
Total Male 37,189
2025
Total Female 35,533
Total 74,227 2.07%
Total Male 37,972
2030
Total Female 36,255
Total 74,442 0.29%
Total Male 38,098
2035
Total Female 36,344
Total 74,431 ‐0.01%
Total Male 38,110
2040
Total Female 36,321
Projected 30‐Year Population Change
16.79%
1The Percent Cha nge i s ca l culated ba s ed on the di fference between ea ch 5 ‐yea r
i nterva l proj ecti on.
Source: Ma ryl a nd Depa rtment of Pl a nni ng, 2013 Tota l Popul a ti on for Non ‐Hi s pa ni c Whi te a nd Al l Other by Age,
Sex, a nd Ra ce (1/28/2014)
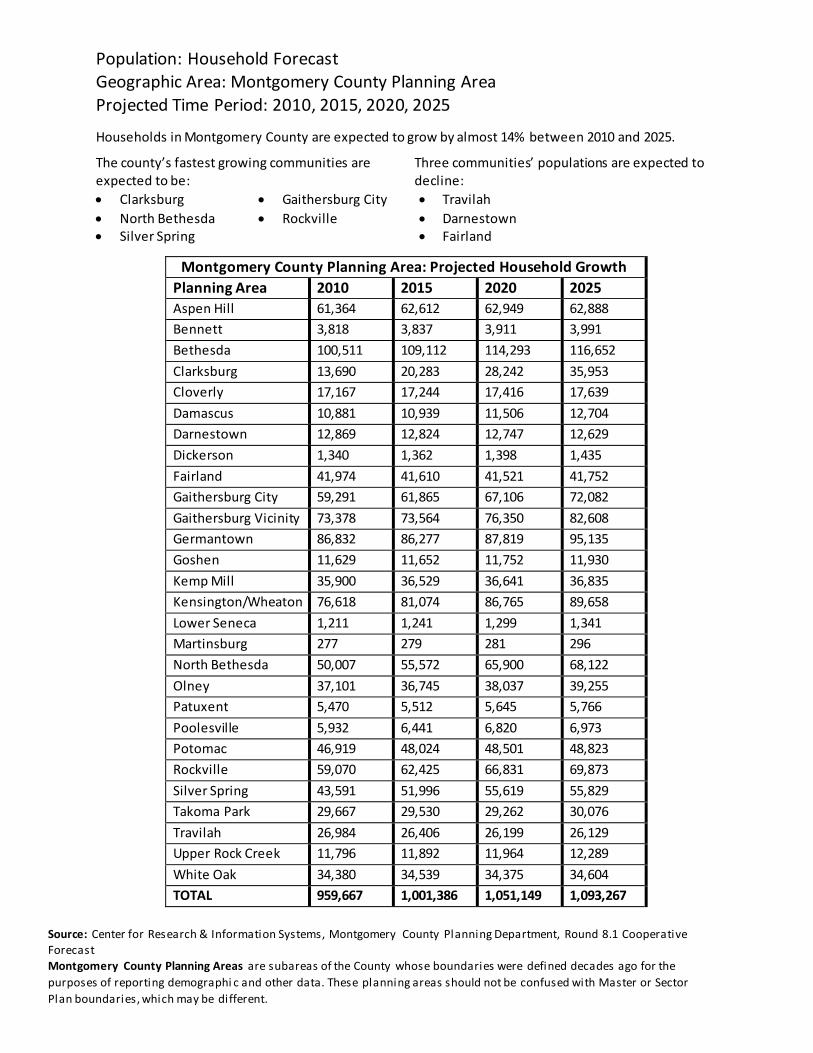
Population: Household Forecast Geographic Area: Montgomery County Planning Area Projected Time Period: 2010, 2015, 2020, 2025
Households in Montgomery County are expected to grow by almost 14% between 2010 and 2025.
The county’s fastest growing communities are expected to be:
Three communities’ populations are expected to decline:
Clarksburg
North Bethesda Silver Spring
Gaithersburg City
Rockville
Travilah
Darnestown Fairland
Montgomery County Planning Area: Projected Household Growth
Planning Area 2010 2015 2020 2025 Aspen Hill 61,364 62,612 62,949 62,888
Bennett 3,818 3,837 3,911 3,991
Bethesda 100,511 109,112 114,293 116,652
Clarksburg 13,690 20,283 28,242 35,953
Cloverly 17,167 17,244 17,416 17,639
Damascus 10,881 10,939 11,506 12,704
Darnestown 12,869 12,824 12,747 12,629
Dickerson 1,340 1,362 1,398 1,435
Fairland 41,974 41,610 41,521 41,752
Gaithersburg City 59,291 61,865 67,106 72,082
Gaithersburg Vicinity 73,378 73,564 76,350 82,608
Germantown 86,832 86,277 87,819 95,135
Goshen 11,629 11,652 11,752 11,930
Kemp Mill 35,900 36,529 36,641 36,835
Kensington/Wheaton 76,618 81,074 86,765 89,658
Lower Seneca 1,211 1,241 1,299 1,341
Martinsburg 277 279 281 296
North Bethesda 50,007 55,572 65,900 68,122
Olney 37,101 36,745 38,037 39,255
Patuxent 5,470 5,512 5,645 5,766
Poolesville 5,932 6,441 6,820 6,973
Potomac 46,919 48,024 48,501 48,823
Rockville 59,070 62,425 66,831 69,873
Silver Spring 43,591 51,996 55,619 55,829
Takoma Park 29,667 29,530 29,262 30,076
Travilah 26,984 26,406 26,199 26,129
Upper Rock Creek 11,796 11,892 11,964 12,289
White Oak 34,380 34,539 34,375 34,604
TOTAL 959,667 1,001,386 1,051,149 1,093,267
Source: Center for Res ea rch & Informa ti on Sys tems , Montgomery County Pl a nni ng Depa rtment, Round 8.1 Coopera ti ve
Foreca s t
Montgomery County Planning Areas a re s uba rea s of the County whos e bounda ri es were defi ned deca des a go for the
purpos es of reporti ng demogra phi c a nd other da ta . Thes e pl a nni ng a rea s s hould not be confus ed wi th Ma s ter or Sector
Pl a n bounda ri es , whi ch ma y be di fferent.
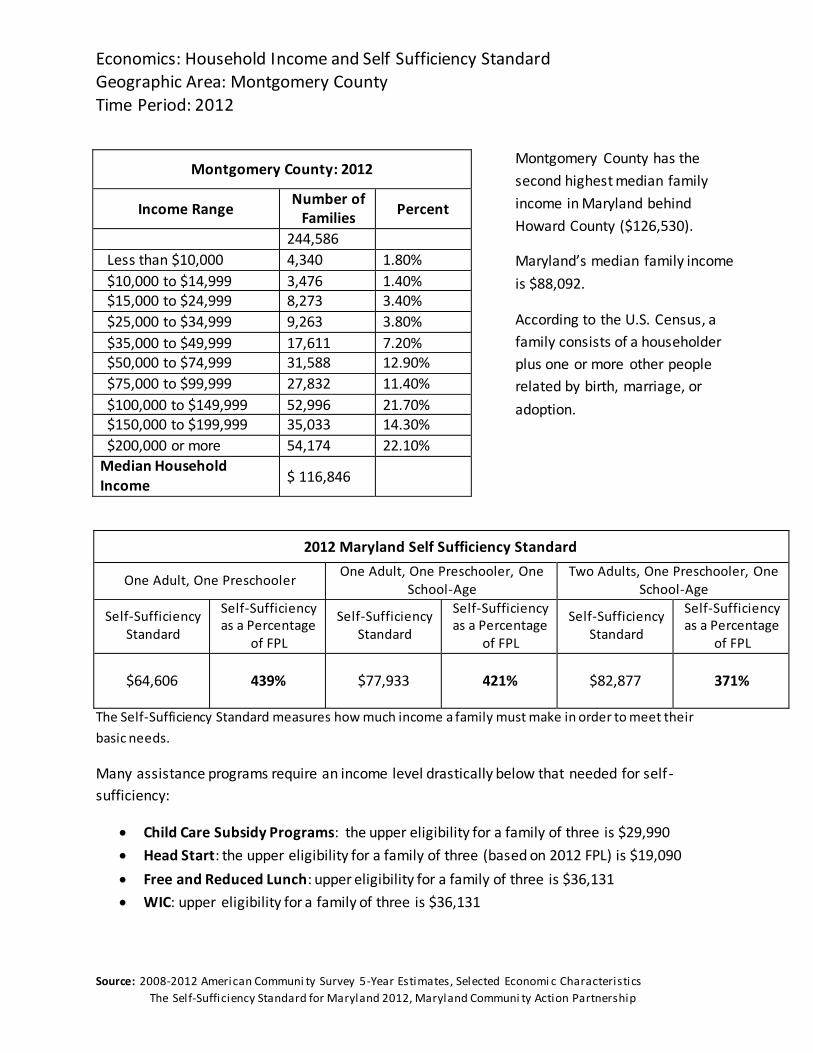
Economics: Household I ncome and Self Sufficiency Standard Geographic Area: Montgomery County Time Period: 2012
Montgomery County: 2012
Income Range Number of Families
Percent
244,586
Less than $10,000 4,340 1.80%
$10,000 to $14,999 3,476 1.40% $15,000 to $24,999 8,273 3.40%
$25,000 to $34,999 9,263 3.80%
$35,000 to $49,999 17,611 7.20% $50,000 to $74,999 31,588 12.90%
$75,000 to $99,999 27,832 11.40%
$100,000 to $149,999 52,996 21.70% $150,000 to $199,999 35,033 14.30%
$200,000 or more 54,174 22.10% Median Household Income
$ 116,846
Montgomery County has the
second highest median family
income in Maryland behind
Howard County ($126,530).
Maryland’s median family income
is $88,092.
According to the U.S. Census, a
family consists of a householder
plus one or more other people
related by birth, marriage, or
adoption.
2012 Maryland Self Sufficiency Standard
One Adult, One Preschooler One Adult, One Preschooler, One
School‐Age Two Adults, One Preschooler, One
School‐Age
Self‐Sufficiency Standard
Self‐Sufficiency as a Percentage
of FPL
Self‐SufficiencyStandard
Self‐Sufficiencyas a Percentage
of FPL
Self‐SufficiencyStandard
Self‐Sufficiencyas a Percentage
of FPL
$64,606
439%
$77,933
421%
$82,877
371%
The Self‐Sufficiency Standard measures how much income a family must make in order to meet their
basic needs. Many assistance programs require an income level drastically below that needed for self ‐
sufficiency:
Child Care Subsidy Programs: the upper eligibility for a family of three is $29,990
Head Start: the upper eligibility for a family of three (based on 2012 FPL) is $19,090
Free and Reduced Lunch: upper eligibility for a family of three is $36,131
WIC: upper eligibility for a family of three is $36,131
Source: 2008‐2012 Ameri ca n Communi ty Survey 5 ‐Yea r Es ti ma tes , Sel ected Economi c Cha ra cteri s ti cs
The Sel f‐Suffi ci ency Sta nda rd for Ma ryl a nd 2012, Ma ryl a nd Communi ty Acti on Pa rtners hi p
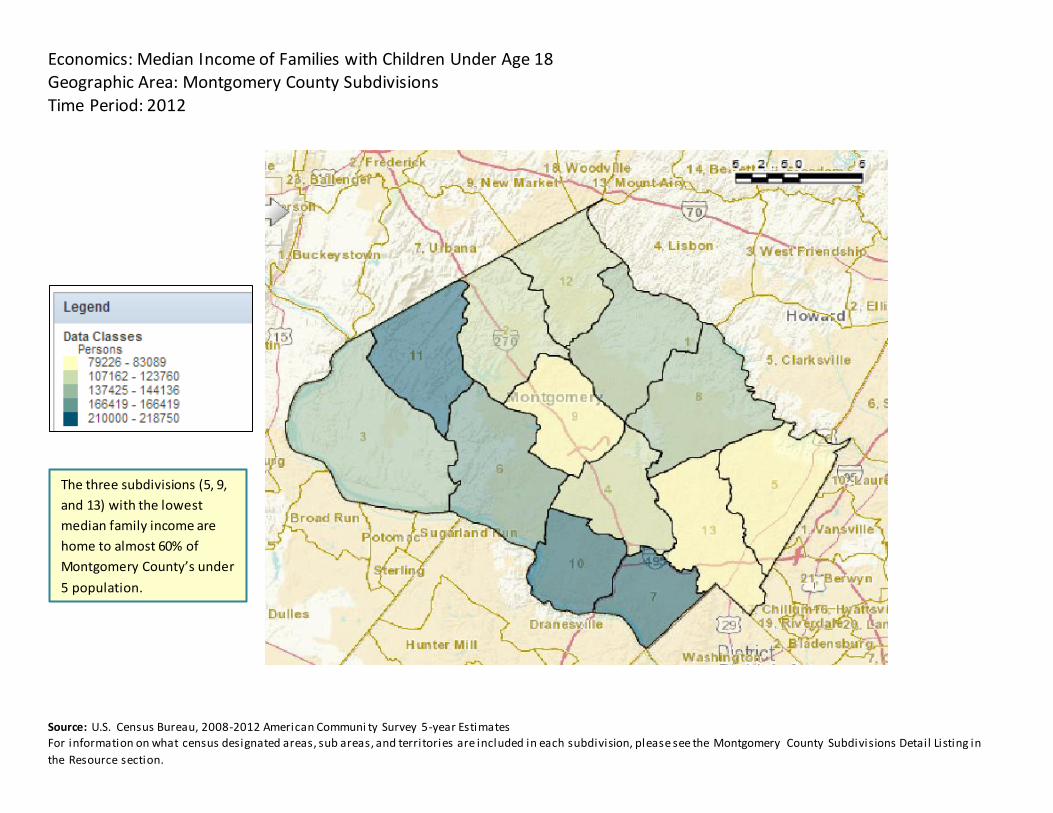
Economics: Median I ncome of Families with Children Under Age 18 Geographic Area: Montgomery County Subdivisions Time Period: 2012
The three subdivisions (5, 9,
and 13) with the lowest
median family income are
home to almost 60% of
Montgomery County’s under
5 population. Source: U.S. Cens us Burea u, 2008 ‐2012 Ameri ca n Communi ty Survey 5 ‐yea r Es ti ma tes
For i nforma ti on on wha t cens us des i gna ted a rea s , s ub a rea s , a nd terri tori es a re i ncl uded i n ea ch s ubdi vi sion, pl ea s e s ee the Montgomery County Subdi vi s ions Deta i l Li sti ng i n
the Res ource s ecti on.
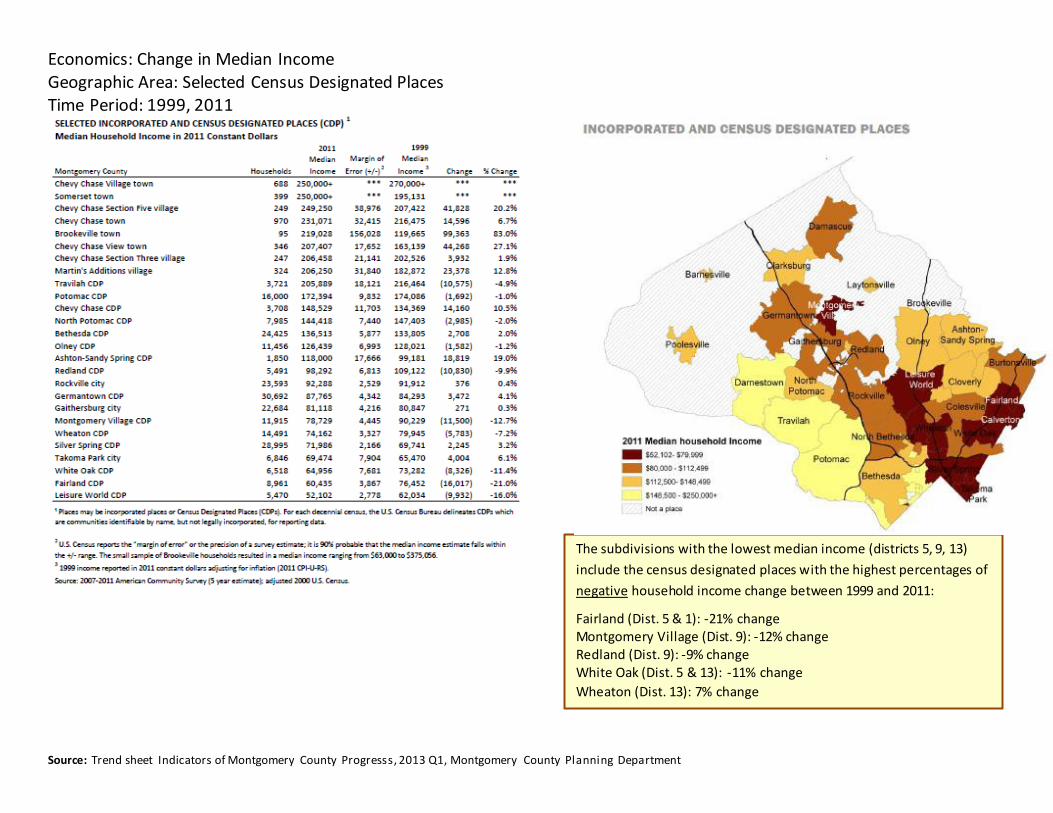
Economics: Change in Median Income Geographic Area: Selected Census Designated Places Time Period: 1999, 2011
The subdivisions with the lowest median income (districts 5, 9, 13)
include the census designated places with the highest percentages of
negative household income change between 1999 and 2011:
Fairland (Dist. 5 & 1): ‐21% change Montgomery Village (Dist. 9): ‐12% change Redland (Dist. 9): ‐9% change White Oak (Dist. 5 & 13): ‐11% change
Wheaton (Dist. 13): 7% change
Source: Trend sheet Indicators of Montgomery County Progress s , 2013 Q1, Montgomery County Pl a nni ng Depa rtment
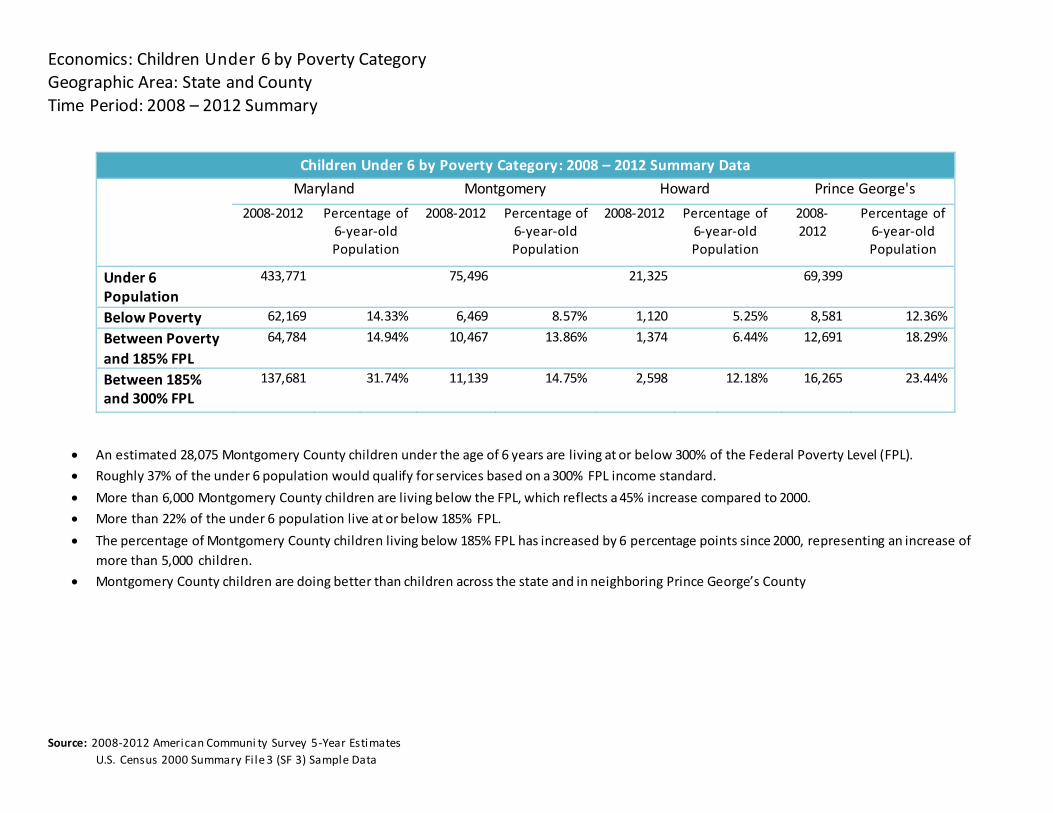
Economics: Children Under 6 by Poverty Category Geographic Area: State and County Time Period: 2008 – 2012 Summary
Children Under 6 by Poverty Category : 2008 – 2012 Summary Data
Maryland Montgomery Howard Prince George's
2008‐2012 Percentage of 6‐year‐old Population
2008‐2012 Percentage of6‐year‐old Population
2008‐2012 Percentage of 6‐year‐old Population
2008‐ 2012
Percentage of 6‐year‐old Population
Under 6 Population
433,771 75,496 21,325 69,399
Below Poverty 62,169 14.33% 6,469 8.57% 1,120 5.25% 8,581 12.36%
Between Poverty and 185% FPL
64,784 14.94% 10,467 13.86% 1,374 6.44% 12,691 18.29%
Between 185% and 300% FPL
137,681 31.74% 11,139 14.75% 2,598 12.18% 16,265 23.44%
An estimated 28,075 Montgomery County children under the age of 6 years are living at or below 300% of the Federal Poverty Level (FPL).
Roughly 37% of the under 6 population would qualify for services based on a 300% FPL income standard.
More than 6,000 Montgomery County children are living below the FPL, which reflects a 45% increase compared to 2000.
More than 22% of the under 6 population live at or below 185% FPL.
The percentage of Montgomery County children living below 185% FPL has increased by 6 percentage points since 2000, representing an increase of
more than 5,000 children.
Montgomery County children are doing better than children across the state and in neighboring Prince George’s County
Source: 2008‐2012 Ameri ca n Communi ty Survey 5 ‐Yea r Es ti ma tes
U.S. Cens us 2000 Summa ry Fi l e 3 (SF 3) Sa mpl e Da ta
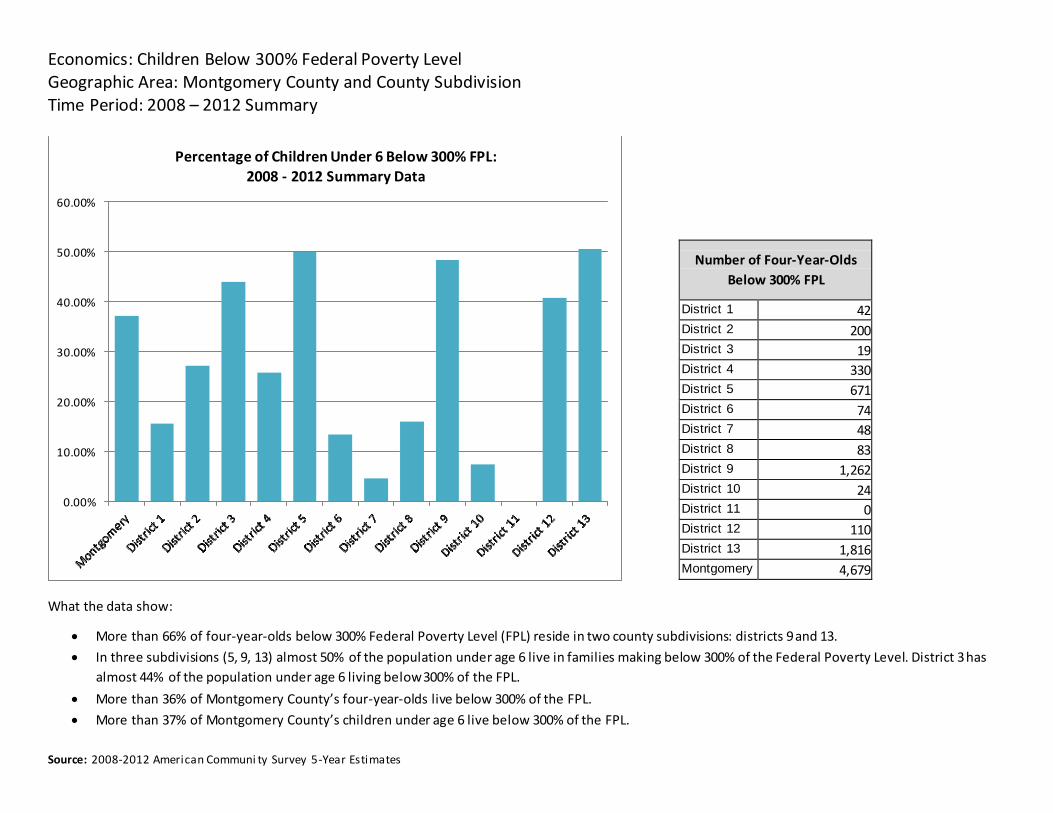
Economics: Children Below 300% Federal Poverty Level Geographic Area: Montgomery County and County Subdivision Time Period: 2008 – 2012 Summary
60.00%
Percentage of Children Under 6 Below 300% FPL: 2008 ‐ 2012 Summary Data
Number of Four‐Year‐Olds
Below 300% FPL
District 1 42District 2 200District 3 19District 4 330District 5 671District 6 74District 7 48District 8 83District 9 1,262District 10 24District 11 0District 12 110District 13 1,816Montgomery 4,679
50.00%
40.00%
30.00%
20.00%
10.00%
0.00%
What the data show:
More than 66% of four‐year‐olds below 300% Federal Poverty Level (FPL) reside in two county subdivisions: districts 9 and 13.
In three subdivisions (5, 9, 13) almost 50% of the population under age 6 live in families making below 300% of the Federal Poverty Level. District 3 has
almost 44% of the population under age 6 living below 300% of the FPL.
More than 36% of Montgomery County’s four‐year‐olds live below 300% of the FPL.
More than 37% of Montgomery County’s children under age 6 live below 300% of the FPL.
Source: 2008‐2012 Ameri ca n Communi ty Survey 5 ‐Yea r Es ti ma tes
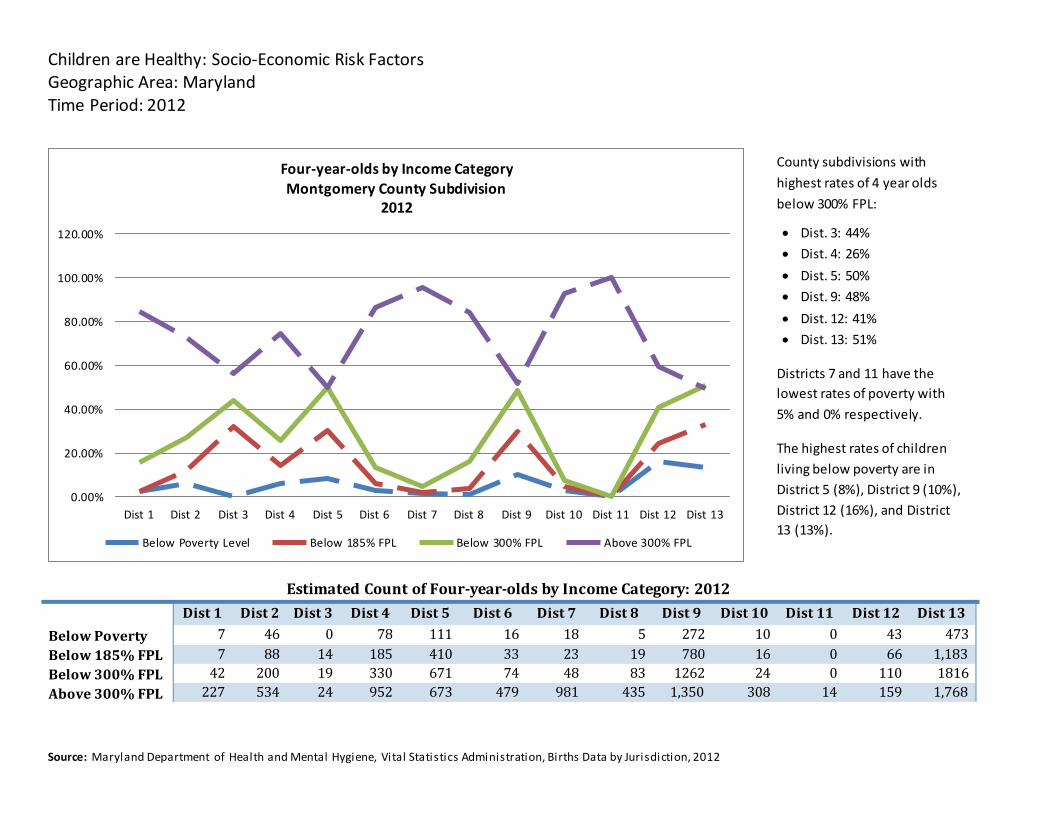
Children are Healthy: Socio‐Economic Risk FactorsGeographic Area: Maryland Time Period: 2012
120.00%
100.00%
80.00%
60.00%
40.00%
20.00%
0.00%
Four‐year‐olds by Income Category Montgomery County Subdivision
2012
Dist 1 Dist 2 Dist 3 Dist 4 Dist 5 Dist 6 Dist 7 Dist 8 Dist 9 Dist 10 Dist 11 Dist 12 Dist 13
Below Poverty Level Below 185% FPL Below 300% FPL Above 300% FPL
County subdivisions with
highest rates of 4 year olds
below 300% FPL:
Dist. 3: 44%
Dist. 4: 26%
Dist. 5: 50%
Dist. 9: 48%
Dist. 12: 41%
Dist. 13: 51% Districts 7 and 11 have the
lowest rates of poverty with
5% and 0% respectively. The highest rates of children
living below poverty are in
District 5 (8%), District 9 (10%),
District 12 (16%), and District
13 (13%).
EstimatedCountofFour‐year‐oldsbyIncomeCategory:2012
Dist Dis Dist Dist Di Dist Dist Dist8 Di Dist Dist1 Dist Dist 1 t2 3 4 st5 6 7 st9 10 1 12 137 46 0 78 111 16 18 5 272 10 0 43 4737 88 14 185 410 33 23 19 780 16 0 66 1,18342 200 19 330 671 74 48 83 1262 24 0 110 1816
BelowPovertyBelow185%FPLBelow300%FPLAbove300%FPL 227 534 24 952 673 479 981 435 1,350 308 14 159 1,768
Source: Ma ryl a nd Depa rtment of Hea l th a nd Menta l Hygi ene, Vi ta l Sta ti s ti cs Admi ni s trati on, Bi rths Da ta by Juri s di cti on, 2012
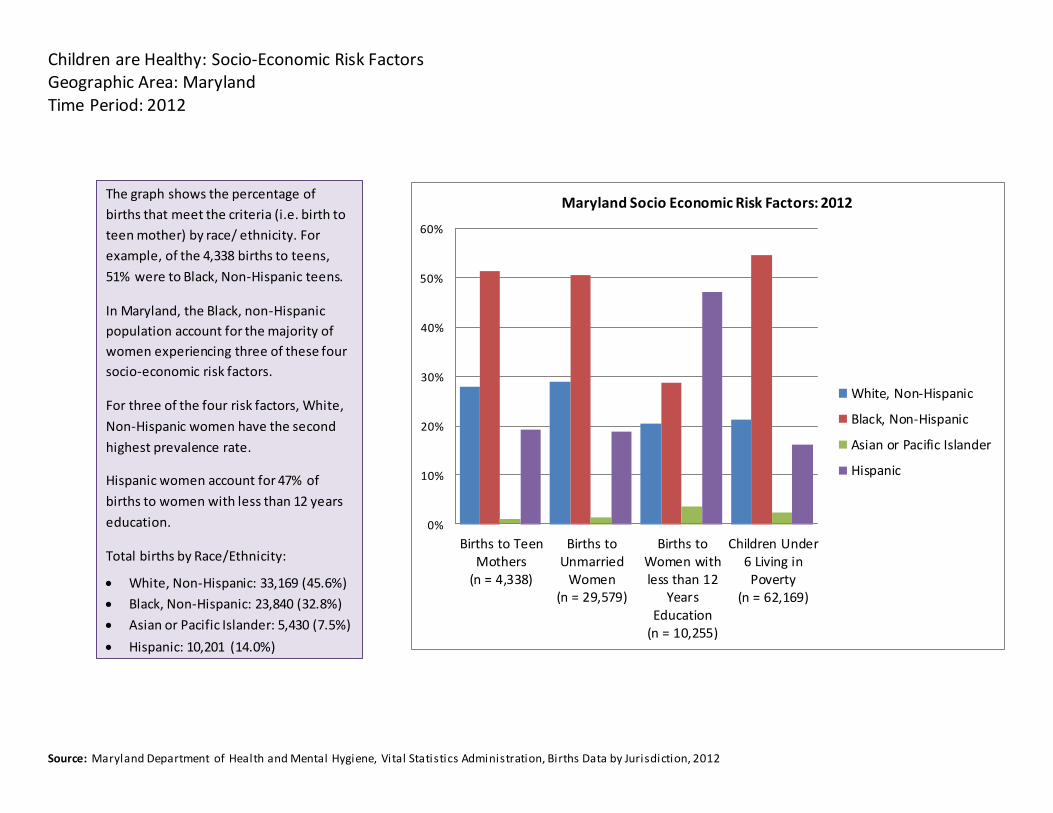
Children are Healthy: Socio‐Economic Risk FactorsGeographic Area: Maryland Time Period: 2012
The graph shows the percentage of
births that meet the criteria (i.e. birth to
teen mother) by race/ ethnicity. For
example, of the 4,338 births to teens,
51% were to Black, Non‐Hispanic teens.
60%
50%
Maryland Socio Economic Risk Factors: 2012
In Maryland, the Black, non‐Hispanic
population account for the majority of
women experiencing three of these four
socio‐economic risk factors.
For three of the four risk factors, White,
Non‐Hispanic women have the second
highest prevalence rate.
Hispanic women account for 47% of
births to women with less than 12 years
education.
Total births by Race/Ethnicity:
White, Non‐Hispanic: 33,169 (45.6%)
Black, Non‐Hispanic: 23,840 (32.8%)
Asian or Pacific Islander: 5,430 (7.5%)
Hispanic: 10,201 (14.0%)
40%
30%
20%
10%
0%
Births to Teen
Mothers (n = 4,338)
Births to Unmarried Women
(n = 29,579)
Births to
Women with less than 12
Years Education (n = 10,255)
Children Under
6 Living in Poverty
(n = 62,169)
White, Non‐Hispanic
Black, Non‐Hispanic
Asian or Pacific Islander
Hispanic
Source: Ma ryl a nd Depa rtment of Hea l th a nd Menta l Hygi ene, Vi ta l Sta ti s ti cs Admi ni s trati on, Bi rths Da ta by Juri s di cti on, 2012
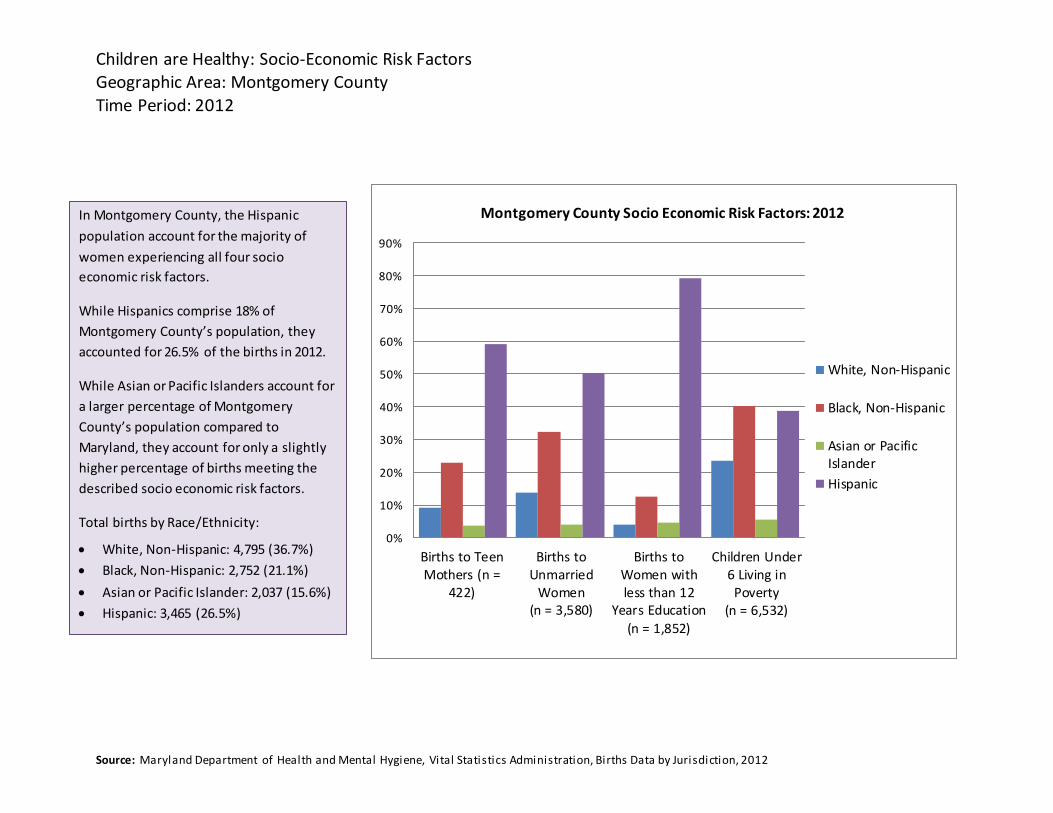
Children are Healthy: Socio‐Economic Risk Factors Geographic Area: Montgomery County Time Period: 2012
In Montgomery County, the Hispanic
population account for the majority of
women experiencing all four socio
economic risk factors.
90%
80%
Montgomery County Socio Economic Risk Factors: 2012
While Hispanics comprise 18% of
Montgomery County’s population, they
accounted for 26.5% of the births in 2012. While Asian or Pacific Islanders account for
a larger percentage of Montgomery
County’s population compared to
Maryland, they account for only a slightly
higher percentage of births meeting the
described socio economic risk factors. Total births by Race/Ethnicity:
White, Non‐Hispanic: 4,795 (36.7%)
Black, Non‐Hispanic: 2,752 (21.1%)
Asian or Pacific Islander: 2,037 (15.6%)
Hispanic: 3,465 (26.5%)
70%
60%
50%
40%
30%
20%
10%
0%
Births to Teen Mothers (n =
422)
Births to Unmarried Women
(n = 3,580)
Births to Women with less than 12
Years Education (n = 1,852)
Children Under
6 Living in Poverty
(n = 6,532)
White, Non‐Hispanic
Black, Non‐Hispanic
Asian or Pacific Islander
Hispanic
Source: Ma ryl a nd Depa rtment of Hea l th a nd Menta l Hygi ene, Vi ta l Sta ti s ti cs Admi ni s trati on, Bi rths Da ta by Juri s di cti on, 2012
Children are Healthy: Women Receiving Prenatal Care During First Trimester Geographic Area: Montgomery County Time Period: 2009*
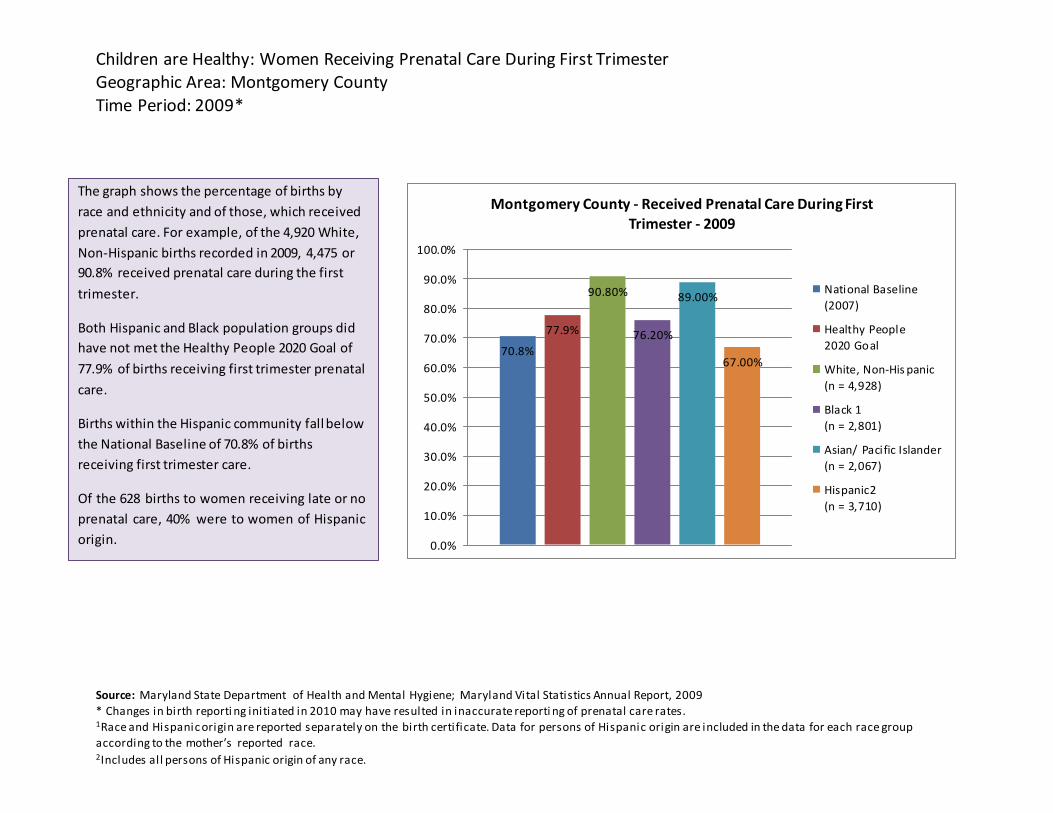
The graph shows the percentage of births by
race and ethnicity and of those, which received
prenatal care. For example, of the 4,920 White,
Non‐Hispanic births recorded in 2009, 4,475 or
90.8% received prenatal care during the first
100.0% 90.0%
Montgomery County ‐ Received Prenatal Care During First Trimester ‐ 2009
trimester. Both Hispanic and Black population groups did
have not met the Healthy People 2020 Goal of
77.9% of births receiving first trimester prenatal
care.
Births within the Hispanic community fall below
the National Baseline of 70.8% of births
receiving first trimester care. Of the 628 births to women receiving late or no
prenatal care, 40% were to women of Hispanic
origin.
80.0% 70.0% 60.0% 50.0% 40.0% 30.0% 20.0% 10.0% 0.0%
70.8%
77.9%
90.80% 76.20%
89.00%
67.00%
Nati onal Ba seline (2007)
Healthy Peopl e
2020 Go al
White, Non‐His panic
(n = 4, 928)
Bla ck 1
(n = 2, 801)
Asian/ Pa ci fic Islander
(n = 2, 067)
His panic2
(n = 3, 710)
Source: Ma ryla nd Sta te Depa rtment of Hea l th a nd Menta l Hygi ene; Ma ryl a nd Vi ta l Sta ti s tics Annua l Report, 2009
* Cha nges i n bi rth reporti ng i ni ti a ted i n 2010 ma y ha ve res ul ted i n i na ccura te reporti ng of prena ta l ca re ra tes . 1Ra ce a nd Hi s pa ni c ori gi n a re reported s epa ra tel y on the bi rth certi fi ca te. Da ta for pers ons of Hi s pa ni c ori gin a re i ncluded in the da ta for ea ch ra ce group
a ccordi ng to the mother’s reported ra ce. 2Incl udes a l l pers ons of Hi s pa nic origin of any ra ce.
Children are Healthy: Asthma PrevalenceGeographic Area: Montgomery County
Time Period: 2009 In 2011, the Maryland Asthma Control Program (MACP) published Maryland’s eighth comprehensive
asthma surveillance report. The report provides information on asthma prevalence and risk factors,
health care utilization, and asthma mortality. According to the report, while asthma is one of the most
common illnesses among children there is little reliable county level data on the prevalence of asthma in
children.
Montgomery County Population Demographics: 2009
Asthma Emergency Department Visit Rates (per 10,000) Montgomery County vs. Maryland: 2009
Age Montgomery County Maryland
Count Rate Count Rate
0 – 4 years 840 120.4 7,443 195.6
5 – 17 years 1,041 57.7 11,077 114.7
<18 years 1,881 72.6 18,520 136.1
Black 175,165
Age
0 – 4 years
69,752
5 – 17 years 167,869
Race White 694,791
The majority of the population data used in this
demographics report relies on U.S. Census data
from 2010 and later. The rates calculated in the
Asthma in Montgomery County report are age
adjusted to the 2000 U.S. Census.
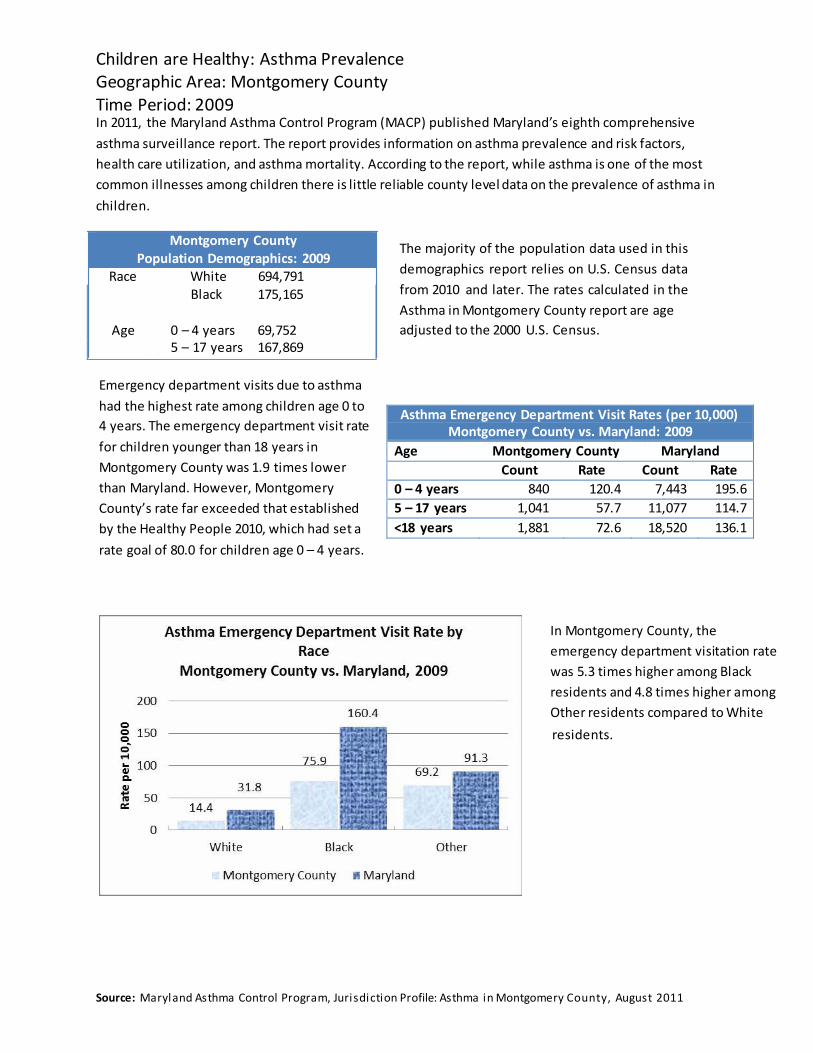
Emergency department visits due to asthma
had the highest rate among children age 0 to
4 years. The emergency department visit rate
for children younger than 18 years in
Montgomery County was 1.9 times lower
than Maryland. However, Montgomery
County’s rate far exceeded that established
by the Healthy People 2010, which had set a
rate goal of 80.0 for children age 0 – 4 years.
In Montgomery County, the
emergency department visitation rate
was 5.3 times higher among Black
residents and 4.8 times higher among
Other residents compared to White
residents.
Source: Ma ryl a nd As thma Control Progra m, Juri s di cti on Profile: As thma i n Montgomery County, Augus t 2011
Children are Healthy: Asthma PrevalenceGeographic Area: Montgomery County
Time Period: 2009 The number of asthma hospitalization cases among children has increased from 122 cases among
Asthma Hospitalization Rates (per 10,000) Montgomery County vs. Maryland: 2009
Age Montgomery County Maryland
Cases Rate Cases Rate
0 – 4 years 228 32.7 1,834 48.2
5 – 17 years 192 10.5 1,400 17.4
< 18 years 420 15.8 2,976 25.4
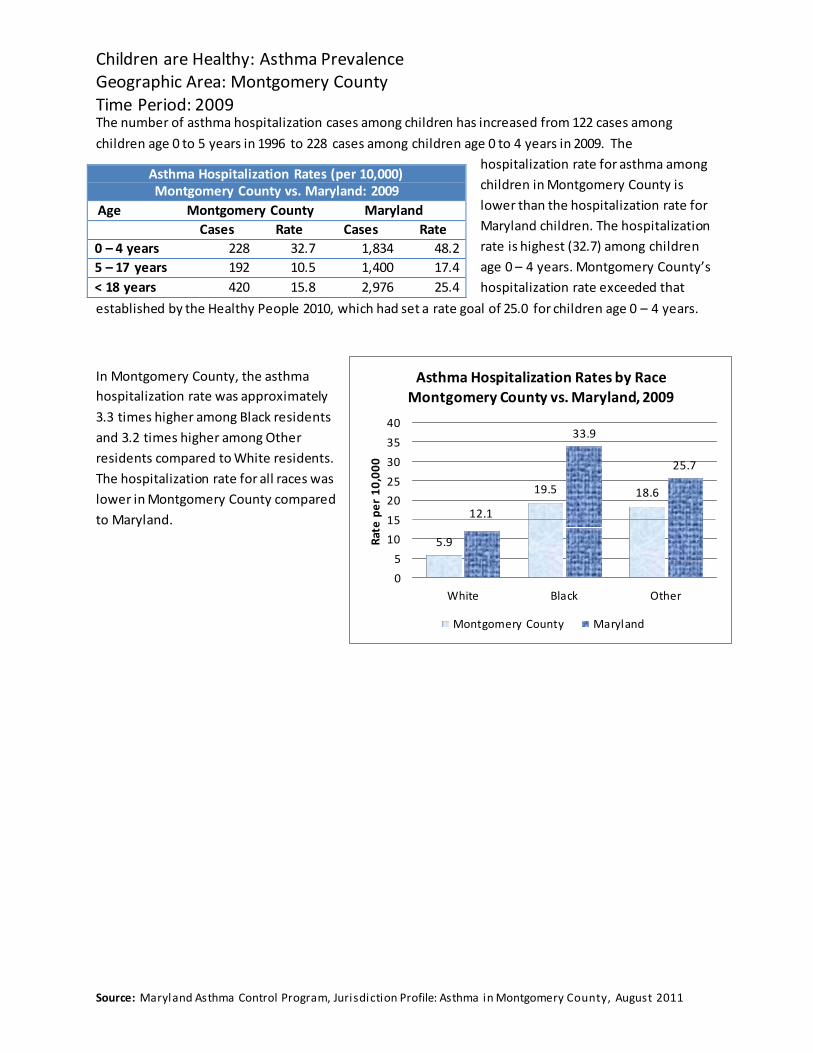
children age 0 to 5 years in 1996 to 228 cases among children age 0 to 4 years in 2009. The
hospitalization rate for asthma among
children in Montgomery County is
lower than the hospitalization rate for
Maryland children. The hospitalization
rate is highest (32.7) among children
age 0 – 4 years. Montgomery County’s
hospitalization rate exceeded that
established by the Healthy People 2010, which had set a rate goal of 25.0 for children age 0 – 4 years.
In Montgomery County, the asthma
hospitalization rate was approximately
3.3 times higher among Black residents
and 3.2 times higher among Other
residents compared to White residents.
The hospitalization rate for all races was
lower in Montgomery County compared
to Maryland.
Asthma Hospitalization Rates by Race Montgomery County vs. Maryland, 2009
40 33.9
Rate per 10,000
35
30 25.7
25 19.5 18.6
20
15 12.1
10 5.9
5
0
White Bla ck Other
Montgomery County Ma ryl and
Source: Ma ryl a nd As thma Control Progra m, Juri s di cti on Profile: As thma i n Montgomery County, Augus t 2011
Children are Healthy: Death Rate of Infants and Children Age One to Four YearsGeographic Area: National, State, County
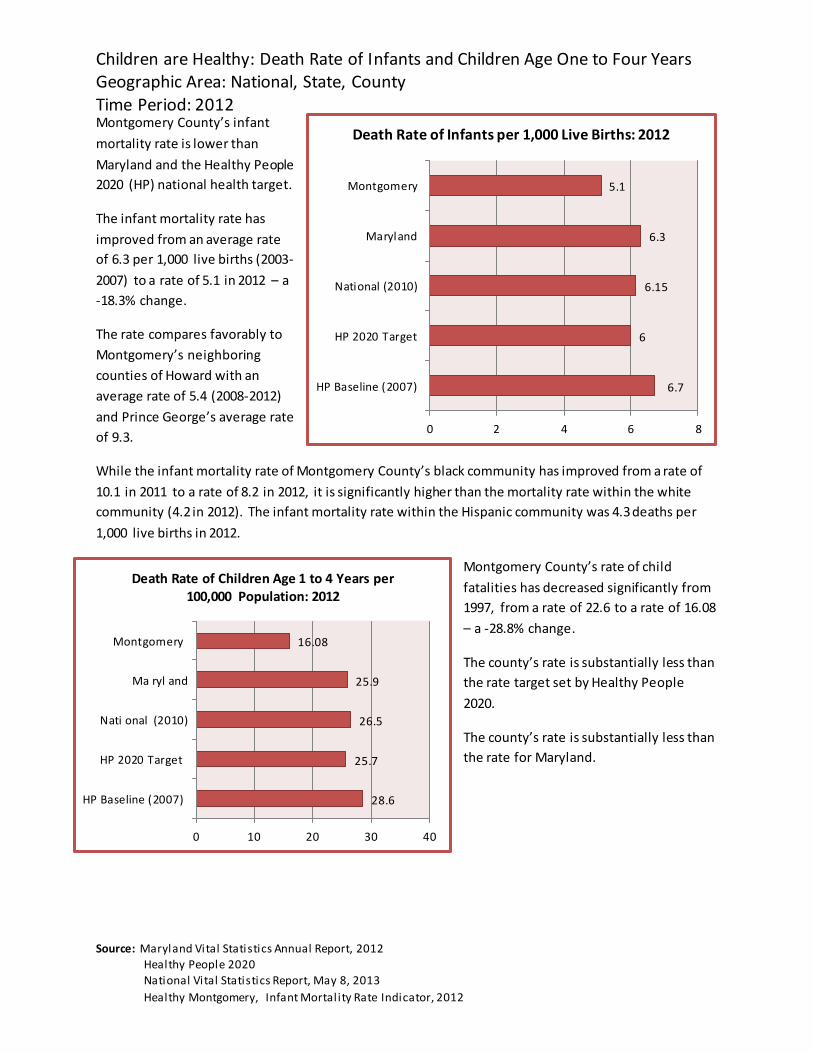
Time Period: 2012 Montgomery County’s infant
mortality rate is lower than
Maryland and the Healthy People
Death Rate of Infants per 1,000 Live Births: 2012
2020 (HP) national health target.
The infant mortality rate has
improved from an average rate
of 6.3 per 1,000 live births (2003‐
2007) to a rate of 5.1 in 2012 – a
‐18.3% change.
Montgomery
Ma ryl and
Nati onal (2010)
5.1 6.3
6.15
The rate compares favorably to
Montgomery’s neighboring
counties of Howard with an
average rate of 5.4 (2008‐2012)
and Prince George’s average rate
HP 2020 Target
HP Ba seline ( 2007)
6
6.7
of 9.3. 0 2 4 6 8
While the infant mortality rate of Montgomery County’s black community has improved from a rate of
10.1 in 2011 to a rate of 8.2 in 2012, it is significantly higher than the mortality rate within the white
community (4.2 in 2012). The infant mortality rate within the Hispanic community was 4.3 deaths per
1,000 live births in 2012.
Death Rate of Children Age 1 to 4 Years per 100,000 Population: 2012
Montgomery County’s rate of child
fatalities has decreased significantly from
1997, from a rate of 22.6 to a rate of 16.08
– a ‐28.8% change. Montgomery
Ma ryl and
Nati onal (2010)
HP 2020 Target
16.08 25.9 26.5 25.7
The county’s rate is substantially less than
the rate target set by Healthy People
2020. The county’s rate is substantially less than
the rate for Maryland.
HP Ba seline ( 2007) 28.6
0 10 20 30 40
Source: Ma ryl a nd Vi ta l Sta ti s ti cs Annua l Report, 2012
Hea l thy Peopl e 2020
Na ti ona l Vi ta l Sta ti s ti cs Report, Ma y 8, 2013
Hea l thy Montgomery, Infa nt Morta l i ty Ra te Indi ca tor, 2012
Children are Healthy: Leading Cause of Death in Children Under One Year
Geographic Area: Montgomery County Time Period: 2010‐2012
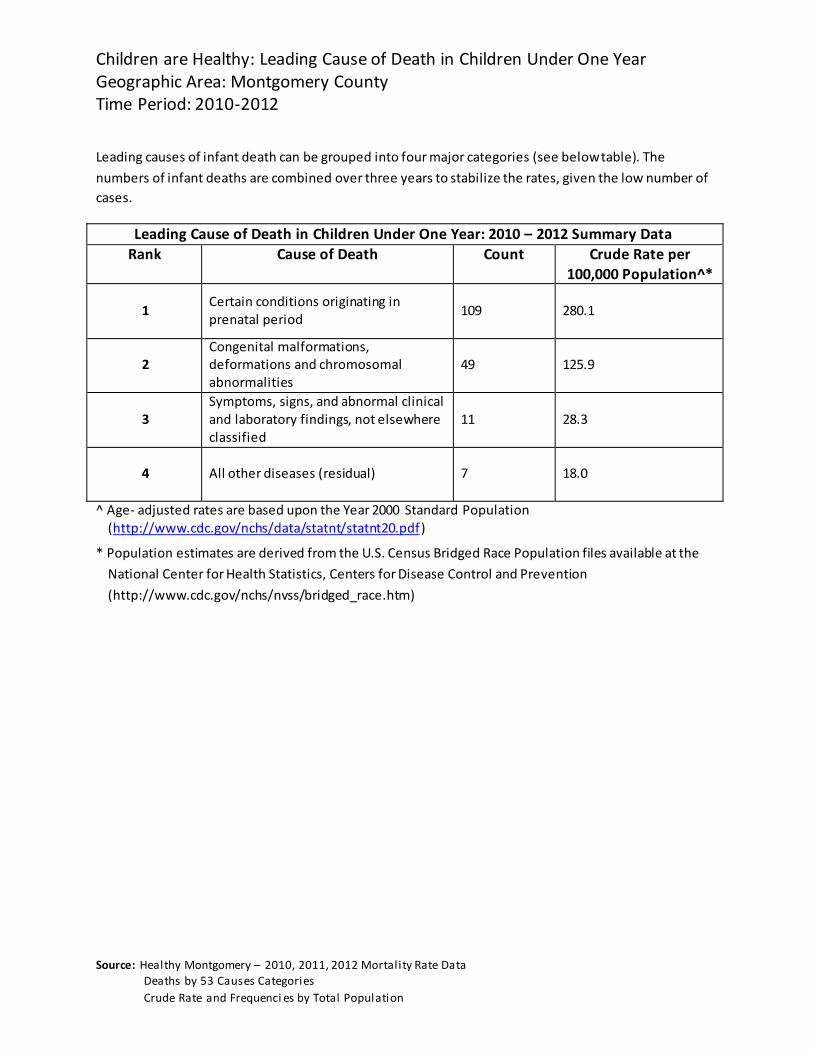
Leading causes of infant death can be grouped into four major categories (see below table). The
numbers of infant deaths are combined over three years to stabilize the rates, given the low number of
cases.
Leading Cause of Death in Children Under One Year: 2010 – 2012 Summary Data Rank Cause of Death Count Crude Rate per
100,000 Population^*
1
Certain conditions originating in prenatal period
109
280.1
2
Congenital malformations, deformations and chromosomal abnormalities
49
125.9
3
Symptoms, signs, and abnormal clinical and laboratory findings, not elsewhere classified
11
28.3
4
All other diseases (residual)
7
18.0
^ Age‐ adjusted rates are based upon the Year 2000 Standard Population (http://www.cdc.gov/nchs/data/statnt/statnt20.pdf )
* Population estimates are derived from the U.S. Census Bridged Race Population files available at the
National Center for Health Statistics, Centers for Disease Control and Prevention
(http://www.cdc.gov/nchs/nvss/bridged_race.htm)
Source: Hea l thy Montgomery – 2010, 2011, 2012 Morta l i ty Ra te Da ta
Dea ths by 53 Ca us es Ca tegori es
Crude Ra te a nd Frequenci es by Tota l Popul a ti on
Children are Safe: Child Protective Services Cases
Geographic Area: Montgomery County Time Period: 2013
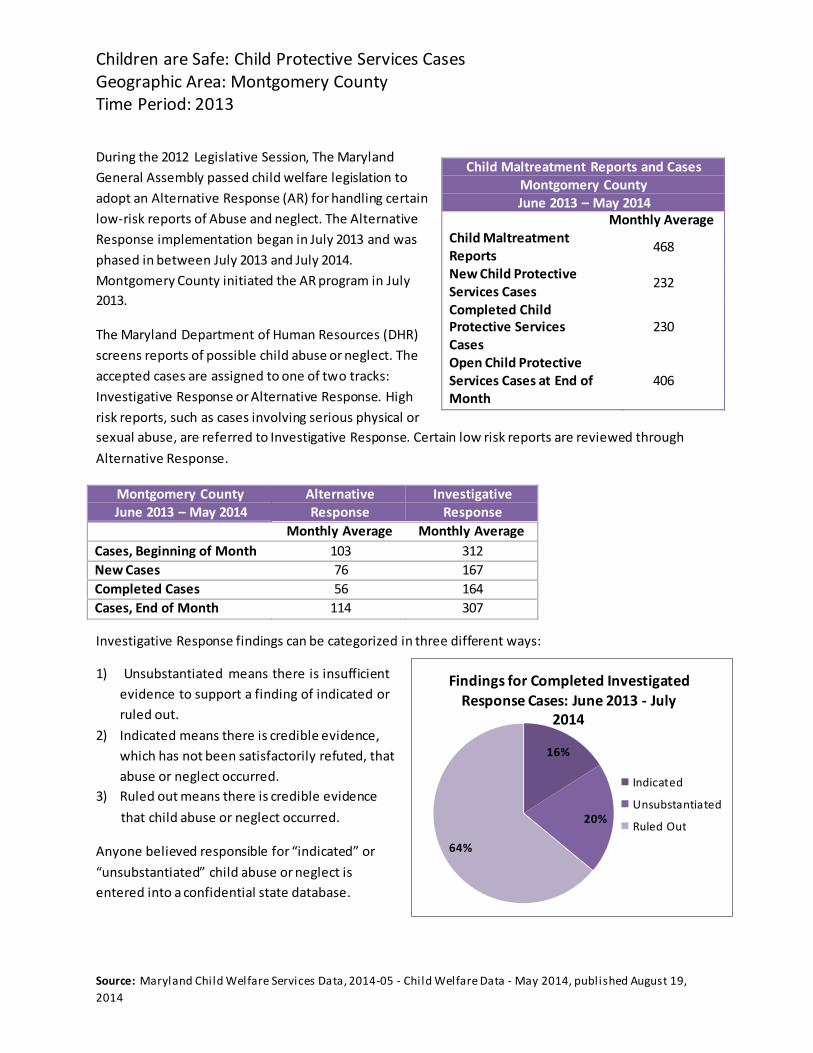
Child Maltreatment Reports and Cases Montgomery County June 2013 – May 2014
Monthly Average Child Maltreatment Reports
468
New Child Protective Services Cases
232
Completed Child Protective Services Cases
230
Open Child Protective Services Cases at End of Month
406
During the 2012 Legislative Session, The Maryland
General Assembly passed child welfare legislation to
adopt an Alternative Response (AR) for handling certain
low‐risk reports of Abuse and neglect. The Alternative
Response implementation began in July 2013 and was
phased in between July 2013 and July 2014.
Montgomery County initiated the AR program in July
2013. The Maryland Department of Human Resources (DHR)
screens reports of possible child abuse or neglect. The
accepted cases are assigned to one of tw o tracks:
Investigative Response or Alternative Response. High
risk reports, such as cases involving serious physical or
sexual abuse, are referred to Investigative Response. Certain low risk reports are reviewed through
Alternative Response.
Montgomery County June 2013 – May 2014
Alternative Response
Investigative Response
Monthly Average Monthly Average
Cases, Beginning of Month 103 312
New Cases 76 167
Completed Cases 56 164
Cases, End of Month 114 307
Investigative Response findings can be categorized in three different ways:
1) Unsubstantiated means there is insufficient
evidence to support a finding of indicated or
ruled out.
2) Indicated means there is credible evidence,
which has not been satisfactorily refuted, that
abuse or neglect occurred.
3) Ruled out means there is credible evidence
Findings for Completed Investigated Response Cases: June 2013 ‐ July
2014
16%
Indicated
Unsubsta ntia ted that child abuse or neglect occurred.
Anyone believed responsible for “indicated” or
“unsubstantiated” child abuse or neglect is
entered into a confidential state database.
64%
20%
Ruled Out
Source: Ma ryl a nd Chi l d Wel fa re Servi ces Da ta , 2014‐05 ‐ Chi l d Wel fa re Da ta ‐ Ma y 2014, publ i s hed Augus t 19,
2014
Young Children Ready for School: Kindergarten Readiness Rate
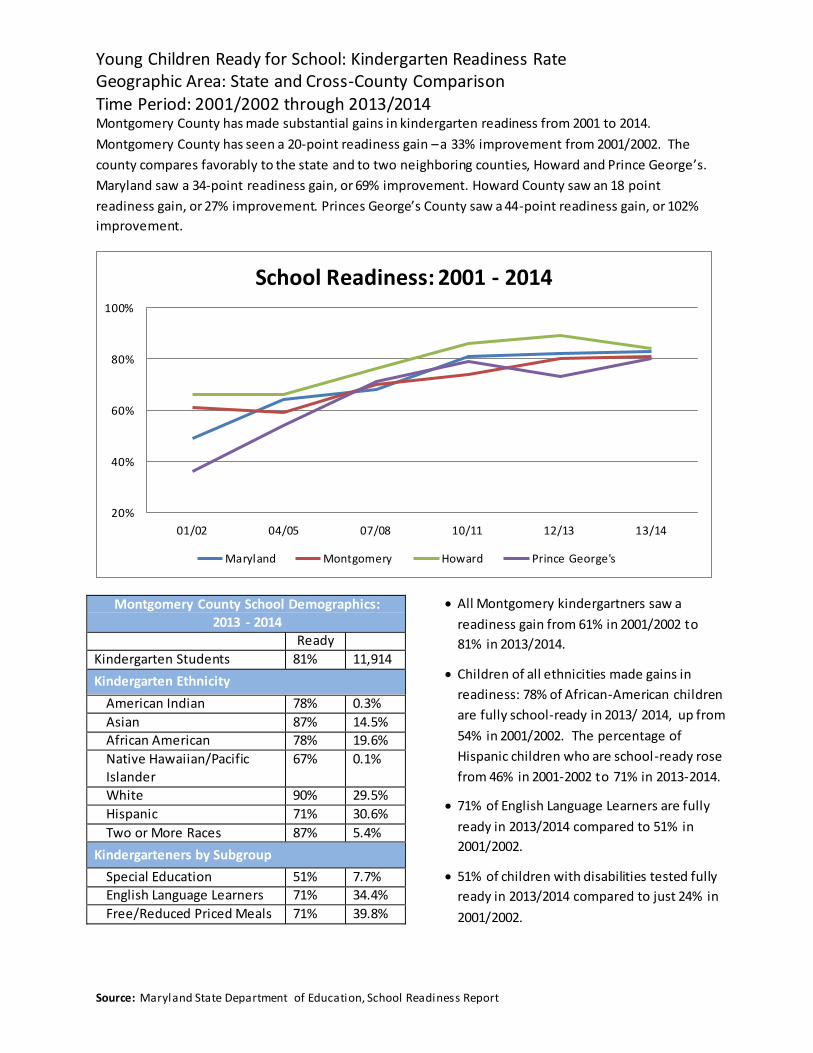
Geographic Area: State and Cross‐County Comparison Time Period: 2001/2002 through 2013/2014 Montgomery County has made substantial gains in kindergarten readiness from 2001 to 2014.
Montgomery County has seen a 20‐point readiness gain – a 33% improvement from 2001/2002. The
county compares favorably to the state and to two neighboring counties, Howard and Prince George’s.
Maryland saw a 34‐point readiness gain, or 69% improvement. Howard County saw an 18 point
readiness gain, or 27% improvement. Princes George’s County saw a 44‐point readiness gain, or 102%
improvement.
Montgomery County School Demographics: 2013 ‐ 2014
Ready Kindergarten Students 81% 11,914
Kindergarten Ethnicity
American Indian 78% 0.3% Asian 87% 14.5% African American 78% 19.6% Native Hawaiian/Pacific Islander
67% 0.1%
White 90% 29.5% Hispanic 71% 30.6%
Two or More Races 87% 5.4%
Kindergarteners by Subgroup
Special Education 51% 7.7% English Language Learners 71% 34.4% Free/Reduced Priced Meals 71% 39.8%
100%
School Readiness: 2001 ‐ 2014
80%
60%
40%
20% 01/02 04/05 07/08 10/11 12/13 13/14
Ma ryl and Montgomery Howard Prince George's
All Montgomery kindergartners saw a
readiness gain from 61% in 2001/2002 to
81% in 2013/2014.
Children of all ethnicities made gains in
readiness: 78% of African‐American children
are fully school‐ready in 2013/ 2014, up from
54% in 2001/2002. The percentage of
Hispanic children who are school ‐ready rose
from 46% in 2001‐2002 to 71% in 2013‐2014.
71% of English Language Learners are fully
ready in 2013/2014 compared to 51% in
2001/2002.
51% of children with disabilities tested fully ready in 2013/2014 compared to just 24% in
2001/2002.
Source: Ma ryl a nd Sta te Depa rtment of Educa ti on, School Rea di nes s Report
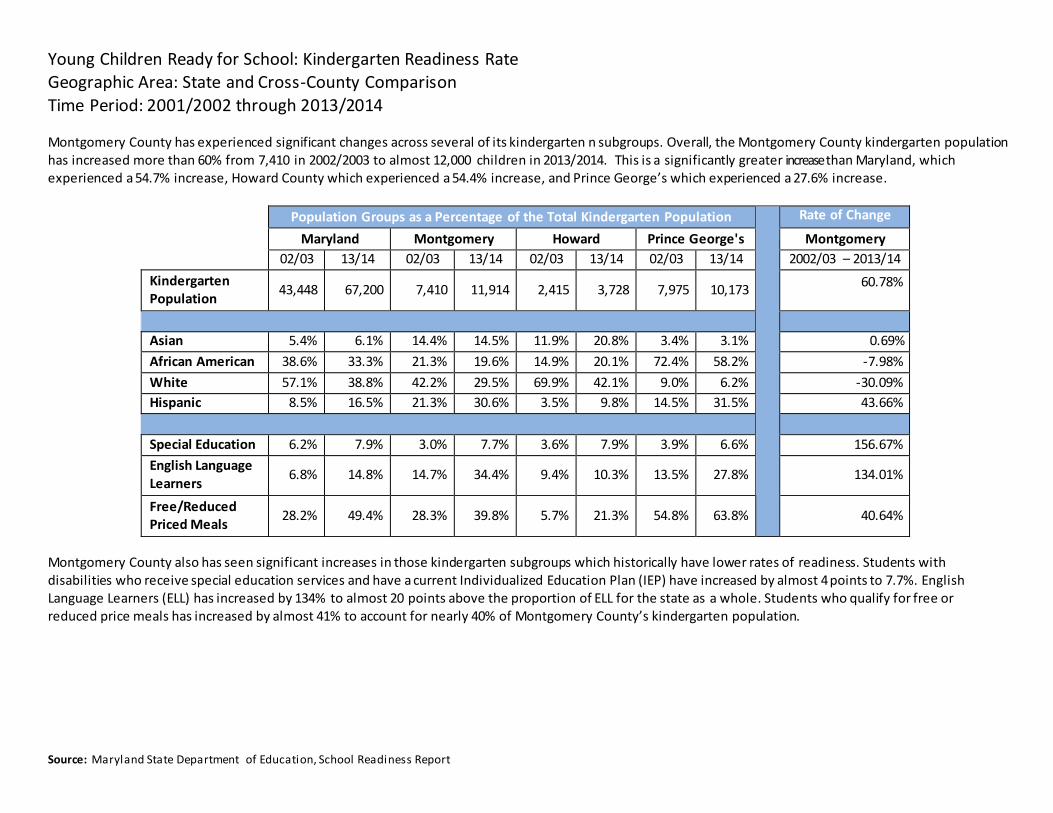
Young Children Ready for School: Kindergarten Readiness Rate Geographic Area: State and Cross‐County Comparison Time Period: 2001/2002 through 2013/2014 Montgomery County has experienced significant changes across several of its kindergarten n subgroups. Overall, the Montgomery County kindergarten population has increased more than 60% from 7,410 in 2002/2003 to almost 12,000 children in 2013/2014. This is a significantly greater increase than Maryland, which experienced a 54.7% increase, Howard County which experienced a 54.4% increase, and Prince George’s which experienced a 27.6% increase.
Population Groups as a Percentage of the Total Kindergarten Population Rate of Change
Maryland Montgomery Howard Prince George's Montgomery
02/03 13/14 02/03 13/14 02/03 13/14 02/03 13/14 2002/03 – 2013/14
Kindergarten Population
43,448
67,200
7,410
11,914
2,415
3,728
7,975
10,17360.78%
Asian 5.4% 6.1% 14.4% 14.5% 11.9% 20.8% 3.4% 3.1% 0.69%
African American 38.6% 33.3% 21.3% 19.6% 14.9% 20.1% 72.4% 58.2% ‐7.98%
White 57.1% 38.8% 42.2% 29.5% 69.9% 42.1% 9.0% 6.2% ‐30.09%
Hispanic 8.5% 16.5% 21.3% 30.6% 3.5% 9.8% 14.5% 31.5% 43.66%
Special Education 6.2% 7.9% 3.0% 7.7% 3.6% 7.9% 3.9% 6.6% 156.67%
English Language Learners
6.8%
14.8%
14.7%
34.4%
9.4%
10.3%
13.5%
27.8%
134.01%
Free/Reduced Priced Meals
28.2%
49.4%
28.3%
39.8%
5.7%
21.3%
54.8%
63.8%
40.64%
Montgomery County also has seen significant increases in those kindergarten subgroups which historically have lower rates of readiness. Students with disabilities who receive special education services and have a current Individualized Education Plan (IEP) have increased by almost 4 points to 7.7%. English Language Learners (ELL) has increased by 134% to almost 20 points above the proportion of ELL for the state as a whole. Students who qualify for free or reduced price meals has increased by almost 41% to account for nearly 40% of Montgomery County’s kindergarten population.
Source: Ma ryl a nd Sta te Depa rtment of Educa ti on, School Rea di nes s Report
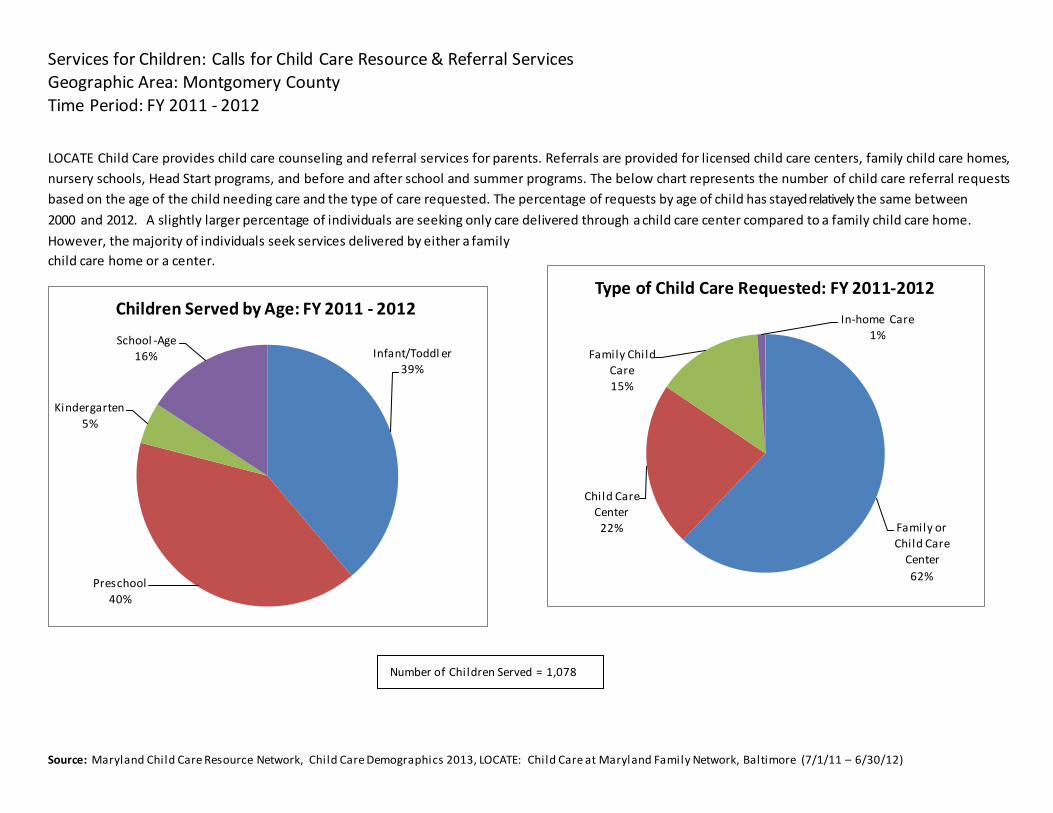
Services for Children: Calls for Child Care Resource & Referral Services Geographic Area: Montgomery County Time Period: FY 2011 ‐ 2012
LOCATE Child Care provides child care counseling and referral services for parents. Referrals are provided for licensed child care centers, family child care homes,
nursery schools, Head Start programs, and before and after school and summer programs. The below chart represents the number of child care referral requests
based on the age of the child needing care and the type of care requested. The percentage of requests by age of child has stayed relatively the same between
2000 and 2012. A slightly larger percentage of individuals are seeking only care delivered through a child care center compared to a family child care home.
However, the majority of individuals seek services delivered by either a family
child care home or a center.
Children Served by Age: FY 2011 ‐ 2012
School ‐Age
Type of Child Care Requested: FY 2011‐2012
In‐home Ca re
1%
Ki nderga rten
5%
16% Infa nt/Toddl er 39%
Fa mi l y Chi l d Ca re
15%
Pres chool
40%
Chi l d Ca re
Center
22%
Fa mi l y or
Chi l d Ca re
Center
62%
Number of Chi l dren Served = 1,078
Source: Ma ryl a nd Chi l d Ca re Res ource Network, Chi l d Ca re Demogra phi cs 2013, LOCATE: Chi l d Ca re a t Ma ryl a nd Fa mi l y Network, Ba l ti more (7/1/11 – 6/30/12)
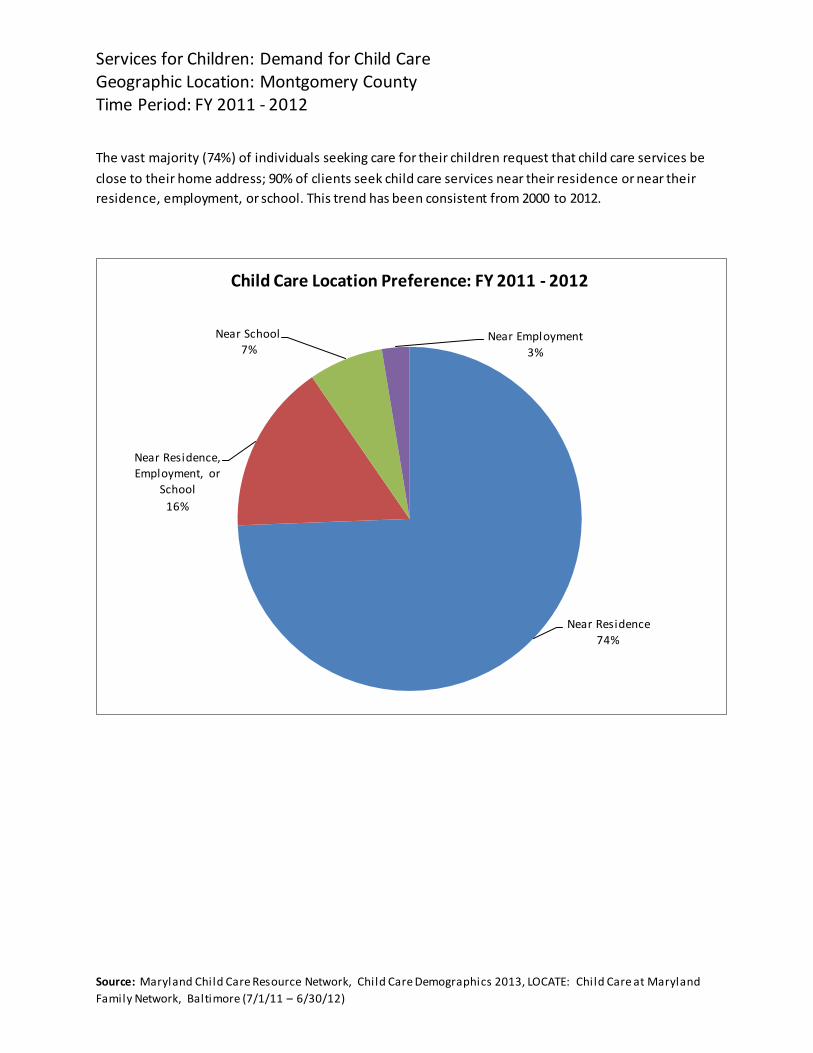
Services for Children: Demand for Child Care Geographic Location: Montgomery County Time Period: FY 2011 ‐ 2012
The vast majority (74%) of individuals seeking care for their children request that child care services be
close to their home address; 90% of clients seek child care services near their residence or near their
residence, employment, or school. This trend has been consistent from 2000 to 2012.
Child Care Location Preference: FY 2011 ‐ 2012
Nea r School
7% Nea r Empl oyment
3%
Nea r Res i dence,
Empl oyment, or
School
16%
Nea r Res i dence
74%
Source: Ma ryl a nd Chi l d Ca re Res ource Network, Chi l d Ca re Demogra phi cs 2013, LOCATE: Chi l d Ca re a t Ma ryl a nd
Fa mi l y Network, Ba l ti more (7/1/11 – 6/30/12)
Services for Children: Child Care CapacityGeographic Area: Montgomery County
Time Period: 2000 ‐ 2013
Child Care Availability by Program Type: 2013
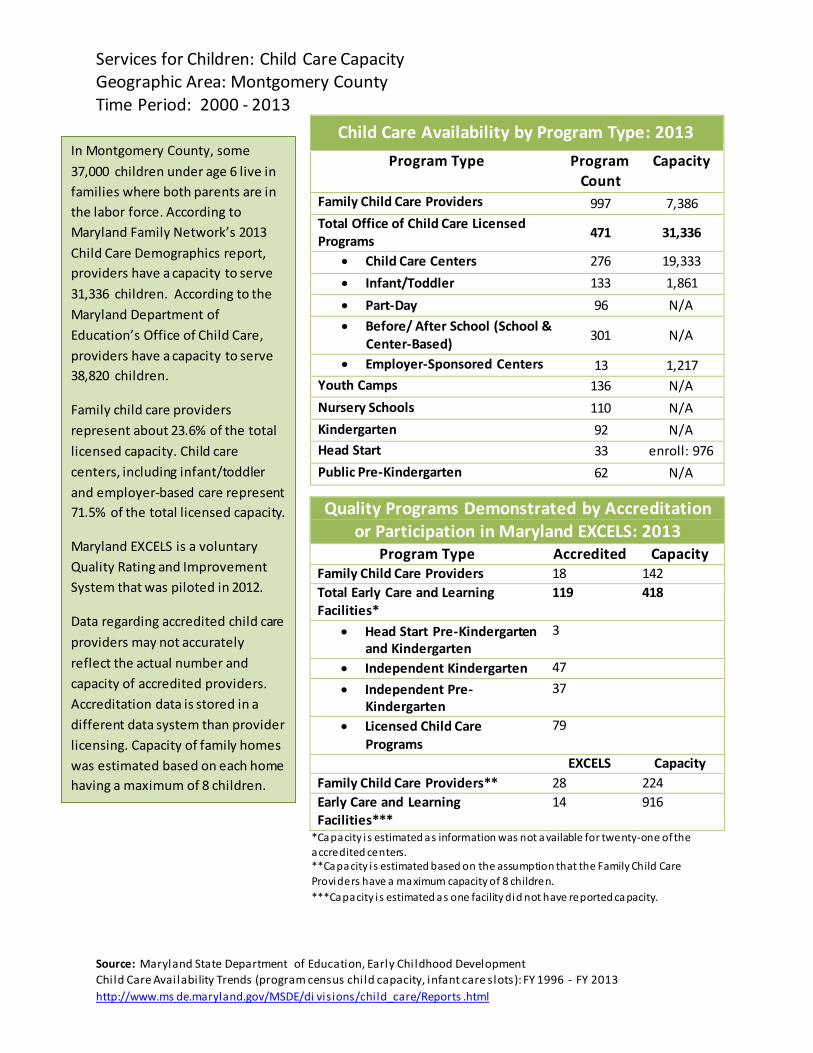
In Montgomery County, some Program Type Program Capacity
Count 37,000 children under age 6 live in
families where both parents are in
the labor force. According to
Maryland Family Network’s 2013
Family Child Care Providers 997 7,386
Total Office of Child Care Licensed
Programs 471 31,336
Child Care Demographics report,
providers have a capacity to serve Child Care Centers 276 19,333
Infant/Toddler 133 1,861 31,336 children. According to the
Maryland Department of
Education’s Office of Child Care,
providers have a capacity to serve
Part‐Day 96 N/A
Before/ After School (School &
Center‐Based) 301 N/A
Employer‐Sponsored Centers 13 1,217 38,820 children.
Youth Camps 136 N/A Nursery Schools 110 N/A Family child care providers
represent about 23.6% of the total
licensed capacity. Child care
centers, including infant/toddler
and employer‐based care represent
Kindergarten 92 N/A
Head Start 33 enroll: 976
Public Pre‐Kindergarten 62 N/A
Quality Programs Demonstrated by Accreditation or Participation in Maryland EXCELS: 2013
71.5% of the total licensed capacity. Maryland EXCELS is a voluntary
Quality Rating and Improvement
System that was piloted in 2012.
Program Type Accredited Capacity Family Child Care Providers 18 142 Total Early Care and Learning 119 418 Facilities*
Data regarding accredited child care
providers may not accurately Head Start Pre‐Kindergarten
and Kindergarten
3
reflect the actual number and
capacity of accredited providers.
Accreditation data is stored in a
different data system than provider
licensing. Capacity of family homes
was estimated based on each home
Independent Kindergarten 47
37 Independent Pre‐ Kindergarten
79 Licensed Child Care Programs
EXCELS Capacity
Family Child Care Providers** 28 224 having a maximum of 8 children. Early Care and Learning 14 916 Facilities***
*Ca p a city i s estimated a s information was n ot a vailable for twe nty‐on e of the a ccre d ited ce n ters. **Ca p a city i s estimated b ased on the assu mp tion that the Family Ch ild Care Provi d e rs h ave a ma ximum capacity of 8 ch ildre n.
***Ca p a city i s estimated a s one facility d i d n ot h ave re p orted ca pacity.
Source: Ma ryl a nd Sta te Depa rtment of Educa ti on, Ea rl y Chi l dhood Devel opment
Chi l d Ca re Ava i l a bi lity Trends (progra m cens us chi l d ca pa city, i nfa nt ca re s l ots ): FY 1996 ‐ FY 2013
http://www.ms de.ma ryl a nd.gov/MSDE/di vi s i ons /chi l d_ca re/Reports .html
Services for Children: Child Care CapacityGeographic Area: Montgomery County
Time Period: 2000 ‐ 2013
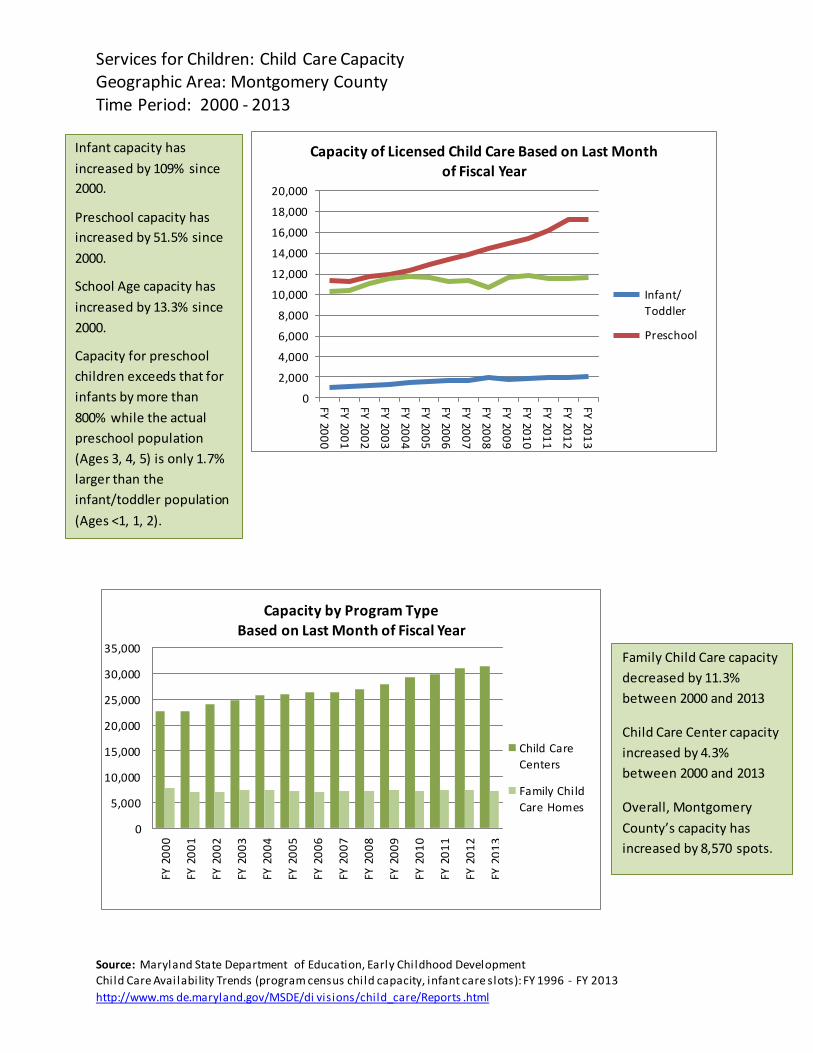
Infant capacity has
increased by 109% since
2000.
Preschool capacity has
increased by 51.5% since
2000.
School Age capacity has
increased by 13.3% since
2000.
Capacity for preschool
children exceeds that for
infants by more than FY2013
FY 2012
FY 2011
FY 2010
FY 2009
FY 2008
FY 2007
FY 2006
FY 2005
FY 2004
FY 2003
FY 2002
FY 2001
FY2000
800% while the actual
preschool population
(Ages 3, 4, 5) is only 1.7%
larger than the
infant/toddler population
(Ages <1, 1, 2).
20,000
18,000
16,000
14,000
12,000 10,000
8,000
6,000
4,000
2,000
0
Capacity of Licensed Child Care Based on Last Month of Fiscal Year
Infa nt/
Toddler
Preschool
35,000
30,000
25,000
20,000
15,000
10,000
5,000
0
Capacity by Program Type Based on Last Month of Fiscal Year
Child Ca re
Centers
Fa mily Chi ld
Care Homes
Family Child Care capacity
decreased by 11.3%
between 2000 and 2013 Child Care Center capacity
increased by 4.3%
between 2000 and 2013 Overall, Montgomery
County’s capacity has
FY 2000
FY 2001
FY 2002
FY 2003
FY 2004
FY 2005
FY 2006
FY 2007
FY 2008
FY 2009
FY 2010
FY 2011
FY 2012
FY2013
increased by 8,570 spots.
Source: Ma ryl a nd Sta te Depa rtment of Educa ti on, Ea rl y Chi l dhood Devel opment
Chi l d Ca re Ava i l a bi lity Trends (progra m cens us chi l d ca pa city, i nfa nt ca re s l ots ): FY 1996 ‐ FY 2013
http://www.ms de.ma ryl a nd.gov/MSDE/di vi s i ons /chi l d_ca re/Reports .html
Services for Children: Child Care CostGeographic Area: Montgomery County
Time Period: 2012
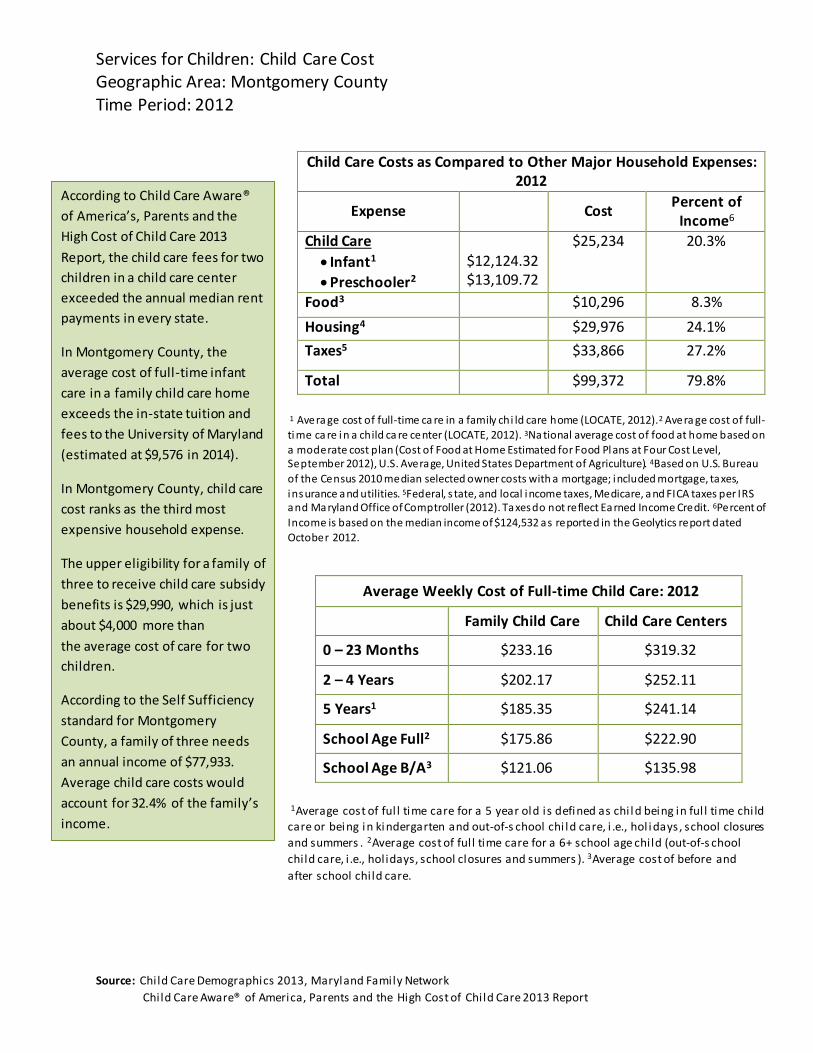
Child Care Costs as Compared to Other Major Household Expenses:2012
According to Child Care Aware®
of America’s, Parents and the
High Cost of Child Care 2013
Expense
Cost Percent of Income6
Child Care
Infant1 Preschooler2
$12,124.32$13,109.72
$25,234 20.3% Report, the child care fees for two
children in a child care center
exceeded the annual median rent
payments in every state. Food3
$10,296 8.3%
Housing4 $29,976 24.1%
Taxes5 $33,866 27.2% In Montgomery County, the
average cost of full ‐time infant
care in a family child care home
exceeds the in‐state tuition and
fees to the University of Maryland
(estimated at $9,576 in 2014).
Total $99,372 79.8%
In Montgomery County, child care
cost ranks as the third most
expensive household expense. The upper eligibility for a family of
three to receive child care subsidy
benefits is $29,990, which is just
about $4,000 more than
the average cost of care for two
children. According to the Self Sufficiency
standard for Montgomery
County, a family of three needs
an annual income of $77,933.
Average child care costs would
account for 32.4% of the family’s
income.
1 Ave ra ge cost of full‐time ca re in a family ch i ld care h ome (LOCATE, 2012).2 Ave ra ge cost of full‐ ti me ca re i n a ch ild ca re ce nter (LOCATE, 2012). 3Na tional average cost of food at h ome b ased on a mod e rate cost p lan (Cost of Food at Home Estimated for Food Pl ans at Four Cost Le vel, Se p te mb er 2012), U.S. Ave ra ge, Un ited States Department of Agriculture). 4Based on U.S. Bu reau of the Ce n sus 2010 me dian selected owner costs with a mortgage; i nclu ded mortgage, ta xes,
i n s urance a nd u tilities. 5Fed eral, s tate, and local i ncome taxes, Me dicare, a nd FI CA taxes p er I RS a n d Ma rylan d Office of Comp troller (2012). Ta xes d o n ot re flect Ea rned Income Cre dit. 6Pe rcent of I n come is b ased on the median in come of $124,532 a s re porte d in the Geolytics re port d ated Octobe r 2012.
Average Weekly Cost of Full‐time Child Care: 2012
Family Child Care Child Care Centers
0 – 23 Months $233.16 $319.32
2 – 4 Years $202.17 $252.11
5 Years1 $185.35 $241.14
School Age Full2 $175.86 $222.90
School Age B/A3 $121.06 $135.98
1Avera ge cos t of ful l ti me ca re for a 5 yea r ol d i s defi ned a s chi l d bei ng i n ful l ti me chi ld
ca re or bei ng i n ki nderga rten a nd out‐of‐s chool chi l d ca re, i .e., hol i da ys , s chool closures
a nd s ummers . 2Avera ge cos t of ful l ti me ca re for a 6+ s chool a ge chi l d (out‐of‐s chool
chi l d ca re, i .e., hol i da ys , s chool cl osures a nd s ummers ). 3Avera ge cos t of before a nd
a fter s chool chi l d ca re.
Source: Chi l d Ca re Demogra phi cs 2013, Ma ryl a nd Fa mi l y Network
Chi l d Ca re Awa re® of Ameri ca , Pa rents a nd the Hi gh Cos t of Chi l d Ca re 2013 Report
Services for Children: Montgomery County Infants & Toddlers Program Geographic Area: County
Time Period: FY 2009 – FY 2013
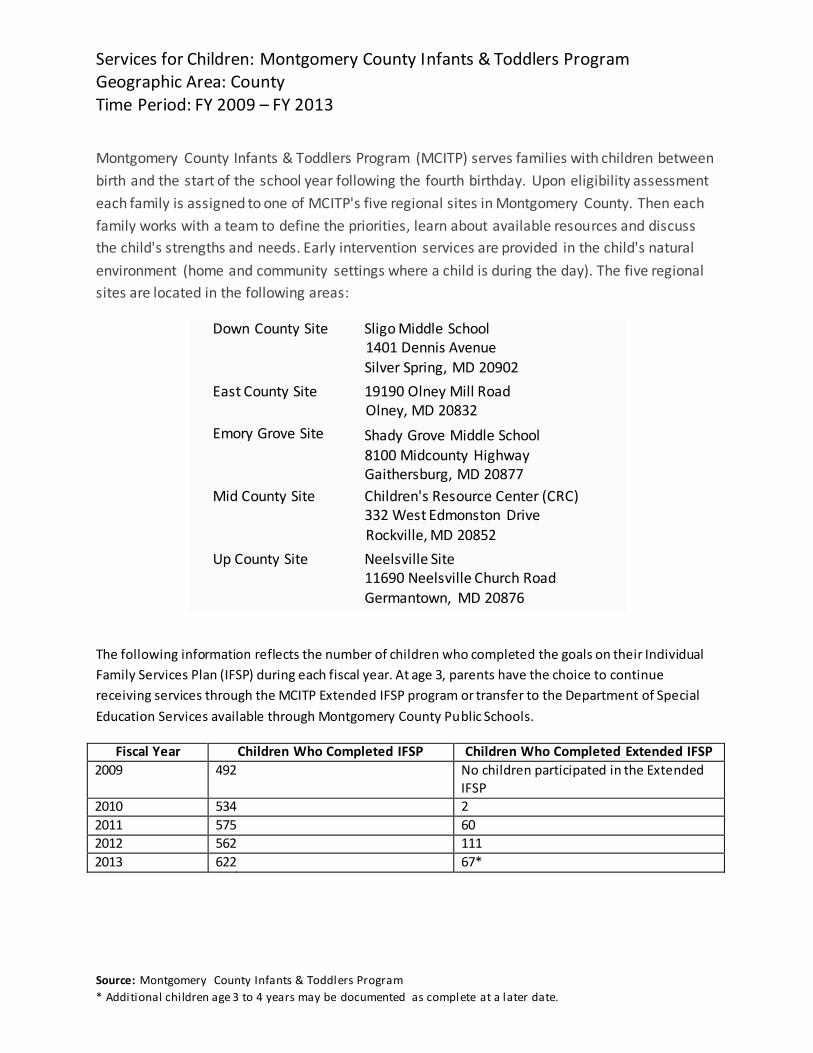
Montgomery County Infants & Toddlers Program (MCITP) serves families with children between
birth and the start of the school year following the fourth birthday. Upon eligibility assessment
each family is assigned to one of MCITP's five regional sites in Montgomery County. Then each
family works with a team to define the priorities, learn about available resources and discuss
the child's strengths and needs. Early intervention services are provided in the child's natural
environment (home and community settings where a child is during the day). The five regional
sites are located in the following areas:
Down County Site Sligo Middle School 1401 Dennis Avenue Silver Spring, MD 20902
East County Site 19190 Olney Mill Road Olney, MD 20832
Emory Grove Site Shady Grove Middle School 8100 Midcounty Highway Gaithersburg, MD 20877
Mid County Site Children's Resource Center (CRC) 332 West Edmonston Drive Rockville, MD 20852
Up County Site Neelsville Site 11690 Neelsville Church Road Germantown, MD 20876
The following information reflects the number of children who completed the goals on their Individual
Family Services Plan (IFSP) during each fiscal year. At age 3, parents have the choice to continue
receiving services through the MCITP Extended IFSP program or transfer to the Department of Special
Education Services available through Montgomery County Pu blic Schools.
Fiscal Year Children Who Completed IFSP Children Who Completed Extended IFSP
2009 492 No children participated in the Extended IFSP
2010 534 2 2011 575 60 2012 562 111 2013 622 67*
Source: Montgomery County Infa nts & Toddl ers Progra m
* Addi ti ona l chi ldren a ge 3 to 4 yea rs ma y be documented a s compl ete a t a l a ter da te.
Services for Children: Healthy Families Montgomery Home Visiting Geographic Area: Montgomery County
Time Period: July 2012 – June 2013
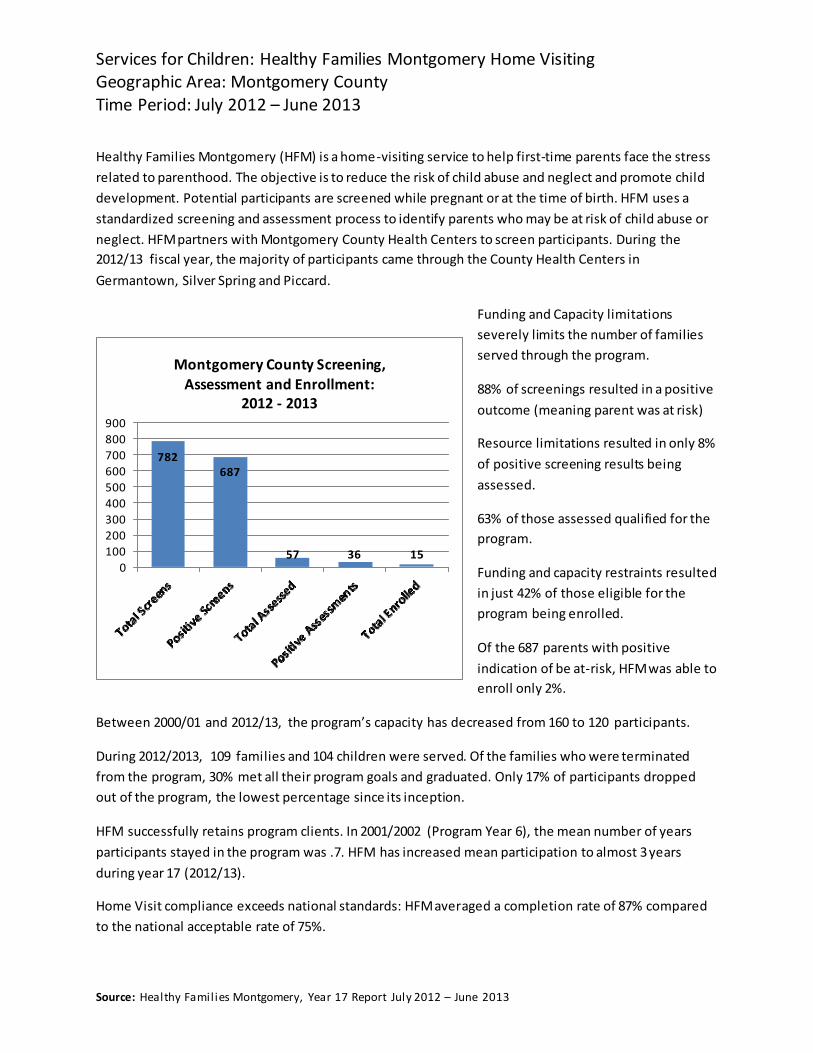
Healthy Families Montgomery (HFM) is a home ‐visiting service to help first‐time parents face the stress
related to parenthood. The objective is to reduce the risk of child abuse and neglect and promote child
development. Potential participants are screened while pregnant or at the time of birth. HFM uses a
standardized screening and assessment process to identify parents who may be at risk of child abuse or
neglect. HFM partners with Montgomery County Health Centers to screen participants. During the
2012/13 fiscal year, the majority of participants came through the County Health Centers in
Germantown, Silver Spring and Piccard.
900
800
700
600
500
400
300
200
100
0
Montgomery County Screening, Assessment and Enrollment:
2012 ‐ 2013
782
687
57 36 15
Funding and Capacity limitations
severely limits the number of families
served through the program. 88% of screenings resulted in a positive
outcome (meaning parent was at risk)
Resource limitations resulted in only 8%
of positive screening results being
assessed.
63% of those assessed qualified for the
program. Funding and capacity restraints resulted
in just 42% of those eligible for the
program being enrolled.
Of the 687 parents with positive
indication of be at‐risk, HFM was able to
enroll only 2%. Between 2000/01 and 2012/13, the program’s capacity has decreased from 160 to 120 participants. During 2012/2013, 109 fami lies and 104 children were served. Of the families who were terminated
from the program, 30% met all their program goals and graduated. Only 17% of participants dropped
out of the program, the lowest percentage since its inception. HFM successfully retains program clients. In 2001/2002 (Program Year 6), the mean number of years
participants stayed in the program was .7. HFM has increased mean participation to almost 3 years
during year 17 (2012/13).
Home Visit compliance exceeds national standards: HFM averaged a completion rate of 87% compared
to the national acceptable rate of 75%. Source: Hea l thy Fa mi l i es Montgomery, Yea r 17 Report Jul y 2012 – June 2013

Services for Children: Judy Centers
Geographic Area: Maryland Time Period: 2013 Judith P. Hoyer Early Child Care and Family Education Centers (known as "Judy Centers") provide a
central location for early childhood education and support services for children birth through
Kindergarten and their families who reside in specific Title I school districts across the State of Maryland.
Montgomery County Judy Center Locations
Rolling Terrace Elementary School 705 Bayfield Street Takoma Park 20912
Summit Hall Elementary School 101 West Deer Park Road Gaithersburg 20877
Rosemont Elementary 16400 Alden Avenue Gaithersburg 20877
Washington Grove Elementary School 8712 Oakmont Street Gaithersburg 20877
Judy Centers provide a wide range of early education services for your children and their families with the purpose of promoting school readiness. Judy Centers Partnerships must include:
Public prekindergarten Kindergarten
Preschool special education
Local Infant and Toddlers Program
Family Support Network Before and after early care and education services provided by qualified child care providers.
In addition, each Judy Center must include at least five of the following partners and services:
Head Start programs
Family Support Centers Early childhood programs associated with institutions of higher education
Family literacy programs
Local public libraries Community health programs
Regional child care resource centers
Health Families and/or other home visiting programs and family support programs
In 2013, twenty‐five Judy Centers and three satellites serving 39 elementary school districts served 12,727 children. The Maryland Department of Education estimates this is only 10% of the “high needs” child population aged birth through 5 years.
Kindergarten readiness data suggests that the Judy Centers have a positive impact on preparing children for kindergarten. In 2012, 85% of children with Judy Center experience entered kindergarten “fully ready” compared to 78% of children without Judy Cent er experience.
Source: Ma ryl a nd Sta te Depa rtment of Educa ti on, The Judi th P. Hoyer Ea rl y Ca re a nd Educa ti on Enha ncement
Progra m 2013 Annua l Report
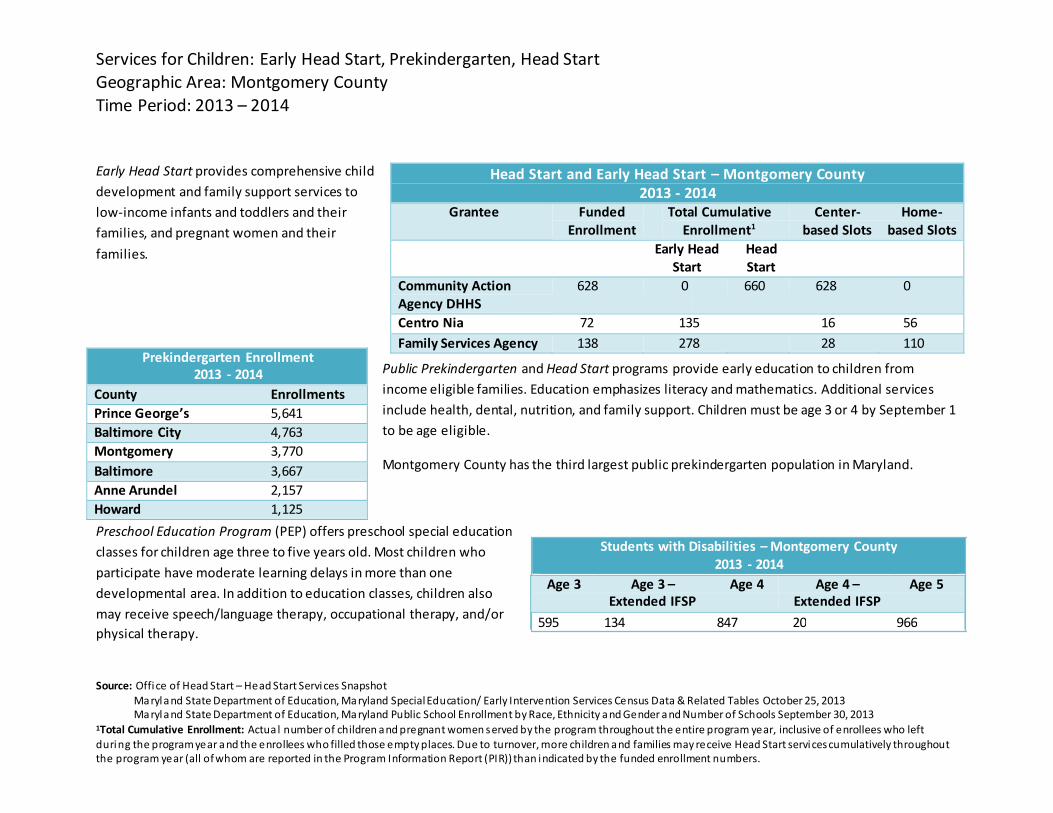
Services for Children: Early Head Start, Prekindergarten, Head Start Geographic Area: Montgomery County Time Period: 2013 – 2014
Prekindergarten Enrollment 2013 ‐ 2014
County Enrollments
Prince George’s 5,641
Baltimore City 4,763
Montgomery 3,770
Baltimore 3,667
Anne Arundel 2,157
Howard 1,125
Head Start and Early Head Start – Montgomery County 2013 ‐ 2014
Grantee Funded Enrollment
Total Cumulative Enrollment1
Center‐ based Slots
Home‐ based Slots
Early HeadStart
Head Start
Early Head Start provides comprehensive child
development and family support services to
low‐income infants and toddlers and their
families, and pregnant women and their
families. Community Action
Agency DHHS 628 0 660 628 0
Centro Nia 72 135 16 56
Family Services Agency 138 278 28 110 Public Prekindergarten and Head Start programs provide early education to children from
income eligible families. Education emphasizes literacy and mathematics. Additional services
include health, dental, nutrition, and family support. Children must be age 3 or 4 by September 1
to be age eligible.
Montgomery County has the third largest public prekindergarten population in Maryland.
Age 3 Age 3 – Age 4 Age 4 – Age 5 Extended IFSP Extended IFSP
595 134 847 20 966
Preschool Education Program (PEP) offers preschool special education
classes for children age three to five years old. Most children who
participate have moderate learning delays in more than one
developmental area. In addition to education classes, children also
may receive speech/language therapy, occupational therapy, and/or
physical therapy.
Students with Disabilities – Montgomery County
2013 ‐ 2014
Source: Offi ce of Head Start – He ad Start Servi ces Snapshot Ma ryl a nd State Department of Ed ucation, Ma ryland Special Ed u cation/ Early I nterve ntion Services Ce nsus Data & Related Tables October 25, 2013 Ma ryl a nd State Department of Ed ucation, Ma ryland Pu blic School En rollmen t b y Race, Ethnicity a nd Ge nder a nd Nu mber of Sch ools September 30, 2013
1Total Cumulative Enrollment: Actua l n umber of ch ildren a nd p re gnan t women s erved b y the p rogram throughout the e ntire p rogram ye ar, inclusive of e nrollees who left du ri n g the p rogram ye ar a nd the e nrollees wh o filled those e mp ty p laces. Du e to turnover, more ch ildren a nd families may re ceive Head Start servi ces cu mulatively throughou t the p rogram ye ar (all of wh om are rep orted in the Program I nformation Report ( PI R)) th an i ndicated b y the fu nded enrollment n u mb ers.
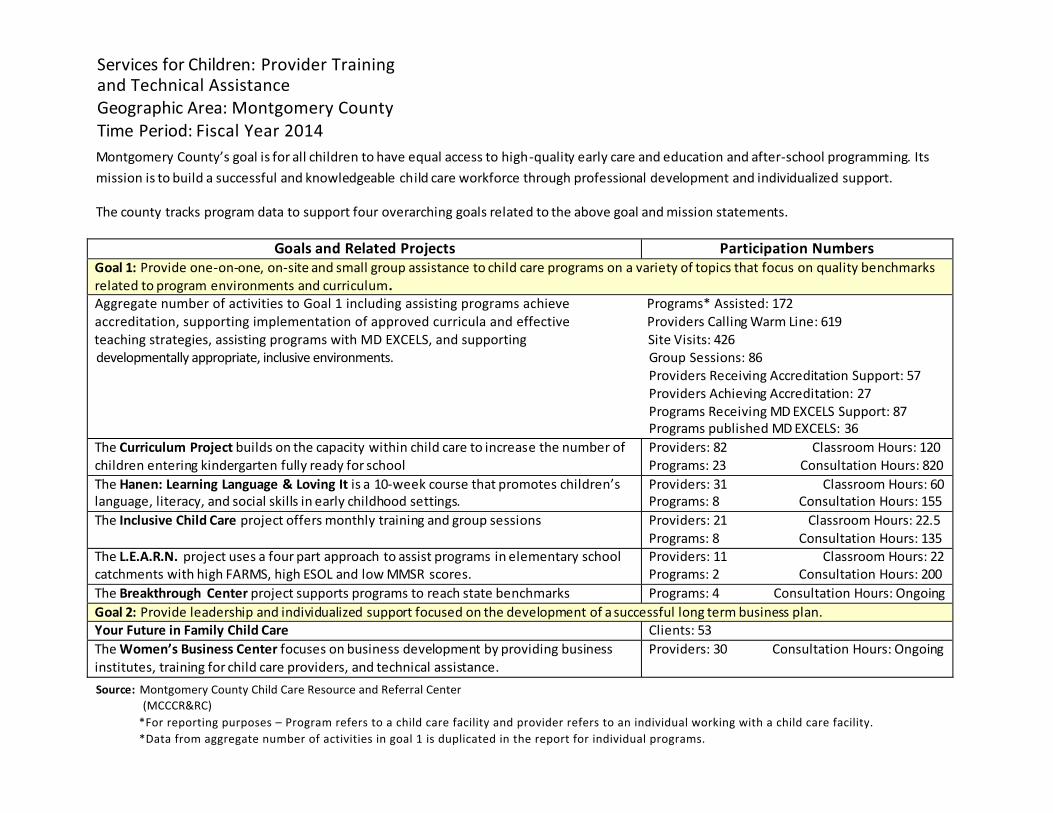
Services for Children: Provider Training and Technical Assistance Geographic Area: Montgomery County
Time Period: Fiscal Year 2014
Montgomery County’s goal is for all children to have equal access to high ‐quality early care and education and after‐school programming. Its
mission is to build a successful and knowledgeable ch ild care workforce through professional development and individualized support.
The county tracks program data to support four overarching goals related to the above goal and mission statements.
Goals and Related Projects Participation Numbers
Goal 1: Provide one‐on‐one, on‐site and small group assistance to child care programs on a variety of topics that focus on quality benchmarks related to program environments and curriculum. Aggregate number of activities to Goal 1 including assisting programs achieve Programs* Assisted: 172 accreditation, supporting implementation of approved curricula and effective Providers Calling Warm Line: 619 teaching strategies, assisting programs with MD EXCELS, and supporting Site Visits: 426 developmentally appropriate, inclusive environments. Group Sessions: 86
Providers Receiving Accreditation Support: 57 Providers Achieving Accreditation: 27 Programs Receiving MD EXCELS Support: 87 Programs published MD EXCELS: 36
The Curriculum Project builds on the capacity within child care to increase the number of children entering kindergarten fully ready for school
Providers: 82 Classroom Hours: 120 Programs: 23 Consultation Hours: 820
The Hanen: Learning Language & Loving It is a 10‐week course that promotes children’s language, literacy, and social skills in early childhood settings.
Providers: 31 Classroom Hours: 60Programs: 8 Consultation Hours: 155
The Inclusive Child Care project offers monthly training and group sessions Providers: 21 Classroom Hours: 22.5 Programs: 8 Consultation Hours: 135
The L.E.A.R.N. project uses a four part approach to assist programs in elementary school catchments with high FARMS, high ESOL and low MMSR scores.
Providers: 11 Classroom Hours: 22Programs: 2 Consultation Hours: 200
The Breakthrough Center project supports programs to reach state benchmarks Programs: 4 Consultation Hours: Ongoing
Goal 2: Provide leadership and individualized support focused on the development of a successful long term business plan. Your Future in Family Child Care Clients: 53 The Women’s Business Center focuses on business development by providing business institutes, training for child care providers, and technical assistance.
Providers: 30 Consultation Hours: Ongoing
Source: Montgomery County Child Care Resource and Referral Center
(MCCCR&RC)
*For reporting purposes – Program refers to a child care facility and provider refers to an individual working with a child care facility.
*Data from aggregate number of activities in goal 1 is duplicated in the report for individual programs.
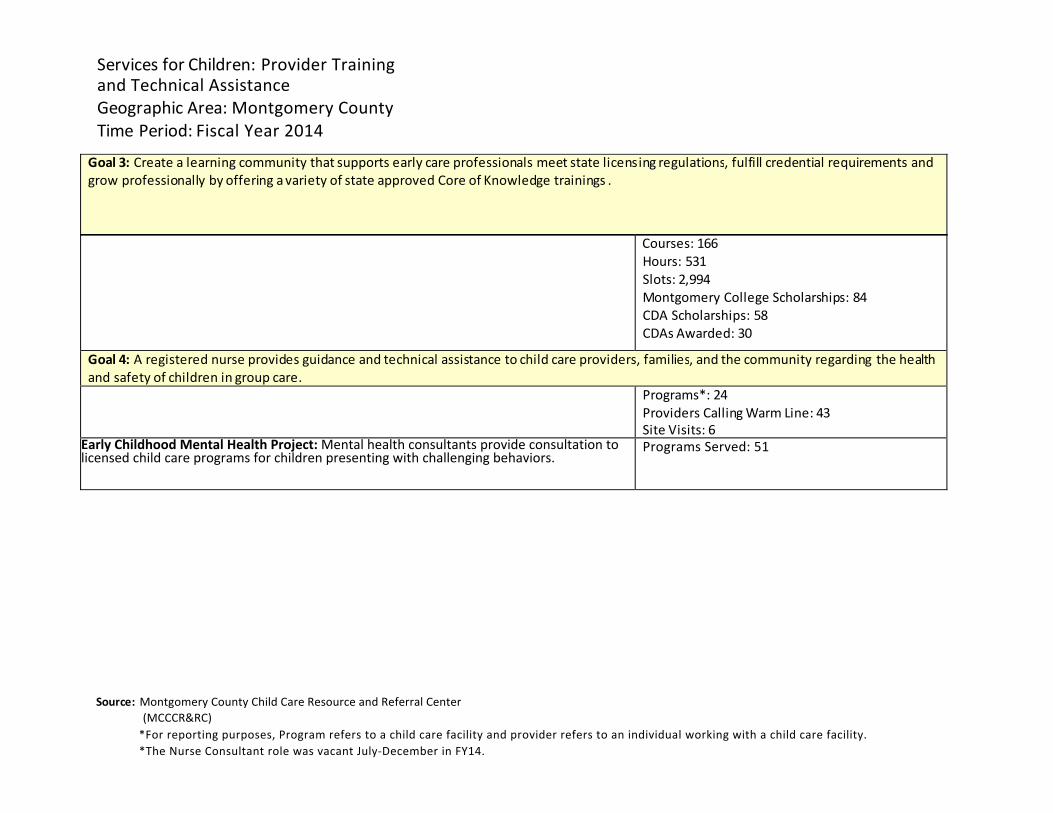
Services for Children: Provider Training and Technical Assistance Geographic Area: Montgomery County Time Period: Fiscal Year 2014
Goal 3: Create a learning community that supports early care professionals meet state licens ing regulations, fulfill credential requirements andgrow professionally by offering a variety of state approved Core of Knowledge trainings .
Courses: 166 Hours: 531 Slots: 2,994 Montgomery College Scholarships: 84 CDA Scholarships: 58 CDAs Awarded: 30
Goal 4: A registered nurse provides guidance and technical assistance to child care providers, families, and the community regarding the healthand safety of children in group care.
Programs*: 24Providers Calling Warm Line: 43 Site Visits: 6
Early Childhood Mental Health Project: Mental health consultants provide consultation to licensed child care programs for children presenting with challenging behaviors.
Programs Served: 51
*For reporting purposes, Program refers to a child care facility and provider refers to an individual working with a child care facility.
*The Nurse Consultant role was vacant July‐December in FY14.
Source: Montgomery County Child Care Resource and Referral Center
(MCCCR&RC)
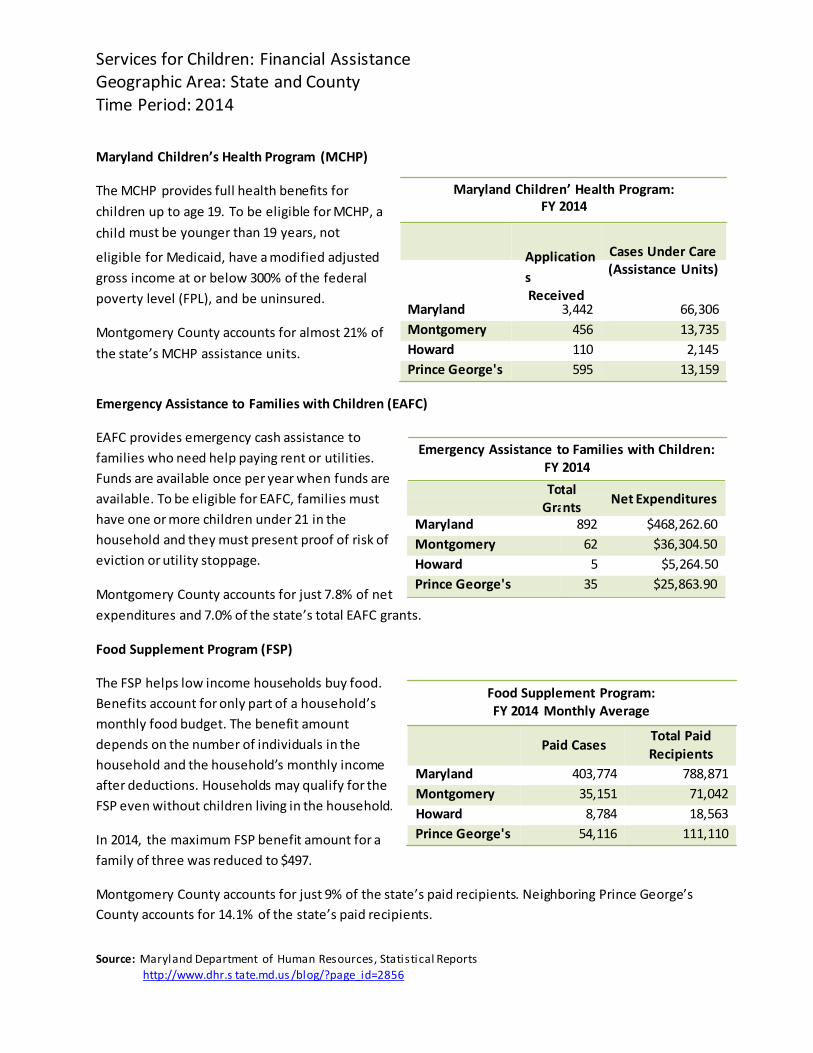
Services for Children: Financial AssistanceGeographic Area: State and County
Time Period: 2014
Maryland Children’s Health Program (MCHP) The MCHP provides full health benefits for
children up to age 19. To be eligible for MCHP, a
child must be younger than 19 years, not
Maryland Children’ Health Program: FY 2014
eligible for Medicaid, have a modified adjusted
gross income at or below 300% of the federal
poverty level (FPL), and be uninsured.
Application
s Received
Cases Under Care (Assistance Units)
Montgomery County accounts for almost 21% of
the state’s MCHP assistance units.
Maryland 3,442 66,306 Montgomery 456 13,735
Howard 110 2,145
Prince George's 595 13,159
Emergency Assistance to Families with Children (EAFC)
ToGra
tal
nts Net Expenditures
Maryland 892 $468,262.60
Montgomery 62 $36,304.50
Howard
EAFC provides emergency cash assistance to
families who need help paying rent or utilities.
Funds are available once per year when funds are
available. To be eligible for EAFC, families must
have one or more children under 21 in the
household and they must present proof of risk of
eviction or utility stoppage. 5 $5,264.50 Prince George's 35 $25,863.90 Montgomery County accounts for just 7.8% of net
Emergency Assistance to Families with Children: FY 2014
expenditures and 7.0% of the state’s total EAFC grants. Food Supplement Program (FSP) The FSP helps low income households buy food.
Benefits account for only part of a household’s
monthly food budget. The benefit amount
depends on the number of individuals in the
household and the household’s monthly income
after deductions. Households may qualify for the
FSP even without children living in the household.
In 2014, the maximum FSP benefit amount for a
family of three was reduced to $497.
Food Supplement Program: FY 2014 Monthly Average
Paid Cases Total Paid Recipients
Maryland 403,774 788,871
Montgomery 35,151 71,042
Howard 8,784 18,563
Prince George's 54,116 111,110
Montgomery County accounts for just 9% of the state’s paid recipients. Neighboring Prince George’s
County accounts for 14.1% of the state’s paid recipients. Source: Ma ryl a nd Depa rtment of Huma n Res ources , Sta ti s ti ca l Reports
http://www.dhr.s ta te.md.us /bl og/?pa ge_i d=2856
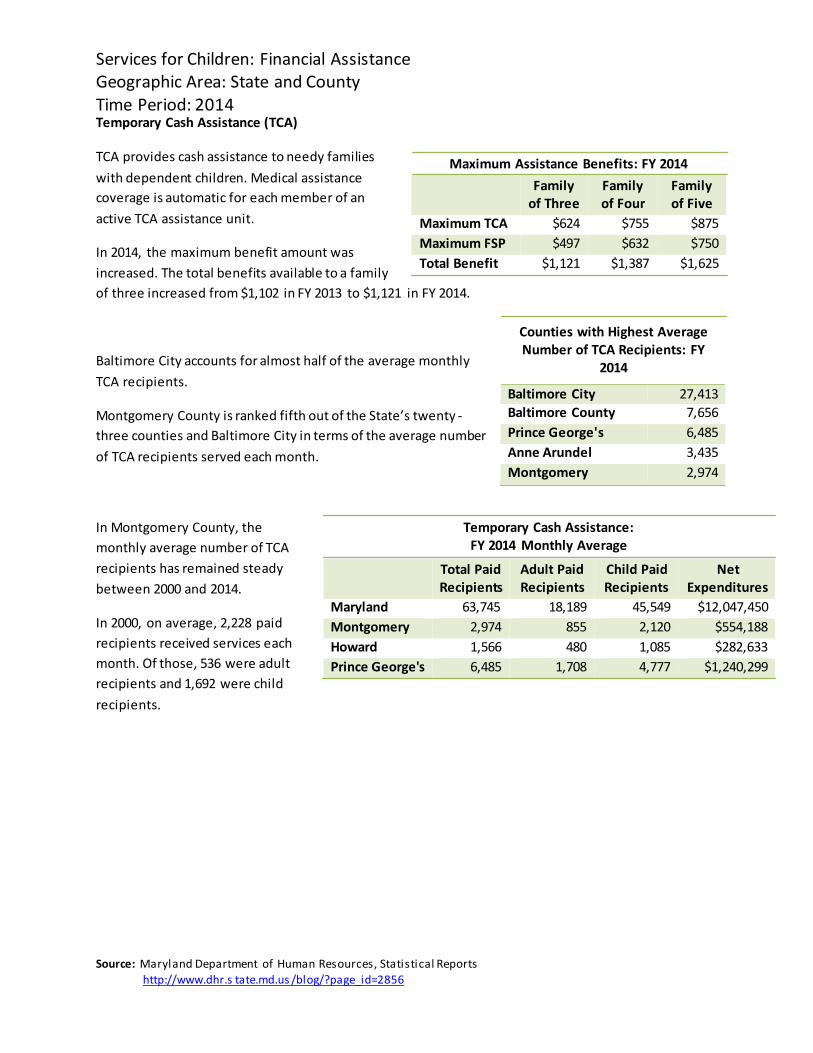
Services for Children: Financial AssistanceGeographic Area: State and County
Time Period: 2014 Temporary Cash Assistance (TCA) TCA provides cash assistance to needy families
Maximum Assistance Benefits: FY 2014 with dependent children. Medical assistance
coverage is automatic for each member of an Family of Three
Family of Four
Family of Five
active TCA assistance unit.
In 2014, the maximum benefit amount was
increased. The total benefits available to a family
Maximum TCA $624 $755 $875
Maximum FSP $497 $632 $750
Total Benefit $1,121 $1,387 $1,625
of three increased from $1,102 in FY 2013 to $1,121 in FY 2014.
Baltimore City accounts for almost half of the average monthly
TCA recipients. Baltimore City 27,413 Baltimore County 7,656
Prince George's 6,485
Anne Arundel
Montgomery County is ranked fifth out of the State’s twenty ‐
three counties and Baltimore City in terms of the average number 3,435of TCA recipients served each month.
Counties with Highest Average Number of TCA Recipients: FY
2014
Montgomery 2,974
In Montgomery County, the
monthly average number of TCA
Temporary Cash Assistance: FY 2014 Monthly Average
recipients has remained steady
between 2000 and 2014.
Total Paid Recipients
Adult Paid Recipients
Child Paid Recipients
Net Expenditures
In 2000, on average, 2,228 paid
recipients received services each
month. Of those, 536 were adult
recipients and 1,692 were child
recipients.
Maryland 63,745 18,189 45,549 $12,047,450
Montgomery 2,974 855 2,120 $554,188
Howard 1,566 480 1,085 $282,633
Prince George's 6,485 1,708 4,777 $1,240,299
Source: Ma ryl a nd Depa rtment of Huma n Res ources , Sta ti s ti ca l Reports
http://www.dhr.s ta te.md.us /bl og/?pa ge_i d=2856
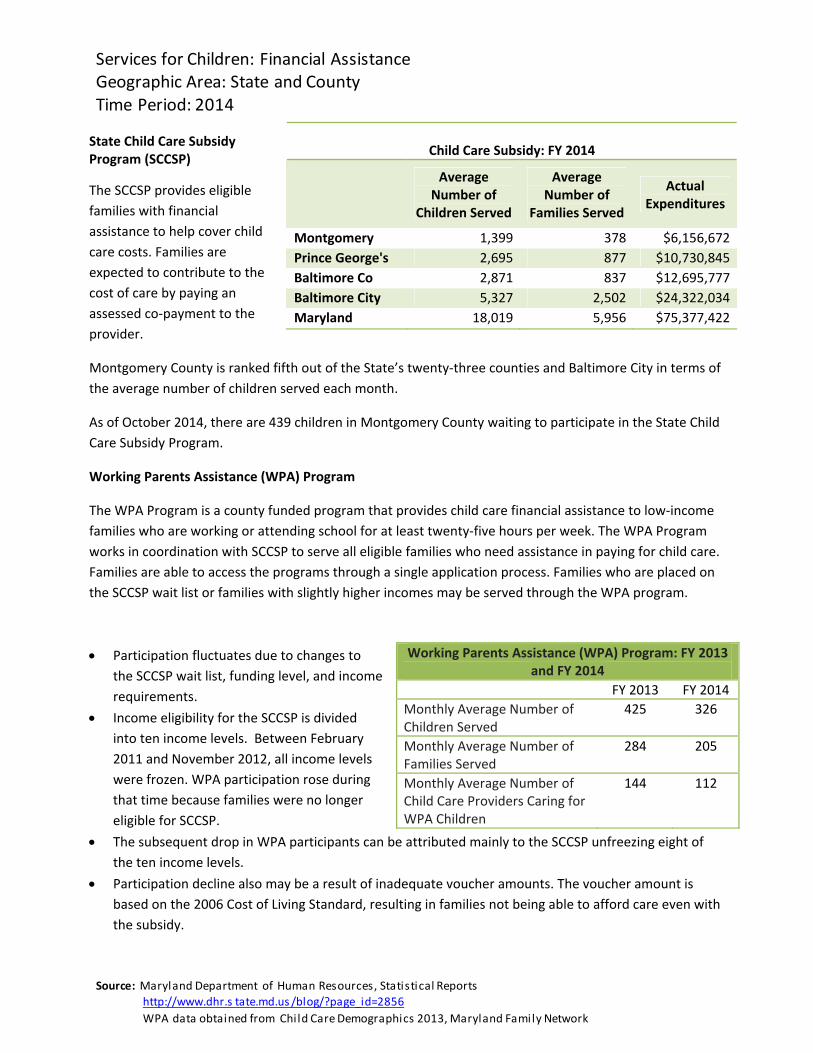
Services for Children: Financial AssistanceGeographic Area: State and County
Time Period: 2014
Child Care Subsidy: FY 2014
Average
Number of Children Served
Average Number of
Families Served
Actual Expenditures
Montgomery 1,399 378 $6,156,672
Prince George's 2,695 877 $10,730,845
Baltimore Co 2,871 837 $12,695,777
Baltimore City 5,327 2,502 $24,322,034
Maryland 18,019 5,956 $75,377,422
State Child Care Subsidy Program (SCCSP)
The SCCSP provides eligible
families with financial
assistance to help cover child
care costs. Families are
expected to contribute to the
cost of care by paying an
assessed co‐payment to the
provider.
Montgomery County is ranked fifth out of the State’s twenty‐three counties and Baltimore City in terms of
the average number of children served each month.
As of October 2014, there are 439 children in Montgomery County waiting to participate in the State Child
Care Subsidy Program.
Working Parents Assistance (WPA) Program
The WPA Program is a county funded program that provides child care financial assistance to low‐income
families who are working or attending school for at least twenty‐five hours per week. The WPA Program
works in coordination with SCCSP to serve all eligible families who need assistance in paying for child care.
Families are able to access the programs through a single application process. Families who are placed on
the SCCSP wait list or families with slightly higher incomes may be served through the WPA program.
Participation fluctuates due to changes to
the SCCSP wait list, funding level, and income
requirements.
Working Parents Assistance (WPA) Program: FY 2013 and FY 2014
FY 2013 FY 2014
Monthly Average Number of Children Served
425 326
Monthly Average Number of Families Served
284 205
Monthly Average Number of Child Care Providers Caring for WPA Children
144 112
Income eligibility for the SCCSP is divided
into ten income levels. Between February
2011 and November 2012, all income levels
were frozen. WPA participation rose during
that time because families were no longer
eligible for SCCSP.
The subsequent drop in WPA participants can be attributed mainly to the SCCSP unfreezing eight of
the ten income levels.
Participation decline also may be a result of inadequate voucher amounts. The voucher amount is
based on the 2006 Cost of Living Standard, resulting in families not being able to afford care even with
the subsidy.
Source: Ma ryl a nd Depa rtment of Huma n Res ources , Sta ti s ti ca l Reports
http://www.dhr.s ta te.md.us /bl og/?pa ge_i d=2856
WPA da ta obta i ned from Chi l d Ca re Demogra phi cs 2013, Ma ryl a nd Fa mi l y Network
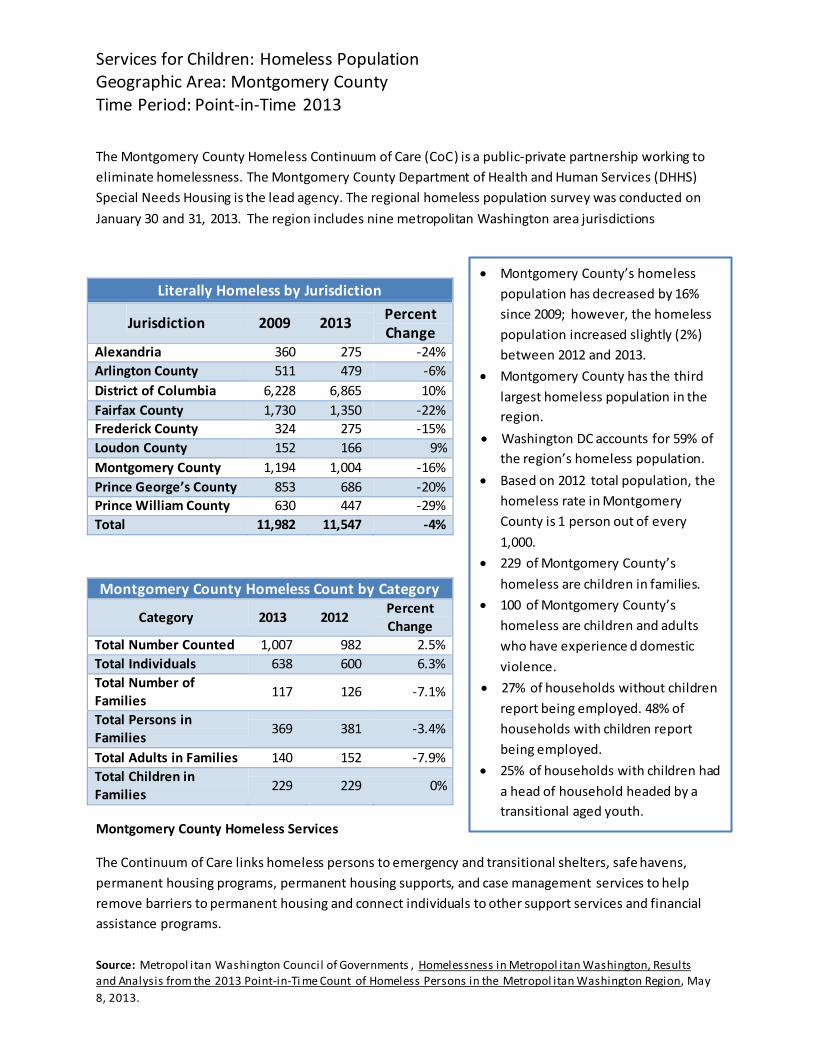
Services for Children: Homeless PopulationGeographic Area: Montgomery County
Time Period: Point‐in‐Time 2013
The Montgomery County Homeless Continuum of Care (CoC ) is a public‐private partnership working to
eliminate homelessness. The Montgomery County Department of Health and Human Services (DHHS)
Special Needs Housing is the lead agency. The regional homeless population survey was conducted on
January 30 and 31, 2013. The region includes nine metropolitan Washington area jurisdictions
Literally Homeless by Jurisdiction
Jurisdiction
2009
2013 Percent Change
Alexandria 360 275 ‐24%
Arlington County 511 479 ‐6%
District of Columbia 6,228 6,865 10%
Fairfax County 1,730 1,350 ‐22%
Frederick County 324 275 ‐15%
Loudon County 152 166 9%
Montgomery County 1,194 1,004 ‐16%
Prince George’s County 853 686 ‐20%
Prince William County 630 447 ‐29%
Total 11,982 11,547 ‐4%
Montgomery County Homeless Count by Category
Category
2013
2012 Percent Change
Total Number Counted 1,007 982 2.5%
Total Individuals 638 600 6.3%
Total Number of Families
117
126
‐7.1%
Total Persons in Families
369
381
‐3.4%
Total Adults in Families 140 152 ‐7.9%
Total Children in Families
229
229
0%
Montgomery County Homeless Services
Montgomery County’s homeless
population has decreased by 16%
since 2009; however, the homeless
population increased slightly (2%)
between 2012 and 2013.
Montgomery County has the third
largest homeless population in the
region.
Washington DC accounts for 59% of
the region’s homeless population.
Based on 2012 total population, the
homeless rate in Montgomery
County is 1 person out of every
1,000.
229 of Montgomery County’s
homeless are children in families.
100 of Montgomery County’s
homeless are children and adults
who have experience d domestic
violence.
27% of households without children
report being employed. 48% of
households with children report
being employed.
25% of households with children had
a head of household headed by a
transitional aged youth.
The Continuum of Care links homeless persons to emergency and transitional shelters, safe havens,
permanent housing programs, permanent housing supports, and case management services to help
remove barriers to permanent housing and connect individuals to other support services and financial
assistance programs.
Source: Metropol i ta n Wa s hi ngton Counci l of Governments , Homel es s nes s i n Metropol i ta n Wa s hi ngton, Res ul ts
a nd Ana l ys i s from the 2013 Poi nt‐in‐Ti me Count of Homel es s Pers ons i n the Metropol i ta n Wa s hi ngton Regi on, Ma y
8, 2013.
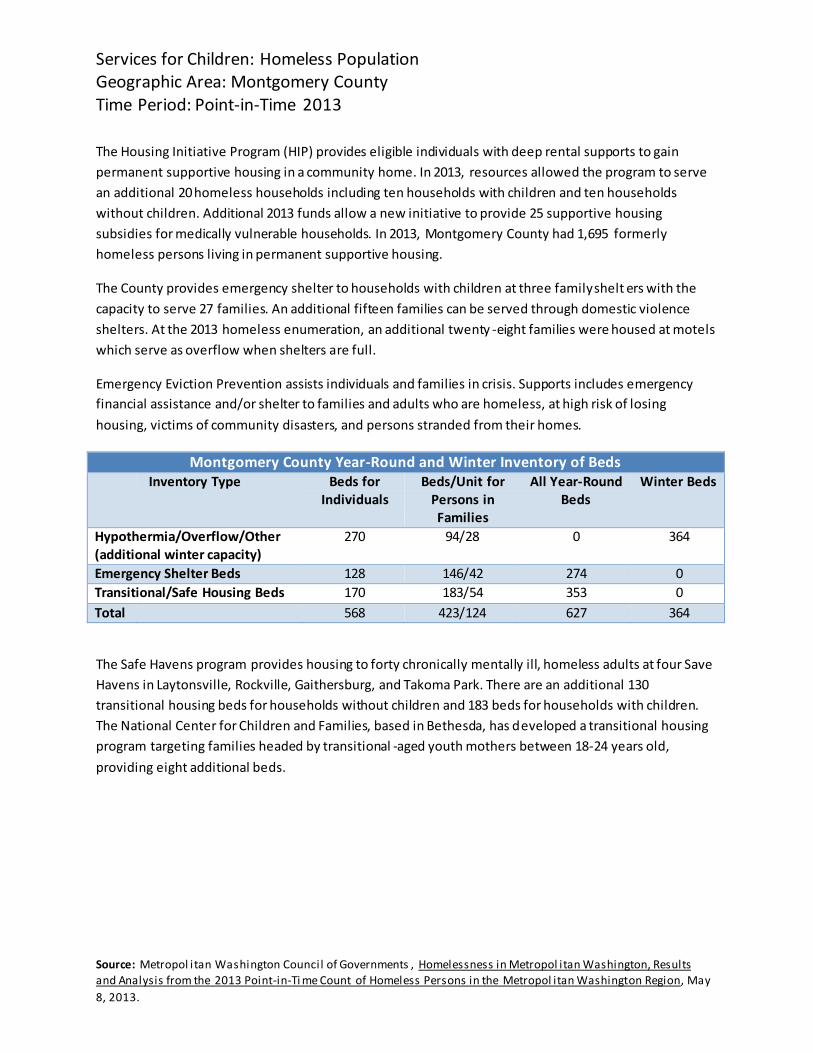
Services for Children: Homeless PopulationGeographic Area: Montgomery County
Time Period: Point‐in‐Time 2013
The Housing Initiative Program (HIP) provides eligible individuals with deep rental supports to gain
permanent supportive housing in a community home. In 2013, resources allowed the program to serve
an additional 20 homeless households including ten households with children and ten households
without children. Additional 2013 funds allow a new initiative to provide 25 supportive housing
subsidies for medically vulnerable households. In 2013, Montgomery County had 1,695 formerly
homeless persons living in permanent supportive housing. The County provides emergency shelter to households with children at three family shelt ers with the
capacity to serve 27 families. An additional fifteen families can be served through domestic violence
shelters. At the 2013 homeless enumeration, an additional twenty ‐eight families were housed at motels
which serve as overflow when shelters are full.
Emergency Eviction Prevention assists individuals and families in crisis. Supports includes emergency
financial assistance and/or shelter to families and adults who are homeless, at high risk of losing
housing, victims of community disasters, and persons stranded from their homes.
Montgomery County Year‐Round and Winter Inventory of Beds
Inventory Type Beds for Individuals
Beds/Unit for Persons in Families
All Year‐Round Beds
Winter Beds
Hypothermia/Overflow/Other (additional winter capacity)
270 94/28 0 364
Emergency Shelter Beds 128 146/42 274 0
Transitional/Safe Housing Beds 170 183/54 353 0
Total 568 423/124 627 364
The Safe Havens program provides housing to forty chronically mentally ill, homeless adults at four Save
Havens in Laytonsville, Rockville, Gaithersburg, and Takoma Park. There are an additional 130
transitional housing beds for households without children and 183 beds for households with children.
The National Center for Children and Families, based in Bethesda, has d eveloped a transitional housing
program targeting families headed by transitional ‐aged youth mothers between 18‐24 years old,
providing eight additional beds.
Source: Metropol i ta n Wa s hi ngton Counci l of Governments , Homel es s nes s i n Metropol i ta n Wa s hi ngton, Res ul ts
a nd Ana l ys i s from the 2013 Poi nt‐in‐Ti me Count of Homel es s Pers ons i n the Metropol i ta n Wa s hi ngton Regi on, Ma y
8, 2013.
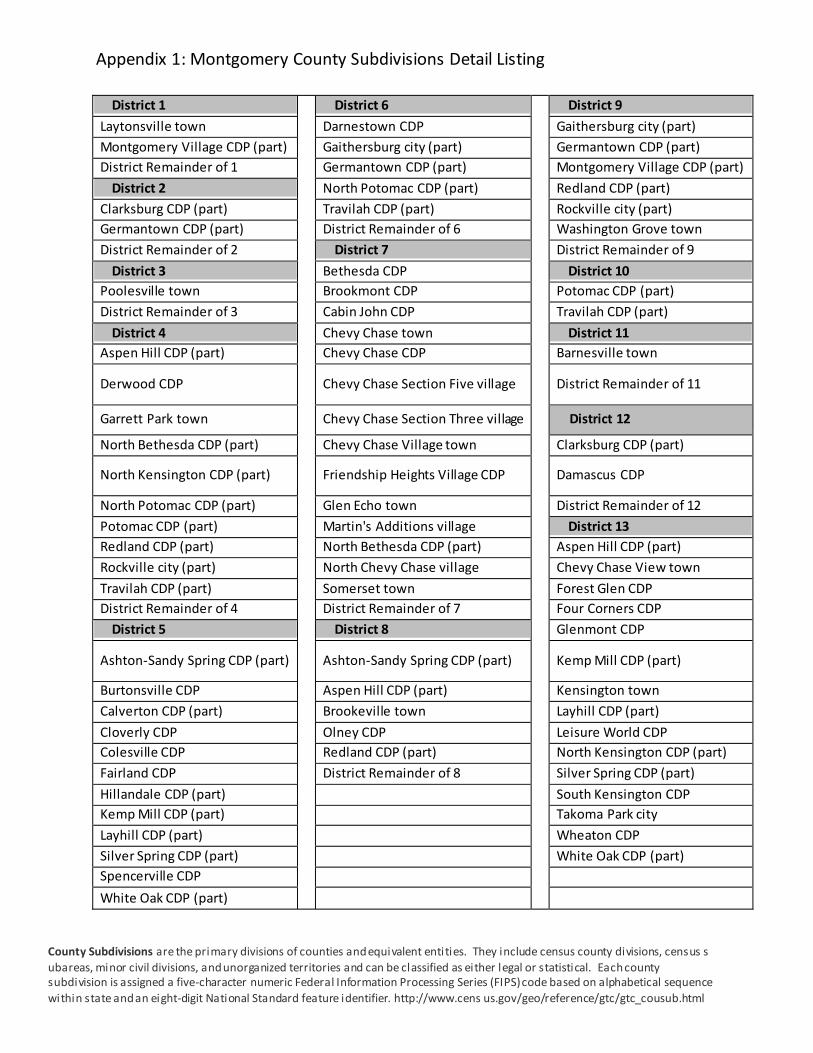
Appendix 1: Montgomery County Subdivisions Detail Listing
District 1 District 6 District 9
Laytonsville town Darnestown CDP Gaithersburg city (part)
Montgomery Village CDP (part) Gaithersburg city (part) Germantown CDP (part)
District Remainder of 1 Germantown CDP (part) Montgomery Village CDP (part)
District 2 North Potomac CDP (part) Redland CDP (part)
Clarksburg CDP (part) Travilah CDP (part) Rockville city (part)
Germantown CDP (part) District Remainder of 6 Washington Grove town
District Remainder of 2 District 7 District Remainder of 9
District 3 Bethesda CDP District 10
Poolesville town Brookmont CDP Potomac CDP (part)
District Remainder of 3 Cabin John CDP Travilah CDP (part)
District 4 Chevy Chase town District 11
Aspen Hill CDP (part) Chevy Chase CDP Barnesville town
Derwood CDP
Chevy Chase Section Five village
District Remainder of 11
Garrett Park town Chevy Chase Section Three village District 12
North Bethesda CDP (part) Chevy Chase Village town Clarksburg CDP (part)
North Kensington CDP (part)
Friendship Heights Village CDP
Damascus CDP
North Potomac CDP (part) Glen Echo town District Remainder of 12
Potomac CDP (part) Martin's Additions village District 13
Redland CDP (part) North Bethesda CDP (part) Aspen Hill CDP (part)
Rockville city (part) North Chevy Chase village Chevy Chase View town
Travilah CDP (part) Somerset town Forest Glen CDP
District Remainder of 4 District Remainder of 7 Four Corners CDP
District 5 District 8 Glenmont CDP
Ashton‐Sandy Spring CDP (part)
Ashton‐Sandy Spring CDP (part)
Kemp Mill CDP (part)
Burtonsville CDP Aspen Hill CDP (part) Kensington town
Calverton CDP (part) Brookeville town Layhill CDP (part)
Cloverly CDP Olney CDP Leisure World CDP
Colesville CDP Redland CDP (part) North Kensington CDP (part)
Fairland CDP District Remainder of 8 Silver Spring CDP (part)
Hillandale CDP (part) South Kensington CDP
Kemp Mill CDP (part) Takoma Park city
Layhill CDP (part) Wheaton CDP
Silver Spring CDP (part) White Oak CDP (part)
Spencerville CDP
White Oak CDP (part)
County Subdivisions a re the pri ma ry divisions of counties a nd equi valent enti ti es. They i nclude census county di visions, cens us s
uba reas, mi nor civil divisions, a nd unorga nized territories a nd can be cl assified as ei ther l egal or s tatisti cal. Ea ch county s ubdi vision is a ssigned a five‐character numeric Federa l Information Processing Series (FI PS) code ba sed on a lphabetical sequence wi thi n s ta te a nd a n ei ght‐digit Na ti onal Sta ndard fea ture i dentifier. http://www.cens us.gov/geo/reference/gtc/gtc_cousub.html
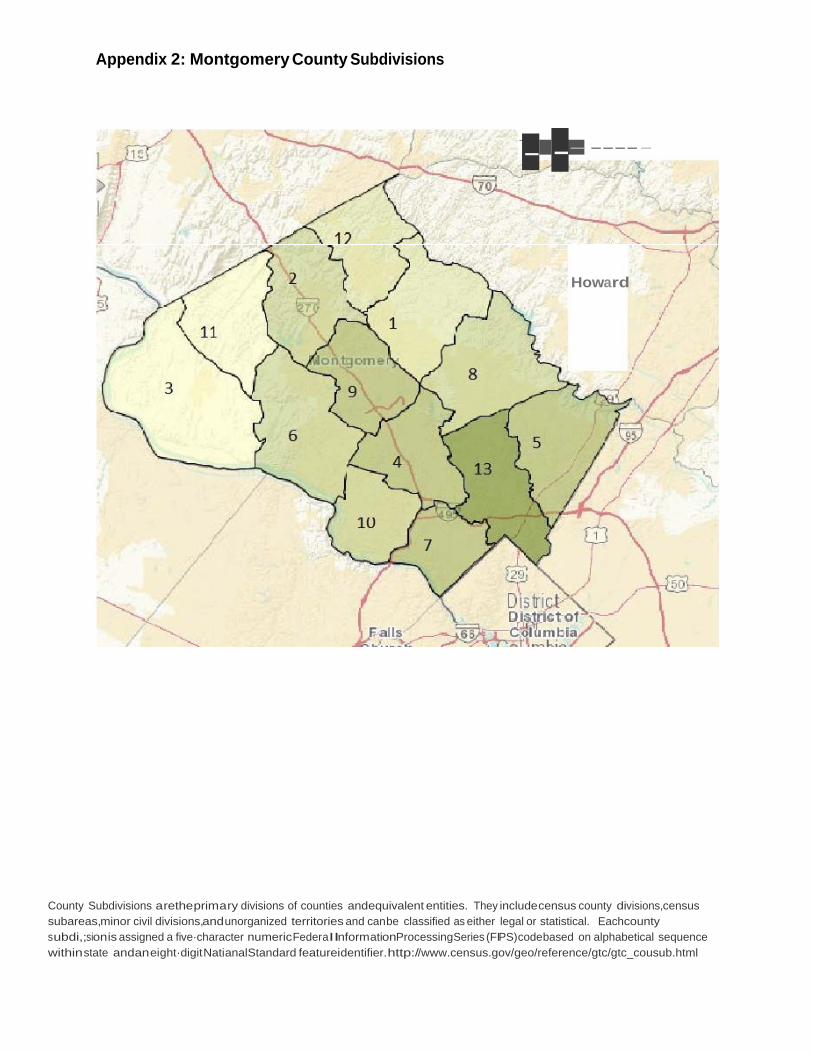
Appendix 2: Montgomery County Subdivisions
2 5D--
• ---- ---- -
--
Howard
County Subdivisions aretheprimary divisions of counties andequivalent entities. They includecensus county divisions,census subareas,minor civil divisions,and unorganized territories and canbe classified as either legal or statistical. Eachcounty subdi,;sionis assigned a five·character numericFederaIInformationProcessingSeries (FIPS)codebased on alphabetical sequence within state andan eight·digitNatianalStandard featureidentifier.http://www.census.gov/geo/reference/gtc/gtc_cousub.html
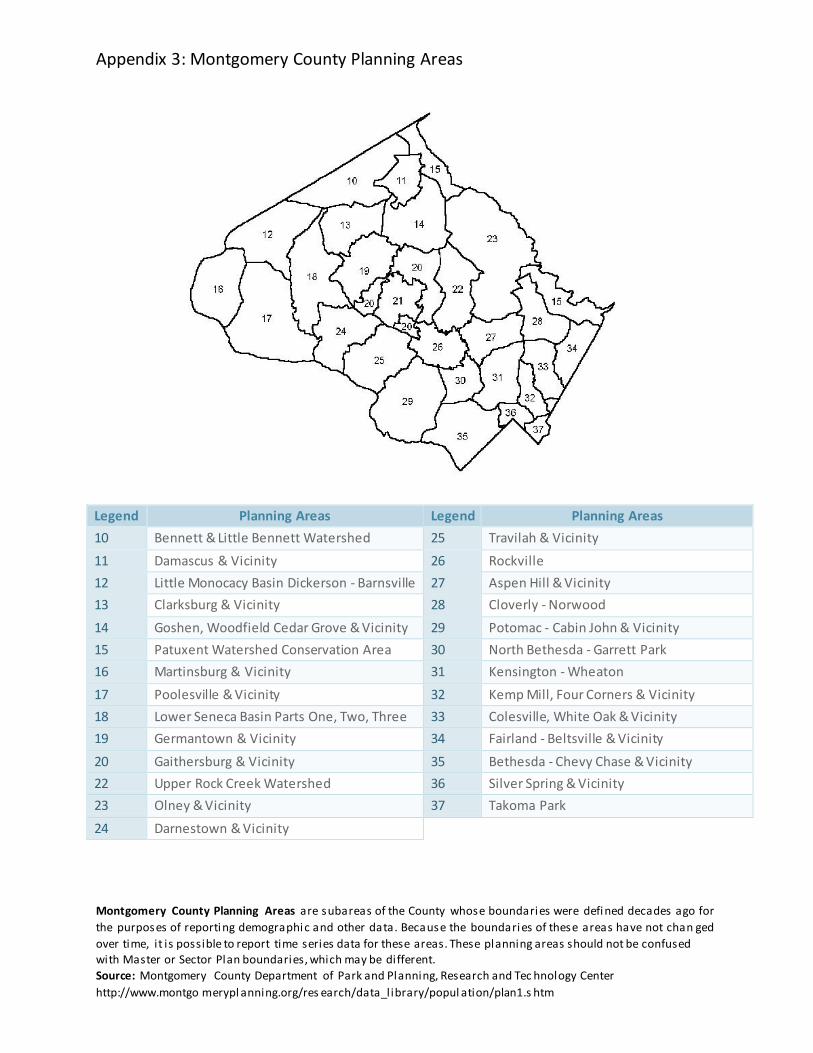
Appendix 3: Montgomery County Planning Areas
Legend Planning Areas Legend Planning Areas
10 Bennett & Little Bennett Watershed 25 Travilah & Vicinity
11 Damascus & Vicinity 26 Rockville
12 Little Monocacy Basin Dickerson ‐ Barnsville 27 Aspen Hill & Vicinity
13 Clarksburg & Vicinity 28 Cloverly ‐ Norwood
14 Goshen, Woodfield Cedar Grove & Vicinity 29 Potomac ‐ Cabin John & Vicinity
15 Patuxent Watershed Conservation Area 30 North Bethesda ‐ Garrett Park
16 Martinsburg & Vicinity 31 Kensington ‐ Wheaton
17 Poolesville & Vicinity 32 Kemp Mill, Four Corners & Vicinity
18 Lower Seneca Basin Parts One, Two, Three 33 Colesville, White Oak & Vicinity
19 Germantown & Vicinity 34 Fairland ‐ Beltsville & Vicinity
20 Gaithersburg & Vicinity 35 Bethesda ‐ Chevy Chase & Vicinity
22 Upper Rock Creek Watershed 36 Silver Spring & Vicinity
23 Olney & Vicinity 37 Takoma Park
24 Darnestown & Vicinity
Montgomery County Planning Areas a re s uba rea s of the County whos e bounda ri es were defi ned deca des a go for
the purpos es of reporti ng demogra phi c a nd other da ta . Beca us e the bounda ri es of thes e a rea s ha ve not cha n ged
over ti me, i t i s pos s i ble to report ti me s eri es da ta for thes e a rea s . Thes e pl a nni ng a rea s s hould not be confus ed wi th Ma s ter or Sector Pl a n bounda ri es , whi ch ma y be di fferent. Source: Montgomery County Depa rtment of Pa rk a nd Pl a nni ng, Res ea rch a nd Tec hnol ogy Center
http://www.montgo merypl a nni ng.org/res ea rch/da ta _l i bra ry/popul a ti on/plan1.s htm
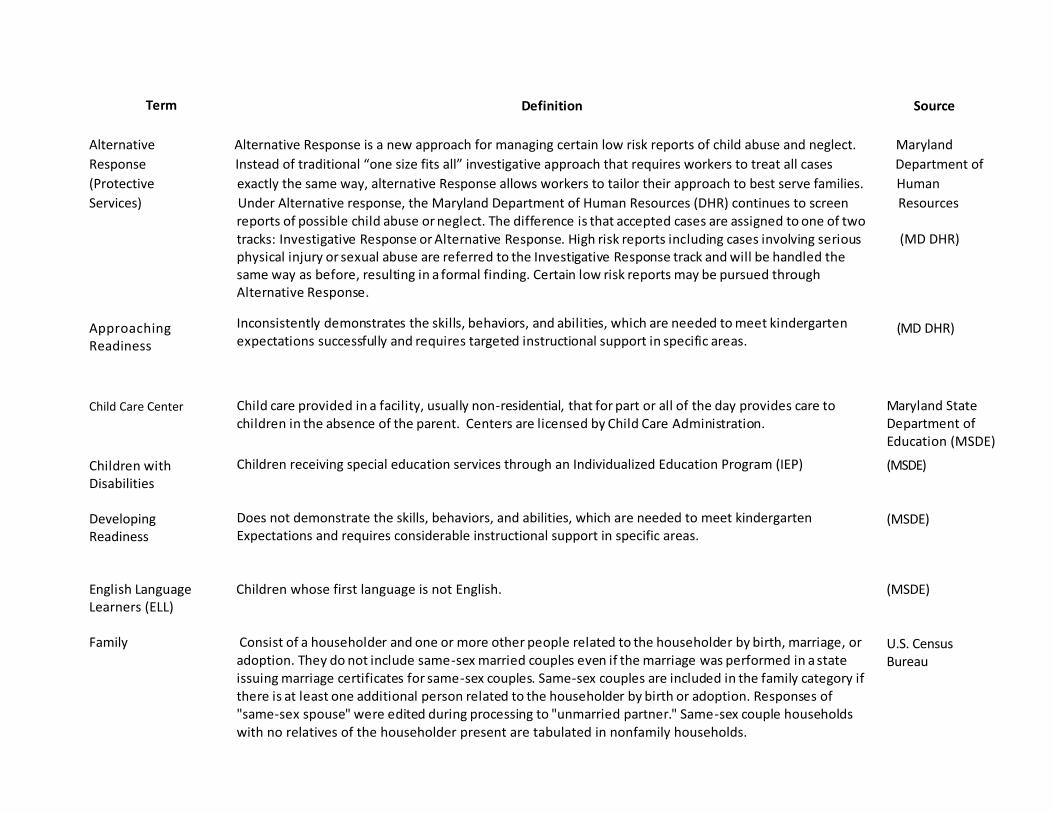
Term Definition Source
Alternative Alternative Response is a new approach for managing certain low risk reports of child abuse and neglect. Maryland
Response Instead of traditional “one size fits all” investigative approach that requires workers to treat all cases Department of
(Protective exactly the same way, alternative Response allows workers to tailor their approach to best serve families. Human
Services) Under Alternative response, the Maryland Department of Human Resources (DHR) continues to screen Resources reports of possible child abuse or neglect. The difference is that accepted cases are assigned to one of two
Approaching Readiness
Child Care Center Children with Disabilities Developing Readiness
tracks: Investigative Response or Alternative Response. High risk reports including cases involving serious physical injury or sexual abuse are referred to the Investigative Response track and will be handled the same way as before, resulting in a formal finding. Certain low risk reports may be pursued through Alternative Response. Inconsistently demonstrates the skills, behaviors, and abilities, which are needed to meet kindergarten expectations successfully and requires targeted instructional support in specific areas.
Child care provided in a facility, usually non‐residential, that for part or all of the day provides care to children in the absence of the parent. Centers are licensed by Child Care Administration.
Children receiving special education services through an Individualized Education Program (IEP) Does not demonstrate the skills, behaviors, and abilities, which are needed to meet kindergarten Expectations and requires considerable instructional support in specific areas.
(MD DHR) (MD DHR)
Maryland State Department of Education (MSDE)
(MSDE)
(MSDE)
English Language Children whose first language is not English. Learners (ELL) Family Consist of a householder and one or more other people related to the householder by birth, marriage, or
adoption. They do not include same ‐sex married couples even if the marriage was performed in a state issuing marriage certificates for same ‐sex couples. Same‐sex couples are included in the family category if there is at least one additional person related to the householder by birth or adoption. Responses of "same‐sex spouse" were edited during processing to "unmarried partner." Same ‐sex couple households with no relatives of the householder present are tabulated in nonfamily households.
(MSDE) U.S. Census Bureau
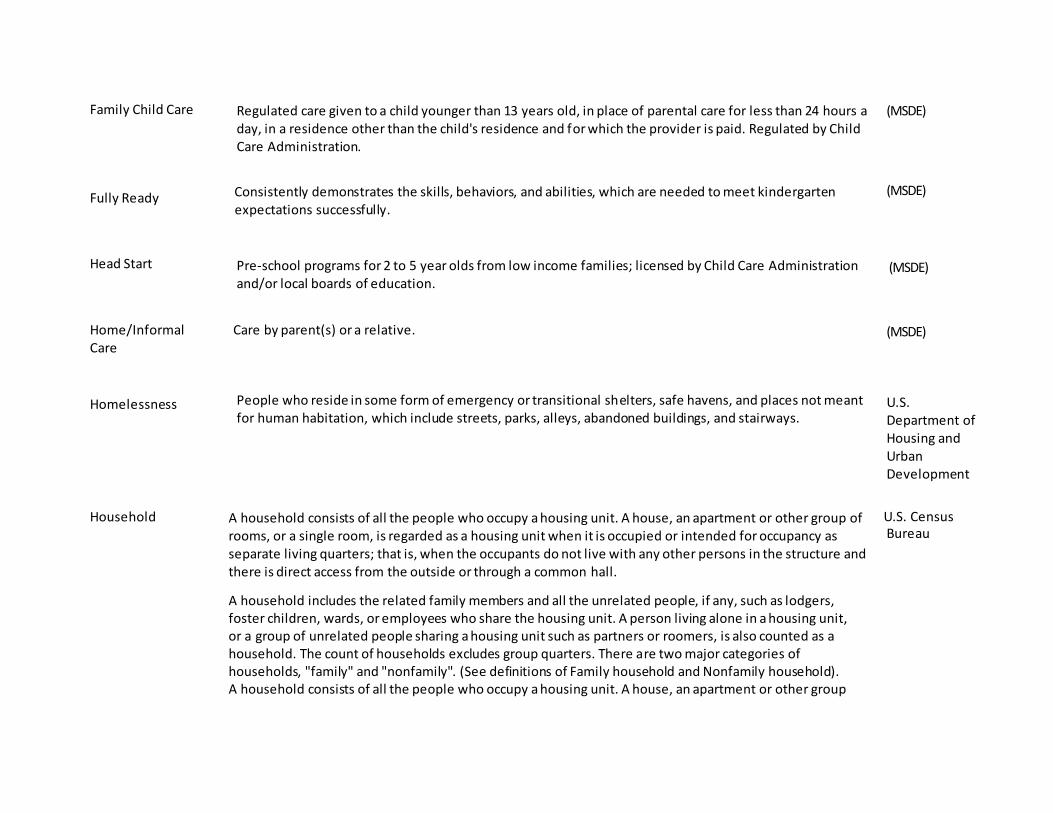
Family Child Care Regulated care given to a child younger than 13 years old, in place of parental care for less than 24 hours a
day, in a residence other than the child's residence and f or which the provider is paid. Regulated by Child Care Administration.
(MSDE)
Fully Ready
Consistently demonstrates the skills, behaviors, and abilities, which are needed to meet kindergarten expectations successfully.
(MSDE)
Head Start
Pre‐school programs for 2 to 5 year olds from low income families; licensed by Child Care Administration and/or local boards of education.
(MSDE)
Home/Informal Care
Care by parent(s) or a relative. (MSDE)
Homelessness
People who reside in some form of emergency or transitional sh elters, safe havens, and places not meant for human habitation, which include streets, parks, alleys, abandoned buildings, and stairways.
U.S. Department of Housing and Urban Development
Household A household consists of all the people who occupy a housing unit. A house, an apartment or other group of rooms, or a single room, is regarded as a housing unit when it is occupied or intended for occupancy as separate living quarters; that is, when the occupants do not live with any other persons in the structure and there is direct access from the outside or through a common hall.
U.S. Census Bureau
A household includes the related family members and all the unrelated people, if any, such as lodgers, foster children, wards, or employees who share the housing unit. A person living alone in a housing unit, or a group of unrelated people sharing a housing unit such as partners or roomers, is also counted as a household. The count of households excludes group quarters. There are two major categories of households, "family" and "nonfamily". (See definitions of Family household and Nonfamily household). A household consists of all the people who occupy a housing unit. A house, an apartment or other group
of rooms, or a single room, is regarded as a housing unit when it is occupied or intended for occupancy as
separate living quarters; that is, when the occupants do not live with any other persons in the structure and there is direct access from the outside or through a common hall. A household includes the related family members and all the unrelated people, if any, such as lodgers, foster children, wards, or employees who share the housing unit. A person living alone in a housing unit, or a group of unrelated people sharing a housing unit such as partners or roomers, is also counted as a household. The count of households excludes group quarters. There are two major categories of households, "family" and "nonfamily". (See definitions of Family household and Nonfamily household).
Household, family, or subfamily, Size of
The term "size of household" includes all the people occupying a housing unit. "Size of family" includes the family householder and all other people in the living quarters who are related to th e householder by birth, marriage, or adoption. "Size of related subfamily" includes the husband and wife or the lone parent and their never‐married sons and daughters under 18 years of age. "Size of unrelated subfamily" includes the reference person and al l other members related to the reference person. If a family has a related subfamily among its members, the size of the family includes the members of the related subfamily.
U.S. Census Bureau
Income‐to‐poverty ratios
Income‐to‐poverty ratios represent the ratio of family or unrelated individual income to their appropriate poverty threshold. Ratios below 1.00 indicate that the income for the respective family or unrelated individual is below the official definition of poverty, while a ratio of 1.00 or greater indicates income above the poverty level. A ratio of 1.25, for example, indicates that income was 125 percent above the appropriate poverty threshold.
U.S. Census Bureau
Indicated (Protective Services)
A finding there is credible evidence, which has not been satisfactorily refuted, that abuse or neglect occurred.
(MD DHR)
Infant
Means a child 6 weeks old or older but younger than 18 months old .
(MSDE)
Infant‐toddler
Means a child younger than 2 years old.
(MSDE)
Judy Centers State grant and locally funded early childhood and family learning centers which provide comprehensive early childhood services for children birth through age five. There are 25 Judy Centers throughout the state of Maryland.
(MSDE)
low birth rate
Low birth weight is when a baby is born weighing less than 5 pounds 8 ounces (2500 grams). University of
Maryland Prekindergarten
Bridge to Excellence in Public Schools Act requires local school systems to enroll all income eligible four‐ year‐old children whose parents or guardians seek to enroll them. The Pre ‐K program is a high‐quality, half‐day prekindergarten program. Students must be four years old by September 1, 2014 to be considered for enrollment. The curriculum supports early learning and school readiness and provides experiences that foster children's academic, social, emotional and physical development. Eligibility: First Priority: income eligible students, homele ss students, and students in foster care Second Priority: when space is available, second priority is given to students with other needs that may demonstrate a lack of school readiness including English Language Learners, health concerns, and learning
Maryland (UMD) (MSDE)
Non‐public Nursery School
Pre‐school programs with an educational focus for 3 & 4 year olds; approved or exempted by the Maryland State Department of Education, usually part‐day, nine months a year.
(MSDE)
PRAMS
Pregnancy Risk Assessment Monitoring System is a surveillance project of the Centers for Disease Control and Prevention (CDC) and state health departments. PRAMS collects state‐specific, population‐based data on maternal attitudes and experiences before, during, and shortly after pregnancy.
Centers for Disease Control
and Prevention Prekindergarten
Public school prekindergarten education for four‐year‐old children. Administered by local boards of education and regulated by the Maryland State Department of Education (MSDE).
(MSDE)
premature birth
Premature birth refers to a birth occurring before 37 weeks.
(UMD)
Preschooler
Means a child who is 2 years old or older and does not attend kindergarten or a higher grade .
(MSDE)
School age child
Means a child younger than 16 years old who attends a public or nonpublic school in grades kindergarten or above.
(MSDE)
Toddler
Means a child 18 months old or older but younger than 2 years old . (MSDE)
Unsubstantiated (Protective Services)
A finding that there is insufficient evidence to support a finding of indicated or ruled out .
(MD DHR)
very low birth rate
Infants weighing less than 3.3 pounds or 1,500 grams at birth.
(UMD)