monitoring working group - igig.up.wroc.pl · kriegel9, anna krypiak-gregorczyk10, tamara...
TRANSCRIPT

IAG C4 Positioning and Applications Symposium, September 5, 2016, Wroclaw, Poland
Alberto García-Rigo1, David Roma-Dollase1,2, Manuel Hernández-Pajares1, Zishen
Li3, Michael Terkildsen4, Reza Ghoddousi-Fard5, Denise Dettmering6, Eren
Erdogan6, Haris Haralambous7, Yannick Béniguel8, Jens Berdermann9, Martin
Kriegel9, Anna Krypiak-Gregorczyk10, Tamara Gulyaeva11, Attila Komjathy12,
Panagiotis Vergados12, Joachim Feltens13,19, René Zandbergen13, Tim Fuller-
Rowell14, David Altadill15, Nicolas Bergeot16, Andrzej Krankowski17, Loukis Agrotis18,
Ivan Galkin20, Raul Orus-Perez21
RTIM-WG: IAG’s Real Time Ionosphere
Monitoring Working Group Current status, outcomes and first results
IAG Commission 4 Positioning and Applications Symposium
September 5, 2016, Wroclaw, Poland

IAG C4 Positioning and Applications Symposium, September 5, 2016, Wroclaw, Poland
1. UPC-IonSAT research group, Technical University of Catalonia, Spain
2. Department of Engineering: Electronics, University of Barcelona (UB), Spain
3. Academy of Opto-Electronics, Chinese Academy of Sciences (CAS), China
4. Bureau of Meteorology, Space Weather Services, Australia
5. Canadian Geodetic Survey, Natural Resources Canada / Government of Canada (NRCan), Canada
6. Deutsches Geodätisches Forschungsinstitut der Technischen Universität München (DGFI-TUM), Germany
7. Frederick University Cyprus, Cyprus
8. IEEA, France
9. Institute of Communications and Navigation, DLR, Germany
10. Institute of Geodesy, UWM, Poland
11. Institute of Terrestrial Magnetism, ionosphere and Radio Wave Propagation, Russian Academy of
Sciences, Russia
12. NASA - Jet Propulsion Laboratory (JPL), California Institute of Technology, USA
13. Navigation Support Office, ESA-ESOC, Germany
14. NOAA affiliate, USA
15. Observatori de l’Ebre (OE), CSIC - Universitat Ramon Llull, 43520 Roquetes, Spain
16. Planetology and Reference Systems, Royal Observatory of Belgium (ROB), Belgium
17. Space Radio-Diagnostics Research Centre, UWM (SRRC/UWM), Poland
18. SYMBAN Limited, ESA-ESOC, Germany
19. Telespazio VEGA Deutschland GmbH c/o ESA-ESOC, Germany
20. University of Massachusetts Lowell, Space Science Lab, USA
21. Wave Interaction and Propagation Section (TEC-EEP), ESA-ESTEC, The Netherlands
Affiliations

IAG C4 Positioning and Applications Symposium, September 5, 2016, Wroclaw, Poland
Outline
1. 1. IAG’s RTIM-WG Introduction
2. 2. Main goals and outcomes / new potential
ideas
3. 3. On-going activities and first results
4. 4. Conclusions

IAG C4 Positioning and Applications Symposium, September 5, 2016, Wroclaw, Poland
IAG’s RTIM-WG - Introduction • The Real Time Ionosphere Monitoring is a new Working Group (RTIM-
WG) within the International Association of Geodesy (IAG) Subcomission
4.3 on Atmosphere Remote Sensing.
• The WG will run for the next four years (2016-2019).
• The current number of members is 25 from 21 international institutions,
including experts in the field from multiple countries world-wide:
Australia, Belgium, Canada, China, Cyprus, France, Germany, the
Netherlands, Poland, Russia, Spain, UK and USA
• The expertise of the participating research groups is complementary.
• There are real-time (RT) and near real-time (NRT) models, mainly based
on GNSS and ionosonde data (based on IGS Iono-WG Global
Ionospheric Maps, GIMs, or the International Reference Ionosphere, IRI).
• Possibility to derive global and regional maps on multiple ionospheric
parameters, including Total Electron Content (TEC), F2 layer critical
frequency (foF2), F2 layer peak (hmF2), bottomside thickness (B0) and
ionospheric disturbance W-index.

IAG C4 Positioning and Applications Symposium, September 5, 2016, Wroclaw, Poland
IAG’s RTIM-WG main goals and
outcomes (1) A summary of the current status of RT Ionosphere Monitoring
(2) Comparison of existing RT Ionosphere Monitoring approaches from
different perspectives for a specific period
(3) A procedure to automatically compare on a daily basis a subset of
real time ionosphere products providing the results in a common
compatible IONEX-like format (or a future IONEX version supporting it).
Potential validation with external data sources, such as dual-frequency
altimeters
(4) Open discussion (through a common mailing list) towards new
concepts on RT Ionosphere Monitoring.
IAG C4 Positioning and Applications Symposium, September 5, 2016, Wroclaw, Poland
IAG’s RTIM-WG new potential
ideas • Beyond the stated goals, new ideas for potential work have already
arisen after discussions within the team. Of particular interest are:
The improvement in the dissemination and format of GIMs in
order to properly support real time usage (expecting progress in
the time delay between their production and their online availability)
The team potential support on quality control and validation of
existing products/services (including the possibility to assess the
performance by means of standard and precise point positioning
techniques)
Find out ways to combine different regional/global products
(keeping in mind the importance on disturbed periods)
Drawing recommendations and arranging training and
dissemination activities for the community.

IAG C4 Positioning and Applications Symposium, September 5, 2016, Wroclaw, Poland
On-going activities: RT/NRT status
• A Google form has proven to be useful as a first step to summarize the
status of RT/NRT ionosphere monitoring activities within the group.
• Some RT/NRT ionospheric products within the group are shown at a
glance in the next slides (kindly provided by DGFI-TUM, Lowell, NRCan,
and ROB).

IAG C4 Positioning and Applications Symposium, September 5, 2016, Wroclaw, Poland
Figure 2 Left: Non-uniform adaptive B-spline
representation (NABS), right: uniform B-splines
representation (UBS). The colored dots show the
data locations (Ionospheric Pierce Points, IPPs);
the colors mean the VTEC magnitude (blue low, red
high), The red line is the Greenwich meridian
DGFI-TUM Ionosphere Model Globally distributed GNSS data from the IGS network are sequentially preprocessed in hourly
batches using the geometry free linear combination technique. These batches are used to
compute global VTEC maps in near-real time.
The spatial representation of VTEC is performed by a two-dimensional series expansion in
polynomial and trigonometric B-splines functions.
A Kalman filter is fed sequentially with the preprocessed observations to estimate the
unknown parameters of our VTEC model.

IAG C4 Positioning and Applications Symposium, September 5, 2016, Wroclaw, Poland
B0
foF2
hmF2
3D global bottomside ionosphere in real-time
Real-Time IRI forecast
Real-time
backcast PORT STANLEY
GIRO
Diurnal fit to GIRO data
4D data assimilation: 24-hour fit of differences between IRI and GIRO + diurnal trend analysis
x 52 GIRO stations
Port Stanley data courtesy Sarah James, RAL UK
Global Spatial fit Jones-Gallet Gk basis (76) = total map coefficients: 1064 [24-hour global weather of C]
NmF2, hmF2, B0 anchors
IRI p
rofi
le f
orm
alis
m
15 minute cadence
Low confidence autoscaling

IAG C4 Positioning and Applications Symposium, September 5, 2016, Wroclaw, Poland
Flow diagram of NRCan’s near-real-time global TEC map generation
For further details about other Natural Resources Canada (NRCan) GPS
ionospheric products see: Ghoddousi-Fard R. (2014) “GPS ionospheric mapping at Natural Resources Canada”. Poster
presentation given at IGS Workshop 2014, June 23-27, 2014, Pasadena, California, USA.

IAG C4 Positioning and Applications Symposium, September 5, 2016, Wroclaw, Poland
ROB-IONO software Input data: Real-time data from the EUREF Permanent Network (~120 stations,
Bruyninx et al. 2012)
ROB-TEC maps since 2012 (Bergeot et al. 2014):
vTEC maps over Europe +Variability
www.gnss.be
IONEX files
ftp://gnss.oma.be
Sampling rate: 15 min.
Grid extent: Long W15º / E25º
: Lat N35º / N62º
Grid resolution: 0.5º x 0.5º
Latency: ~3 minutes

IAG C4 Positioning and Applications Symposium, September 5, 2016, Wroclaw, Poland
UPC RT global VTEC maps
UPC-IonSAT TOMION: Computation of global
VTEC maps (UPC)
Fig. 1. Layout summarizing the global VTEC computation from ground GPS data by means of the UPC
TOMION software, including the main tomographic equation solved for (data: ionospheric combination of
carrier phases LI , and length intersection within each voxel, ∆li; unknowns: its ambiguity BI, the STEC, S,
which includes the mean electron density within each given voxel, Ne,i).
Ground GPS data
(~ 150 worldwide recs)
The TOmographic Model of the IONospheric electron content (TOMION) is fed
with global GPS NTRIP datastreams in order to compute in real time, among others,
UPC global VTEC maps.

IAG C4 Positioning and Applications Symposium, September 5, 2016, Wroclaw, Poland
Outline
1. 1. IAG’s RTIM-WG Introduction
2. 2. Main goals and outcomes / new potential
ideas
3. 3. On-going activities and first results
4. 4. Conclusions

IAG C4 Positioning and Applications Symposium, September 5, 2016, Wroclaw, Poland
On-going activities: St. Patrick
storm • Results on the RT/NRT products (plots and/or textual) for the days
surrounding St. Patrick storm (on day of year 76, 2015) are being
provided by the different members to get a global overview of the
impact on ionosphere from multiple perspectives. First inputs are
shown in the next slides (kindly provided by IEEA, IZMIRAN, Lowell,
NRCan and ROB).
Kp
Dst

IAG C4 Positioning and Applications Symposium, September 5, 2016, Wroclaw, Poland
St. Patrick storm: Scintillation
observations / doys 75-82 2015 (IEEA)
0
0.2
0.4
0.6
0.8
1
1.2
1.4
1.6
0 50 100 150 200 250
Dakar (Senegal) doys 75 - 82 / 2015
S4
GPS ToW (hours)
Scintillation map over Dakar S4 index Dakar

IAG C4 Positioning and Applications Symposium, September 5, 2016, Wroclaw, Poland
.
Fig. 8. Dynamics of the global maps of W-index in 1h resolution during the super-
storm on 18 March, 2016, derived from JPL GIM-TEC maps
http://www.izmiran.ru/services/iweather/; http://www.cbk.waw.pl/rwc/
[Gulyaeva et al. Ionosphere: Modelling the ionospheric weather for telecommunication and
navigation. In: Scientific cooperation between RAS and PAS in the field of Space Research:
Results of joint investigations . Moscow, IKI, RAS, 2016, in Russian and Polska (in press)]
St. Patrick storm: W-index global maps
(IZMIRAN)

IAG C4 Positioning and Applications Symposium, September 5, 2016, Wroclaw, Poland
St. Patrick storm: IRTAM + GIRO (Lowell)
Statistical products
Prediction :
Median of the VTEC
for the 15 previous
days.
March 17th 2015 event

IAG C4 Positioning and Applications Symposium, September 5, 2016, Wroclaw, Poland
Statistical products
Prediction :
Median of the VTEC
for the 15 previous
days.
March 17th 2015 event
St. Patrick storm: VTEC EU maps (ROB)

IAG C4 Positioning and Applications Symposium, September 5, 2016, Wroclaw, Poland
March 17, 2015 - Onset 05:00 UTC – Dst = -223 nT – Geom. Storm (Kp=7)
St. Patrick storm: VTEC EU maps (ROB)

IAG C4 Positioning and Applications Symposium, September 5, 2016, Wroclaw, Poland
St. Patrick storm: Ionosphere VTEC response
(DGFI- TUM) Global hourly mean VTEC variation during days between DOY 73 and DOY 78
European Region hourly mean VTEC variation during days between DOY 73 and DOY 78
At day 76, 2015, a peak of the mean VTEC variations at the European region
(lower image) as well as at the whole globe (upper image) are clearly shown.
At the following days (77 and 78), the mean VTEC variations decrease
dramatically and can be clearly seen in the global mean VTEC map.
DGFI-TUM
DOY 75
DOY 76
DOY 77
DOY 78
It should be noted that in a near real time run, some of the hourly GNSS stations cannot provide data on
time, but they are available with latency. The dataset used in the computations is downloaded in the
offline mode and, therefore, the computation includes some additional GNSS receivers.

IAG C4 Positioning and Applications Symposium, September 5, 2016, Wroclaw, Poland
St. Patrick storm: global maps of inter-
frequency phase rate variations (NRCan)
At the Canadian Geodetic Survey of Natural Resources Canada about 130-150 globally distributed 1-Hz GPS stations (mostly those of the RT-IGS network with additional stations over Canadian region) are used in near-real-time to derive, among other statistics and products inter-frequency phase rate variations by means of mapped-to-zenith standard deviation of delta phase rate (sDPR) over 30 sec.
Inter-frequency GPS phase rate variations from RT-IGS stations over stormy day of March 17, 2015 and rather quiet day of March 16 as monitored in near-real-time are studied. Global maps of GPS phase irregularities (sDPR) derived at each ionospheric pierce point are presented in a UT hour and geomagnetic latitude coordinate system for comparison against common geomagnetic indices. For further details see:
Ghoddousi-Fard et al. (2016). Geomagnetic storm of March 17, 2015: global RT-IGS GPS phase irregularities and effects in the Canadian auroral region. Oral presentation given at Beacon Satellite Symposium, Trieste, Italy, June 27 – July 1, 2016.
An study of GPS phase scintillation occurrence in the context of solar wind coupling to the magnetosphere-ionosphere system and auroral electrojet currents during March 17-18, 2015 has been submitted to JGR.

IAG C4 Positioning and Applications Symposium, September 5, 2016, Wroclaw, Poland
St. Patrick storm: Rate of TEC index (ROTI)
76
77
75
78 The results in this and next slides have been obtained in the frame of European Space Agency’s
MONITOR & MONITOR2 projects (ESA/ESTEC TEC-EEP).

IAG C4 Positioning and Applications Symposium, September 5, 2016, Wroclaw, Poland
St. Patrick storm: Single Receiver
Medium Scale TIDs index (SRMTID)
76
77
75
78

IAG C4 Positioning and Applications Symposium, September 5, 2016, Wroclaw, Poland
St. Patrick storm: GSFLAI EUV rate
proxy & SISTED solar flare detector (UPC)
Clear solar flare activity on doy
76 and previous days
These results have been obtained in the frame of European Space Agency’s MONITOR &
MONITOR2 projects (ESA/ESTEC TEC-EEP)

IAG C4 Positioning and Applications Symposium, September 5, 2016, Wroclaw, Poland
On-going activities: VTEC IONEXs
• RT/NRT Vertical TEC IONEX files have been solicited on the period 45
to 59, 2016. This shall be used as a first check/comparison of Vertical
TEC products in IONEX format from entities providing them within RTIM-
WG.
• The consistency and accuracy of the products can be analysed
against external assessment techniques (as it is done within IGS
Iono-WG): for both vertical geometries over the oceans/seas (vs
altimeter-VTEC) and for slant variation (GPS-dSTEC) over independent
GPS receivers.
• It is important that the accuracy should be assessed from independent
ionospheric measurements not taking part in the generation of any of the
products.

IAG C4 Positioning and Applications Symposium, September 5, 2016, Wroclaw, Poland
VTEC IONEXs: CAS/DGFI/URTG first comp.
Relative RMS error (%) for days of year 2016 from 45 to 59
• Comparison of six different VTEC products: three RT from CAS
(aoeg), CNES (cnsg) and UPC (urtg); one NRT from TUM (dgfi) and
two traditional GIMs for reference, from UPC (uqrg) and IGS (igs).
Europe Global
JASON altimeter assessment
For the details, please refer to D. Roma-Dollase, M. Hernández-Pajares, A. García-Rigo, D. Laurichesse, M.
Schmidt, E. Erdogan, Y. Yuan, Zishen Li, J.M. Gómez-Cama, A. Krankowski. “Real Time Global Ionospheric Maps:
a low latency alternative to traditional GIMs”, Poster at Beacon Sat. Symp. (BSS), June 2016, Trieste, Italy.

IAG C4 Positioning and Applications Symposium, September 5, 2016, Wroclaw, Poland
For the details, please refer to D. Roma-Dollase, M. Hernández-Pajares, A. García-Rigo, D. Laurichesse, M.
Schmidt, E. Erdogan, Y. Yuan, Zishen Li, J.M. Gómez-Cama, A. Krankowski. “Real Time Global Ionospheric Maps:
a low latency alternative to traditional GIMs”, Poster at Beacon Sat. Symp. (BSS), June 2016, Trieste, Italy.
VTEC IONEXs: CAS/DGFI/URTG first
comp
GIM RMS
[TECU] RMS max
[TECU] RMS min
[TECU] BIAS [TECU]
AOEG 11.8 22.6 4.8 -1.43
CNSG 9.2 18.8 3.0 0.21
URTG 8.2 14.9 3.4 0.30
DGFI 5.6 10.8 1.8 -0.57
IGSG 6.2 11.6 1.9 -1.01
UQRG 4.6 9.1 1.1 -0.61
From left to right: GIM, square root of the arithmetic mean of the RMS for all stations
and days; maximum and minimum RMS for all stations; bias for all stations and days.
dSTEC assessment

IAG C4 Positioning and Applications Symposium, September 5, 2016, Wroclaw, Poland
Conclusions
• First steps taken within the RTIM-WG are presented
towards the identified objectives.
• First inputs on St. Patrick storm are presented. Data
within the group will be analysed in more detail.
• A comparison of existing IONEX VTEC maps within
the group has also started.

IAG C4 Positioning and Applications Symposium, September 5, 2016, Wroclaw, Poland
Thank you very much

IAG C4 Positioning and Applications Symposium, September 5, 2016, Wroclaw, Poland
Thank you very much

IAG C4 Positioning and Applications Symposium, September 5, 2016, Wroclaw, Poland
Back-up slides

IAG C4 Positioning and Applications Symposium, September 5, 2016, Wroclaw, Poland
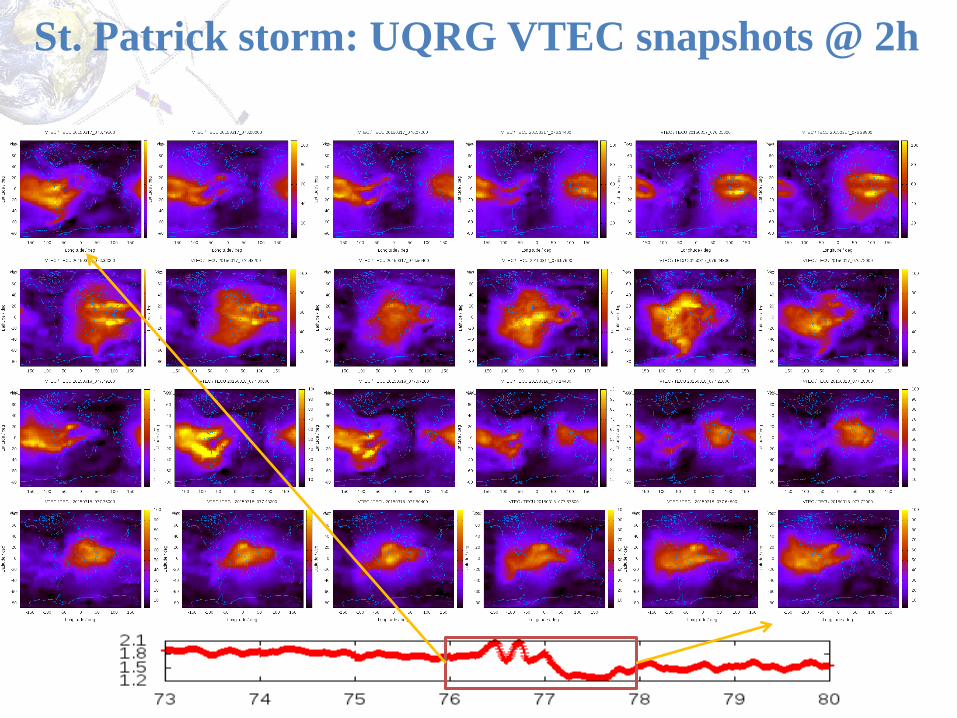
St. Patrick storm: Global Electron Content
(GEC from UQRG; 2-day latency)
• Clear impact on Global Electron Content trend (a positive phase,
followed by a negative phase) from UQRG rapid GIMs.
• This shall also be checked with URTG GIMs (UPC real time VTEC
global maps)
These results have been obtained in the frame of European Space Agency’s MONITOR &
MONITOR2 projects (ESA/ESTEC TEC-EEP)

IAG C4 Positioning and Applications Symposium, September 5, 2016, Wroclaw, Poland
St. Patrick storm: Global Electron Content
(GEC from UQRG; 2-day latency)
The detailed view shows two important
GEC increases (+20%), separated by 6
hours, followed by a deep negative phase
(almost -25%) ~18 hours later
IAG C4 Positioning and Applications Symposium, September 5, 2016, Wroclaw, Poland
St. Patrick storm: UQRG VTEC snapshots @ 2h

IAG C4 Positioning and Applications Symposium, September 5, 2016, Wroclaw, Poland
VTEC directly observed from dual-frequency
altimeters: a GNSS-independent ionospheric truth
Dual-frequency altimeter measurements provide an excellent and independent source for
assessing GNSS-based VTEC models in difficult conditions (over seas & far from rec.).
In spite of the noise of the altimeter measurements (reduced by an sliding window of ~16 sec.;
see right-hand figure, compared vs. final IGSG VTEC), the missing altimeter-topside electron
content (typically up to few TECUs only) and the well known altimeter bias excess (few TECUs
only), it still allows a very clear assessment and comparison of the errors of the different
ionospheric models (considering in particular the daily standard deviations of
VTEC_altimeter – VTEC_GIM), typically much larger and systematic
(see for instance Ho, C. M., Wilson, B. D., Mannucci, A. J., Lindqwister, U. J., & Yuan, D. N. (1997). A comparative study of
ionospheric total electron content measurements using global ionospheric maps of GPS, TOPEX radar, and the Bent model. Radio
Science, 32(4), 1499-1512.).

IAG C4 Positioning and Applications Symposium, September 5, 2016, Wroclaw, Poland
//)]()()()[(
)()(
max
max
IE
k
jI
k
jI
E
k
j
k
jO
LtLtL
tStSS
)(tS k
j
)( maxE
k
j tS
GNSS
sat. k
GNSS
rec. j
The GPS ionospheric carrier phase difference, ∆LI for a given pair rec.(j)-sat.(k),
(regarding to the value corresponding to the higher elevation –Emax- ray in the
phase-continuous arc of data), provides a very precise ionospheric truth of the
STEC referred to the value at maximum elevation, dSTEC, in space and time
(typically more accurate than 0.1 TECU).
It can be used to compare the performance of ionospheric models, which can
be interpreted as an assessment of the corresponding VTEC (V), the mapping
function being considered (M) and their time evolution.
Ionospheric Truth: STEC Variation, dSTEC
(see for instance Hernández-Pajares, M., Juan, J. M., Sanz, J., Orus, R., Garcia-Rigo, A.,
Feltens J., Komjathy, A., Schaer, S., & Krankowski, A. (2009). The IGS VTEC maps: a
reliable source of ionospheric information since 1998. Journal of Geodesy, 83(3-4), 263-275).

IAG C4 Positioning and Applications Symposium, September 5, 2016, Wroclaw, Poland
PROS and CONS
Technique PROS. CONS.
VTEC-altimeter Independent VTEC assessment (accuracy of few TECU)
Only over oceans and seas
dSTEC-GNSS Independent STEC assessment (precision ~ 0.05 TECU)
Close or over continents mainly
Complementary assessments