monitoring the effects of community based … nepal (a biological monitoring report for the bcn...
TRANSCRIPT

Monitoring the Effects of Community Based Conservation and
Commercial Utilization of Natural Products on Biodiversity in
Humla, Nepal
(A Biological Monitoring Report for the BCN Funded Project:
Community Based Ecosystem Management for Humla, Nepal
through Local Enterprise Development)
Asia Network for Small Scale Bioresources (ANSAB) P.O. BOX 11035, MIN BHAWAN
Kathmandu, Nepal PHONE/FAX: 977-1-487916
EMAIL : [email protected]
April 1999

CONTENTS
I. INTRODUCTION........................................................................................................................... 1
1. THE CONTEXT ............................................................................................................................. 1 2. BIOLOGICAL MONITORING AND THE PROJECT ACTIVITIES.................................................... 1 3. PURPOSE AND USES OF THE BIOLOGICAL MONITORING STUDIES .......................................... 2
II. METHODOLOGY ........................................................................................................................ 3
1. INTRODUCTION............................................................................................................................ 3 2. BIODIVERSITY INVENTORIES...................................................................................................... 3 A. SAMPLING................................................................................................................................. 3 B. OBSERVATIONS AND MEASUREMENTS..................................................................................... 5 a. For Jatamansi, Kutki, and Sunpati ......................................................................................... 5 b. For Juniper............................................................................................................................. 5 3. GROWTH AND YIELD STUDIES.................................................................................................... 6 A. AN EXPERIMENT ON JATAMANSI GROWTH CONDITIONS AND HARVESTING INTERVALS........ 6 B. A QUICK ASSESSMENT OF HARVEST INTERVALS..................................................................... 7 4. PARTICIPATORY RAPID APPRAISALS......................................................................................... 7 A. GROUP DISCUSSIONS ................................................................................................................ 8 B. KEY INFORMANT INTERVIEWS ................................................................................................. 8 C. PARTICIPATORY ASSESSMENT AND MAPPING OF RESOURCES................................................. 8 5. ANALYSIS ..................................................................................................................................... 8 6. THE MONITORING TEAM............................................................................................................ 9
III. THE PROJECT AREA AND ITS BIOLOGICAL SIGNIFICANCE ..................................... 9
1. THE HUMLA PROJECT AREA...................................................................................................... 9 2. BIOLOGICAL SIGNIFICANCE OF THE AREA ............................................................................. 12
IV. ECONOMIC USES OF BIOLOGICAL RESOURCES ......................................................... 13
V. ASSESSMENT OF THREATS TO BIODIVERSITY ............................................................. 16
1. INTERNAL AND EXTERNAL FACTORS AFFECTING BIODIVERSITY......................................... 16 2. MAJOR THREATS TO BIODIVERSITY – AS CHARACTERIZED AT THE START OF THE PROJECT
18
VI. INVENTORY OF FIVE COMMERCIALLY HARVESTED NTFPs .................................. 20
1. DISTRIBUTION AND HABITATS.................................................................................................. 20 2. CURRENT STOCKS OF NTFPS................................................................................................... 25 3. REGENERATION......................................................................................................................... 28
VII. GROWTH AND YIELD STUDIES RESULTS...................................................................... 29
VIII. HARVEST ASSESSMENTS................................................................................................... 31
1. ANNUAL HARVEST RATES......................................................................................................... 31 2. HARVEST IMPACTS.................................................................................................................... 32
IX. CONSERVATION IMPACTS .................................................................................................. 34 Biological Monitor ing Report o f Humla Project
i i i

1. AREA BROUGHT UNDER IMPROVED MANAGEMENT...............................................................35 2. THREAT REDUCTION .................................................................................................................36 3. DOCUMENTATION OF SUSTAINABLE HARVESTING PRACTICES .............................................38 4. ADOPTION OF CONSERVATION PRACTICES .............................................................................39
X. CONCLUSIONS ..........................................................................................................................40
XI. REFERENCES............................................................................................................................41
ANNEXES
Annex 1. Data Collection Instruments and Coding Manual
Annex 2. Selected Data Tables
Annex 3. List of Flora and Fauna of Humla
Annex 4. Profiles of the Selected Commercial Plant Species
Annex 5. Experiments on Jatamansi Growth Conditions and Harvesting Intervals
Annex 6. Biological Zone Descriptions for Humla
Biological Monitoring Report of Humla Project iv

Preface and Acknowledgement Monitoring the Effects of Community Based Conservation and Commercial Utilization of Natural Products on Biodiversity in Humla, Nepal is one of the two monitoring reports prepared for the Biodiversity Conservation Network funded project: Community Based Ecosystem Management for Humla, Nepal through Local Enterprise Development. This report primarily deals with the biological components and the other one is concerned with the socio-economic and institutional changes induced by the Project. Enterprise monitoring was also a regular activity for tracking the financial viability of the enterprise and its close links to social equity as well as biodiversity.
Monitoring was one of the important aspects of the Project for two reasons. First, this provided continuous feed back in tailoring and prioritizing the Project activities to achieve the Project goals and objectives. Second, it has generated the information for BCN to evaluate the enterprise approaches to community-based biodiversity conservation.
Although, it is still too early to come to any conclusions on environmental impacts, this report presents an approach and methods of biological monitoring that can be adopted for conservation and development projects in very remote areas like Humla. ANSAB intends to continue to refine these and other biological monitoring methods to make them more practical for use by community based organizations and projects working in the area of conservation and development.
I would like to thank the individuals and organizations who have contributed to my work on this report. For providing inputs and feedback during the preparation of the plan, I thank Hank Cauley, Nick Salafsky, Ganeshan Balachandar, and Seema Bhatt of BCN. Charles Peter of the New York Botanical Gardens also reviewed the plan and provided comments.
Individual consultants, ANSAB/HCDA staff, and community members did data collection at different periods of time. These individuals include: Netra Bhandari, Surya B. Binayee, Ram P. Acharya, Shiva Sharma, S.R. Baral, Khem Raj Bhattarai, Kuber J. Malla, M.H. Khan, Tanka Acharya, Narendra Rasialy, Nabin Acharya, Baburam Rijal, Rajendra KC, Saroj Shreshtha, Gobinda Khanal, Harendra Chand, Binod Gyanwali, Sushil Gyanwali, Dharmjit Budathoki, Prem Shahi, Tyare Rokaya, Prem Budha, Chatta Rawal, Karna Budha, and Devi Singh Rokaya. It would not have been possible to collect the data without the support of Chhakka B. Lama, Brikha B. Shahi, and Dala Rawal.
For reviewing and commenting on various drafts of this report, I thank the following: Ann Koontz of EnterpriseWorks Worldwide, Jack Croucher and Ganeshan Balachander of BCN. My sincere appreciation also goes to Jen Divis of EnterpriseWorks and Rupa Shrestha of ANSAB for proof reading and editorial support.
Last but not the least, the local FUG members, key informants, and other beneficiary farmers all enthusiastically cooperated in the participatory study of the Project, and provided the necessary information sought by the study team. All of them deserve my heart-felt appreciation. Bhishma P. Subedi
April 30, 1999
Biological Monitor ing Report o f Humla Project
v

Acronyms and Abbreviations
ANSAB Asia Network for Small Scale Bioresources
ATI Appropriate Technology International
BCN Biodiversity Conservation Network
BSP Biodiversity Support Program
CI Confidence Interval
cm Centimeter
DDC District Development Committee
DFO District Forest Officer
DOF Department of Forests
FECOFUN Federation of Community Forest User Groups, Nepal
Freq. Frequency
FUG Forest User Group
g gram
ha hectare
HCDA Humla Conservation and Development Association
HMG His Majesty's Government of Nepal
HOPL Humla Oil Private Limited
kg Kilogram
KLDP Karnali Local Development Program
m Meter
MAP Medicinal and Aromatic Plants
N/A Not Available or not applicable
NGO Non-Governmental Organisation
NRM Natural Resource Management
NTFP Non-Timber Forest Product
Rs Rupees, unit of Nepalese currency
USAID United States Agency for International Development
VDC Village Development Committee
Biological Monitoring Report of Humla Project v i

I. INTRODUCTION
1. The Context This report presents the outcome of the establishment of a biological monitoring system as well as the biological baseline and follow-up studies undertaken for the project "Community Based Ecosystem Management for Humla, Nepal through Local Enterprise Development" (Humla Project). Initiated in January 1995, this was a four-year project funded by the Biodiversity Conservation Network (BCN), a program developed by the Biodiversity Support Program (BSP). BSP is funded by US Agency for International Development and managed by a consortium of three environmental NGOs: World Wildlife Fund, The Nature Conservancy, and World Resources Institute. The Project was implemented by Appropriate Technology International (now called EnterpriseWorks Worldwide), Asia Network for Small Scale Bioresources (ANSAB), Humla Conservation and Development Association (HCDA), and the people of Humla.
This report captures the information collected during September - December 1995, September - October 1996, and June - July 1997. This document presents the preliminary outcomes of the biological monitoring studies carried out during the life of the Project.
2. Biological Monitoring and the Project Activities The biological monitoring activities were tied to the goals and objectives of the Project. The primary goals of the Humla Project were to 1) conserve the natural resource base and unique biodiversity of Humla District, 2) commercially use the local natural products in a sustainable manner, and 3) generate benefits that are long lasting and equitably shared by the community.
Towards achieving its goals the Project was implemented with a premise that "if a community is given control over its natural resources and receives sufficient benefits from an enterprise that depends on biodiversity, the community will choose to conserve the biodiversity of its habitat". With this assumption, the Project launched six main activities as a means of accomplishing the Project's primary goals. These were:
1. Support the sustainable commercial development of Non-Timber Forest Products (NTFPs) through the creation of a local processing company;
2. Help institutionalize local natural resource management and conservation practices under Nepal's community forestry policy, legislation, and procedures;
3. Develop the local capacity to harvest, process, and market NTFPs in a manner conducive to the conservation of biodiversity and the development of sustainable enterprises;
4. Generate management information through biological and socio-economic research and monitoring;
5. Implement an educational program on the importance, conservation, and uniqueness of the biodiversity of Humla district; and
6. Provide training and extension in support of the Project activities.
Bio log ica l Moni tor ing Repor t o f Humla Pro jec t 1

3. Purpose and Uses of the Biological Monitoring Studies The major focus of the biological monitoring was to look at how the Project activities are linked and contribute to the conservation of biodiversity for the Project area, and for Nepal in general. BCN has been using the information generated from both the biological and socio-economic monitoring in the evaluation of enterprise approaches to community-based biodiversity conservation.
The baseline information was useful to local planners and implementers for the design and implementation of future project activities. This information was also helpful to ensure that the Project activities (interventions) respond to the needs and desires of the intended project beneficiaries.
More importantly, the information has been used by local people in developing resource management strategies, plans, and activities that integrate conservation and sustainable use of natural resources into community forest management plans.
The biological monitoring plan employed both scientific and indigenous expertise and served the following specific objectives.
Specific Objectives
1. Assist local communities in determining sustainable harvest rates and practices for the economically valued species and forewarn collectors should a problem develop as a result of over harvesting;
2. Monitor the impact of commercial harvesting on specific plant species; and
3. Enhance the capability of community forest user groups (FUGs) to successfully manage forest and pasture areas, which have/will be handed over to them as community forests.
The specific biological monitoring activities undertaken were:
1. demarcate and calculate surface area of the Project area;
2. identify and describe the major habitats (ecosystems) present in the Project area;
3. determine and map out the habitat (resource base) for commercially harvested species;
4. quantify the current stock of the selected commercially harvested NTFPs: Jatamansi, Sunpati, Kutki, and Juniper in the Project area;
5. determine the factors affecting regeneration status of the commercially harvested species;
6. identify the best harvest interval under five years for various habitats of Jatamansi which will not only give an economic yield but also help to maintain a regeneration rate that is sustainable over a long period of time;
7. generate information on growth habit, morphology, growth duration, etc. of Jatamansi under varying conditions of environment and culture (such information will be invaluable in developing adaptive experiments under a wider range of conditions in the future);
8. observe current resource management practices in a socio-historical perspectives;
Biological Monitoring Report of Humla Project
2

9. estimate the annual harvest rate for and impact of harvesting commercial species from the Project area;
10. determine the effectiveness of conservation activities;
11. generate and disseminate information on the condition of the natural resources and sustainable management options for local planning activities; and
12. develop and establish biological monitoring system for FUGs.
II. METHODOLOGY
1. Introduction A variety of information sources and methods were used for the biological monitoring. The main methods used for the monitoring studies were: biodiversity inventories, growth and yield studies, participatory rapid appraisal (participatory resource assessment, participatory mapping, group discussions, key informant interviews, informal talks, participant observations), and a review of secondary sources of information. A brief description of these methods follows.
2. Biodiversity Inventories Biodiversity inventories were an important part of overall biological monitoring activities of the Humla Project. The inventories were done to document the biological resources (ecosystems, habitats, plant and animal species) of the Project area and more specifically to quantify the current stock of the selected commercially harvested NTFPs: Jatamansi, Sunpati, Kutki, and Juniper. Such inventories were done during the planning exercise in 1993 as well as during the implementation period (1995 - 1998) of the Project.
Close observations of the forest and pastureland and discussions with experienced collectors were an important part of the inventories. A sample survey and measurement of vegetation was undertaken to estimate the current stock of the selected NTFPs.
A. Sampling Given the objectives of the study and the resources available at our disposal, the sampling was done using the following principles:
• Determine confidence level, which is dependent on the magnitude of real difference between the parameters of estimates, sample size, and variance in the population;
• Characterize the population of the study to make strata;
• Stratify by independent variables: habitat types, elevation, and aspect.
Sampling was done separately for each species, since their habitats do not overlap completely. But the sampling methods were almost the same for all species as described below.
The overall sample for the inventory was based on a three-stage sampling procedure – 1) habitat specific sites, 2) strips of 50 m elevation interval, and 3) sample plots. Sample selection was stratified and balanced to make the overall sample proportionately
Bio log ica l Moni tor ing Repor t o f Humla Pro jec t 3

representative of the main parameters thought to influence the distribution and abundance of vegetation types.
Biological Monitoring Report of Humla Project
4

First Stage Sampling: Two to four sites for each of the four species (Jatamansi, Sunpati, Kutki, and Juniper) were selected to represent different habitat types. The sampling intensity was determined from a pre-sample and the variability in density. For the pre-sample, information obtained from collectors, our observations, and characteristics of the sites were used to identify the sites of different densities for sampling. This was further cross-checked with the biological survey results. Since the variability was reasonable (<5%) within each stratum, we relied on the initial sampling intensity.
Second Stage Sampling: Stratification for aspect and elevation range were used. For the two aspects (predominantly north and south) a line transact across the elevation gradient was taken from the bottom to the top of the habitat range of the selected species.
Third Stage Sampling: One to four sample plots were selected randomly at an interval of 50 meters across the elevation gradient. The number of plots to be sampled was determined by the area (to represent approximately 5-10% of the area) in a given elevation range. For example, in 50 m strip, at the bottom where the strip was very wide we took 4 plots and at the top where the strip was very narrow we took one plot.
B. Observations and Measurements Observations were made and measurements of specified variables were taken from each sample plot using the standard inventory form developed for this study. The Forest Plot Inventory Form and other data collection instruments used for this biological monitoring study are given in Annex 1.
a. For Jatamansi, Kutki, and Sunpati
Once the sampling location was set, square plots of three different sizes (1x1m, 2x2m, and 10x10m) were established for observation and measurement. A plot of 2x2m was used for recording the under-story vegetation, i.e. name of the species including indicator species, number, per cent ground cover, and weight of fresh harvestable material (see the Inventory Form). Harvestable materials of Jatamansi and Kutki are the rhizomes and roots, and for Sunpati, the leaves. A plot of 10x10m was used for recording tree and shrub information (see the Inventory Form). The regeneration status of trees and shrubs was recorded from a randomly selected 1x1m plot from within one of the corners of the large plot.
b. For Juniper
To estimate the total stock of Juniper trees, a plot of 10x10m was used and tree and shrub information was recorded (see the Inventory Form). The regeneration status of trees and shrubs was recorded from a randomly selected 1x1m plot from within one of the corners of the large plot.
To estimate the production of Juniper berries, a sub-sample of individuals of varying size from each habitat was used. Since the total production per tree is too much to count directly, the quantity of berries for the sampled tree was estimated allometrically (i.e. taking a sub-sample of branches).
Bio log ica l Moni tor ing Repor t o f Humla Pro jec t 5

3. Growth and Yield Studies The criteria for measuring growth depends on the product harvested. For Juniper (berries) and Sunpati (leaves), we wanted to know how much new resource was produced each season by individuals that had been harvested the previous season. For Jatamansi and Kutki (roots and rhizomes), we wanted to know how many new individuals of merchantable size enter the population each year.
Given the time, resources at hand, and remoteness of the area, the growth and yield data for Juniper, Kutki, Sunpati and other important plants utilized by community forest user groups were estimated from the information obtained from interviews with collectors and field observations and/or measurements.
For example, the Juniper data from the inventory provided distribution, quantity of growing stock, and regeneration status. Combining the yield data for different age classes with the data on growing stock provided a rough idea on yield per unit area. A determination of how much or what proportion of berries should be left to ensure regeneration will be a long-term study.
Since the enterprise primarily processes Jatamansi, an experiment has been established to investigate the effect various harvest intervals have on Jatamansi’s yield and overall biodiversity.
A. An Experiment on Jatamansi Growth Conditions and Harvesting Intervals
The experiment was designed from field visits, interviews with Jatamansi collectors, and data gathered from the inventories. Varying environments of growth and harvest practices have been considered. The experiment was initiated in the Spring of 1997. Collection of data will continue for at least 5 years.
The experiment aims to provide recommendations on optimum Jatamansi harvesting levels that maximize economic returns for the collectors while conserving biodiversity.
The specific objectives of the experiment are:
• To identify the best harvest interval for various habitats of Jatamansi which will not only give an economic yield but will also help maintain a regeneration rate that is sustainable.
• To generate information on growth habit, morphology, growth duration, etc. under varying conditions of environment and culture. Such information will be invaluable in developing adoptive experiments under a wider range of conditions in the future.
The table below summarizes the treatment combinations used in the experiment. The details on how this experiment has been designed and implemented, including methods followed in the selection of domains (or sites), selection of experimental treatments, determination of sample size, and design of experiment are found in Annex 5. Preliminary results of the growth and yield studies are found in section VII.
Biological Monitoring Report of Humla Project
6

Table 1. Treatment Combinations
Treatment No.
Habitat (Factor 1)
Harvest Interval (Factor 2)
1 2 3 4 5 6 7 8 9 10
Bushy cover Bushy cover Bushy cover Bushy cover Bushy cover Open ground Open ground Open ground Open ground Open ground
1 year 2 years 3 years 4 years 5 years 1 year 2 years 3 years 4 years 5 years
B. A Quick Assessment of Harvest Intervals Establishing a new experiment and getting results requires at least 5 years. Therefore, a complementary method that captures the past experiences and practices of local harvesters was developed.
Jatamansi harvesting was started in some sites of the Project before 1993. These sites were located and with the help of collectors and taking observations, plots within the experimental domains were located. The assumption was that we could find five discernible patches (say I to V) harvested in different years. Among them patch I, patch II, and patch III have already been harvested in 1993/94, 1994/95, and 1995/96 respectively (see Table 2).
Based on the information obtained from the inventory of different habitat types on variability in density, the sites were selected from the identified areas. In this case, we are assuming that the levels of effort put into harvesting are constant across the patches (i.e. S.E.< 5%). The same sample plots once harvested were not selected again. Results from this experiment are found in section VII.
Table 2. Number of Years of Rotational Length by Observation Years for Different Patches I – IV
Year I II III IV IV 1995/96 2 1 0 0 0 1996/97 3 2 1 0 0 1997/98 4 3 2 1 0 1998/99 5 4 3 2 1
4. Participatory Rapid Appraisals A number of participatory tools and techniques (group discussions, key informant interviews, participatory assessment and mapping of resources) were used to supplement the information needed for biological monitoring. These tools and techniques were an integral part of the
Bio log ica l Moni tor ing Repor t o f Humla Pro jec t 7

Project activities and used extensively in helping community forest user groups and other project partners in planning and implementing their activities.
A. Group Discussions Group discussions were conducted with members of individual FUGs and informal collector groups to find out their perceptions, knowledge, and skills on historical resource use patterns, harvesting methods, seasons of collection, regeneration, availability, abundance, local use, trade, and marketing of forest products.
B. Key Informant Interviews Different categories of key informants were interviewed using a checklist for collecting different types of information. These included members of the FUGs, Humla Conservation and Development Association (HCDA) staff, traders, women’s groups, and local leaders. General information on availability, collection systems, trade, other regulatory and environmental conditions were collected from local leaders, women, and the staff of HCDA. More specific information, such as management practices, local methods of collection, harvest rates, natural regeneration, trade, and regulatory environments, was collected from FUG members. Local traders were asked about their local practices and other trade related issues. Key informants also revealed information on drying, storage techniques, actual trade of the products, and rates of exploitation.
C. Participatory Assessment and Mapping of Resources Participatory natural resource maps for each of the forest user groups were prepared during the initial planning activities with community groups. Before preparing their management plan, the FUGs conducted a detailed assessment. These participatory exercises were useful in determining the existing growing stock, pattern of collection, rate of exploitation, and impact of forest products collection on their regeneration.
These exercises were also used to assess and rank the threats to biological diversity of the Project sites. Similar exercises were repeated to assess the reduction of those threats with the implementation of project activities. Results of these exercises are found in section V. Management options for sustainable use of the natural resources that would produce a regular income for the local community were also discussed. The indigenous knowledge was combined with information obtained from the biological inventories and knowledge of facilitating social foresters. Information obtained from the participatory methods was cross-checked with field observations made during the inventory work.
5. Analysis The data from the biological inventories from the different sites and strata were compiled into a database after being coded, and checked. Keeping the objectives of the study in mind, different types of qualitative and statistical analysis were conducted. For example, to look at the factors affecting the density, statistical tests were done first starting with the two way cross tabulation for each factor and then combining two or more factors together. Using the information from the inventories, a number of quantitative measures required for the management decision, such as the frequency of occurrence, mean biomass of the commercial product, and the total stock in the ecosystem, were calculated for the selected species.
Biological Monitoring Report of Humla Project
8

For growth and yield studies, analysis of variance (ANOVA) for yield of roots and other characters was carried out to see the main effects and interactions between various factors. Correlation between various characters has also been explored to aid interpretations. After the test of ANOVA, least square deviation (LSD) test was carried out at a 5% error level to find out the significant difference between the specific pair of means.
6. The Monitoring Team Bhishma Subedi from ANSAB held overall responsibility for the biological monitoring and inventories. He designed the study, provided training and guidelines to the data collection team, analyzed the data, and wrote this report. After designing the inventory, consultants from different professional backgrounds and the Department of Plant Resources were hired to work with selected HCDA staff and local people in the field. The consultants and field assistants were trained on sampling and data collection and were provided with guidelines, data collection formats, and practical exercises.
A number of teams were involved in the biological baseline data collection. After the collection of information from secondary sources, three teams were made, each consisting of a professional forester, a taxonomist, a forest ranger or HCDA field staff, and a local assistant. To take advantage of the vast local knowledge on identification and use of plants, two key informants were also included in the team. Since the Fall of 1997 Netra Bhandari, Surya B. Binayee, and Ram P. Acharya of ANSAB assisted in collecting the data through to the completion of the Project. The names of other individuals who contributed to the monitoring studies are given in the acknowledgement.
III. THE PROJECT AREA AND ITS BIOLOGICAL SIGNIFICANCE
1. The Humla Project Area Humla District is situated in the high Himalaya mountains of the northwest corner of Nepal. It is one of the most remote districts, with the nearest Nepali road-head in the Terai, a two-week journey by foot from Simikot (see Map 1). There is air service between Nepalganj and Simikot, connecting Humla to the rest of the world. Humla is one of the five districts of the Karnali Zone and falls within the mid-western development region of the country. The district’s elevation ranges from 1,524m to 7,337m. Total area of the district is 5,655 sq. km. The highest proportion (24.2%) of the district’s land is under grazing, approximately 12.8% under forest, 1.6% under cultivation, and 61.4% under other categories (remain covered with snow, bare rocky areas, river system etc.) (Sharma & Subedi 1994).
The total area of the Project is approximately 860 sq. km. The latitude and longitude of the Project area ranges from 290 43’ 23” North to 300 5’ 12” North and from 810 44’ 46” East to 820 13’ 27” East respectively. The elevation of the Project area ranges from 1800m on the Karnali river basin to an elevation of 6500m.
The major parts of the Project area lie above the temperate climatic zone (2100m). The area is characterized by a semi-arid climate. The humidity of the area in the winter falls below 20%. The area receives an average annual precipitation of 1000 – 1500 mm, with a high rainfall in the month of July to August and snowfall in January to February. Most of the area remains covered with snow for about four months and the area above the elevation of 3000 m remains covered with snow for more than six months of the year.
Bio log ica l Moni tor ing Repor t o f Humla Pro jec t 9

Temperature of the area is affected by altitude. The highest mean monthly temperature generally occurs in April or May before the monsoon breaks and mean monthly temperature decreases to its lowest during the month of January or February. The northwest monsoon (winter monsoon) from the Mediterranean Sea brings more precipitation in this area in comparison to the eastern parts of the country in the winter.
There is some microclimatic variation primarily due to aspect. The northern aspect is more moist and vegetated than that of southern one and receives more snowfall in winter. Thus, the southern facing sides are comparatively warm, dry, and less vegetated. The Project area covers eight Village Development Committees1 (Bargaon, Chhipra, Kharpunath, Lali, Raya, Ripa, Rodikot and Thehe) in the Chuwa and Humla Karnali River watersheds and is comprised of 9,722 people in 1,745 households, according to the 1991 census.
Humla scores the lowest Human Development Index (HDI) of all 75 districts in Nepal, according to the recent UNDP report on Nepal’s Human Index Development. The district suffers from its remoteness and ruggedness coupled with the perennial food security and hunger related problems.
The major source of income in the area is agricultural and livestock production followed by NTFP collection and trading. NTFPs are one of the major sources of cash earning. In the Project area the highest proportion of livestock is sheep, followed by cattle, goat, buffalo, and fowls. The products they produce are wool, milk, meat, ghee, cheese, yogurt, and eggs. Livestock such as goat, sheep, mule, horse, yak, and cross-bred yak (Juma) are used for the transportation of goods.
In summary, the population of the Project area lives in poor economic conditions, has a low literacy rate, lacks basic infrastructure, and suffers from low agricultural productivity.
Biological Monitoring Report of Humla 10
1The smallest politico-administrative unit in Nepal.
Project

Map 1. Location Map of the Project
Bio log ica l Moni tor ing Repor t o f Humla Pro jec t 11

2. Biological Significance of the Area Land Use Pattern, Major Habitats, and Vegetation Types
There are approximately 86,000 hectares in the Project area. Forestland accounts for about 29% of the area (compared to 12.8% forest cover for the entire Humla District). High altitude grassland and scrubland combined make up about 30% of the area, settlements and farmland are negligible at 4.3%, with the balance of land classified under “other” categories (remain covered with snow, bare rocky areas, river system etc.) (see Map 2 and Figure 1).
Figure. 1Land Use Types of the Humla Project Area, 1997
6.7%
29.3%
0.16%
4.3%
29.53%
0.33%
29.6%
0
5000
10000
15000
20000
25000
30000
Forest Shrubland Grassland Agriculturalland
Burned area Rock Snow Covered
Land Use Categories
Are
a (h
acta
re)
Within its elevation range of 1800m to 6500m there are limited subtropical valleys in the southern margin; most of the area is ecologically temperate or highland. A cold, generally dry climate exists in the high alpine valleys just north of the southern arm of the Himalaya that cuts across the bottom of Humla. The region lies within the transition zone dividing the Western Himalaya (Holarctic biogeographic zone) from the Eastern Himalaya (Oriental biogeographic zone).
This location (distance from markets, inaccessibility, and the unusual confluence of geologic, climatic and biological factors), and the area's orographic isolation, creates a region of high floral diversity, with distinctive vegetation, as well as a high degree of endemism, including many valuable medicinal and aromatic plants (MAPs). As many as 1500 plant species have been recorded from the Project area alone. The area is also inhabited by a variety of wild fauna, including eight protected and endangered species such as the Snow Leopard and Musk Deer. A detailed list of flora and fauna is given in Annex 3.
The area is not only rich in species biodiversity but also represents a broad range of habitat types. On the basis of field surveys, observations, and land use maps of the Project area, the major habitat and vegetation types inhabited from the lower elevations to the tree line in the
Biological Monitoring Report of Humla Project 12

Project area are given in Table 3. For more detailed descriptions of each of these habitats, see Annex 6.
IV. ECONOMIC USES OF BIOLOGICAL RESOURCES Biological resources are an integral part of the rural economy. These resources not only fulfil the subsistence need of the local people but also help them generate cash income. A large number of biological products are used in the Project area. The main biological resources used in the Project area are forests and alpine grasslands. The Project's more than 51,000 hectares of forest, scrub and grassland, representing almost three-fifths of the total land area, are the natural habitats for about 1,500 species of plants.
These resources provide trees, shrubs, herbs, and a variety of products from them - timber for building houses, wood for making agricultural tools and implements, fuel-wood for cooking and heating, fodder for animals, and a variety of non-timber forest products for medicine and trade. A list of these plants by use categories is presented in Annex 3.
For local people non-timber forest products (NTFPs) are found to be more valuable than timber products from an economic as well as cultural point of view. These plant products have a variety of uses in the Project area. From the point of view of use and management, three distinct but mutually non-exclusive categories of economic plant products were identified. These are:
• Commercially Traded: Species that are traded directly or through a series of traders to processing or manufacturing industries, or distributors.
• Potential for Trade: Plant species is found in a sizable volume, has not been traded from Humla, but has already been traded outside the District or Country, or have some prospect for processing at the local level.
• Locally Used or Traded for Subsistence Purpose: Not currently of commercial interest or available in commercial volumes, but is used at a subsistence level within the District. Note, a species which is currently used only for subsistence purposes, may enter into trade at any time when its outside market value is known or a commercial product is developed using its product(s).
Out of 1,500 plants, 135 species of economic plants were identified in the Project area in 1994. Of the 135, ten were in trade commercially, 30 had potential to enter into trade, and 95 had subsistence uses. Over the Project period additional economic plants were identified for a total of 159. Eleven of the potential species listed in 1994 are now traded, making 21 commercial species and 45 potential for trade in 1998. Eighty nine species were used for subsistence in 1998 including all 21 commercial species and 42 of the 45 potential for trade species. These 159 species of economic plants are listed by the utilization categories in Annex 3 along with information on ecology, morphology, habitat and distribution, parts used, usage (current or potential commercial uses, or subsistence), and the season of collection.
Bio log ica l Moni tor ing Repor t o f Humla Pro jec t 13

Map 2. Map of the Project Area Showing Land Use Patterns
Biological Monitoring Report of Humla Project 14

Table 3. Major Habitat and Vegetation Types within the Project Area
I. TEMPERATE ZONE (2001 - 3000m) 1. Lower temperate forests
a. Chir Pine (Pinus roxburghii) forest b. Blue Pine (Pinus wallichiana) forest c. Oak forest (Quercus leucotrichophora, Q. floribunda) d. Mixed broad- leaf forest (Juglans, Acer, Populus, Alnus) e. Riverine forest (Aesculus indica, Juglans regia)
2. Upper temperate forests a. Oak (Quercus semecarpifolia) forest b. Mixed broad-leaf forest (Acer spp., Rhododendron spp.) c. Mixed Blue Pine - Oak (Q. semecarpifolia) forest d. Coniferous forest (P. wallichiana, Abies spectabilis, Tsuga dumosa, Taxus
baccata, Picea smithiana)
2. Burned areas
3. Rocky slopes
4. Grasslands
II. SUB-ALPINE ZONE (3001m - 4000m) 1. Sub-alpine forests
a. Oak (Q. semecarpifolia) forest b. Fir (Abies spectabilis) forest c. Birch (Betula utilis) forest d. Rhododendron - Birch forest e. Juniper (Juniperus spp.) steppe
2. Sub-alpine scrubs (Rhododendron and Sorbus microphylla shrubs)
3. Sub-alpine grasslands
III. ALPINE and NIVAL ZONE (above 4000m)
1. Scrubland (Rhododendron, Juniperus) 2. Grasslands (Graminae, Cyperaceae) 3. Rocky slopes (mat patches, scarcely vegetated rocks, and screes)
4. Glacier and snow-covered land
Although the commercial exploitation of plant products collected in Humla has been limited, according to key informants, several medicinal and aromatic plants have been collected for fifty years or more. People from Jumla, especially those of the Sinja area, used to come into Humla to harvest Kutki (Picrorhiza scrophulariiflora), Atis (Delphinium himalayai),
Bio log ica l Moni tor ing Repor t o f Humla Pro jec t 15

Panchaunle (Dactylorhiza hatagirea), Guchchi-chyau (Morchella conica), and Silajit (organic exduate from rock). Traders also used to come from Sama Bargaon (Jajarkot district) to barter tools, grains, and clothes for herbs like Picrorhiza scrophulariiflora and Delphinium himalayai.
The markets for most wild harvested plants from Humla have developed more recently. The commercial products include medicinal and aromatic products, plant fibers, herbal dyes, food and flavors, and wood for cottage industries. Bhutkesh (Selinum tenuifolium), Lekh-Satuwa (Trillidium govanianum), Bhojpatra (Betula utilis) and Sugandhwal (Valeriana jatamansi) have been harvested for only a few years and India's current demand for Jatamansi (Nardostachys grandiflora) dates back to just over a decade. The high value, low volume plant products that were legally collected for established markets are: Delphinium himalayai, Picrorhiza scrophulariiflora, Nardostachys grandiflora, Valeriana jatamansi, Morchella conica, and Satuwa (Daiswa polyphylla var. intermedia).
In addition to the trade for cash income, a large number of plants were used locally to provide food, medicine, fibers, dyes, tannin, gums, resin, incense, building materials, fodder, fuelwood, and agricultural implements. Some commercially traded plants were also used for local medicine and incense making. The most notable products are Kakarsingi (insect gall on Pistacia integerima), and roots of Picrorhiza scrophulariiflora and Nardostachys grandiflora. These locally used plant products were also found to be bartered for grains in Humla and its neighboring districts. The species banned for collection by the government of Nepal such as Dactylorhiza hatagirea and Yarsagumba (Cordyceps sinensis) are also found in the area.
The area also inhabits a number of wild fauna including the following eight protected and endangered species: Snow Leopard (Panthera uncia), Clouded Leopard (Neofelis nebulosa), Musk Deer (Moschus moschiferous), Wolf (Canis lupus), Leopard Cat (Felis bengalensis), Wild Yak (Bos mutus), as well as Impeyan Pheasant (Lophophorus impejanus), and Satyr Pheasant (Tragopan satyra). A complete list of animals and birds found in the Project area is presented in Annex 3 of this report.
Hunting and illegal poaching of wild animal is a traditional practice in Humla. Musk Deer (Moschus moschiferous) and Himalayan Black Bear (Selenarctos thibetanus) are among the most commonly hunted species. Musk Deer is one of the endangered wildlife species confined to the shrubland of the sub-alpine zone. Himalayan Black Bear resides in Oak and Spruce forests. Most of the year Musk Deer live in high altitude shrubland, but during the winter when the area is covered with snow these animals come to the lower altitudes. Musk Deer and Himalayan Black Bear are poached for their valuable musk and bile respectively. The musk is found only in the male animal. Both musk and bile are an important ingredient of the traditional medical system. These products have good demand from abroad and are sometimes illegally traded to international markets.
V. ASSESSMENT OF THREATS TO BIODIVERSITY
1. Internal and External Factors Affecting Biodiversity Natural resources are beginning to be exploited above their sustainable capacity for the rising human population to meet their subsistence and cash needs. Transhumance (migratory herding system), terrace farming, collection of fodder, fuel wood and non-timber forest products (NTFPs), and slash-and-burn agriculture (locally called as kurilla halne) are still in Biological Monitoring Report of Humla Project 16

practice in Humla. Many households keep large herds of sheep, goats, cattle, mules, and horses.
Human use of the resources has converted formerly diverse vegetation into homogenous strongholds of a few resilient species indicating the degradation and loss of biological diversity, especially close to human settlements. Degraded areas are often taken over by resilient species such as Urtica dioica, Girardinia diversifolia, Salvia moorcroftiana, Chenopodium album, Prinsepia utilis, Artemisia sieversiana, Rumex nepalensis, Berberis asiatica and B. aristata. In the neighboring districts of Jumla and Mugu, native coniferous forests had largely been replaced by Pinus wallichiana, a frequent colonizer that follows ecological disturbances. In Humla, however, many of the side valleys still harbor stands of native coniferous forest (Abies pindrow and Picea smithiana).
With the increasing extraction of non-timber forest products (NTFPs) for commercial purposes, the degradation trend of these resources was also increasing prior to the Project. Figure 2 shows the main degradation factors linked to the biological diversity threats of the Project area. The threats to these resources were linked to human activities such as uncontrolled harvesting (over harvesting, inappropriate timing, and methods of harvest), over grazing, burning, shifting cultivation, poaching, and other activities that lead to deforestation and habitat loss. These human activities were the results of several socioeconomic factors such as poverty, immediate cash needs of local people, lack of alternative income generating opportunities, defective property rights, lack of incentive for conservation, limited knowledge on conservation, and increasing market demand for these products.
Figure 2
Internal & External Factors Affecting Biodiversity
• • • • •
•
•
Bio log i
Poverty and immediate cash need of local people Lack of alternative income generating opportunities Ineffective property rights & lack of incentives for conservation Limited knowledge of modern conservation practices Increasing market demand for natural products
Influences on Human Behavior
Threats to Biodiversity Uncontrolled harvesting of NTFPs (e.g. over harvesting, inappropriate timing and methods of harvest) Over grazing, burning of pastures, and shifting cultivation
ca l Moni tor ing Repor t o f Humla Pro jec t 17

2. Major Threats to Biodiversity – As Characterized at the Start of the Project
The top threats to biological diversity were identified and ranked by the local people and the Project staff at the beginning of the Project. These are presented in Table 4. Ranking of these threats was based on four criteria: the size of the affected area; the intensity of the damage; the urgency to counter the threat; and the feasibility of countering the threat through the Project. As can be noted from the Table 4, equal weight was given to all four criteria. A brief explanation of these threats as found at the start of the Project is given below. The change in these threats and conservation impact of the Project are discussed in section IX. Each category is ranked on a scale of 1 to 6, 6 being the highest.
Table 4. Ranking of Major Threats to the Biodiversity in Humla Project Sites
Threats Area Ranking
Intensity Ranking
Urgency Ranking
Project Feasibility
Total Score
Rank
Burning of forest/pastures
4
5
5
4
18
1
Uncontrolled harvesting of NTFPs
5 3 4 6 18 1
Slash and burn farming
2 6 6 3 17 2
Unmanaged harvesting of timber, fodder & firewood
3 4 3 5 15 3
Over grazing
6 2 2 2 13 4
Poaching
1 1 1 1 4 5
Uncontrolled Burning of Pasture and Forest
Fire is a common phenomenon in the area and this destroys the valuable biological resources. People set fires for a number of reasons. In some cases, it is for bringing up the new shoots of grasses for grazing, in other cases, it is for slash and burn farming (Kurilla halne), and still in other cases, for honey collection or hunting. Sometimes it also happens without any intention. It has been found that fires destroy some portion of the forests every year and threaten the biodiversity of the area. Uncontrolled burning tied for number one in a ranking exercise on threats with all project stakeholders.
Uncontrolled Harvesting of NTFPs
Uncontrolled harvesting includes the over harvesting as well as inappropriate timing and methods of harvesting. This tied for number one with burning in the threat ranking exercise. The communities of Humla have been harvesting a large number of plant products from the government owned national forest and grasslands. Since these forest and grasslands were considered to be under the government property regime and not under the control of the communities, there was an incentive to harvest as much as possible before someone else got to it. At the same time, there was little or no awareness of conservation coupled with any alternative income generating opportunities that would change the unsustainable practices. Biological Monitoring Report of Humla Project 18

Although there was little pressure on species that were collected for local use on a subsistence basis, the pressure on some of the commercial species has already resulted in over harvesting, and in some cases, immature and unscientific harvesting leading to the threat of extinction. The indigenous knowledge and traditional skills of a few individuals on harvesting NTFPs at a subsistence use level were not enough or enforceable to apply to the harvesting of commercially demanded species. The same was true on production management, post harvest operations, processing, and marketing.
Slash and Burn Farming (Kurilla Halne)
Slash-and-burn agriculture, locally called Kurilla Halne, is the process of burning the forest trees and the shrubs in which the crown fire is set and small patch of the forest is cleared for the cultivation of cereals and potatoes. Though the first year’s production is comparable to “regular agricultural areas”, the production gradually goes down year after year and the people finally abandon the land. These lands are then susceptible to soil erosion and landslides. This ultimately leads to the loss of vegetation and disturbs the ecosystem thereby threatening the biodiversity of the area. Kurilla Halne was ranked as the second major threat to biodiversity in Humla.
Unmanaged Harvesting of Timber, Fodder & Firewood
Harvesting of timber, fodder, and firewood for subsistence purpose has exceeded sustainable yields. All factors related to property rights mentioned in the case of NTFPs are also responsible for inappropriate methods of harvesting, ultimately destroying the regeneration potential of the species being harvested. This category was ranked third among the six categories of threats.
Over Grazing
During the summer season (May to October) the farmers keep their cattle around a goth (a temporary hut for farmers during herding season) and graze the cattle in the forest. Grazing is done generally from the land close to the homestead as well as the alpine pasture located as high as 4500m. The grazing animals include cattle, Juma (Yak hybrid), horse, goat and sheep. There is pressure from both over grazing and lopping trees for fodder. Common trees used for fodder are Quercus semecarpifolia, Thinke, Acer acuminatum, Betula utilis, and Sorbus microphylla. While leaves of some medicinal plants such as Jurinea dolomaea, Megacarpa polyphylla, and Rheum australe are grazed by most of the animals and severely affected, leaves of other plants, such as Jatamansi, are only grazed by sheep and goat and less severely affected. Secondary effects of grazing, such as trampling, compaction, destruction of rootstock, and soil erosion adversely affect the biodiversity.
Construction of goths in the forest during the grazing season has also accelerated the deforestation rate in the area. Mature trees of Birch and Fir are cut down to construct a goth. The people staying at a goth also require a lot of fire-wood for cooking and heating purposes. Thus, the areas around the goths were found degraded with an abundance of resilient species such as Hale (Rumex nepalensis) and Bijauri Phool (Senecio chrysanthemoides).
Poaching
Hunting of wild animals, although it is illegal in most cases, poses a threat to the species being hunted, such as Musk Deer and Himalayan Black Beer.
Bio log ica l Moni tor ing Repor t o f Humla Pro jec t 19

VI. INVENTORY OF FIVE COMMERCIALLY HARVESTED NTFPs
1. Distribution and Habitats The distribution of the important plant species is mapped from the knowledge of key informants and field observations (See Map 3). A summary of the distribution and habitats of five important commercial plant species of the Project sites is presented in Table 5. The five species are Jatamansi, Kutki, Sugandhwal, Atis, and Guchchi Chyau. Profiles for each with biological findings are presented in Annex 4. Table 5 shows the total area, elevation range, major habitats, slope range, aspect, soil type, mean ground cover per cent, and frequency of occurrence of five commercial species.
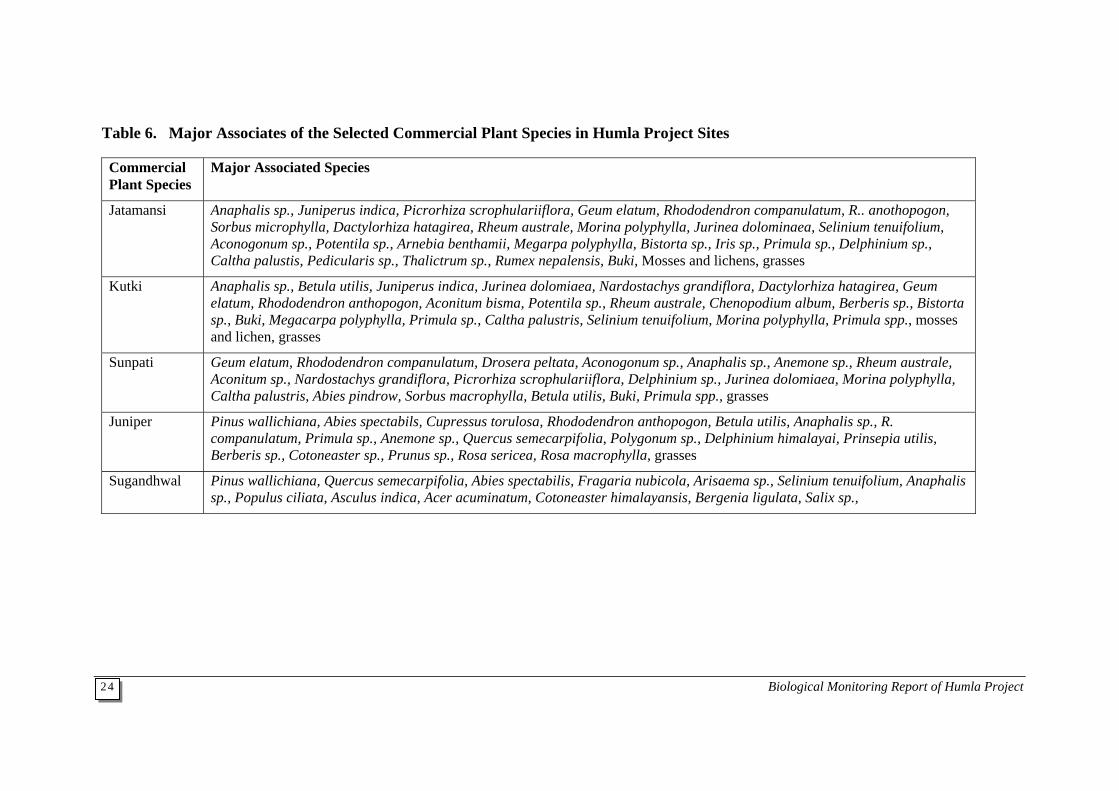
The major associated species of these five commercial plants is presented in Table 6 with an elaborate list of associates presented in Annex 2. Associated species are important, as it presents a sense of what other species can be conserved when commercial species’ harvesting is better managed and/or other threats to biodiversity are reduced.
Out of the total area of about 51,312 hectares that is covered by forest, shrubs, and grasses in the Project sites, Jatamansi was most widely distributed (approximately 36,052 hectares of land), among the five species followed by Kutki, Sunpati, Sugandhwal, and Juniper (Table 5). Among the four surveyed species (Sugandhwal was not surveyed), Jatamansi was also the most frequently occurring species within its range (54.2%) followed by Juniper, Sunpati, and Kutki. But in terms of ground/canopy coverage Juniper is first, followed by Sunpati, Kutki, and Jatamansi.
In the Project sites Jatamansi was observed between sub-alpine and alpine regions covering an elevation range of 3500m to 4500m. This comes within the range described in the literature - 3300m to 5100m (Department of Medicinal Plants, Nepal 1970; Polunin et al. 1984). Jatamansi’s distribution is patchy and grows predominately in dry, rocks, edges, small depressions, scrubs, and in open meadows on north, northeast, and northwest facing slopes
In the Project area, Kutki is distributed between the elevation of 3650m and 4500m. Within this range, it is found in open meadows, on the screes, rocks, and open slopes of sub-alpine. It is found in steeper places than any other presently harvested species.
Juniper is found in open dry slopes of the sub-alpine habitat, sometimes forming pure stands of Juniper shrub. The elevation range of this species within the Project area is between 3200m and 3800m. Sunpati is distributed in an elevation range of 3500m to 4300m in open slopes of sub-alpine shrub land. Sugandhwal is found comparatively in lower elevation ranges, 1700m to 2700m, in temperate riverine moist forests.
Biological Monitoring Report of Humla Project 20

Bio log ica l Moni tor ing Repor t o f Humla Pro jec t 21
Map 3. Distribution of the Selected Commercial Plant Species in Humla Project Sites


Table 5. Distribution and Habitats of Selected Commercial Plant Species in Humla Project Sites
Bio log ica l Moni tor ing Repor t o f Humla Pro jec t 23
Commercial Plant Species
Total Area (ha)
Elevation Range1(m)
Habitat Types Slope in
degree
Aspect Soil Type MeanGround Cover2
(%)
Frequency of
Occurrenc3 (%)
Jatamansi 36,051.86 3500-4500m
(3300-5100m)
Birch forest, open meadows, bushy cover of Rhododendron companulatum and R. anthopogon, open slopes, rocky surface, and small depression of sub alpine zone
20-40 North,Northeast, Northwest
Black humus and deep soil
26.2 54.2
Kutki 27,674.77 3650-4500m
(2700-4800m)
Open meadows of sub alpine on the screes, rock, and open slopes
20-50 North,Northeast, Northwest
Sandy loam, rocky boulder
28.0 20.2
Sunpati 18,262.71 3500-4300m
(3000-4800m)
Open slopes of the sub alpine shrubland
10-35 East,Northeast and North
Humus soil 39.7 51.3
Juniper 9,550.00 3200-3800m Open dry slopes of the sub alpine habitat, forming sometimes pure Juniper shrub stands (2200-4500m)
15-35 Southeast,South
Sandy loam, shallow soils
42.0 51.7
Sugandhwal 13,075.00 1700-2700m
(1500-3600m)
Temperate riverine forest and moist Blue Pine forest
10-30 North,Northwest
Humus and black deep soil
NA NA
Notes: 1. The elevation ranges within parenthesis are taken from literature: Department of Medicinal Plant, 1970; Polunin et. al, 1984. 2. Mean ground cover percentage is for those plots where the specie is present (see frequency of occurrence). In the case of Juniper, this represents canopy cover of the
specie. 3. Frequency of occurrence percentage is the number of total sample plots in which the specie is present. For example, if we take a random sample of 100 plots, for
Jatamansi in the elevation range 3500 – 4500 m it will be found in 54 plots = a frequency of occurrence of 54%.
Biological Monitoring Report of Humla Project
24
Commercial Plant Species
Major Associated Species
Jatamansi Anaphalis sp., Juniperus indica, Picrorhiza scrophulariiflora, Geum elatum, Rhododendron companulatum, R.. anothopogon, Sorbus microphylla, Dactylorhiza hatagirea, Rheum australe, Morina polyphylla, Jurinea dolominaea, Selinium tenuifolium, Aconogonum sp., Potentila sp., Arnebia benthamii, Megarpa polyphylla, Bistorta sp., Iris sp., Primula sp., Delphinium sp., Caltha palustis, Pedicularis sp., Thalictrum sp., Rumex nepalensis, Buki, Mosses and lichens, grasses
Kutki Anaphalis sp., Betula utilis, Juniperus indica, Jurinea dolomiaea, Nardostachys grandiflora, Dactylorhiza hatagirea, Geum elatum, Rhododendron anthopogon, Aconitum bisma, Potentila sp., Rheum australe, Chenopodium album, Berberis sp., Bistorta sp., Buki, Megacarpa polyphylla, Primula sp., Caltha palustris, Selinium tenuifolium, Morina polyphylla, Primula spp., mosses and lichen, grasses
Sunpati Geum elatum, Rhododendron companulatum, Drosera peltata, Aconogonum sp., Anaphalis sp., Anemone sp., Rheum australe, Aconitum sp., Nardostachys grandiflora, Picrorhiza scrophulariiflora, Delphinium sp., Jurinea dolomiaea, Morina polyphylla, Caltha palustris, Abies pindrow, Sorbus macrophylla, Betula utilis, Buki, Primula spp., grasses
Juniper Pinus wallichiana, Abies spectabils, Cupressus torulosa, Rhododendron anthopogon, Betula utilis, Anaphalis sp., R. companulatum, Primula sp., Anemone sp., Quercus semecarpifolia, Polygonum sp., Delphinium himalayai, Prinsepia utilis, Berberis sp., Cotoneaster sp., Prunus sp., Rosa sericea, Rosa macrophylla, grasses
Sugandhwal Pinus wallichiana, Quercus semecarpifolia, Abies spectabilis, Fragaria nubicola, Arisaema sp., Selinium tenuifolium, Anaphalis sp., Populus ciliata, Asculus indica, Acer acuminatum, Cotoneaster himalayansis, Bergenia ligulata, Salix sp.,
Table 6. Major Associates of the Selected Commercial Plant Species in Humla Project Sites

2. Current Stocks of NTFPs Overall frequency of occurrence, mean fresh product stock per hectare, ratio of fresh to dry weight, and kilograms of dry product per hectare for Jatamansi, Kutki, Sunpati, and Juniper are given in Table 7. Low, medium, and high estimated total stocks in terms of clean dry commercial products available within the Project area are given in Table 8. The three different estimates are derived from a 95% confidence interval for the mean production. The mean and medium production figures are the same. However, for the purpose of enterprise planning the resource management the Project has been using the low scenario figures in harvesting targets and community natural resource management plans. Both the mean production and total stock available is highest for Jatamansi among the four species.
Table 7. Overall Frequency of Occurrence and Mean Stock of Fresh Products of Major Commercial NTFPs in the Project Area
Plant species Frequency of Occurrence
(%)
Fresh Products (kg/ha)
Ratio of fresh to dry weight
Dry Products (kg/ha)
Jatamansi 54.23 2,315.60 1:0.44 1,018.86 Kutki 20.20 817.52 1:0.61 498.69
Sunpati 51.29 1,045.40 1:0.44 459.98 Juniper 51.72 997.11 1:0.70 697.98
Table 8. Area Covered and Total Stock of Clean Dry Products by Species for Project Area
Total Stock of Clean Dry Product in Tons Plant Species
Total Area (ha)
Low Medium High Jatamansi 36,051.9 17,648.72 19,919.75 22,190.79
Kutki 27,674.8 2,234.29 2,787.82 3,341.21 Sunpati 18,262.7 3,894.36 4,308.57 4,722.77
Juniper 9,550.0 640.29 3,447.49 6,254.69
More detailed study was done for Jatamansi, Kutki, and Sunpati. The major factors that affect distribution of these NTFPs include elevation, habitat types (ground coverage), aspect, slope, and moisture condition. Association among the species is also dependent on these factors. Table 9 reveals that the association of these three species is largely dependent on elevation and that their habitats overlap with each other. For example, Jatamansi starts growing a lower elevations (3575 – 3700 m), then is found mixed with Kutki and Sunpati up to 4000 m, while above 4000 m both Jatamansi and Kutki are present, but Kutki dominates. Sunpati has a much narrower elevation range in comparison to Jatamansi and Kutki. Table 9 also reveals that production for each of the species is higher when they are not associated with the other two.
Bio log ica l Moni tor ing Repor t o f Humla Pro jec t
25
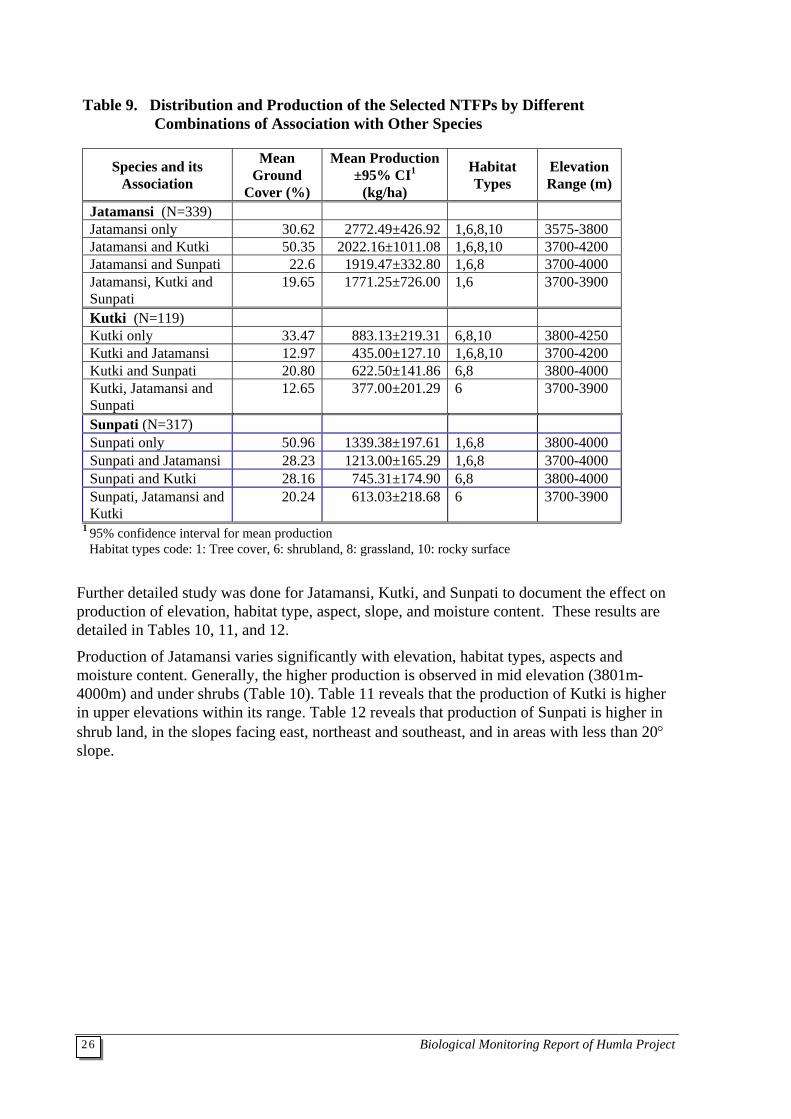
Table 9. Distribution and Production of the Selected NTFPs by Different Combinations of Association with Other Species
Species and its Association
Mean Ground
Cover (%)
Mean Production ±95% CI1
(kg/ha)
Habitat Types
Elevation Range (m)
Jatamansi (N=339) Jatamansi only 30.62 2772.49±426.92 1,6,8,10 3575-3800 Jatamansi and Kutki 50.35 2022.16±1011.08 1,6,8,10 3700-4200 Jatamansi and Sunpati 22.6 1919.47±332.80 1,6,8 3700-4000 Jatamansi, Kutki and Sunpati
19.65 1771.25±726.00 1,6 3700-3900
Kutki (N=119) Kutki only 33.47 883.13±219.31 6,8,10 3800-4250 Kutki and Jatamansi 12.97 435.00±127.10 1,6,8,10 3700-4200 Kutki and Sunpati 20.80 622.50±141.86 6,8 3800-4000 Kutki, Jatamansi and Sunpati
12.65 377.00±201.29 6 3700-3900
Sunpati (N=317) Sunpati only 50.96 1339.38±197.61 1,6,8 3800-4000 Sunpati and Jatamansi 28.23 1213.00±165.29 1,6,8 3700-4000 Sunpati and Kutki 28.16 745.31±174.90 6,8 3800-4000 Sunpati, Jatamansi and Kutki
20.24 613.03±218.68 6 3700-3900
1 95% confidence interval for mean production Habitat types code: 1: Tree cover, 6: shrubland, 8: grassland, 10: rocky surface
Further detailed study was done for Jatamansi, Kutki, and Sunpati to document the effect on production of elevation, habitat type, aspect, slope, and moisture content. These results are detailed in Tables 10, 11, and 12.
Production of Jatamansi varies significantly with elevation, habitat types, aspects and moisture content. Generally, the higher production is observed in mid elevation (3801m-4000m) and under shrubs (Table 10). Table 11 reveals that the production of Kutki is higher in upper elevations within its range. Table 12 reveals that production of Sunpati is higher in shrub land, in the slopes facing east, northeast and southeast, and in areas with less than 20° slope.
Biological Monitoring Report of Humla Project26

Table 10. Mean Production of Fresh Jatamansi Rhizomes by Elevation, Habitats, Aspect, Slope, and Soil Moisture Content
Variables Frequency of Occurrence
(%)
Mean Production ± 95% CI
(kg/ha)
Mean Ground Cover (%)
Elevation Range (p=0.000) 3550-3800 55.1 1555.88±296.0 22.2 3801-4000 54.4 2835.5±452.0 27.3 4001-4250 52.0 2659.3±680.6 32.3 Habitat Types (p=0.000) Tree Cover 48.6 1490.5±407.6 21.3 Shrubland 55.4 3135.7±491.3 29.8 Open Grassland 56.3 2021.7±370.4 25.7 Overall 54.2 2315.6±264.0 26.3
Table 11. Mean Production of Fresh Kutki Roots by Elevation, Habitats, Aspect, Slope, and Soil Moisture Content
Variables Frequency of Occurrence
(%)
Mean Production ± 95% CI
(kg/ha)
Mean Ground Cover (%)
Elevation Range (p=0.001) 3650-3800 20.1 494.1µ199.3 24.13801-4000 20.2 820.2µ215.8 24.84001-4250 20.5 1309.6µ451.2 39.1Habitat Types (p=0.09) Tree Cover 20.7 510.2µ262.1 20.4Shrubland 17.0 788.5µ305.1 16.5Open Grassland 22.8 971.2µ251.4 38.1Overall 20.2 817.5µ162.3 28.0
Bio log ica l Moni tor ing Repor t o f Humla Pro jec t
27

Table 12. Mean Production of Fresh Sunpati Leaves by Elevation, Habitats, Aspect, Slope, and Soil Moisture Content
Variables Frequency of Occurrence
(%)
Mean Production ± 95% CI
(kg/ha)
Mean Ground Cover (%)
Elevation Range (p=0.2) 3650-3800 42.7 938.9±183.1 36.3 3801-4000 60.1 1131.5±147.8 43.3 4001-4250 48.8 967.4±190.5 38.4 Habitat Types (p=0.001) Tree Cover 35.3 672.4±132.3 32.0 Shrubland 76.6 1275.9±157.2 42.5 Open Grassland 38.3 822.1±128.0 35.7 Aspect (p=0.003) North 56.5 893.6±219.1 30.8 Northeast 49.0 1039.5±234.4 37.4 East 71.7 1449.6±221.2 50.9 Southeast 40.5 1106.3±397.3 48.0 South 14.3 490.6±378.5 25.0 Southwest 22.2 489.4±308.7 39.7 West 50.0 860.2±241.0 30.8 Northwest 60.0 941.6±277.6 32.4 Slope (p=0.007) =< 200 58.0 1376.5±223.6 49.7 210-350 42.9 911.0±124.1 33.6 360 and above 57.8 1074.5±182.3 32.5 Overall 51.3 1045.4±100.5 39.7
3. Regeneration Jatamansi is a perennial herb, nearly 15-30 cm tall, broad-leaved, with rose-purple to whitish flowers. Jatamansi flowers in June or July and its seeds mature in late August. The herb regenerates both by seed dispersal and root division in its natural habitat. In most cases, plants tend to start bearing flowers and producing seeds after three years. Local gatherers indicated that the roots benefit from being thinned, as thicker and stronger roots are then produced. Gatherers also indicated that rhizomes found under bushes multiply faster than those in open areas, and herbs growing at higher elevations have larger roots. Cultivation is possible using seedlings or rhizome cuttings but the plants from cutting grow faster than seedlings.
The species regenerates well, if harvesting is done properly. Proper harvesting includes time of year harvested, age of plants harvested, amount harvested in terms of percentage of root taken from an individual plant and number of plants taken in a given area, interval between harvesting, and halting and/or reduced incidence of destructive practices (e.g. burning). For example, harvesting of Jatamansi in summer before rainfall is detrimental to regeneration. Local harvesters indicated that fire, grazing and unscientific harvesting (premature and over harvesting) are the main destructive factors for the growth and regeneration of this species.
Biological Monitoring Report of Humla Project28

Kutki is a perennial herb with radical, spathulate, and sharply serrated leaves; and elongate, stout creeping rootstock. Kutki flowers in June-August and its seeds mature in late September. This species regenerates naturally by both seeds and rhizome. Kutki has a lower regeneration rate than Jatamansi. The regeneration of Kutki is better in shady and moist areas rather than in open areas. It can also be cultivated at higher altitudes of the Himalayas using seeds or rhizome cuttings.
Kutki is more threatened in the Project area than Jatamansi. Local harvesters indicated they have to walk a longer distance to harvest Kutki than the previous years and realized the traditional harvesting method (i.e. uprooting of all plants) is not suitable for the regeneration of this species. Premature collection is also threatening the sustainability of this species, but fire is the most destructive factor for Kutki growth and regeneration.
Sugandhwal is a perennial, slightly hairy, tuft herb that grows up to 45cm in height with persistent long petioled and deeply cordate-ovate radical leaves. Sugandhwal flowers in April-June and its seeds mature in July. It regenerates by seeds and rhizome. It propagates easily from its seeds and has been cultivated successfully from seed in some parts of Nepal. The seed sowing period is February-March. Being a shade loving plant, Sugandhwal regenerates better in shady and moist areas than on open slopes. The natural regeneration of this species after harvest is moderate, not as strong as Jatamansi, but better than Kutki. Sugandhwal also suffered from the same destructive factors as Kutki and Jatamansi, prior to the Project.
Sunpati is a small, strongly aromatic shrub with ovate leaves and compact clusters of 4-6 white or yellow flowers. It regenerates from seeds and underground root. It flowers in July and its seeds mature in August. The natural regeneration of this species after harvest is moderate. Regeneration of this species is not as problematic as Jatamansi, Kutki, and Sugandhwal, as the harvesting method is less destructive to the plant. Only the young leaves and twigs are handpicked or cut with cutting tools, which does not harm the plant’s growth. Sunpati is one of the under-used plants in the Project area. Fire and other biological disturbances severely affect the regeneration of this Sunpati. Destruction of Sunpati cover also affects the growth of Jatamansi growing underneath it.
Juniper is a prostrate shrub or a tree with two types of leaves; awl-shaped on the lower branches and scale like on the terminal branches. It regenerates from seeds. It can be cultivated easily from seed. Juniper plant starts fruiting at the age of 4 years but the plant produces abundant fruit after six years. The normal fruiting season is from May to July. The leaves can be collected from the plants of three or more years of age. The regeneration of the species depends upon the number of fruiting trees, fruit production, seed dispersal, and other ecological factors.
For the regeneration management of all the above species, the Project facilitated FUGs to adopt rotational harvesting strategies in addition to species-specific harvesting practices. Most of the FUGs have also stopped uncontrolled burning to facilitate regeneration. A summary of the optimal harvesting protocols is found in Table 17.
VII. GROWTH AND YIELD STUDIES RESULTS To determine the growth rate of Jatamansi, one of the most commercially valuable NTFPs in the Project area, an experiment, as described in the Methodology section, has been established in Rugyani Forest of the Rahadev FUG in 1997. The experimental plot has Bio log ica l Moni tor ing Repor t o f Humla Pro jec t
29

northwest orientation with an elevation range of 3,890m to 3,960m and between a slope of 320 and 360. Map 1 in Annex 5 shows the location and the detail layout of the experimental plot.
To date, only two observations have been taken - one at the time of establishment (1997) and one in the following year (1998). It is too early to come to a conclusion on growth and yield levels for Jatamansi from this experiment, however, the data captured with the help of key informants and organized under the experiment entitled “quick assessment of harvest intervals” have been analyzed and presented in Tables 13 and 14.
Table 13. Mean Production of Fresh Jatamansi Roots and Rhizomes by Habitat Types and Harvest Intervals (in kg/ha)
Habitat Harvest Interval Bushy Open Row Average
1 Year 872.57 723.50 730.25 2 Years 2227.34 1626.50 1724.88 3 Years 3700.66 2314.06 2976.04 4 Years 5484.38 4301.79 4215.34 5 Years 6375.00 5250.00 5707.06
Column Average 2843.25 1673.40 2030.84 Note: F-test: a critical value of p<0.00 for harvest interval and p<0.03 for habitat types; N=130 LSD for harvest intervals (in year): 5 NS 4, 5 or 4*3 or 2 or 1, 3*2 or 1, 2*1 The data in Table 13 reveals that the mean yield increases significantly with the increase in the years of harvesting interval from one year to four years but the least significant difference test (LSD) shows that there is no statistically significant increase in the yield after four years. Similar is the result for the percentage of ground-cover increment with the increase in the years of harvest interval (Table 14). Although there is no statistical significance in the yield obtained from the plots of four and five years of rotation, the increased yield and reduced cost of collection make it economical to harvest at an interval of five years.
Although the percentage of ground covered by Jatamansi is not significantly different in open or busy habitats, the Jatamansi yield obtained from busy habitats is significantly higher than that from the open grassland for all rotational lengths. This might be due to the availability of more organic matter and moisture for the Jatamansi plant under the bush.
Thus, we have recommended a rotational period of five years for Jatamansi. The present practice followed by FUGs of the Humla project can be recommended to other FUGs of similar ecological areas from both economic and biological sustainability perspectives.
Biological Monitoring Report of Humla Project30

Table 14. Mean Ground Cover Percentage of Jatamansi by Habitat Types and Harvest Intervals
Habitat Harvest Interval Bushy Open Row Average
1 Year 18.81 14.14 14.79 2 Years 19.33 19.23 18.33 3 Years 23.17 24.71 22.85 4 Years 49.25 51.25 41.31 5 Years 57.13 52.23 51.52
Column Average 23.81 20.92 25.62 Note: F-test: a critical value of p<0.000 for harvest interval and p<0.914 for habitat types; N=130
VIII. HARVEST ASSESSMENTS
1. Annual Harvest Rates About 72% of the total of 1,966 households of the Project collected one or more type of NTFPs in 1998. An average of three individuals per household was involved in the collection and sale of NTFPs in the same year. Total annual harvest levels of commercial NTFPs found in the Project area are summarized in Table 15. The data presented in Table 15 was collected from FUGs, local traders, and the Humla Oil (HOPL) factory records.
Given Humla’s geography and lack of roads, all commercial products either are sold to Humla Oils, or must pass through the Simikot airstrip. This makes tracking of harvest levels very manageable, as there are only a few points the products can pass through when sold. Small amounts of Sunpati and Juniper were collected in 1997 for trial oil production by HOPL. Commercial production of these oils has not yet been pursued therefore Sunpati and Juniper were not harvested in subsequent years.
Table 15. Quantity of Annual Harvest of Commercial NTFPs from the Project Area
Name of Plant Species
Quantity of Clean Dry Products in kg by Collection Years
1994/95 1995/96 1996/97 1997/98 1998/99
Jatamansi 21,350 52,000 58,640 37,273 81,840
Kutki 14,090 8,430 23,984 20,106 23,078
Atis 894 934 1,984 1,720 419
Guchchi Chyau 379 748 831 778 559
Sugandhwal - 15 200 326 -
Source: ANSAB Project Records (Factory records, FUG records, and key informant interviews)
Bio log ica l Moni tor ing Repor t o f Humla Pro jec t
31

2. Harvest Impacts Although Table 15 shows an increasing trend in the annual quantity of commercial NTFPs harvested, when compared to the total stock of commercial NTFPs available in the Project area (Table 8), harvest rates are within sustainable levels. More importantly, the adoption of a rotational harvesting system by FUGs and improved practices in terms of methods and season of harvesting have contributed to increased conservation of the resource-base. The Project has found that in determining sustainable yield levels, it is just as important to focus on how and when products are harvested, as it is to emphasize the amount harvested. This is an important lesson, as too often management plans only focus on the amount harvested and/or permits are issued for amounts without consideration of harvesting method. Table 16 gives a comparison of the total estimated production in tons (clean dry products) of Jatamansi and Kutki to the 1998/99 harvest levels.
Table 16. Comparison of Total Clean Dry Products Production Estimates to Actual Harvest Levels in 1998/99 for the Project Area (in Tons)
Plant Species Low Production Estimate
Medium Production Estimate
High Production Estimate
1998/99 Harvest Levels
Jatamansi 17,648.72 19,919.75 22,190.79 81.84
Kutki 2,234.29 2,787.82 3,341.21 23.08
The comparison between the lowest estimate for total growing stock of Jatamansi and Kutki to the 1998/99 harvest levels indicates current harvest levels (and even increased levels) are sustainable provided proper methods of harvest and regeneration management are practiced.
Since the marketable products of Jatamansi, Kutki and Sugandhwal are the roots, the whole plant was being destroyed as collectors would uproot the entire plant. In the case of Sunpati and Juniper, only vegetative parts (leaves and berries) are harvested, which can be done without killing the plant assuming enough leaves are left. Some portion of the berries must also be left or the juniper plant cannot reproduce.
Participatory monitoring and field observations uncovered traditional harvesting practices that were detrimental to regeneration. Guidelines and recommendations were made to mitigate the adverse impacts, and some FUGs have already adopted the improved practices. As more FUGs formalize and implement their resource management plans the adoption rate is expected to go up. A comparison of the traditional and recommended harvesting methods for selected species is presented in Table 17. More detailed ecological and management information for the five species is documented in Annex 4. The time of year the product is harvested also impacts on its ability to regenerate, but as Box 1 (Reconciling Social Factors with Ecological Factors – the Case of Jatamansi) highlights, this is much more difficult (though not impossible) for the collectors to change.
Biological Monitoring Report of Humla Project32

Table 17. The Parts Harvested and Harvesting Practices for the Selected Commercial Plant Species
Plant Species
Parts Harvested
Traditional Practices of Harvest
New Harvesting Practices Adapted by FUGs
Jatamansi Rhizomes Whole plants are dug out (without leaving any plant) from the earth using kuto, a local digging tool. No restrictions in the use of tools, seasons, parts of forest and quantity of harvest. The method is destructive for the regeneration and growth of the plants. It also loosens the soil surface making it more prone to surface erosion.
Whole plants are pulled out from the bushy area and dug out carefully from the open grassland with Kuto leaving approximately 20% plants undisturbed for regeneration. Restrictions are applied in the use of tools, season, parts of forest and quantity of harvest, generally following a five-year rotational cycle.
Kutki Rhizome and Roots
Whole Kutki plants are uprooted with kuto and are sometimes hand picked without leaving any plants and propagules for regeneration. No group restrictions are applied.
Kutki is dugout with kuto and hand picked if the rhizomes are long leaving about 20% of the Kutki plant. Similar restrictions are instituted as in the case of Jatamansi.
Sunpati Leaves Only negligible quantity of leaves are hand picked or twigs are cut for local use (mixed with other herbs to make incense).
Leaves are either handpicked or cut with scissors leaving more than 30% leaves for plant growth.
Juniper Leaves and Berries
Branches are cut to collect the leaves for local use for subsistence purposes only.
Berries are handpicked and leaves are collected from the small branch cuttings with little disturbance to the plants.
Bio log ica l Moni tor ing Repor t o f Humla Pro jec t
33

Box 1: Reconciling Social Factors with Ecological Factors – the Case of Jatamansi
When is Best to Harvest Jatamansi?
Jatamansi is dormant from late Autumn until early Summer. During the Winter, plants are covered in snow, making harvest impractical. The plants sprout in early Summer, after the Winter snow melts, and grow until Autumn. The social and ecological effects of Autumn (mid-October to mid-December) versus Summer (mid-May to mid-July) harvesting were examined to determine when it is best to harvest Jatamansi. Both seasons are similar in terms of spare time available to the collectors.
From the collectors’ point of view, Summer is comfortable weather for harvesting work. Whole roots can be pulled up easily from the moist and less compact soil during Summer. During Autumn, the soil is very hard due to freezing and it is difficult to pull out the roots. The collection of Jatamansi is a hardship on collectors during cold weather. There is also a high risk that collectors may have to return empty handed if snow falls early.
As it is easy to pull or dig up the plants during Summer, collectors have a tendency to harvest a higher percentage of plants at this time. Loosening of soil surface and the trampling damage by the grazing animals after Summer harvests also accelerate soil erosion during the rainy season. Harvesting in Summer is also detrimental to the remaining plants and propogules as most of them decay after the harvest during the rainy season. Finally when Jatamansi is harvested during the beginning of its growing season (Summer), its annual yield is reduced.
The quality of Jatamansi harvested in Autumn was found to be better than that harvested in Summer. Jatamansi harvested in Autumn has a low moisture content, is less likely to be damaged by fungi and other factors, and produces heavier high quality essential oils. The Jatamansi harvested in Summer contains high moisture, likely to be damaged by fungi, and produces poor quality essential oils. Therefore, Autumn is recommended as a more appropriate season of harvesting from the biological point of view.
Appreciating the tradeoffs that must be made between the social and ecological factors, the method of harvesting becomes even more important as well as the interaction with other community activities (e.g. grazing practices, burning, etc.).
IX. CONSERVATION IMPACTS The Project has achieved several levels of conservation impacts as well as providing a methodology for determining sustainable NTFP harvesting practices that take into account time of harvest, amount harvested, and method of harvest. While the biological monitoring portion of the project has focused on NTFPs, interested readers are encouraged to read the accompanying report “Socio-Economic and Institutional Impacts of Community Based Ecosytems Management Project in Humla, Nepal”. The socio-economic report documented some interesting conservation outcomes that were not the focus of the project or the biological study. For example, when communities were able to obtain formal tenure over land through the FUG process, they were able to restrict migratory sheep and goat herders. Then in turn resulted in a decrease in the number of sheep and goats in the project area. The conservation impacts documented through the biological study are grouped into four categories:
Biological Monitoring Report of Humla Project34

1) Area brought under improved management;
2) Threat reduction to biodiversity as perceived by the communities and biological experts;
3) Collection of local knowledge and scientific biological data to document for the first time sustainable harvesting practices for selected commercial NTFPs; and
4) Adoption of conservation practices targeted at the main threats to biodiversity conservation combined with an awareness of how the threats can be mitigated.
1. Area Brought Under Improved Management Over the life of the project, project partners strengthened community land resource rights and management capacity by providing technical and legal support. Before the project there were no community forest user groups (FUGs) in Humla. Within the project area, 24 FUGs, representing 1,966 households were formed. Nineteen of these FUGs now formally manage over 10,000 ha of forest and pastureland in the project area. Table 18 presents the status of the community forest hand-over process within the project area at the end of 1998. It is important to note that the enterprise activities of the project were a key entry point that rallied the community members and collector groups to become organized into FUGs as well as actively participate in the biological activities described in this report.
The Humla FUG process was also the first in Nepal to include NTFPs in resource management plans. While there are 7,000 FUGs nationwide in Nepal, the management plans focus on timber, even though NTFPs were of much greater commercial value to most communities. The FUGs of Humla that have had forest areas formally handed over to them, now receive royalties on the non-timber forest products (NTFPs) that are collected from their forests. Previously these royalty payments went to the government. The FUGs of the project area collected a total of Rs 1,470,024 for the last three years and the total revenue accrued to the individual FUGs of the district was Rs 2,187,314 in 1998.
The project has also encouraged FUG formation in non-project areas of Humla. There are 15 FUGs outside the project area, making a total of 39 FUGs for the entire district of Humla. The project also helped establish linkages and coordination among FUGs across the entire district through the formation of a district level federation linked to national level organizations. The newly formed district wide federation of FUGs is continuing its activities in working with the DFO for continued handing over of the forests to FUGs. The federation has officially joined the nationwide federation of community forest user groups of Nepal (FECOFUN) as a district member and has established a working relationship with them. These FUGs also started reporting to the DFO and receive feed back on the management and harvesting of the forest products.
Bio log ica l Moni tor ing Repor t o f Humla Pro jec t
35

Table 18. Community Forestry Activity Status in BCN Project Area, Humla, Nepal
December 1998
Status Community Households Area NTFPs1
(hectare) Handed Over Thali 128 994.27 1, 3, 6,11,5,9,2,4,7,10
Mauri2 133 982.89 1, 3, 6,11,5,9,2,4,7,10 Takpaphuk 46 396.21 8,4,3,1,2,9 Syauli 89 45.00 1,6,2,7,3,9 Malikadevi 36 60.00 1,6,2,7,3,9 khadepatal 43 90.00 2,3,1,4,6,7,8,9,5 Dhaulapani 115 300.00 1,,3,6,4,5,6,9,7,8,2, Majhapatal3 107 19.00 4,2,5 Unapani 151 66.00 1,3,4,6,5,2,9 Rahadev 99 2000.20 1, 3, 6,11,5,9,2,4,7,10 Paksibada 125 769.40 1, 3, 6,11,5,9,2,4,7 Chandranatha 92 242.82 2,4,5,3 Gopka 85 985.18 1,2,3,4,6,5,7 Hilsa 62 280.73 2,4,5 Lali 34 5.31 2,4 Pyusa 77 116.17 2,4 Ripa 109 2603.96 1,2,3,11,6,9,4,5,7,8,10 Torpahutik 30 112.57 8,4,2 Langdugumba *60 4.04
Subtotal 19 1514 10,073.75 Registered & in process Bargaon 73 *160 8,4,2,9
of being handed over Shreedevigora 54 *600 1,3,4,6,8,9,2,5,11 Subtotal 2 127 760
Additional Handover Thehe *262 *500 4,2,1,3,8,9 Planned for Dojam *63 *1500 1,3,8,9,2,6,7,5,11,10
1999 Bargaon Sajha3 *149 517.82 8,4,3,1,2,9 Subtotal 3 325 2,517.82
Grand Total 24 1,966 13,351.57
Notes: 1. Codes for NTFPs are 1=Jatamansi; 2=Morel mushroom; 3=Kutki; 4=Atis; 5=Sugandhwal; 6=Padamchal; 7=Panchaule; 8=Juniper; 9=Sunpati; 10=Silajit;11=Bajadi; 2. Karang community forest user group was formed but later the group discussed with Mauri FUG and decided to be merged with Mauri FUG when Mauri FUG accepted all the Households as primary users. 3. Households already included in other FUG 4. Number of households and areas marked * are estimates
2. Threat Reduction The top threats to biological diversity were reassessed at the end of the project period. Communities and project staff estimated what percentage of the threat was mitigated during
Biological Monitoring Report of Humla Project36

the project period using the same criteria from the baseline study. These criteria reflect the change in area being threatened as well as the intensity of the threat. Table 19 presents the changes in the status of the threats as perceived by those surveyed. A threat reduction assessment index was then expressed in percentage of threat mitigated. For example if the baseline gave a score of 18 and the Project ending survey estimated 85% of the threat mitigated then the raw score would be 18x0.85 or 15.3.
Taking a simple average of scores for the six threats identified, the threat reduction index is 54%, in other words it is perceived that 54% of the threats have been mitigated through the project activities. Given the limitations of the scope of the biological monitoring activities, it was not possible to inspect each community forest and collect detailed quantifiable data for every threat category. Still there are several interesting observations, but most importantly an increased awareness among community members with regards to threats and what can be done to mitigate them. This information has then been incorporated into the community forest management plans that are required under the FUG agreements with the Government of Nepal. The DFOs are now working with the communities to help ensure that plans are adhered to.
The threat reduction index indicates that the perception is that the project had more success in meeting threats from burning of forest/pasture and slash-and-burn farming than those from over harvesting, grazing, and poaching activities. In fact, the practice of burning was stopped in the community of Rodikot, Raya and Thali. The hope is that this community led model will be adopted by its neighbors as collectors see for themselves the increased biological and social benefits of not burning.
A bit surprising is that uncontrolled harvesting of NTFPs threat received a relatively low score (only 35% of threat mitigated), when this was the focus of the project. For this threat, substantial amounts of detailed field data were collected and can be compared against the perceptions. Based on the biological data, the main commercial NTFPs are actually found in large quantities and less than 1% of the available stock has been harvested (see Table 16). Biologically there are still large volumes of the main commercial NTFPs in the project area, but they are not necessarily easily accessible to communities.
The project also documented that it was the method and time of harvest that were causing the most damage to regeneration in contrast to the amount harvested. It is therefore more accurate to say that inappropriate harvesting, rather than overharvesting is threat. As more FUGs are formed there will be an additional incentive to better manage the NTFPs found in their areas as FUGs will be more restricted in where they can harvest. As communities are becoming better educated on appropriate harvesting methods, we would hope to see this threat decrease.
Finally, it was perceived that 50% of the threat from unmanaged harvesting of timber, fodder, and fuel wood was mitigated by the project. The project was not able to study in detail the change in the amount of timber, fodder, and fuel wood harvested. We do know that the project itself has created an additional annual demand of 47 tons, 80 tons, 110 tons, and 100 tons of fuel wood for processing activities in 1994/95, 1995/96, 1996/97, and 1997/98, respectively. Our guess is that since
communities now have more control over their resources due to the FUG process, that they can restrict unmanaged harvesting from outsiders more effectively and therefore perceive that the threat is being mitigated. Further quantitative and changes in harvesting methods studies would be needed to document the full biological impact. Bio log ica l Moni tor ing Repor t o f Humla Pro jec t
37

Table 19. The Project Impacts on Reducing the Threats to the Biodiversity in Humla Project Sites
Threats Area
Ranking Intensity Ranking
Urgency Ranking
Project Feasibility
Total Ranking
Threats Met
Raw Score
Burning of forest/pastures
4
5
5
4
18
85%
15.3
Uncontrolled harvesting of NTFPs
5 3 4 6 18 35% 6.3
Slash and burn farming
2 6 6 3 17 80% 13.6
Unmanaged harvesting of timber, fodder & firewood
3 4 3 5 15 50% 7.5
Over grazing
6 2 2 2 13 20% 2.6
Poaching
1 1 1 1 4 15% 0.6
Total 85 54% 45.9
Explanation of Threats Burning of forest/pastures: Forests and pastures burning deteriorating the plants and site quality.
Uncontrolled harvesting of NTFPs: Harvesting of non-timber forest products exceeding normal yield or improper method of harvesting destroyed the regeneration potentiality.
Slash and burn farming: Expansion of agricultural land or shifting cultivation by slashing the forest products and burning it.
Unmanaged harvesting of timber, fodder, and firewood: Harvesting of timber, fodder, and firewood exceeding normal yield or improper method of harvesting destroying the regeneration potentiality.
Over grazing: Grazing without consideration for regeneration and growth of plants.
Poaching: Illegal hunting of wild animals.
3. Documentation of Sustainable Harvesting Practices A tangible result of the biological monitoring is the detailed documentation for sustainable harvesting practices for selected commercial NTFPs. While the detailed studies were only done for a few NTFPs, the methodology is now tested and documented so that it can be more easily done for other products. Another important aspect of the documentation on sustainable harvesting practices is the emphasis on methods and timing of extraction. Previous emphasis was on amount harvested. But as has been noted earlier, the amount harvested was not the most critical factor in instituting sustainable harvesting practices. Table 20 gives a summary of the recommended optimal harvesting practices for selected NTFPs as determined from the biological field research and studies completed in Humla.
Biological Monitoring Report of Humla Project38

Table 20. Recommended Optimal Harvesting Practices for Sustainable NTFP Use
Plant Species and Parts Harvested
Optimal Harvest Season
Optimal Rotational
Interval
Optimal percentage of
plant not harvested
Optimal harvesting
method
Jatamansi (rhizomes)
Fall 5 years 20% plants undisturbed
Whole plants pulled from bushy areas and dug out carefully with prescribed tool (kuto) from open grasslands.
Kutki (rhizomes and roots)
Fall 3-5 years 20% of plants undisturbed
Plant is dug out with kuto or hand picked if rhizome is long.
Sunpati (leaves)
? 1 year 30% of leaves left on plant
Leaves handpicked or cut with scissors.
4. Adoption of Conservation Practices There have been several promising trends in the area of adoption of conservation practices. Since these practices are new to the communities, we are not yet able to provide quantitative environmental impacts that are tied to the practices, yet are encouraged that the following sustainable practices have been adopted by some villages in the project area with positive economic and environmental results.
• Reduced pasture burning in the major NTFP collection areas;
• Implementation of rotational harvesting and enforcement of group collection practices at the village level;
• Institutionalization of rules and regulations and effective policing by FUGs; and
• Initiation of biological and social monitoring of harvesting practices by FUGs. These experiences serve as solid models for other communities and we would expect to see more communities adopting the conservation practices in the future. The main vehicle for communicating the conservation practices was the integrated conservation education and training through literacy programs and specialized conservation publications. As a result, local communities have adopted several conservation practices. From the socio-economic monitoring we were able to document that adult literacy increased by 47% in the project area
Bio log ica l Moni tor ing Repor t o f Humla Pro jec t
39

because of these classes. This increased literacy along with community led adoption should make expansion of the conservation practices easier in the future.
X. CONCLUSIONS While there is still much to learn and document on the biological aspects of this project, we are encouraged by the level of community involvement and interest in conservation. After completion of the BCN supported project all partners will continue to carry out similar activities in the project area and beyond.
• FUGs will be implementing their management plans and coordinating with the district and national level Community Forest User Group federations.
• Humla Oil Pvt. Ltd. will continue processing and marketing activities - reaching out directly to service buyers in Nepal/India and through their agents in the USA and Europe.
• Humla Conservation and Development Association (HCDA) has received financial help from the Karnali Local Development Program (supported by the Dutch Government) to continue providing support to FUGs and assist other groups to establish natural products based enterprises in Humla and the neighboring districts of the Karnali Zone.
• ANSAB will refine and deliver biological monitoring, CF support, and business development services to other NGOs and community based groups using the lessons learned from the BCN project.
• EnterpriseWorks Worldwide (formerly ATI) will continue to work with ANSAB to source funds and develop programs that apply the similar approach across Nepal as well as use the lessons learned to assist natural products processors around the world.
The investment by BCN in the Humla project will therefore continue to produce environmental, social, and economic benefits for the people of Humla as well as help other groups in Nepal and around the world.
Biological Monitoring Report of Humla Project40

XI. REFERENCES Chopra & Ghosh. 1934. India J. med.\Res. 1934-35. 22(263)
CSIR. 1972. Wealth of India. A dictionary of Indian raw material and industrial products. Raw material.
Edwards, D.M. 1996. Non-timber Forest Products from Nepal: Aspects of the Trade in Medicinal and Aromatic Plants. Forest Research and Survey Center, Ministry of Forests and Soil Conservation, Babarmahal, Kathmandu.
Hara et al 1982. Enumeration of Flowering Plants of Nepal. vol 3.
HMG/Nepal, 1970. Medicinal Plants of Nepal. Ministry of Forests and Soil Conservation, Department of Medicinal Plants, Thapathali, Kathmandu, Nepal.
HMG/Nepal, 1976. Catalog of Nepalese Vascular Plants. Ministry of Forest, Department of Medicinal Plants, Thapathali, Kathmandu, Nepal.
MFSC/HMG 1987. Medicinal Plants Collection, Protection and Conservation Process. HMG/MFSC, Thapathali, Kathmandu.
Polunin, Oleg and Stainton, Adam 1984. Flowers of the Himalaya. Oxford University Press, Delhi.
Shrestha, T.B. and Joshi, R.M., 1996. Rare, endemic, and endangered plants of Nepal. WWF Nepal Program, Kathmandu, Nepal.
Subedi, B.P. 1997. Utilization of non-timber forest products: issues and strategies for environmental conservation and economic development. Theme paper presented in the National Workshop on "Utilization of NTFPs for Environmental Conservation and Economic Development in Nepal,” March 29, 1997, Kathmandu.
Subedi, B.P. 1998. Participatory utilization and conservation of medicinal and aromatic plants: A case from western Nepal Himalaya. Paper presented in the International Conference on Medicinal Plants, February 16-19, 1998, Bangalore, India.
Subedi, B.P. and N.K. Bhattarai. 1998. Community managed enterprise: participation of rural people in medicinal and aromatic plants conservation and use. Paper presented in the International Conference on Medicinal Plants, February 16-19, 1998, Bangalore, India.
Bio log ica l Moni tor ing Repor t o f Humla Pro jec t
41