monitoring of batch dyeing with flow injection analysis ... · i fia background - def.- r & h...
TRANSCRIPT

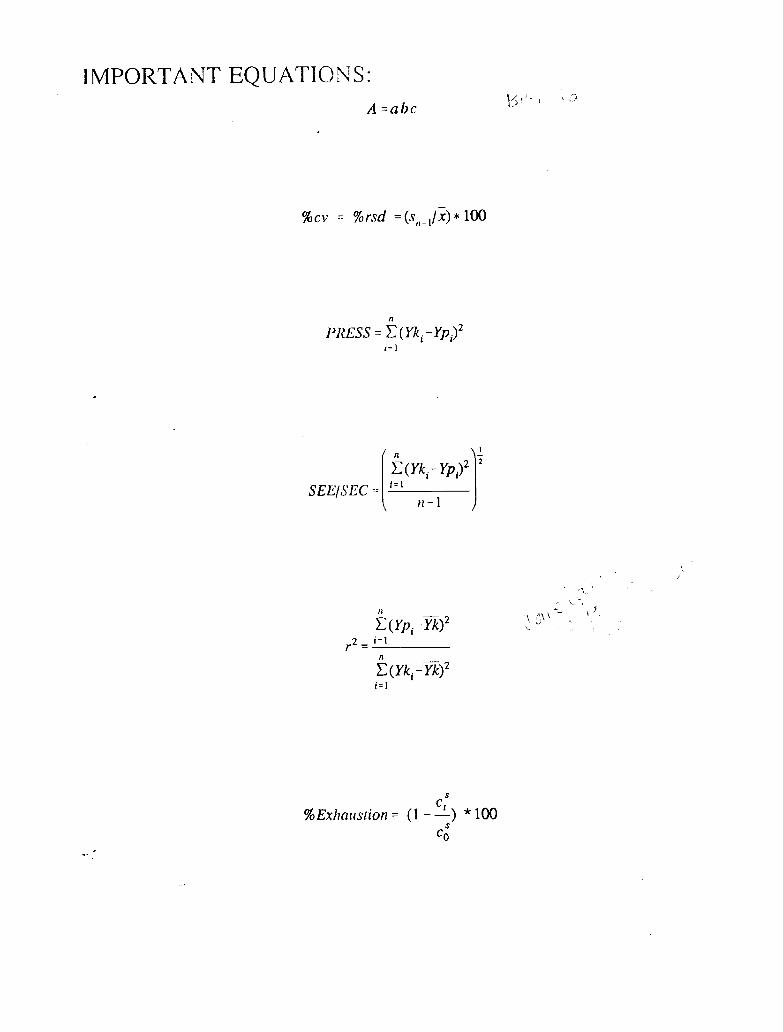
IMPORTANT EQUATIONS: A =abc
n
PRESS = c (Yk, - YpJ2 i - 1
n c ( Yp, -rky 2 - i = l r -
n
C ( Y k , -Riy i = 1
\ c\\ -- . \ )
Ct”
co“ %Exhaitstion = (1 - -) * 100

Bul I., Dyeinqs 300 kg (661 Ibs) , cones 1 1 , p a c k a g e dyeing Relative Cost units or knitgoods in jeLs, 2 shifts
% Blind dyeing' ("no add") = 100
Shading and sampling ( "add" ) 12 - 49 %
o_ Sampling (without addition) 4 - 8
Redyeing ("rework") 98 - 169 %
4 blind dyeing, or one without sampling, is the reference.
TABLE 1.2 Comparison between DDAS and FIP systems. ' -
FIA w/DAD DDAS - Precision of Absorbance ( ' : CV) .0269 .25/. 4 6
Dynamic concentration rfirigt ' I iiriits 0.05-2.0g/L 0.05-3.0g/L of detector
Time for measurement 15 s < 5 s -
Solubility of dyes which m a y be studied
Sensitive to changes in p i 1 dnd high concentration
H,O only water and solvent;
possibly v a t and pigment
Yes no
_ _
PI 1) Buffer \
w M
. Dyebath
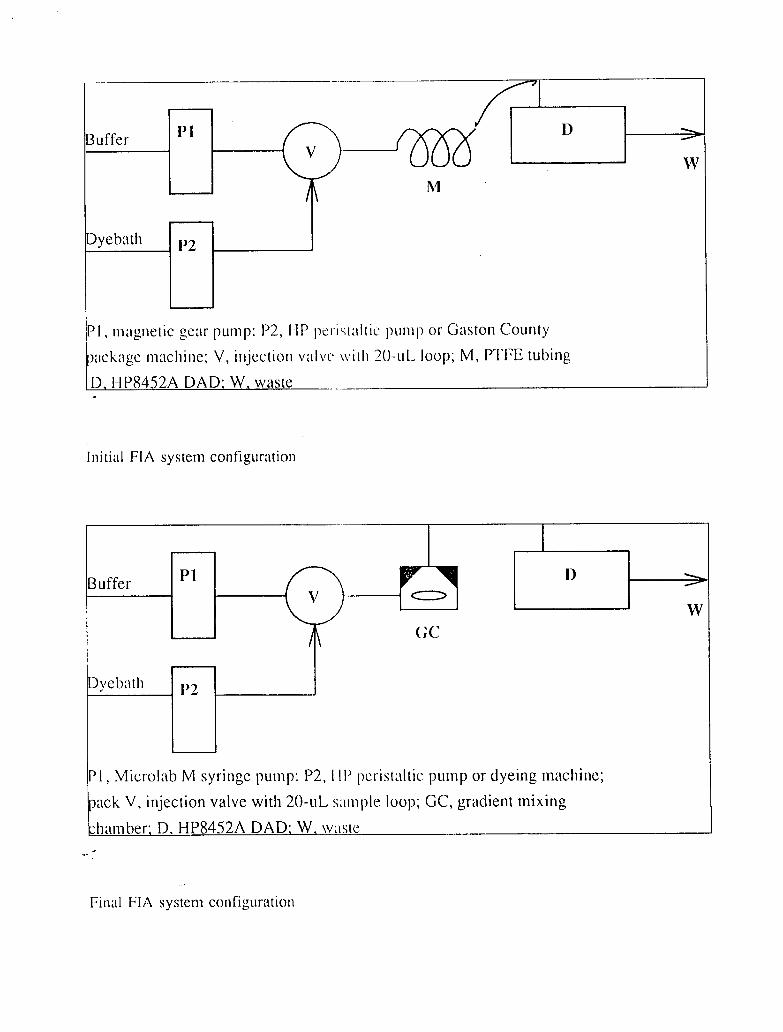
P I , inagiletic gear punip: P2, I I P 1x1 i,l;illic piimp or Gaston County pncknge innchine; V , injection valve. \\ , i l l i 20-uL loop; M, ITFE tubing D, I-IP8452A DAD: W. waste -
I n i t i a l FIA system configuration
Buffer P1 0 0 (;c
Dpebatli
P I , h4icroInb M syringe pump: P2, f I I ’ pcrisldtic p i m p or dyeing tnachine; xick V , injection valve with 20-uL s m p l e loop; GC, gradient mixing chamber: D. HP8452A DAD: W, w : ~ e
Final FIA system configuration

1’1 S V
P I , Microlab M syringe Pump; \ I , iiijeclioii valve; SVI, serial
valve interface; PC, microconyglcr; 11, MP8452A DAD
D
FIA system -microprocessor iiiterfiicc
..
> Fill syringe - Star[ tI;ilil - Dispense - ii c (1 11 is i I io 11
AS P2 DISPENS2 buffer
Inject dye sample VALVEINJ
I A
Pump wash cycle
VALVERT 4 S PI RATE WASH -
VALVELFT
Valve go l o load
VALVLOAD
Collect Data
FIA control loop

I
I n i t l a 1 F I A system optiI!i 1 jt 1 0 1 1
\"'
.7842 33.6 85.1
1.6138 35.8 87.4
~ ~~~ -~
Pump Type ~ 1 Peak (-Peak 1 Peak I Peak 1 Peak 1 Tail mean stddev %rsd mean stddev % r s d
magnetic gear .257 9 .0071 2.77
.2914 .0019 0.66
dual piston .3042 .0054 1.78 .lo74 .0029 2.72
.0015 0.27 .0606 .0004 0.73
Variance in precision wiL 1 1 (:\7cIe time
Cycle Peak Peak Peak Tail Tail Tail time mean s t d ci -. 7"' r y d mean stddev %rsd
( S )
0.5 .08382 . 001)-<0 0.47 .01007 .00049 4.87
0.6 .08401 . o o o _(9 0.46 .01017 .00019 1.87
0.7 .08571 .OO( 46 0.54 .01042 .00096 9.21
0.8 .08878 .0@13 1.46 .01128 .00071 6.29 I
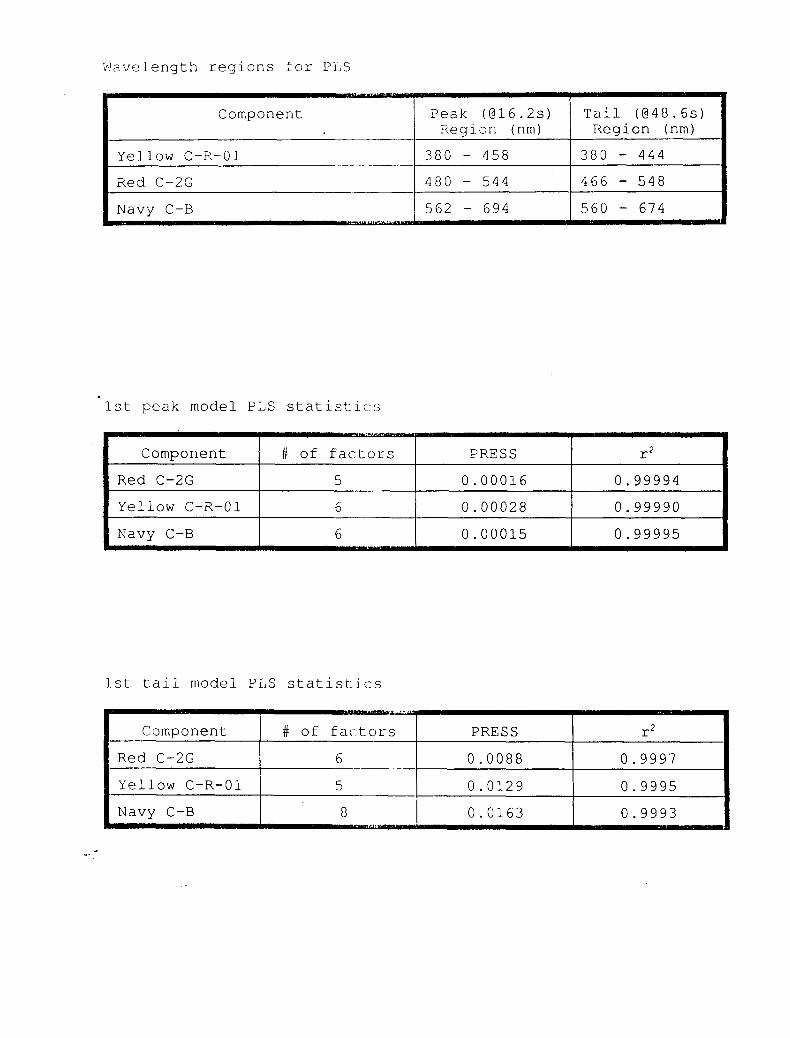
Wavelength r e g i o n s f o r Pi ,S
Component
Red C-2G
Yellow C-R-01
Navy C-B
Component Peak ( G 1 6 . 2 ~ ) T a i l (Q48.6~) Region (nm) Region (nm)
380 - 458 380 - 444 Yellow C-P,-01
Red C-2G 480 - 544 466 - 548 ____.
# of f a c t o r s PRESS r2
5 0.00016 0.99994
6 0.00028 0.99990
6 0.00015 0.99995
i 562 - 694 I 5 6 0 - 6 7 4
Comporien t
Red C-2G
Yellow C-R-01
Navy C-B
1s t peak model P L S s t a t i s t i . c : s
# of f a c . t o r s PRESS r2
6 0.0088 0.9997
5 0.0129 0.9995
8 0.0163 0.9993
1st t a i l model PLS s t a t i s t : i cs

I
1st p e a k model v a l i d a t ion < - I . I ( i :;I i c s
P r e d i c t e d COI-IC. (g/L) I------ 0.100
C o m p o n e r i t A c t u a l ( ' r I ( _ .
( g / I J ) -
R e d C-2G . LUUC)
Yellow C-R-01
Navv C-B . 0 0 0 0 1.000
. ---c Yel low C-R-01
N ~ V V C-B 0 . 1 0 0 0.102
I . o o o 0 . 9 9 2 i ci.100 0.106
R e d C-2G
Y e l l o w C-R-01
Navv C-B I 0 . 1 0 0 I 0.104
R e d C-2G I 1 . o o o I 1.004
Y e l l o w C-R-01
Navv C-B 1 . o o o
--- -I 0.100 I 0.100 R e d C-2G I
Yellow C-R-01 I 1 . o o o I 0.999
Navy C-B I 0 . 1 0 0 I 0 . 0 9 7
% R e l a t i v e e r r o r
-0.5
-0.1
0 . 0
2 . 0
- 0 . 3
2 . 0
-0.8
6.0
4.0
0.4
- 2 . 0
0.2
0.0
-0.1
- 3 . 0
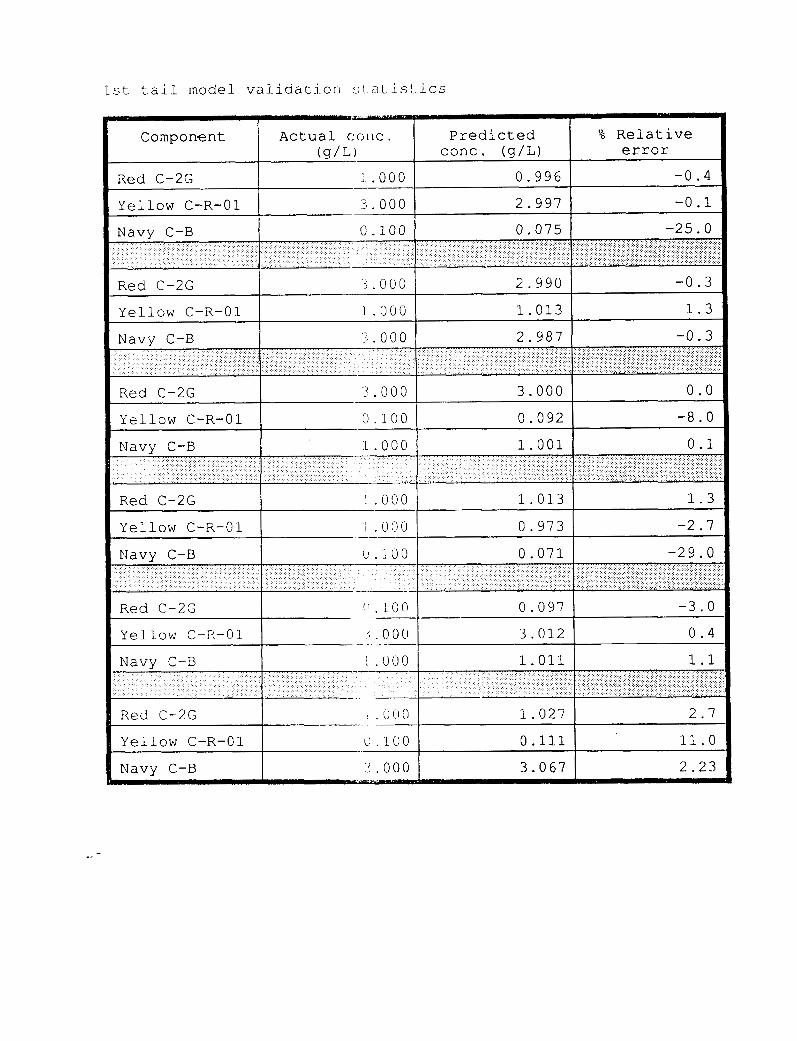
1st tail model validation :;I a t istics
Compo ne n t Actual C : ( J I I C . Predicted S Relative (g/L) conc. (g/L) error -----I- Red C-2G : . o o o 0.996 -0.4
3.000 2.997 -0.1 I
- Yellow C-R-01 I I
Red C-2G 5.000 I 2.990 I -0.3 , I
Yellow C-R-01 1 .000 1.013 1.3
N ~ V V C-B ‘ I . 000 2.987 -0.3
Red C-2G I 3.000 I 3.000 I 0.0
Yellow C-R-01 0.100 0.092 -8.0
Navy C-B .I . o o o 1.001 0.1 I Red C-2G 1 i . O O O 1 1.013 1 Yellow C-R-01 i . I) (! 0 0.973
Navv C-B 0 . 1 0 0 0.071 -29.0
-: :: _____
I Red C - 2 G 1 -(I. 100 1 (I:):; I Yellow C-R-01
Navy C-B ! . o o o 1.011 -1:: ” . 0 0 I) --. ___
I Red C - 2 G 1 I .U110 1 ; A:: i!ii Yellow C-R-01 c’ . L (J 0
Navy C-B 2 . o o o 3.067

Color differences f o r va 1 it-lat.ion mixtures with large relative errors
Sample (%re1 error - R , Y , N )
tail1 (-.4, - . 1, -25) tail2 (2.7,11 .O, 2.2) tail3 (0.0,-8.0, .1)
tail4 (1.3,-2.7,-29)
peak5 (-.80,6.0,4.0)
tail6 (-3.0, .40,1.1)
',> dye strength DEcmc
101.9 2.083
97.9 0.27
100.1 0.06
104.3 2.44
99.3 0.31
99.5 0.12
_ -
__
_ _

I
PLS s t a t i s t i c s for 2nd ca! : i ) ~ a t i o n models
C orripo n e n t Opt: imuin 11 (1 € PRESS r2 facLLzl :'
Red C-2G 0.0024 0.9987
Yellow C-R-01 0.0394 0.9733
Navv C-B 0.0015 0.9991
TAIL model-exp (28 mixt u rcs ) -
Red C-2G 3 0.0060 0.9997
Yellow C-R-01 3 0.0070 0.9996
I Navy C-B I 3 I 0.0070 I 0.9997

I
Validation statistics for :!lid peak model
Component I Actual C.C~I?C . Predicted % Relative conc. (g/L) error (g/I . ,
0.00 0 . 0 7 7 6 7 - 2 . 9 1 Red C-2G
Yellow C-R-01 (1.45 0 . 4 3 1 3 7 - 4 . 1 4
Navv C-B 0 . 6 3 0 . 6 3 1 5 7 0 . 2 5
-
Red C-2G 0 . 0 8 0 . 0 7 6 6 8 -4.15
Yellow C-R-01 0.63 0 . 6 2 0 5 6 -1.50
Navv C-B I 0.08 I 0 . 0 6 8 7 6 I - 1 4 . 0 5
Red C-2G 0. 63 0 . 6 4 1 8 9 1 . 8 9
Yellow C-R-01 c j . 2 6 0 . 2 4 8 8 3 - 4 . 3 0
Navv C-B I 0.08 I 0 . 0 7 4 7 0 I - 6 . 6 2
0.45 0 . 4 5 3 2 5 0 . 7 2 Red C-2G
Yellow C-R-01 u . 132 0 . 8 1 0 3 4 - 1 . 1 0
Navy C-B li . c, 2 0 . 8 3 2 8 9 1 . 5 7
.-
SEE/:> ' RMSD r2 ____- Component
Red C-2G 0. v o 749 0 . 0 0 6 4 9 0 . 9 9 9 2 6
0.014'7G 0 . 0 1 2 7 9 0 . 9 9 6 2 2 Yellow C-R-01
Navy C-B 0.01 037 0 . 0 0 8 9 9 0 . 9 9 9 2 5 -
I
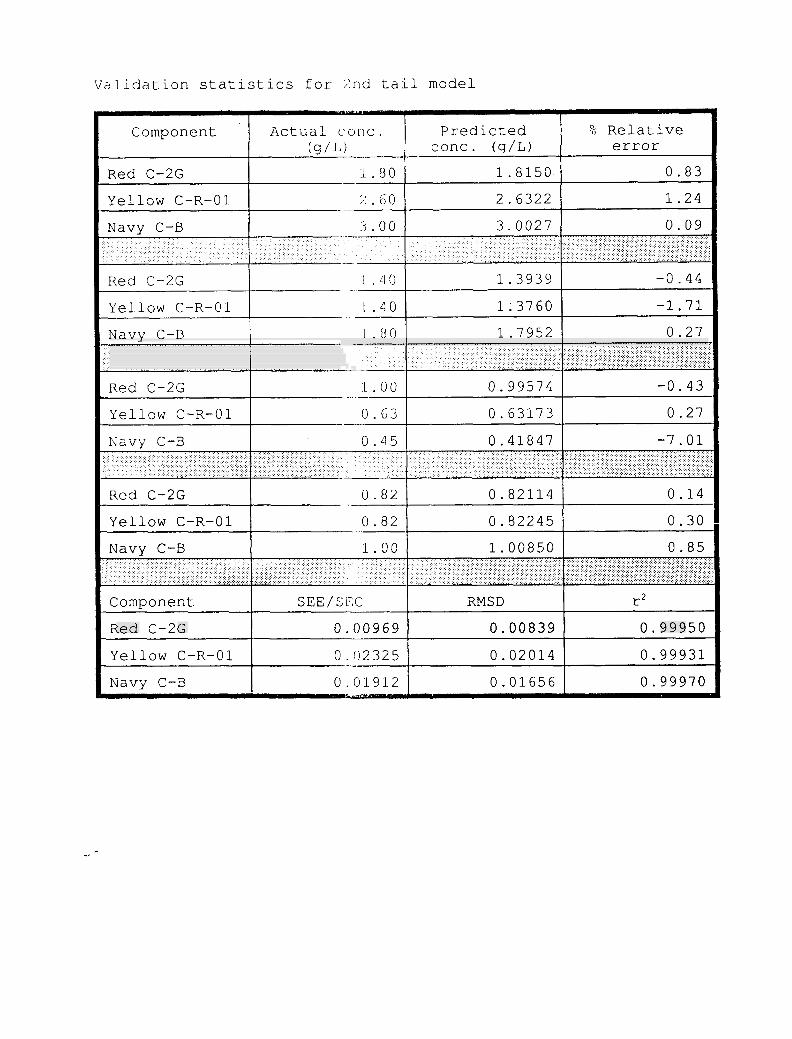
Validation statistics for 2nd tail model
Component A c t u a l c-onc. Predicted % Relative conc. (g/L) error ( g / u -
1.80 1 . 8 1 5 0 0 . 8 3 Red C-2G Yellow C-R-01 ' I . GO 2 . 6 3 2 2 1 . 2 4
Navv C-B 3 . 0 0 2 7 0.09
-
Red C-2G 1.40 1 . 3 9 3 9 - 0 . 4 4 I- N a v v C-B I . tc0 1 . 7 9 5 2 0 . 2 7
Yellow C-R-O1 I .40 1 . 3 7 6 0 - 1 . 7 1
--: A - . -
L . 0 0 0 . 9 9 5 7 4 - 0 . 4 3 Red C-2G
Yellow C-R-01 0 . G3 0 . 6 3 1 7 3 0 . 2 7 - . -
Navv C-B I 0 . 4 5 I 0 . 4 1 8 4 7 1 - 7 . 0 1
Red C-2G I 0 . 8 2 I 0 . 8 2 1 1 4 I 0 . 1 4
Yellow C-R-01 I 0 . 8 2 I 0 . 8 2 2 4 5 1 0 . 3 0
Navv C-B I 1 . 0 0 I 1 . 0 0 8 5 0 1 0.85
' Red C-2G 0.99950 , Yellow C-R-01 0. 9 2 3 2 5 0 . 0 2 0 1 4 0.99931
Navy C-B 0.01912 0 . 0 1 6 5 6 0.99970

F o r m u l a t i o n s f o r package ~ l , ~ e i n y
C o l o r pkg . wt : D ; . i - c ; o ~ ~ c . (q/L) (Files) bath vol: ( " owf ) I 1iq.ratio
C o l o r pkg . wt : D ; . i - c ; o ~ ~ c . (q/L) (Files) bath vol: ( " owf )
1iq.ratio
navy 1092.2 g: O.4bl-R (0.46;)
1ll.spc) 11.22/1 1.403-N (1.40%) (cnavpl- 12.25 L: 0.24 0-Y (0.2 4 % )
(0.46;) 0.24 0-Y (0.2 4 % ) 1.403-N (1.40%)
c I I
brown 893.2 g: 0.306-R (0.42%) (brownl- 12.00 L: 0 . li 7 3-Y ( 1 .2 0 % ) 100. spc) 13.44/1 0. ;53-N (0.21%)
,burgundy 979.4 g: 3.0~5-R (3.60';)
lO7.spc) 11.76/1 1. i 31-N (1.00%) (brgndl- 11.52 L: 0. ("12-Y (1. 40-:>)
Aux. (9)
10.9- surf 2.18- defoamer
21 .a4 - N a O H
8.9-surf 1200 60.04 1.79- -SA defoamer 24.00
-NaOH
I I I
9.8-surf 1175 57.60 1.96- -SA defoamer 23.04
-NaOH
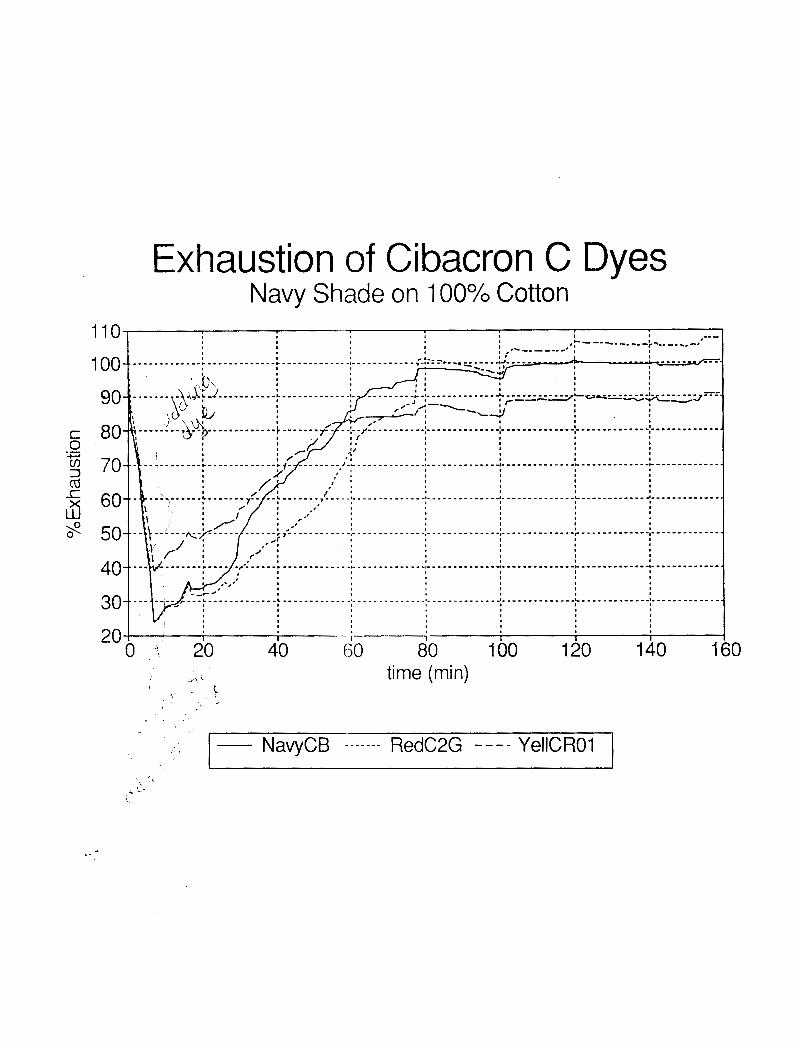
Exhaustion of Cibacron C Dyes Navy Shade on 100°/o Cotton
1
time (min)
I- NavyCB - - - - - - - RedC2G ---- YellCROl I I 1
I I I 1 I I I 30 40 50 60 70 1 0 10 20 20 I
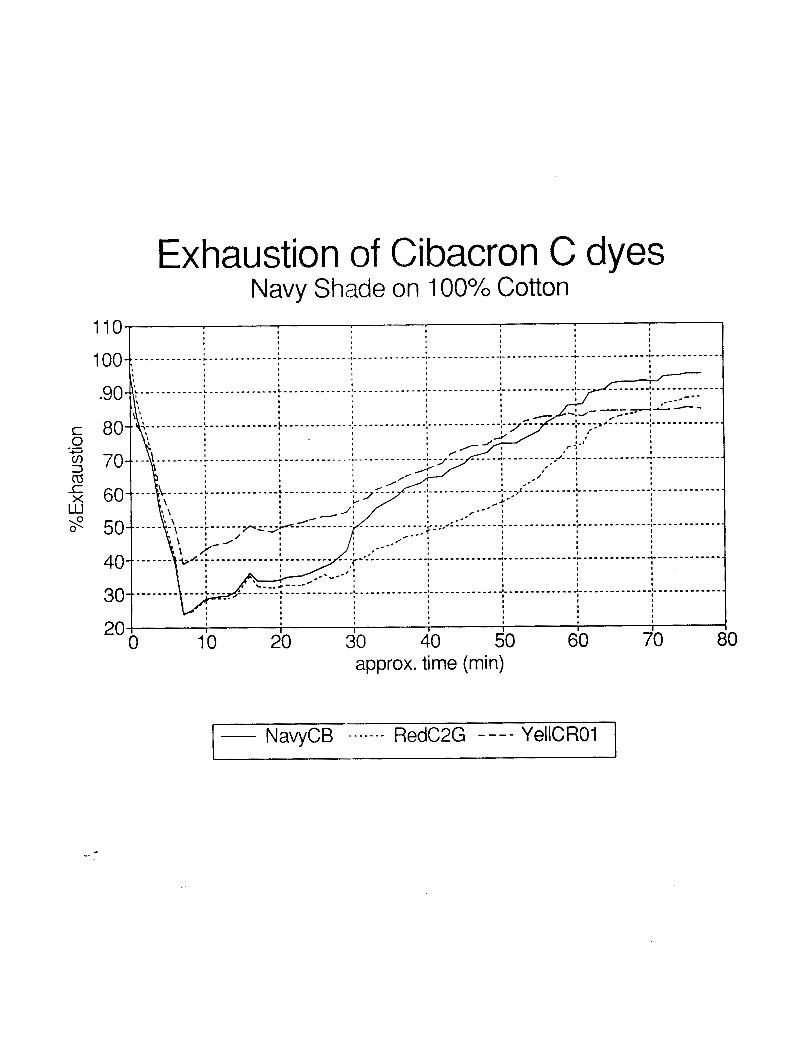
Exhaustion of Cibacron C dyes
0 approx. time (min)
NavyCB - - - - - - - RedC2G - - - - YellCRO1
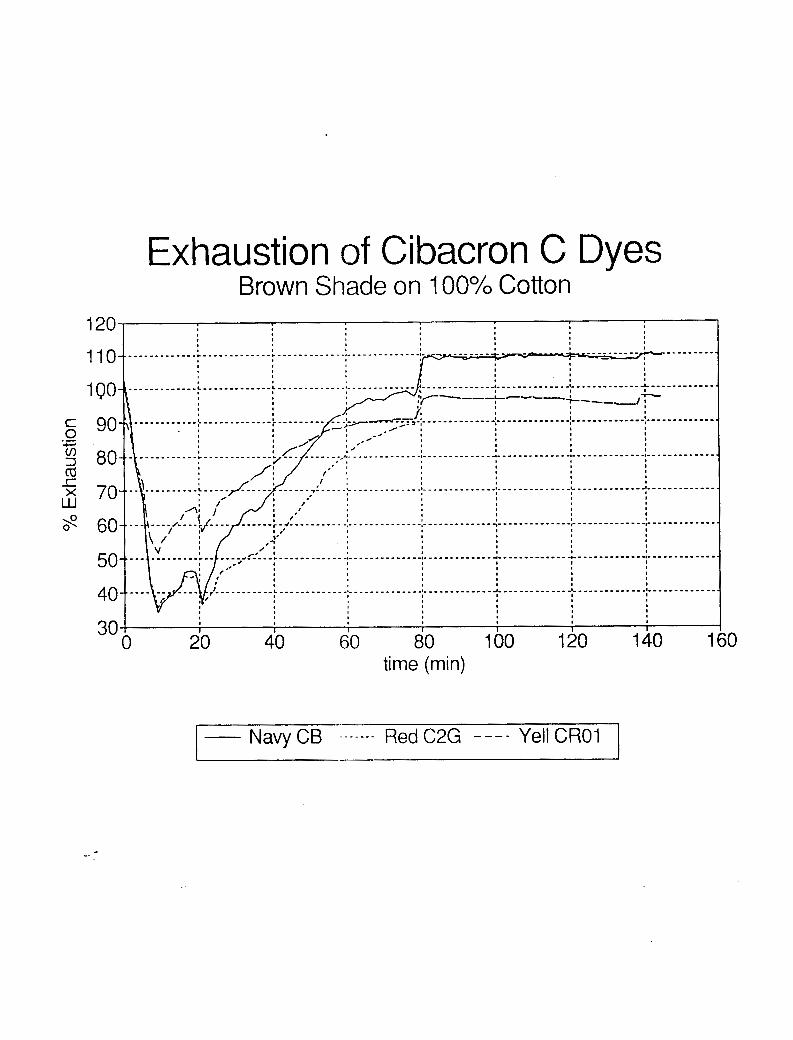
Exhaustion of Cibacron C Dyes Brown Shade on 100% Cotton
time (min)
Navy CB - - - - - - - Red C2G ---- Yell CROI I I
I
110 100 90 80 70 60 50 40 30 20 10 0
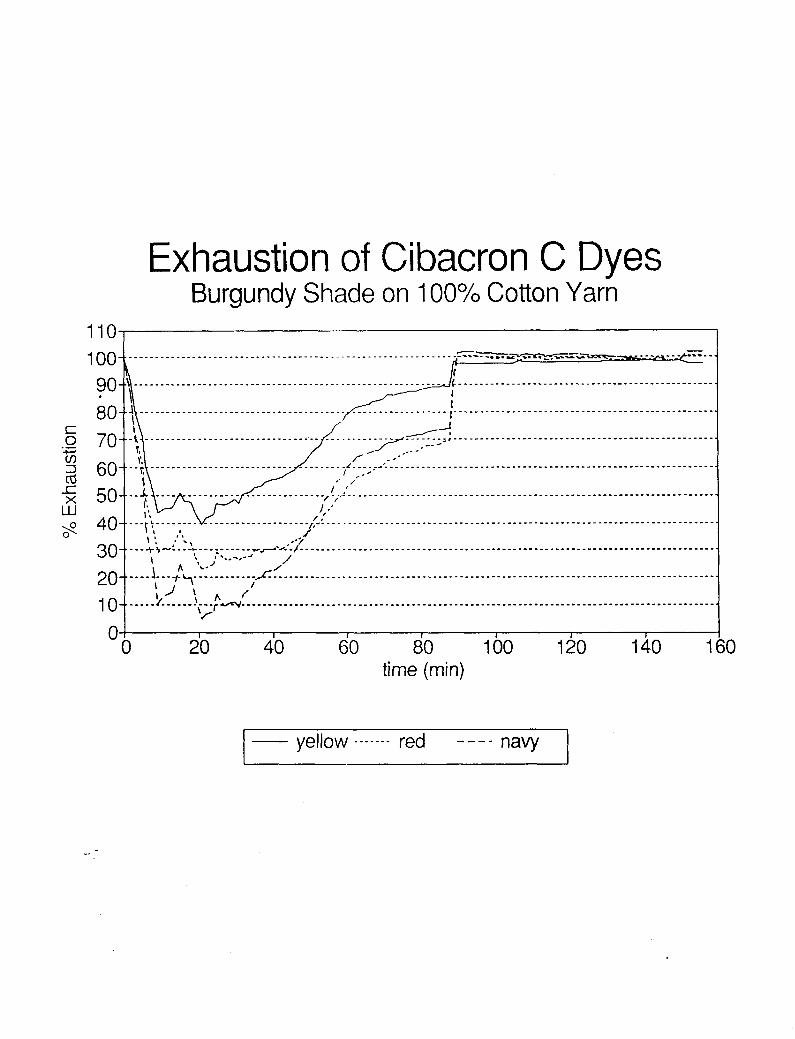
Exhaustion of Cibacron C Dyes Burgundy Shade on 100°/o Cotton Yarn
I I I I I I I
I 20 40 60 80 100 120 140 1 time (min)
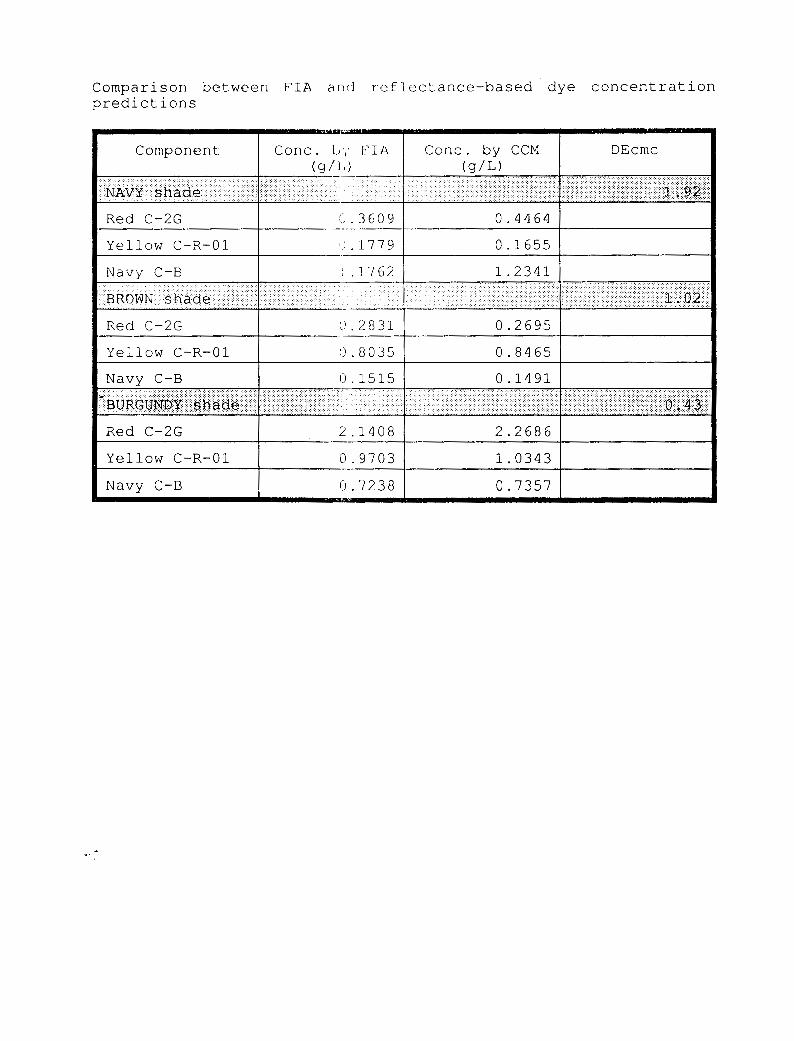
Comparison between FIA arid reflectance-based dye concentration predictions
I Component Conc. 1, ) F I R Conc. by CCM DEcmc
100
90
80
70
60
50
40
30
20
10
0
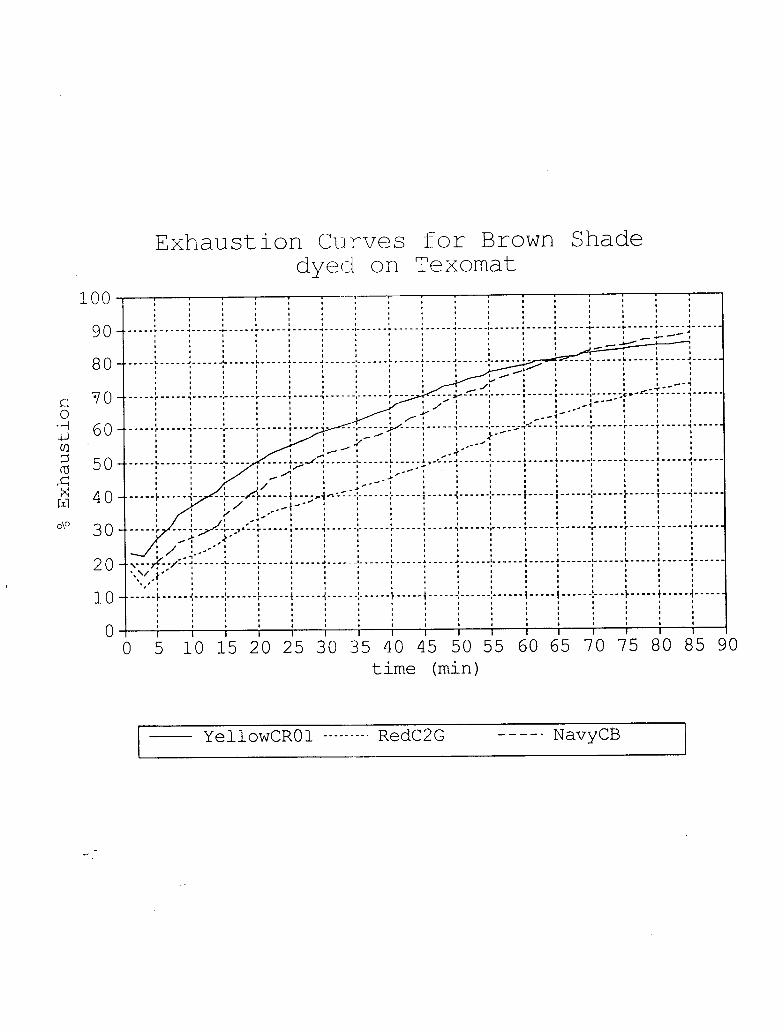
Exhaus t i o n Cii rves f o r Brown Shade d y e d on Texomat
90 time (min)
NavyCB RedC2G _ _ _ - . YellowCROl - - - - - - - - .
100 -
90 -
80 -
7.0 -
60-
50.
40
30
20
10
0
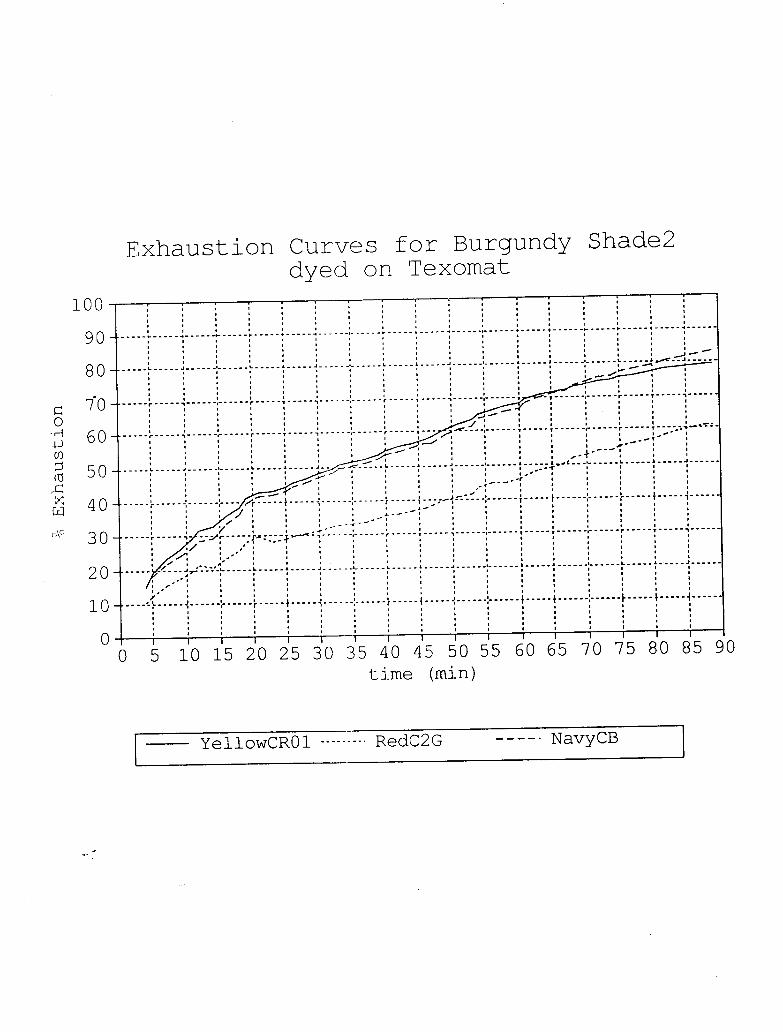
E x h a u s t i o n Curves f o r Burgundy Shade2 dyed on Texomat
90 time (min)
r RedC2G _ - - - . NavyCB YellowCROl - - - - - - - - . I 1

I
FIA Background - def.- R & H define FIA as " A method based on injection of a liquid sample into a moving unsegmented continuous stream of a suitable liquid. The injected sample forms a zone, which is transported toward a detector that continuously records ... [some] physical parameter, as it continuously changes as a result of the passage of sample material through the flow cell." [R&H, 1st ed.]
derivatized, etc. , before measurements occur.
mixing.
timing, and controlled dispersion
every sample
sample may be diluted, preconcentrated, separated,
does not require attaining steady-state or homogeneous
based on three principles - reproducible injection, precise
same sequence of events occurring at same relative time in
concentration gradient is formed in sample zone
Package Dyeing Information Heterobifunctional fiber reactive dyes containing
Gaston County laboratory (l-kg) package machine 11-13: 1 liquor ratio Temp starts at 90 O F ; ramps to 120 O F after soda ash addition
monofluorotriazine and vinyl sulfone reactive groups
I
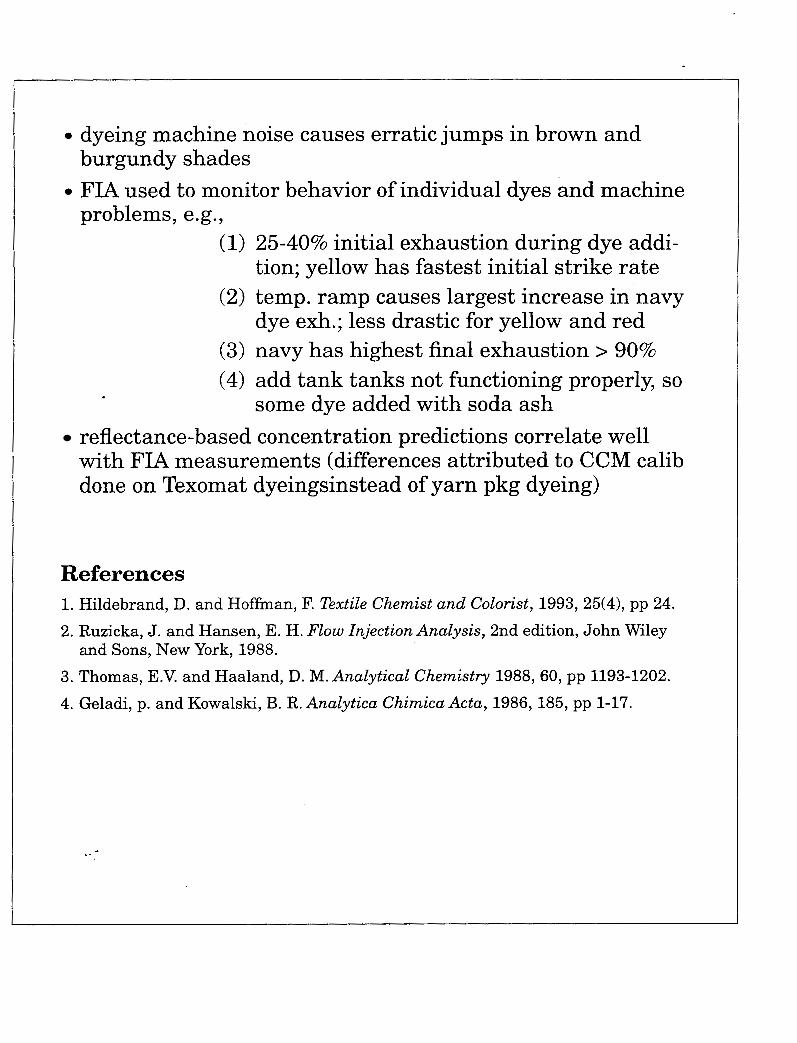
dyeing machine noise causes erratic jumps in brown and
FIA used to monitor behavior of individual dyes and machine
(1) 25-40% initial exhaustion during dye addi- tion; yellow has fastest initial strike rate
(2) temp. ramp causes largest increase in navy dye exh.; less drastic for yellow and red
(3) navy has highest final exhaustion > 90% (4) add tank tanks not functioning properly, so
burgundy shades
problems, e.g.,
some dye added with soda ash reflectance-based concentration predictions correlate well with FIA measurements (differences attributed to CCM calib done on Texomat dyeingsinstead of yarn pkg dyeing)
References 1. Hildebrand, D. and Hoffman, F. Textile Chemist and Colorist, 1993, 25(4), pp 24. 2. Ruzicka, J . and Hansen, E. H. Flow Injection Analysis, 2nd edition, John Wiley
3. Thomas, E.V. and Haaland, D. M. Analytical Chemistry 1988, 60, pp 1193-1202. 4. Geladi, p. and Kowalski, B. R. Analytica Chimica Acta, 1986, 185, pp 1-17.
and Sons, New York, 1988.