monitoring of acoustic emission activity using thin wafer...
TRANSCRIPT
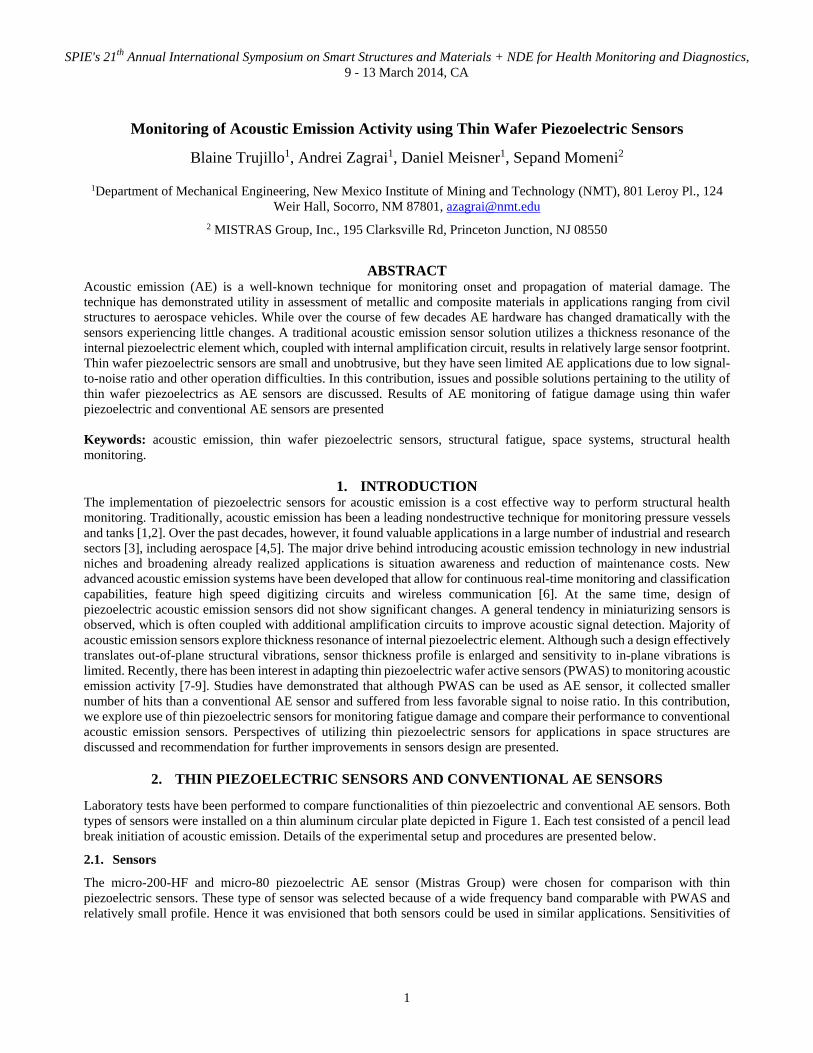
SPIE's 21th Annual International Symposium on Smart Structures and Materials + NDE for Health Monitoring and Diagnostics, 9 - 13 March 2014, CA
Monitoring of Acoustic Emission Activity using Thin Wafer Piezoelectric Sensors
Blaine Trujillo1, Andrei Zagrai1, Daniel Meisner1, Sepand Momeni2
1Department of Mechanical Engineering, New Mexico Institute of Mining and Technology (NMT), 801 Leroy Pl., 124 Weir Hall, Socorro, NM 87801, [email protected]
2 MISTRAS Group, Inc., 195 Clarksville Rd, Princeton Junction, NJ 08550
ABSTRACT
Acoustic emission (AE) is a well-known technique for monitoring onset and propagation of material damage. The technique has demonstrated utility in assessment of metallic and composite materials in applications ranging from civil structures to aerospace vehicles. While over the course of few decades AE hardware has changed dramatically with the sensors experiencing little changes. A traditional acoustic emission sensor solution utilizes a thickness resonance of the internal piezoelectric element which, coupled with internal amplification circuit, results in relatively large sensor footprint. Thin wafer piezoelectric sensors are small and unobtrusive, but they have seen limited AE applications due to low signal-to-noise ratio and other operation difficulties. In this contribution, issues and possible solutions pertaining to the utility of thin wafer piezoelectrics as AE sensors are discussed. Results of AE monitoring of fatigue damage using thin wafer piezoelectric and conventional AE sensors are presented Keywords: acoustic emission, thin wafer piezoelectric sensors, structural fatigue, space systems, structural health monitoring.
1. INTRODUCTION The implementation of piezoelectric sensors for acoustic emission is a cost effective way to perform structural health monitoring. Traditionally, acoustic emission has been a leading nondestructive technique for monitoring pressure vessels and tanks [1,2]. Over the past decades, however, it found valuable applications in a large number of industrial and research sectors [3], including aerospace [4,5]. The major drive behind introducing acoustic emission technology in new industrial niches and broadening already realized applications is situation awareness and reduction of maintenance costs. New advanced acoustic emission systems have been developed that allow for continuous real-time monitoring and classification capabilities, feature high speed digitizing circuits and wireless communication [6]. At the same time, design of piezoelectric acoustic emission sensors did not show significant changes. A general tendency in miniaturizing sensors is observed, which is often coupled with additional amplification circuits to improve acoustic signal detection. Majority of acoustic emission sensors explore thickness resonance of internal piezoelectric element. Although such a design effectively translates out-of-plane structural vibrations, sensor thickness profile is enlarged and sensitivity to in-plane vibrations is limited. Recently, there has been interest in adapting thin piezoelectric wafer active sensors (PWAS) to monitoring acoustic emission activity [7-9]. Studies have demonstrated that although PWAS can be used as AE sensor, it collected smaller number of hits than a conventional AE sensor and suffered from less favorable signal to noise ratio. In this contribution, we explore use of thin piezoelectric sensors for monitoring fatigue damage and compare their performance to conventional acoustic emission sensors. Perspectives of utilizing thin piezoelectric sensors for applications in space structures are discussed and recommendation for further improvements in sensors design are presented.
2. THIN PIEZOELECTRIC SENSORS AND CONVENTIONAL AE SENSORS
Laboratory tests have been performed to compare functionalities of thin piezoelectric and conventional AE sensors. Both types of sensors were installed on a thin aluminum circular plate depicted in Figure 1. Each test consisted of a pencil lead break initiation of acoustic emission. Details of the experimental setup and procedures are presented below.
2.1. Sensors
The micro-200-HF and micro-80 piezoelectric AE sensor (Mistras Group) were chosen for comparison with thin piezoelectric sensors. These type of sensor was selected because of a wide frequency band comparable with PWAS and relatively small profile. Hence it was envisioned that both sensors could be used in similar applications. Sensitivities of
1

micro-200 HF and micro-80 sensors are -72 dB ref V/µbar and -65 dB ref V/µbar respectively. Frequency ranges: 400-1850 kHz and 200-900 kHz. Micro-200-HF and micro-80 sensors were installed on a plate using petroleum jelly.
Thin piezoelectric sensors were circular disks of APC 851 piezoelectric ceramic with UNF (single side access) electrodes. The disks were of 7 mm diameter and 0.25 mm thickness. Cyanoacrylate adhesive was used to install sensors on a plate.
2.2. Experimental setup and procedures
Arrangement of sensors in the experimental setup is depicted in Figure 1b. The micro-200-HF sensor is located farthest right in Figure 1b. The pencil lead break (PLB) was initiated using a 0.7 mm #2 HB mechanical lead pencil. The location of the pencil lead break was at the center of the plate at the site marked A. The distance from the sensor to the break location was 8.5 cm. Although several sensors are seen on a plate, only PWAS and micro-200-HF were used to capture data.
Acoustic emission data were collected using Mistras Micro-II Digital AE System. There was no gain in the parameter setup, but a preamp levels was set to 40 dB for both types of sensor. Lower and upper analog filters were set to 100 kHz and 2 MHz, respectively. The sampling rate was 2 MSPS with a record length of 1K. The pre-trigger in the acoustic emission software was considered 128. The threshold at which a waveform produced by the PLB would be registered as a hit was set to 40 dB. Other software parameters were set to the default values.
The experimental procedure was started by pressing the acquire data button in the software. Once the software was running, the pencil was placed at the designated point at a 45-60° angle with the lead ejected a small amount from the pencil. Applying a force vertically to the pencil resulted in the lead breaks which generated an acoustic wave propagating across an aluminum plate. Upon acquiring the acoustic waveform, the test was
stopped.
2.3. Results of Pencil Lead Break Testing
A total number of 30 pencil lead break tests were performed with the parameters and settings remaining the same for each test. Samples of the waveform produced in PLB test are shown in Figure 2 and Figure 4 for the micro-200-HF and PWAS sensors respectively. Response of micro-200-HF indicates reasonable amplitude of a time-domain response. Examination on the power vs. frequency relationship suggest a slight increase from 0 to 300 kHz with a portion from 600 kHz to at least 1 MHz. The shows low sensitivity to events with frequencies below 100 kHz.
Experimental results for PLB tests indicate noticeable similarities between responses of micro-200-HF and micro-80 conventional AE sensors. The data for the PWAS depicted in Figure 4 is comparable, but not similar to micro-200-HF and micro-80 sensors. PWAS was able to pick up the wave produced during the PLB test, but it shows rather broad frequency content. Two elements are believed to contribute to differences in responses shown in Figure 2 and Figure 4: shielding of the sensor with associated wiring, (b) impedance differences between sensors affecting displayed amplitude and noise levels.
Figure 1 Experimental set-up: (A) PWAS (left) PAC micro-200-HF sensor (right) and (B) aluminum plate with assorted sensors lead pencil break location labeled with A; Micro-80 sensor has a red cable.
2
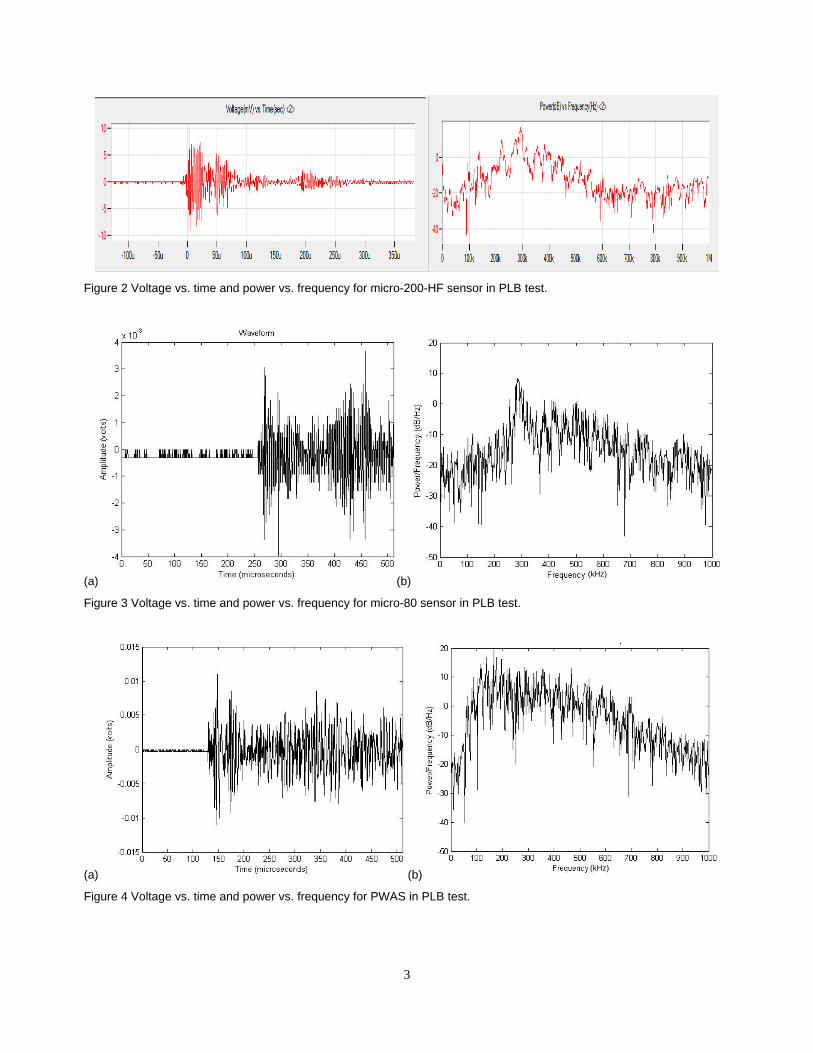
Figure 2 Voltage vs. time and power vs. frequency for micro-200-HF sensor in PLB test.
(a) (b)
Figure 3 Voltage vs. time and power vs. frequency for micro-80 sensor in PLB test.
(a) (b)
Figure 4 Voltage vs. time and power vs. frequency for PWAS in PLB test.
(kHz)
(kHz)
3
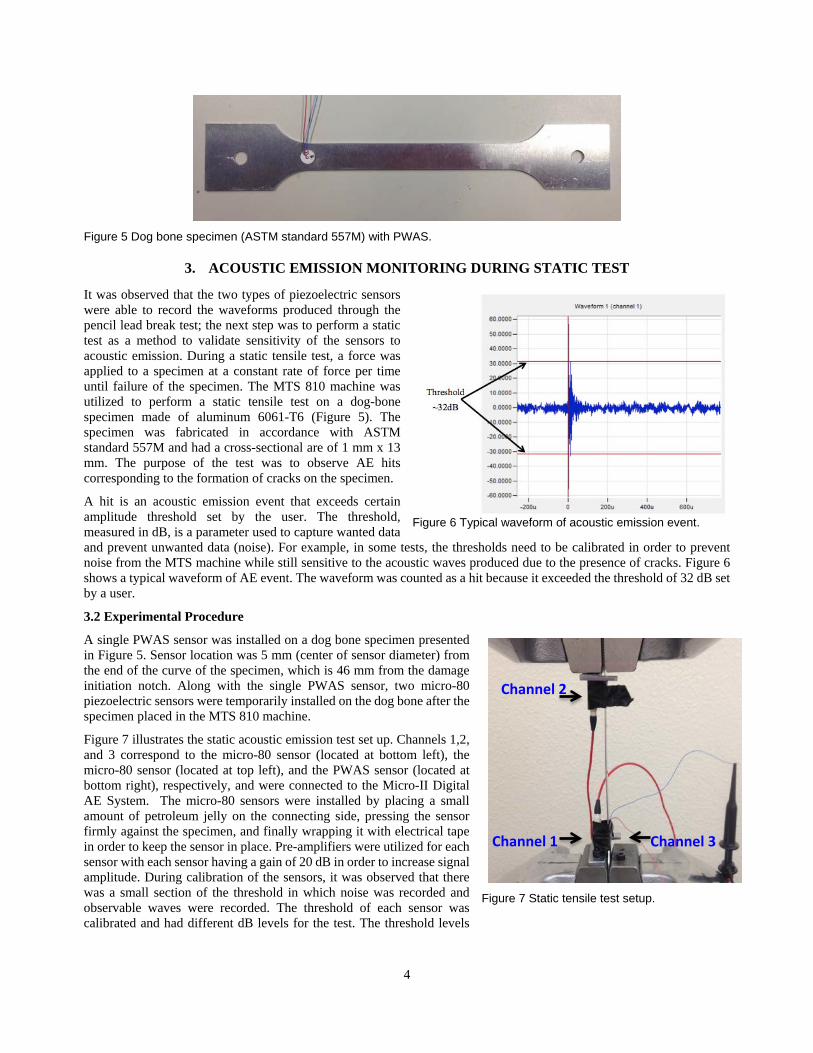
Figure 5 Dog bone specimen (ASTM standard 557M) with PWAS.
3. ACOUSTIC EMISSION MONITORING DURING STATIC TEST
It was observed that the two types of piezoelectric sensors were able to record the waveforms produced through the pencil lead break test; the next step was to perform a static test as a method to validate sensitivity of the sensors to acoustic emission. During a static tensile test, a force was applied to a specimen at a constant rate of force per time until failure of the specimen. The MTS 810 machine was utilized to perform a static tensile test on a dog-bone specimen made of aluminum 6061-T6 (Figure 5). The specimen was fabricated in accordance with ASTM standard 557M and had a cross-sectional are of 1 mm x 13 mm. The purpose of the test was to observe AE hits corresponding to the formation of cracks on the specimen.
A hit is an acoustic emission event that exceeds certain amplitude threshold set by the user. The threshold, measured in dB, is a parameter used to capture wanted data and prevent unwanted data (noise). For example, in some tests, the thresholds need to be calibrated in order to prevent noise from the MTS machine while still sensitive to the acoustic waves produced due to the presence of cracks. Figure 6 shows a typical waveform of AE event. The waveform was counted as a hit because it exceeded the threshold of 32 dB set by a user.
3.2 Experimental Procedure
A single PWAS sensor was installed on a dog bone specimen presented in Figure 5. Sensor location was 5 mm (center of sensor diameter) from the end of the curve of the specimen, which is 46 mm from the damage initiation notch. Along with the single PWAS sensor, two micro-80 piezoelectric sensors were temporarily installed on the dog bone after the specimen placed in the MTS 810 machine.
Figure 7 illustrates the static acoustic emission test set up. Channels 1,2, and 3 correspond to the micro-80 sensor (located at bottom left), the micro-80 sensor (located at top left), and the PWAS sensor (located at bottom right), respectively, and were connected to the Micro-II Digital AE System. The micro-80 sensors were installed by placing a small amount of petroleum jelly on the connecting side, pressing the sensor firmly against the specimen, and finally wrapping it with electrical tape in order to keep the sensor in place. Pre-amplifiers were utilized for each sensor with each sensor having a gain of 20 dB in order to increase signal amplitude. During calibration of the sensors, it was observed that there was a small section of the threshold in which noise was recorded and observable waves were recorded. The threshold of each sensor was calibrated and had different dB levels for the test. The threshold levels
Figure 6 Typical waveform of acoustic emission event.
Figure 7 Static tensile test setup.
Channel 2
Channel 1 Channel 3
4

selected were 63 dB, 55 dB, and 61 dB for channels 1, 2, and 3, respectively. The threshold for channel 1 is of higher value compared to channel 2, because of the noise produced from the bottom clamp from the MTS machine. Once the data was gathered using the software AEwin, the post-processing software, Noesis was used for data analysis.
The MTS machine program was set-up for a static test of the dog bone specimen. The rate at which the force was applied to the specimen was 0.010 kN/sec with a maximum to be applied set to 5 kN. The rate of force applied was chosen to be relatively slow in order to be able to observe the waveforms produced during the development of the cracks. In addition to the piezoelectric sensors, an extensometer were installed onto the specimen located in the center. The extensometer was used to report the change in length of the specimen under the tensile load. During the test, extensometer was removed from the specimen at 2.2 kN, because it was unsure at what point the specimen would fail. The extensometer can’t be on the specimen at failure, because of the damage that can be inflicted onto the sensor.
3.3 Experimental Results
Acoustic emission was monitored during all stages of the test up to specimen’s failure. Specimen was examined at 3.22 kN, but no visual indication of cracks were noticed; however, it failed soon at 3.987 kN. Acoustic emission events recorded during the test are presented on the amplitude vs. time plot presented in Figure 8.
There are a number of hits distributed throughout Figure 8 with most of them clustered towards the end of the test. Examining the statistics of the data using Noesis, there are a large number of hits located in the area of 518-522 seconds. The force at which the specimen failed (3.987kN) would be reached is 398.7 seconds at a rate of 0.010 kN/sec. However, looking at the Figure 6, the test ended at 542.44 second at which point the specimen failed. The extra time is due to the pause of the experiment throughout the test to visually check for the formation of cracks.
Figure 8 Acoustic emission amplitude vs. time during static tensile test.
Crack Propagation Failure
5

(a) (b)
Figure 9 Typical record from Micro-80 sensor: (a) waveform, (b) power spectrum.
Several observations may be inferred from Figure 8. Noticeable number of hits occurs at the beginning of the test when specimen is settled. The settling of specimen is captured by both conventional AE and PWAS sensors. Some acoustic emission activity is reflected in signatures of conventional AE sensors when specimen approaches failure. For these sensors, much more AE activity is noticeable when the crack is formed and specimen is at failure. Also noticeable, amplitudes of AE activity recorded by conventional AE sensors generally grows as strain in specimen increases. Interestingly, PWAS was able to record AE activity in very early stage of straining the specimen. Number of hit and their amplitude recorded by PWAS also grow as crack is formed and specimen fails. Figure 8 indicates that amplitude of AE activities measured with PWAS increases almost linearly (on dB scale) during the static tensile test.
Typical waveform of acoustic emissions during tensile static test are presented in Figure 9 and Figure 10. Examining figures, it is apparent that the waveforms closely resemble one another. However, the Micro-80 sensor captured more of the high frequency content in AE signal. Acoustic emission monitoring during static tensile test demonstrated that both conventional AE sensors and PWAS were able to acquire AE events associated with straining of the specimen. To further validate performance of these sensors, a dynamic test is considered.
(a) (b)
Figure 10 Typical record from PWAS: (a) waveform, (b) power spectrum.
(kHz)
(kHz)
6
4. ACOUSTIC EMISSION MONITORING DURING FATIGUE TEST
As structure undergoes physical changes such as slip deformations, crack propagation, or even corrosion, energy is released, part of which is in the form of acoustic emission [1,3]. Each of the events emitting acoustic emission is given a dB threshold at which to consider the energy as significant, relative to reference voltage. Events above the threshold are characterized as hits, which, in the case of structural health monitoring, usually indicate some form of damage. As hits accumulate within a structure, they reveal information about the specific nature of the changes in the structure.
4.1. Experimental Procedure
To investigate capabilities of the AE system detecting incipient fatigue damage, a series of experiments were conducted in which the acoustic emission was monitored during the entire fatigue process. A Mistras Micro-II Digital AE System was used in collecting the data. Two PAC MICRO-80 sensors were connected to a pre-amplifier with a gain of 38 dB and 35 dB for Ch1 and Ch2, respectively, and were connected to the Micro-II Digital AE System. The two sensors were connected to the sample by first placing a thin layer of petroleum jelly on the connecting end, pressing it against the sample, and then wrapping it with electrical tape to secure the non-permanent bond. After the data was gathered using the software AEwin, the post-processing software, Noesis was used for data analysis.
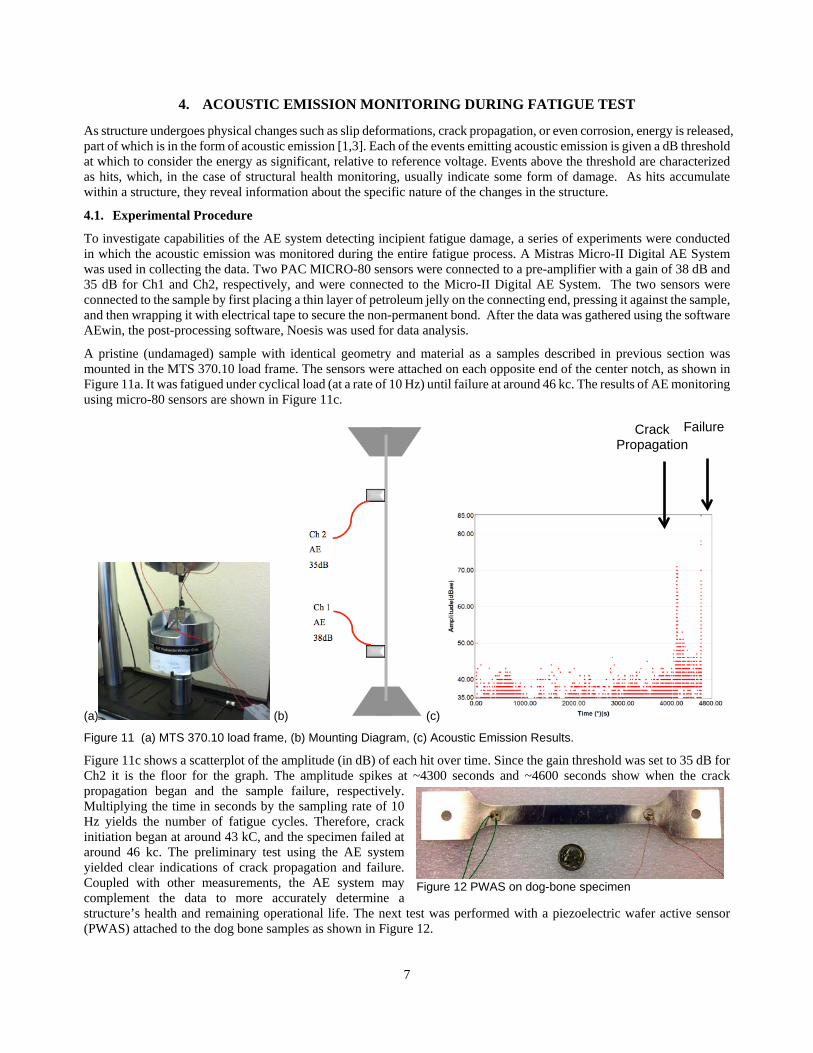
A pristine (undamaged) sample with identical geometry and material as a samples described in previous section was mounted in the MTS 370.10 load frame. The sensors were attached on each opposite end of the center notch, as shown in Figure 11a. It was fatigued under cyclical load (at a rate of 10 Hz) until failure at around 46 kc. The results of AE monitoring using micro-80 sensors are shown in Figure 11c.
(a) (b) (c)
Figure 11 (a) MTS 370.10 load frame, (b) Mounting Diagram, (c) Acoustic Emission Results.
Figure 11c shows a scatterplot of the amplitude (in dB) of each hit over time. Since the gain threshold was set to 35 dB for Ch2 it is the floor for the graph. The amplitude spikes at ~4300 seconds and ~4600 seconds show when the crack propagation began and the sample failure, respectively. Multiplying the time in seconds by the sampling rate of 10 Hz yields the number of fatigue cycles. Therefore, crack initiation began at around 43 kC, and the specimen failed at around 46 kc. The preliminary test using the AE system yielded clear indications of crack propagation and failure. Coupled with other measurements, the AE system may complement the data to more accurately determine a structure’s health and remaining operational life. The next test was performed with a piezoelectric wafer active sensor (PWAS) attached to the dog bone samples as shown in Figure 12.
Figure 12 PWAS on dog-bone specimen
Crack Propagation
Failure
7

The two PAC MICRO-80 sensors were connected to the opposite side of the PWAS with machine grease and electrical tape as in the previous AE experiment. All four sensors were connected to a pre-amplifier with a gain of 40dB and to the Micro-II Digital AE System. The sample was then carefully mounted in the MTS load-frame and their gain thresholds adjusted to eliminate noise.
Due to the differences in sensitivity and noise, based on the two different locations and sensors, each channel had a different noise gain threshold. Channel one (Ch1) represented the bottom AE sensor closest to the actuation arm and was set to a threshold of 45dB. Channel two (Ch2) was the top AE sensor, and was set to a gain threshold of 42dB. The bottom PWAS (Ch3) was set to a gain of 65dB due to its close proximity to the actuator arm, and high noise characteristics. Finally, the top PWAS (Ch4), was set to a gain threshold of 55dB. The locations and thresholds are summarized in Figure 13.
It was expected that the two sensors on the bottom—closest to the MTS linear actuator and noise-producing components—required higher thresholds to prevent the noise from producing bad data. The top ones needed lower thresholds because the top clamps are used merely to hold the sample steady during testing. Likewise, since the PWAS have more noise, they are also set to higher threshold gains. The colors for the connection wires in Figure 13 correspond to the results of the test, shown in Figure 14.
Figure 14 Fatigue monitoring using micro-80 AE sensor and PWAS, first test.
Figure 13 Diagram of AE and PWAS sensor placement and respective channels/thresholds.
Crack Propagation
Failure
8

Figure 14 shows a scatterplot of the amplitude (in dB) of each hit over time colored by channel. Since the gain threshold was different for each channel, each sensor varied in terms of the sensitivity to each hit. At ~3900 seconds, or 39kc, it was observed that the crack began to propagate until failure occurred at ~ 4900 seconds, or 49kc. The peak at around 23kc may have been due to micro crack initiation, or experimental error. The origin of this peak was unclear and the second test was suggested.
Although the PWAS represented by Ch3 and Ch4 capture less data points, amplitude of acoustic emission events is higher and PWAS seems to capture the prominent events such as crack propagation and failure more definitively than conventional AE sensors. The PWAS ability to capture the fatigue damage may be due to the PWAS capability to measure longitudinal waves. Therefore, the PWAS used as AE sensors may be more sensitive to fatigue damage, although they require the higher dB thresholds.
Due to the level of noise in the PWAS, the dB threshold was increased, therefore eliminating lower amplitude noise. If Ch2 is considered to be the floor for the graph, the lower amplitude dB cutoff is particularly obvious in channels 1, 3, and 4. To verify repeatability, the experiment was repeated, this time using dB thresholds of 42, 40, 49, and 47 for Ch1, Ch2, Ch3, and Ch4, respectively. The results are shown in Figure 15.
Figure 15 Fatigue monitoring using micro-80 AE sensor and PWAS, second test.
As shown in Figure 15, the PWAS (Ch3 and Ch4) were again able to detect the prominent AE events produced during fatigue accumulation and material fracture. Ch 3 recorded the least data, but was still able to capture the elastic waves associated with the fatigue damage, such as crack propagation and failure. In order to ensure statistical significance, the experiment was repeated a third time.
Similarly to previous tests, in the third test, the dynamic test load frequency was set to 10.00 Hz. The target force to be reached was set to 2.82 kN with amplitude of set to 1.53 kN. Sensor threshold gains of 42, 40, 46, and 47dB were used for Ch1, Ch2, Ch3, and Ch4, respectively. The results are shown in Figure 16.
The PWAS (Ch3 and Ch4) were again able to detect the prominent AE events produced during fatigue accumulation. There is a noticeable correlation between hits recorded by both PWAS and micro-80 sensors.
Crack Propagation
Failure P i
9
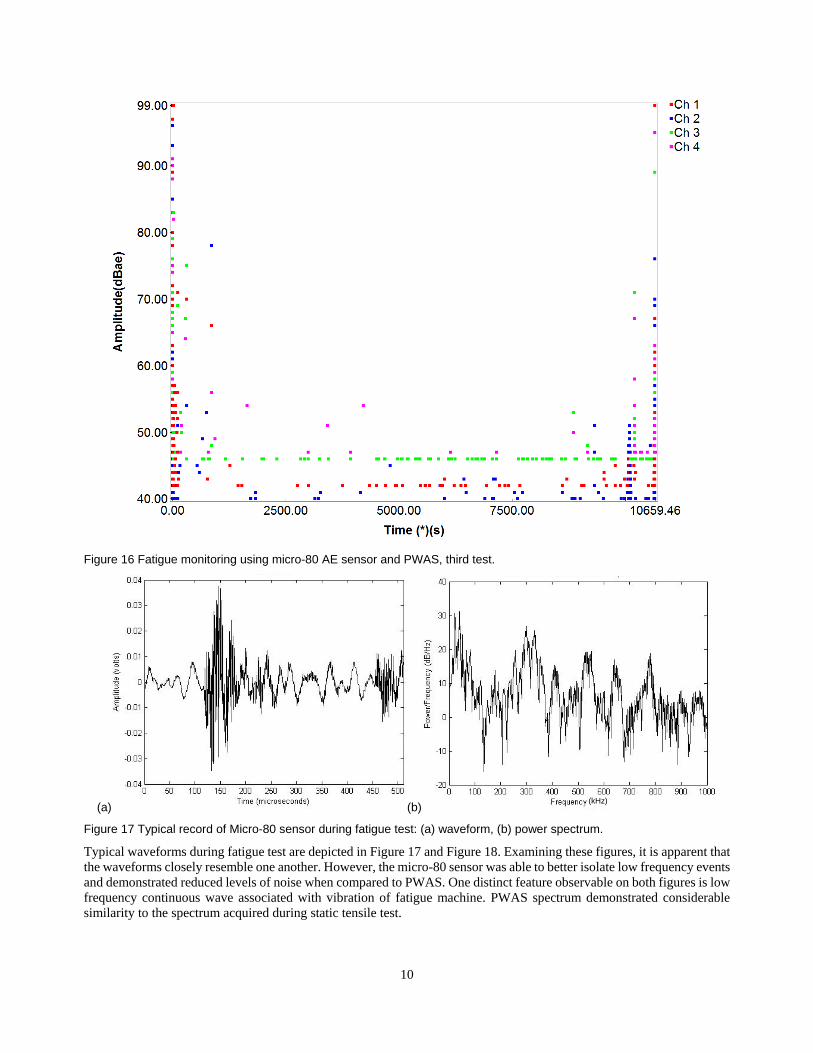
Figure 16 Fatigue monitoring using micro-80 AE sensor and PWAS, third test.
(a) (b)
Figure 17 Typical record of Micro-80 sensor during fatigue test: (a) waveform, (b) power spectrum.
Typical waveforms during fatigue test are depicted in Figure 17 and Figure 18. Examining these figures, it is apparent that the waveforms closely resemble one another. However, the micro-80 sensor was able to better isolate low frequency events and demonstrated reduced levels of noise when compared to PWAS. One distinct feature observable on both figures is low frequency continuous wave associated with vibration of fatigue machine. PWAS spectrum demonstrated considerable similarity to the spectrum acquired during static tensile test.
(kHz)
10

(a) (b) Figure 18 Typical record of PWAS during fatigue test: (a) waveform, (b) power spectrum.
All three fatigue experiments have shown PWAS to be sensitive to acoustic emission events during material fatigue, which opens up new possibilities for this type of sensors in aerospace and other industries.
5. FUTURE DEVELOPMENT
Because of PWAS susceptibility to noise, future developments could focus on reducing contribution of electro-magnetic environment. Shielding with coaxial cable (suggested in [8]) is certainly an option, but additional shielding of the sensor is also suggested. Delicacy of sensor/structure interface precludes direct encapsulation of the sensor in a metallic enclosure. An alternative approach using layers of conducting paint and foams is suggested. Further increase of sensor sensitivity may be achieved by utilizing single crystal piezoelectrics.
6. CONCLUSIONS
PWAS were compared to conventional AE sensors during monitoring of simulated (PLB) and realistic (tensile static test and 3 fatigue tests) acoustic emission events. Both types of sensors produce comparable results with PWAS response typically showing wider bandwidth and heavier noise levels. Despite these discrepancies, PWAS have shown excellent results in continuous monitoring of static deformation and fatigue accumulation. In the first case, steady increase of hit amplitude and hit density has been observed. In the case of fatigue damage, conventional AE sensors and PWAS have shown similar results with PWAS hit amplitude being typically higher than hit amplitude of conventional AE sensors. One contributing factor to this situation may be damage-induced generation of in-plane waves, which may be easily picked up by PWAS. Another factor may be quality of interface between sensor and a host structure.
7. ACKNOWLEDGEMENTS Authors would like to acknowledge financial support of Federal Aviation Administration (FAA) through a Center of Excellence for Commercial Space Transportation. Guidelines of Nickolas Demidovich are much appreciated.
8. REFERENCES [1] Rogers, L.M., (2001) “Structural and Engineering Monitoring by Acoustic Emission Methods – Fundamentals and Applications,” Lloyd’s Register,
September 2001. [2] Vallen, H., (2002) “AE Testing Fundamentals, Equipment, Applications,” NDT.net – September 2002, Vol. 7, N. 09. [3] Bray D. E. and Stanley R. K., (1997), Nondestructive Evaluation: A Tool in Design, Manufacturing, and Service, CRC Press. Bray D. E. and
Stanley R. K., (1997), Nondestructive Evaluation: A Tool in Design, Manufacturing, and Service, CRC Press. [4] Prosser, W. H., Allison, S. G., Woodard, S. E., Wincheski, R. A., Cooper, E. G., Price, D. C., Hedley, M., Prokopenko, M., Scott, D. A., Tessler,
A., Spangler, J. L., (2004) “Structural Health Management for Future Aerospace Vehicles,” Proceedings of 2nd Australasian workshop on structural health monitoring (16-17 December 2004).
[5] Hurley, D., Huston, D.R., Flether, D.G., and Owens, W.P., "Acoustic emission pattern recognition for heat shield (TPS) monitoring", Mechanical Systems and Signal Processing (paper submitted, in review process) . http://www.cems.uvz.edu/capsel/file/pubs/journal_pdf/mssp.pdf
(kHz)
11
[6] Godínez, V., Pollock, A., Gonzalez, M., Momeni, S., Gostautas, R., Fustos, R., Newlin, B., Inman, D., Farmer, J., Priya, S., Ziehl, P., Caicedo, J., Zarate, B., Yu, L., Giurgiutiu V., and Nanni, A., (2011) “Self Powered Wireless Sensor Network for Structural Bridge Health Prognosis: Achievements in the First Two Years”, Proceedings of the 8th International Workshop on Structural Health Monitoring, Stanford University, Stanford, CA, Sept. 13-15, 2011.
[7] Ozevin, D. and Li., Z. (2011) “The Implementation of Piezoelectric Wafer Sensors for Acoustic Emission Sensing in Aluminum”, Proceedings of the 8th International Workshop on Structural Health Monitoring, Stanford University, Stanford, CA, Sept. 13-15, 2011.
[8] Yu, L., Momeni, S., Godinez, V., Giurgiutiu, V., Ziehl, P., and Yu, J., (2012) “Dual Mode Sensing with Low-Profile Piezoelectric Thin Wafer Sensors for Steel Bridge Crack Detection and Diagnosis,” Advances in Civil Engineering, Volume 2012, Article ID 402179, 10 pages, doi:10.1155/2012/402179
[9] Yu, L., Momeni, S., Godinez, V., Giurgiutiu, V., (2012) “Adaptation of PWAS Transducers to Acoustic Emission Sensors,” Proc. of SPIE Vol. 7983, paper 798327
12