monitoring mentoring student guide
DESCRIPTION
ÂTRANSCRIPT
OFF
Monitoring and MentoringStudent Guide
ELEMENTARY AND INTERMEDIATE
2015-2016
2 Monitoring and Mentoring
OFFStudent Informational Text
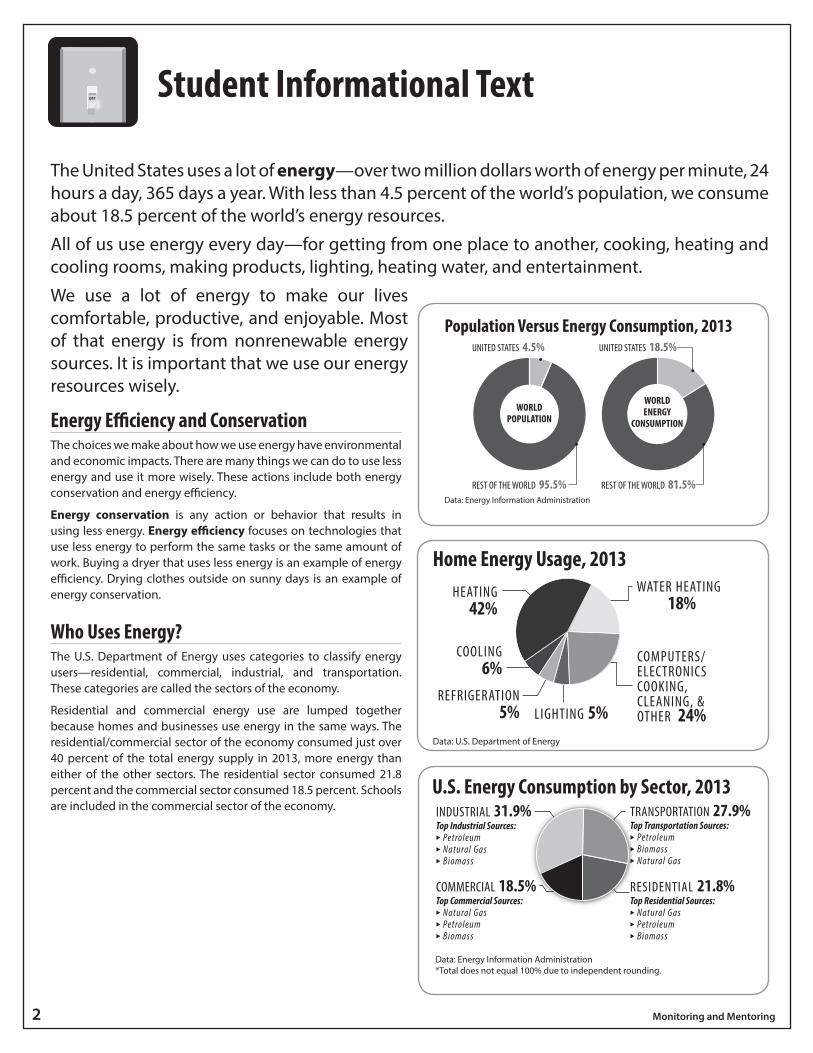
The United States uses a lot of energy—over two million dollars worth of energy per minute, 24 hours a day, 365 days a year. With less than 4.5 percent of the world’s population, we consume about 18.5 percent of the world’s energy resources.
All of us use energy every day—for getting from one place to another, cooking, heating and cooling rooms, making products, lighting, heating water, and entertainment.
We use a lot of energy to make our lives comfortable, productive, and enjoyable. Most of that energy is from nonrenewable energy sources. It is important that we use our energy resources wisely.
Energy Efficiency and ConservationThe choices we make about how we use energy have environmental and economic impacts. There are many things we can do to use less energy and use it more wisely. These actions include both energy conservation and energy efficiency.
Energy conservation is any action or behavior that results in using less energy. Energy efficiency focuses on technologies that use less energy to perform the same tasks or the same amount of work. Buying a dryer that uses less energy is an example of energy efficiency. Drying clothes outside on sunny days is an example of energy conservation.
Who Uses Energy?The U.S. Department of Energy uses categories to classify energy users—residential, commercial, industrial, and transportation. These categories are called the sectors of the economy.
Residential and commercial energy use are lumped together because homes and businesses use energy in the same ways. The residential/commercial sector of the economy consumed just over 40 percent of the total energy supply in 2013, more energy than either of the other sectors. The residential sector consumed 21.8 percent and the commercial sector consumed 18.5 percent. Schools are included in the commercial sector of the economy.
WORLDPOPULATION
WORLDENERGY
CONSUMPTION
UNITED STATES 4.5%
REST OF THE WORLD 95.5%
UNITED STATES 18.5%
REST OF THE WORLD 81.5%
Population Versus Energy Consumption, 2013
Data: Energy Information Administration
HEATING 42%
COOLING 6%
LIGHTING 5%
WATER HEATING 18%
REFRIGERATION5%
COMPUTERS/ELECTRONICSCOOKING,CLEANING, &OTHER 24%
Home Energy Usage, 2013
Data: U.S. Department of Energy
RESIDENTIAL 21.8%Top Residential Sources: Natural Gas Petroleum Biomass
INDUSTRIAL 31.9%Top Industrial Sources: Petroleum Natural Gas Biomass
COMMERCIAL 18.5%Top Commercial Sources: Natural Gas Petroleum Biomass
TRANSPORTATION 27.9%Top Transportation Sources: Petroleum Biomass Natural Gas
U.S. Energy Consumption by Sector, 2013
Data: Energy Information Administration*Total does not equal 100% due to independent rounding.
© 2015 The NEED Project 8408 Kao Circle, Manassas, VA 20110 1.800.875.5029 www.NEED.org 3
Residential/Commercial SectorThe residential sector includes houses, apartments, and other places where people live. The commercial sector includes schools, businesses, and hospitals. The residential and commercial sectors are put together because they use energy for similar tasks—for heating, air conditioning, water heating, lighting, and operating appliances.
The typical family can spend about $2,200 a year on utility bills. About 68 percent is typically spent on electricity, while the rest is spent mostly on natural gas and fuel oil.
Much of this energy is not put to good use. Heated or cooled air leaks out of homes through doors and windows, attics, walls, floors, ceilings, and basements that are not insulated well. Some machines and appliances use energy 24 hours a day, and we waste energy with bad habits.
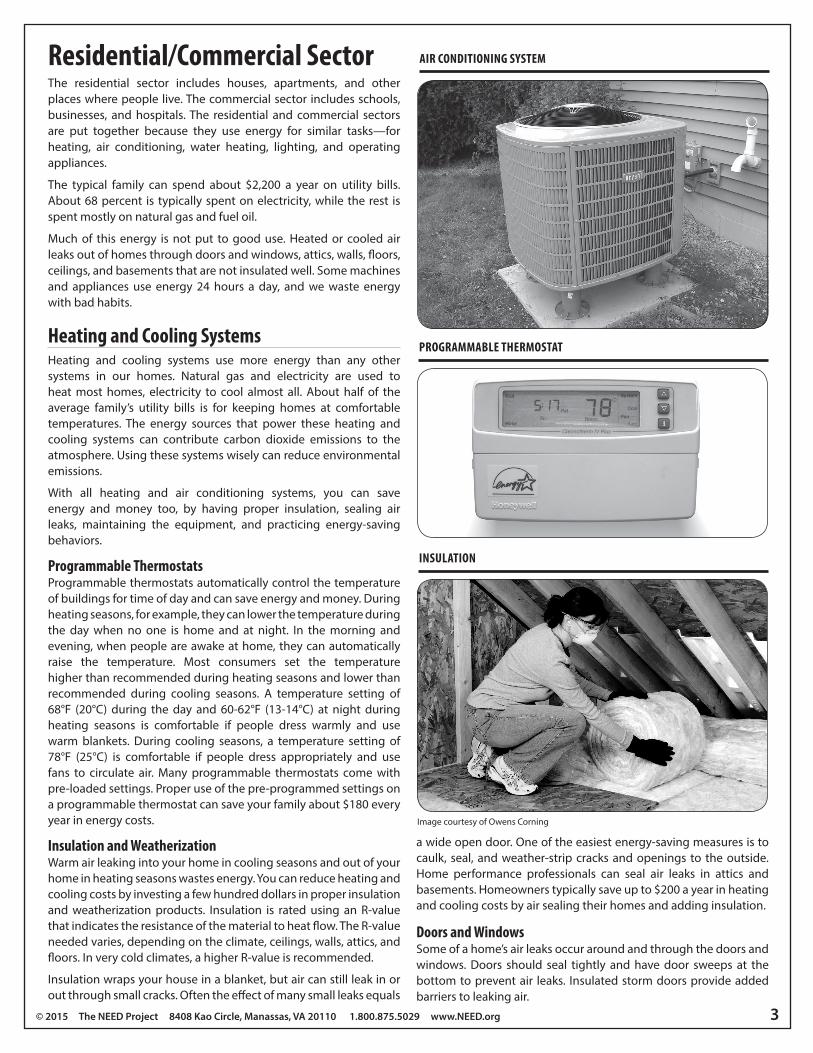
Heating and Cooling SystemsHeating and cooling systems use more energy than any other systems in our homes. Natural gas and electricity are used to heat most homes, electricity to cool almost all. About half of the average family’s utility bills is for keeping homes at comfortable temperatures. The energy sources that power these heating and cooling systems can contribute carbon dioxide emissions to the atmosphere. Using these systems wisely can reduce environmental emissions.
With all heating and air conditioning systems, you can save energy and money too, by having proper insulation, sealing air leaks, maintaining the equipment, and practicing energy-saving behaviors.
Programmable Thermostats Programmable thermostats automatically control the temperature of buildings for time of day and can save energy and money. During heating seasons, for example, they can lower the temperature during the day when no one is home and at night. In the morning and evening, when people are awake at home, they can automatically raise the temperature. Most consumers set the temperature higher than recommended during heating seasons and lower than recommended during cooling seasons. A temperature setting of 68°F (20°C) during the day and 60-62°F (13-14°C) at night during heating seasons is comfortable if people dress warmly and use warm blankets. During cooling seasons, a temperature setting of 78°F (25°C) is comfortable if people dress appropriately and use fans to circulate air. Many programmable thermostats come with pre-loaded settings. Proper use of the pre-programmed settings on a programmable thermostat can save your family about $180 every year in energy costs.
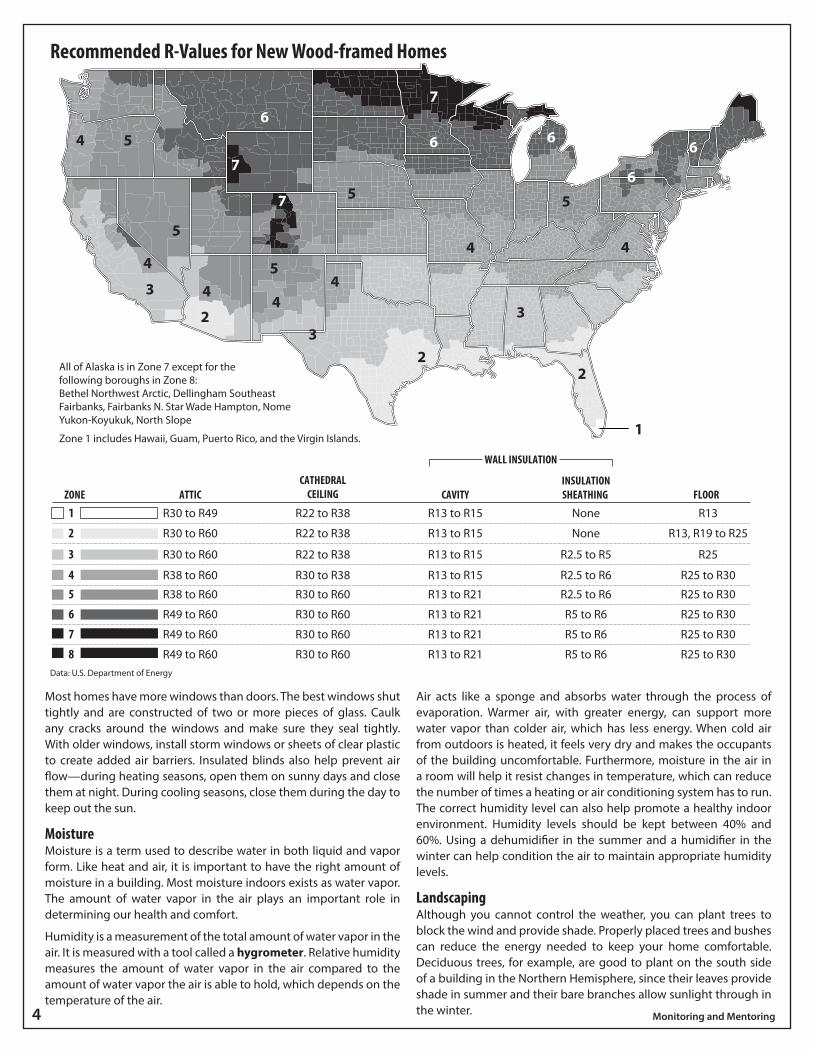
Insulation and WeatherizationWarm air leaking into your home in cooling seasons and out of your home in heating seasons wastes energy. You can reduce heating and cooling costs by investing a few hundred dollars in proper insulation and weatherization products. Insulation is rated using an R-value that indicates the resistance of the material to heat flow. The R-value needed varies, depending on the climate, ceilings, walls, attics, and floors. In very cold climates, a higher R-value is recommended.
Insulation wraps your house in a blanket, but air can still leak in or out through small cracks. Often the effect of many small leaks equals
a wide open door. One of the easiest energy-saving measures is to caulk, seal, and weather-strip cracks and openings to the outside. Home performance professionals can seal air leaks in attics and basements. Homeowners typically save up to $200 a year in heating and cooling costs by air sealing their homes and adding insulation.
Doors and WindowsSome of a home’s air leaks occur around and through the doors and windows. Doors should seal tightly and have door sweeps at the bottom to prevent air leaks. Insulated storm doors provide added barriers to leaking air.
INSULATION
Image courtesy of Owens Corning
AIR CONDITIONING SYSTEM
PROGRAMMABLE THERMOSTAT
4 Monitoring and Mentoring
Most homes have more windows than doors. The best windows shut tightly and are constructed of two or more pieces of glass. Caulk any cracks around the windows and make sure they seal tightly. With older windows, install storm windows or sheets of clear plastic to create added air barriers. Insulated blinds also help prevent air flow—during heating seasons, open them on sunny days and close them at night. During cooling seasons, close them during the day to keep out the sun.
MoistureMoisture is a term used to describe water in both liquid and vapor form. Like heat and air, it is important to have the right amount of moisture in a building. Most moisture indoors exists as water vapor. The amount of water vapor in the air plays an important role in determining our health and comfort.
Humidity is a measurement of the total amount of water vapor in the air. It is measured with a tool called a hygrometer. Relative humidity measures the amount of water vapor in the air compared to the amount of water vapor the air is able to hold, which depends on the temperature of the air.
Air acts like a sponge and absorbs water through the process of evaporation. Warmer air, with greater energy, can support more water vapor than colder air, which has less energy. When cold air from outdoors is heated, it feels very dry and makes the occupants of the building uncomfortable. Furthermore, moisture in the air in a room will help it resist changes in temperature, which can reduce the number of times a heating or air conditioning system has to run. The correct humidity level can also help promote a healthy indoor environment. Humidity levels should be kept between 40% and 60%. Using a dehumidifier in the summer and a humidifier in the winter can help condition the air to maintain appropriate humidity levels.
LandscapingAlthough you cannot control the weather, you can plant trees to block the wind and provide shade. Properly placed trees and bushes can reduce the energy needed to keep your home comfortable. Deciduous trees, for example, are good to plant on the south side of a building in the Northern Hemisphere, since their leaves provide shade in summer and their bare branches allow sunlight through in the winter.
1
22
2 33
3
4 4
44
4
4
4
5
5
5
5
5
6
6 6
6
6
7
7
7
All of Alaska is in Zone 7 except for the following boroughs in Zone 8:Bethel Northwest Arctic, Dellingham Southeast Fairbanks, Fairbanks N. Star Wade Hampton, Nome Yukon-Koyukuk, North Slope
Zone 1 includes Hawaii, Guam, Puerto Rico, and the Virgin Islands.
ZONE
1
2
3
45
6
7
8
ATTIC
R30 to R49
R30 to R60
R30 to R60
R38 to R60
R38 to R60
R49 to R60
R49 to R60
R49 to R60
CATHEDRALCEILING
R22 to R38
R22 to R38
R22 to R38
R30 to R38
R30 to R60
R30 to R60
R30 to R60
R30 to R60
CAVITY
R13 to R15
R13 to R15
R13 to R15
R13 to R15
R13 to R21
R13 to R21
R13 to R21
R13 to R21
INSULATIONSHEATHING
None
None
R2.5 to R5
R2.5 to R6
R2.5 to R6
R5 to R6
R5 to R6
R5 to R6
FLOOR
R13
R13, R19 to R25
R25
R25 to R30
R25 to R30
R25 to R30
R25 to R30
R25 to R30
WALL INSULATION
Data: U.S. Department of Energy
Recommended R-Values for New Wood-framed Homes
© 2015 The NEED Project 8408 Kao Circle, Manassas, VA 20110 1.800.875.5029 www.NEED.org 5
Appliances and MachinesAppliances, machines, and electronic devices use about 29 percent of a typical household’s energy, with refrigerators, freezers, clothes washers and dryers at the top of the list. Any appliance that is designed to change temperature uses a lot of energy. You can save energy by:
�turning off appliances and machines when you aren’t using them;
�using the energy-saver setting on dishwashers and refrigerators;
�keeping the doors closed as much as possible on refrigerators and freezers—know what you want before you open the doors;
�being aware that many machines use energy even when turned off—save energy by unplugging them; and
�using machines and appliances during the morning and evening, not during peak demand time.
When you shop for a new appliance, you should think of two price tags. The first one covers the purchase price—the down payment. The second price tag is the cost of operating the appliance. You’ll pay the second price tag on your utility bill every month for the next 10 to 20 years. An energy efficient appliance will usually cost more, but it will save a lot of money in energy costs. An energy efficient model is almost always a better deal.
ENERGY STAR®When you shop for a new appliance, look for the ENERGY STAR® label—your guarantee that the product saves energy. ENERGY STAR® qualified appliances incorporate advanced technologies that use less energy and water than standard models. A list of energy efficient appliances can be found on the ENERGY STAR® website at www.energystar.gov.
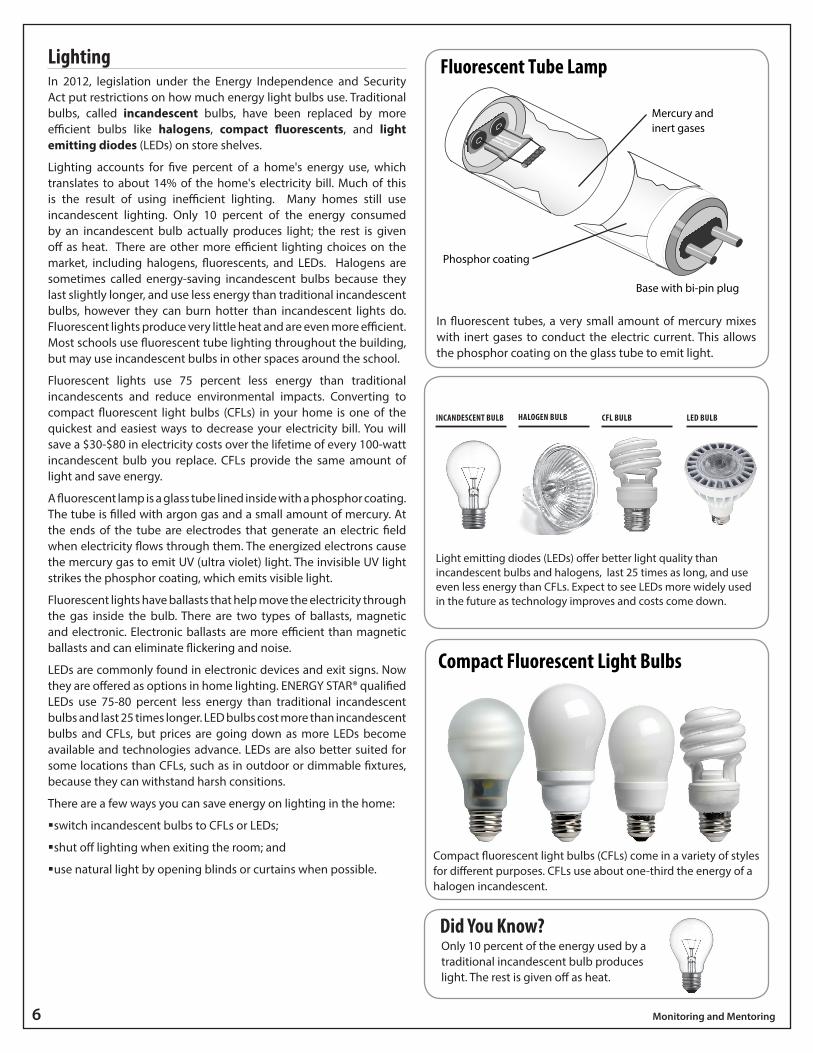
EnergyGuide LabelsAnother way to determine which appliance is more energy efficient is to compare energy usage using EnergyGuide labels. The government requires most appliances to display bright yellow and black EnergyGuide labels. Although these labels do not tell you which appliance is the most efficient, they will tell you the annual energy consumption and operating cost of each appliance so you can compare them.
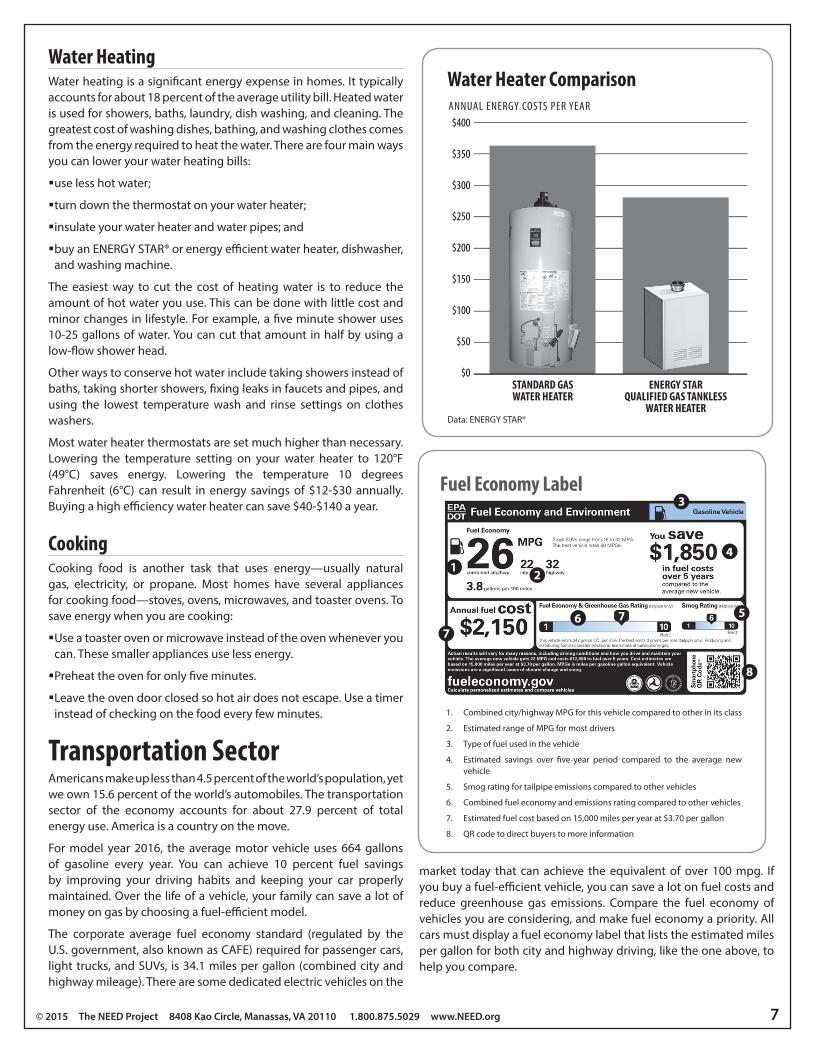
Refrigerators, for example, use about five percent of household energy. Refrigerators can last for a very long time. Replacing an older refrigerator with a new energy efficient model can save on energy bills. With older models, a large amount of electricity can be saved by setting the refrigerator temperature at 37–40°F (3-5°C), the freezer temperature at 5°F (-15°C), and making sure that the energy saver switch is in use. ENERGY STAR® refrigerators are about 10 percent more efficient than non-ENERGY STAR® models.
Refrigerators should also be airtight. Make sure the gaskets around the doors are clean and seal tightly. Close the door on a piece of paper—if you can easily pull out the paper when the door is closed, you need to replace the gaskets.
ENERGYGUIDE LABEL
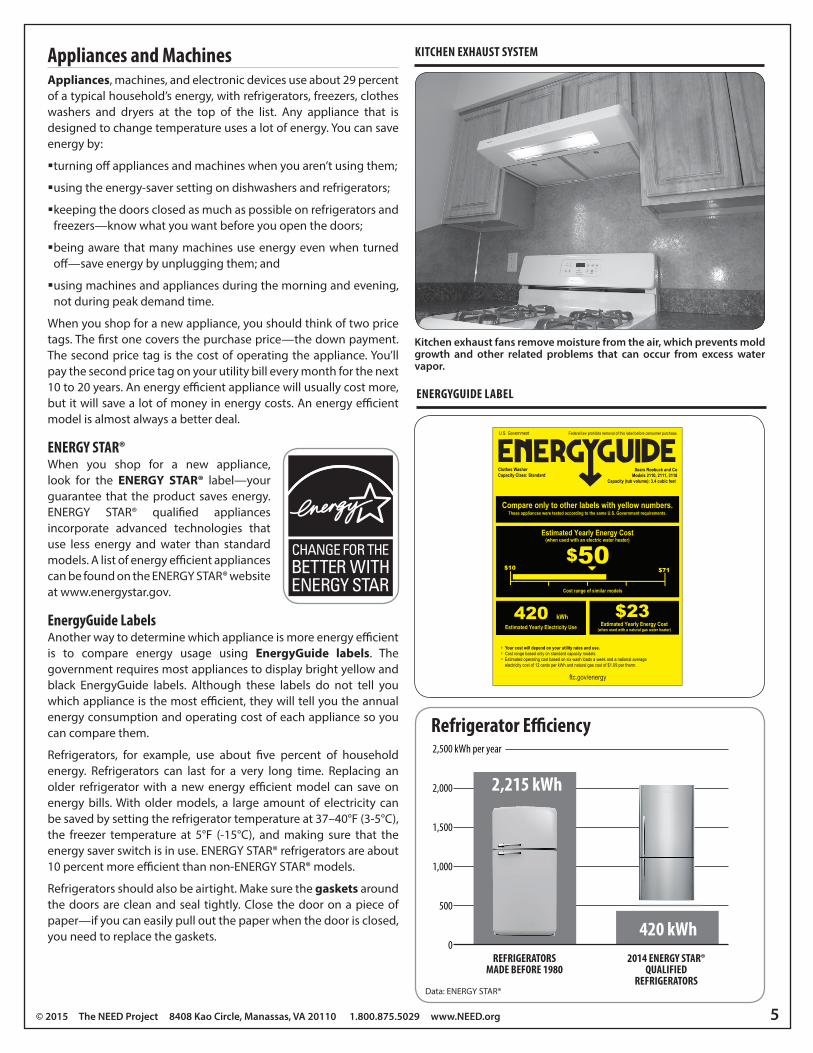
KITCHEN EXHAUST SYSTEM
Kitchen exhaust fans remove moisture from the air, which prevents mold growth and other related problems that can occur from excess water vapor.
0
500
1,000
1,500
2,000
2,500 kWh per year
REFRIGERATORSMADE BEFORE 1980
2014 ENERGY STAR®QUALIFIED
REFRIGERATORS
2,215 kWh
Data: ENERGY STAR®
420 kWh
Refrigerator E�ciency
6 Monitoring and Mentoring
LightingIn 2012, legislation under the Energy Independence and Security Act put restrictions on how much energy light bulbs use. Traditional bulbs, called incandescent bulbs, have been replaced by more efficient bulbs like halogens, compact fluorescents, and light emitting diodes (LEDs) on store shelves.
Lighting accounts for five percent of a home's energy use, which translates to about 14% of the home's electricity bill. Much of this is the result of using inefficient lighting. Many homes still use incandescent lighting. Only 10 percent of the energy consumed by an incandescent bulb actually produces light; the rest is given off as heat. There are other more efficient lighting choices on the market, including halogens, fluorescents, and LEDs. Halogens are sometimes called energy-saving incandescent bulbs because they last slightly longer, and use less energy than traditional incandescent bulbs, however they can burn hotter than incandescent lights do. Fluorescent lights produce very little heat and are even more efficient. Most schools use fluorescent tube lighting throughout the building, but may use incandescent bulbs in other spaces around the school.
Fluorescent lights use 75 percent less energy than traditional incandescents and reduce environmental impacts. Converting to compact fluorescent light bulbs (CFLs) in your home is one of the quickest and easiest ways to decrease your electricity bill. You will save a $30-$80 in electricity costs over the lifetime of every 100-watt incandescent bulb you replace. CFLs provide the same amount of light and save energy.
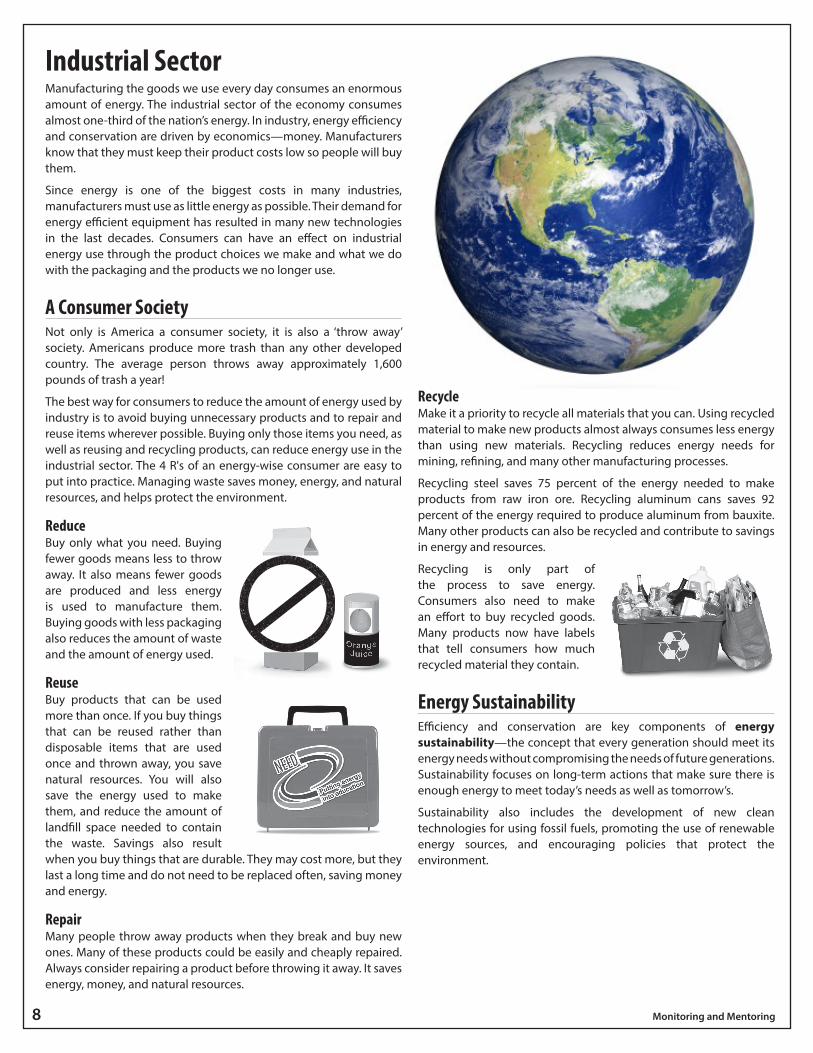
A fluorescent lamp is a glass tube lined inside with a phosphor coating. The tube is filled with argon gas and a small amount of mercury. At the ends of the tube are electrodes that generate an electric field when electricity flows through them. The energized electrons cause the mercury gas to emit UV (ultra violet) light. The invisible UV light strikes the phosphor coating, which emits visible light.
Fluorescent lights have ballasts that help move the electricity through the gas inside the bulb. There are two types of ballasts, magnetic and electronic. Electronic ballasts are more efficient than magnetic ballasts and can eliminate flickering and noise.
LEDs are commonly found in electronic devices and exit signs. Now they are offered as options in home lighting. ENERGY STAR® qualified LEDs use 75-80 percent less energy than traditional incandescent bulbs and last 25 times longer. LED bulbs cost more than incandescent bulbs and CFLs, but prices are going down as more LEDs become available and technologies advance. LEDs are also better suited for some locations than CFLs, such as in outdoor or dimmable fixtures, because they can withstand harsh consitions.
There are a few ways you can save energy on lighting in the home:
�switch incandescent bulbs to CFLs or LEDs;
�shut off lighting when exiting the room; and
�use natural light by opening blinds or curtains when possible.
In �uorescent tubes, a very small amount of mercury mixes with inert gases to conduct the electric current. This allows the phosphor coating on the glass tube to emit light.
Fluorescent Tube Lamp
Mercury and inert gases
Phosphor coating
Base with bi-pin plug
Only 10 percent of the energy used by a traditional incandescent bulb produces light. The rest is given off as heat.
Did You Know?
Compact Fluorescent Light Bulbs
Compact �uorescent light bulbs (CFLs) come in a variety of styles for di�erent purposes. CFLs cut lighting costs about 75 percent.
INCANDESCENT BULB CFL BULB LED BULB
Light emitting diodes (LEDs) offer better light quality than incandescent bulbs and halogens, last 25 times as long, and use even less energy than CFLs. Expect to see LEDs more widely used in the future as technology improves and costs come down.
HALOGEN BULB
In fluorescent tubes, a very small amount of mercury mixes with inert gases to conduct the electric current. This allows the phosphor coating on the glass tube to emit light.
© 2015 The NEED Project 8408 Kao Circle, Manassas, VA 20110 1.800.875.5029 www.NEED.org 7
Water HeatingWater heating is a significant energy expense in homes. It typically accounts for about 18 percent of the average utility bill. Heated water is used for showers, baths, laundry, dish washing, and cleaning. The greatest cost of washing dishes, bathing, and washing clothes comes from the energy required to heat the water. There are four main ways you can lower your water heating bills:
�use less hot water;
�turn down the thermostat on your water heater;
�insulate your water heater and water pipes; and
�buy an ENERGY STAR® or energy efficient water heater, dishwasher, and washing machine.
The easiest way to cut the cost of heating water is to reduce the amount of hot water you use. This can be done with little cost and minor changes in lifestyle. For example, a five minute shower uses 10-25 gallons of water. You can cut that amount in half by using a low-flow shower head.
Other ways to conserve hot water include taking showers instead of baths, taking shorter showers, fixing leaks in faucets and pipes, and using the lowest temperature wash and rinse settings on clothes washers.
Most water heater thermostats are set much higher than necessary. Lowering the temperature setting on your water heater to 120°F (49°C) saves energy. Lowering the temperature 10 degrees Fahrenheit (6°C) can result in energy savings of $12-$30 annually. Buying a high efficiency water heater can save $40-$140 a year.
CookingCooking food is another task that uses energy—usually natural gas, electricity, or propane. Most homes have several appliances for cooking food—stoves, ovens, microwaves, and toaster ovens. To save energy when you are cooking:
�Use a toaster oven or microwave instead of the oven whenever you can. These smaller appliances use less energy.
�Preheat the oven for only five minutes.
�Leave the oven door closed so hot air does not escape. Use a timer instead of checking on the food every few minutes.
Transportation SectorAmericans make up less than 4.5 percent of the world’s population, yet we own 15.6 percent of the world’s automobiles. The transportation sector of the economy accounts for about 27.9 percent of total energy use. America is a country on the move.
For model year 2016, the average motor vehicle uses 664 gallons of gasoline every year. You can achieve 10 percent fuel savings by improving your driving habits and keeping your car properly maintained. Over the life of a vehicle, your family can save a lot of money on gas by choosing a fuel-efficient model.
The corporate average fuel economy standard (regulated by the U.S. government, also known as CAFE) required for passenger cars, light trucks, and SUVs, is 34.1 miles per gallon (combined city and highway mileage). There are some dedicated electric vehicles on the
market today that can achieve the equivalent of over 100 mpg. If you buy a fuel-efficient vehicle, you can save a lot on fuel costs and reduce greenhouse gas emissions. Compare the fuel economy of vehicles you are considering, and make fuel economy a priority. All cars must display a fuel economy label that lists the estimated miles per gallon for both city and highway driving, like the one above, to help you compare.
$400
$350
$300
$250
$200
$150
$100
$50
$0STANDARD GAS WATER HEATER
ENERGY STARQUALIFIED GAS TANKLESS
WATER HEATER
ANNUAL ENERGY COSTS PER YEAR
Data: ENERGY STAR®
Water Heater Comparison
Fuel Economy Label
8 Monitoring and Mentoring
Industrial SectorManufacturing the goods we use every day consumes an enormous amount of energy. The industrial sector of the economy consumes almost one-third of the nation’s energy. In industry, energy efficiency and conservation are driven by economics—money. Manufacturers know that they must keep their product costs low so people will buy them.
Since energy is one of the biggest costs in many industries, manufacturers must use as little energy as possible. Their demand for energy efficient equipment has resulted in many new technologies in the last decades. Consumers can have an effect on industrial energy use through the product choices we make and what we do with the packaging and the products we no longer use.
A Consumer SocietyNot only is America a consumer society, it is also a ‘throw away’ society. Americans produce more trash than any other developed country. The average person throws away approximately 1,600 pounds of trash a year!
The best way for consumers to reduce the amount of energy used by industry is to avoid buying unnecessary products and to repair and reuse items wherever possible. Buying only those items you need, as well as reusing and recycling products, can reduce energy use in the industrial sector. The 4 R's of an energy-wise consumer are easy to put into practice. Managing waste saves money, energy, and natural resources, and helps protect the environment.
ReduceBuy only what you need. Buying fewer goods means less to throw away. It also means fewer goods are produced and less energy is used to manufacture them. Buying goods with less packaging also reduces the amount of waste and the amount of energy used.
ReuseBuy products that can be used more than once. If you buy things that can be reused rather than disposable items that are used once and thrown away, you save natural resources. You will also save the energy used to make them, and reduce the amount of landfill space needed to contain the waste. Savings also result when you buy things that are durable. They may cost more, but they last a long time and do not need to be replaced often, saving money and energy.
RepairMany people throw away products when they break and buy new ones. Many of these products could be easily and cheaply repaired. Always consider repairing a product before throwing it away. It saves energy, money, and natural resources.
RecycleMake it a priority to recycle all materials that you can. Using recycled material to make new products almost always consumes less energy than using new materials. Recycling reduces energy needs for mining, refining, and many other manufacturing processes.
Recycling steel saves 75 percent of the energy needed to make products from raw iron ore. Recycling aluminum cans saves 92 percent of the energy required to produce aluminum from bauxite. Many other products can also be recycled and contribute to savings in energy and resources.
Recycling is only part of the process to save energy. Consumers also need to make an effort to buy recycled goods. Many products now have labels that tell consumers how much recycled material they contain.
Energy SustainabilityEfficiency and conservation are key components of energy sustainability—the concept that every generation should meet its energy needs without compromising the needs of future generations. Sustainability focuses on long-term actions that make sure there is enough energy to meet today’s needs as well as tomorrow’s.
Sustainability also includes the development of new clean technologies for using fossil fuels, promoting the use of renewable energy sources, and encouraging policies that protect the environment.
© 2015 The NEED Project 8408 Kao Circle, Manassas, VA 20110 1.800.875.5029 www.NEED.org 9
e Energy Definitions and Conversions
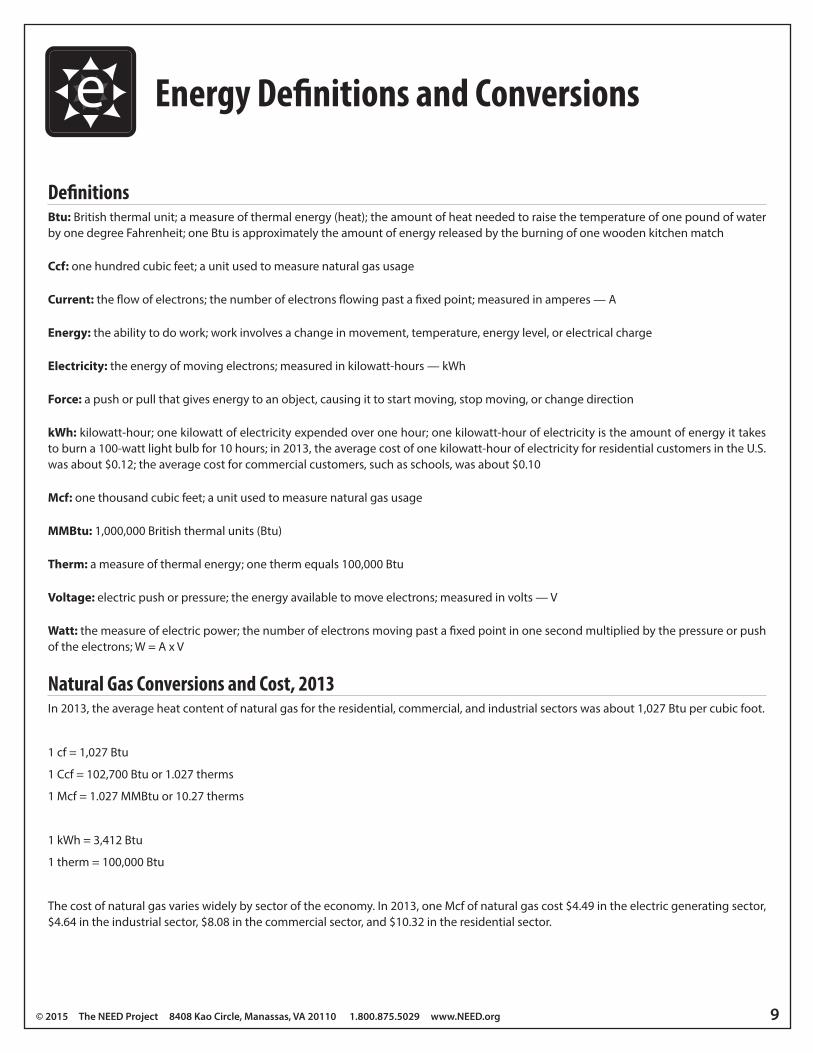
DefinitionsBtu: British thermal unit; a measure of thermal energy (heat); the amount of heat needed to raise the temperature of one pound of water by one degree Fahrenheit; one Btu is approximately the amount of energy released by the burning of one wooden kitchen match
Ccf: one hundred cubic feet; a unit used to measure natural gas usage
Current: the flow of electrons; the number of electrons flowing past a fixed point; measured in amperes — A
Energy: the ability to do work; work involves a change in movement, temperature, energy level, or electrical charge
Electricity: the energy of moving electrons; measured in kilowatt-hours — kWh
Force: a push or pull that gives energy to an object, causing it to start moving, stop moving, or change direction
kWh: kilowatt-hour; one kilowatt of electricity expended over one hour; one kilowatt-hour of electricity is the amount of energy it takes to burn a 100-watt light bulb for 10 hours; in 2013, the average cost of one kilowatt-hour of electricity for residential customers in the U.S. was about $0.12; the average cost for commercial customers, such as schools, was about $0.10
Mcf: one thousand cubic feet; a unit used to measure natural gas usage
MMBtu: 1,000,000 British thermal units (Btu)
Therm: a measure of thermal energy; one therm equals 100,000 Btu
Voltage: electric push or pressure; the energy available to move electrons; measured in volts — V
Watt: the measure of electric power; the number of electrons moving past a fixed point in one second multiplied by the pressure or push of the electrons; W = A x V
Natural Gas Conversions and Cost, 2013In 2013, the average heat content of natural gas for the residential, commercial, and industrial sectors was about 1,027 Btu per cubic foot.
1 cf = 1,027 Btu
1 Ccf = 102,700 Btu or 1.027 therms
1 Mcf = 1.027 MMBtu or 10.27 therms
1 kWh = 3,412 Btu
1 therm = 100,000 Btu
The cost of natural gas varies widely by sector of the economy. In 2013, one Mcf of natural gas cost $4.49 in the electric generating sector, $4.64 in the industrial sector, $8.08 in the commercial sector, and $10.32 in the residential sector.
10 Monitoring and Mentoring
eEffi
ciency vs. Conservation
EFFICIENCYCONSERVATION
EXAMPLES
EXAMPLES
Explain how energy effi
ciency and conservation work together.
© 2015 The NEED Project 8408 Kao Circle, Manassas, VA 20110 1.800.875.5029 www.NEED.org 11
Sectors of the Economy
Residential
Transportation
Commercial
Industrial
12 Monitoring and Mentoring
Systems
Environmental Impacts
Fuels
Ways to Save Energy
Costs
Ways to Save Energy
Heating and CoolingGENERAL INFORMATION
© 2015 The NEED Project 8408 Kao Circle, Manassas, VA 20110 1.800.875.5029 www.NEED.org 13
ENERGY STAR®
Energy Users EnergyGuide Labels
Appliances and Machines
Ways to Save Energy
14 Monitoring and Mentoring
Important Facts About Lighting
© 2015 The NEED Project 8408 Kao Circle, Manassas, VA 20110 1.800.875.5029 www.NEED.org 15
Water Heating Ways to Save Energy
16 Monitoring and Mentoring
OFFEnergy Systems and Sources
Be an Energy DetectiveFind out what kind of energy systems you have at home and the energy sources they use. Take a tour of your home with an adult. Look at the heating system, the air conditioning system, the stove and oven, the major appliances, the utility meters, and the water heater. Answer the questions below with your family’s help.
1. What kind of heating system(s) do we have?
What source(s) of energy do we use to heat our home?
2. What kind of cooling system(s) do we have?
What source(s) of energy do we use to cool our home?
3. What cooking appliances do we have?
What source(s) of energy do we use to cook our food?
4. What kind of system(s) do we have to heat our water?
What source(s) of energy do we use to heat our water?
5. What source(s) of energy do we use to run our machines and appliances?
How many major appliances do we have?
_____ washer _____ refrigerator _____ freezer
_____ dryer _____ dishwasher _____ television(s)
© 2015 The NEED Project 8408 Kao Circle, Manassas, VA 20110 1.800.875.5029 www.NEED.org 17
OFFHome Energy Use Survey
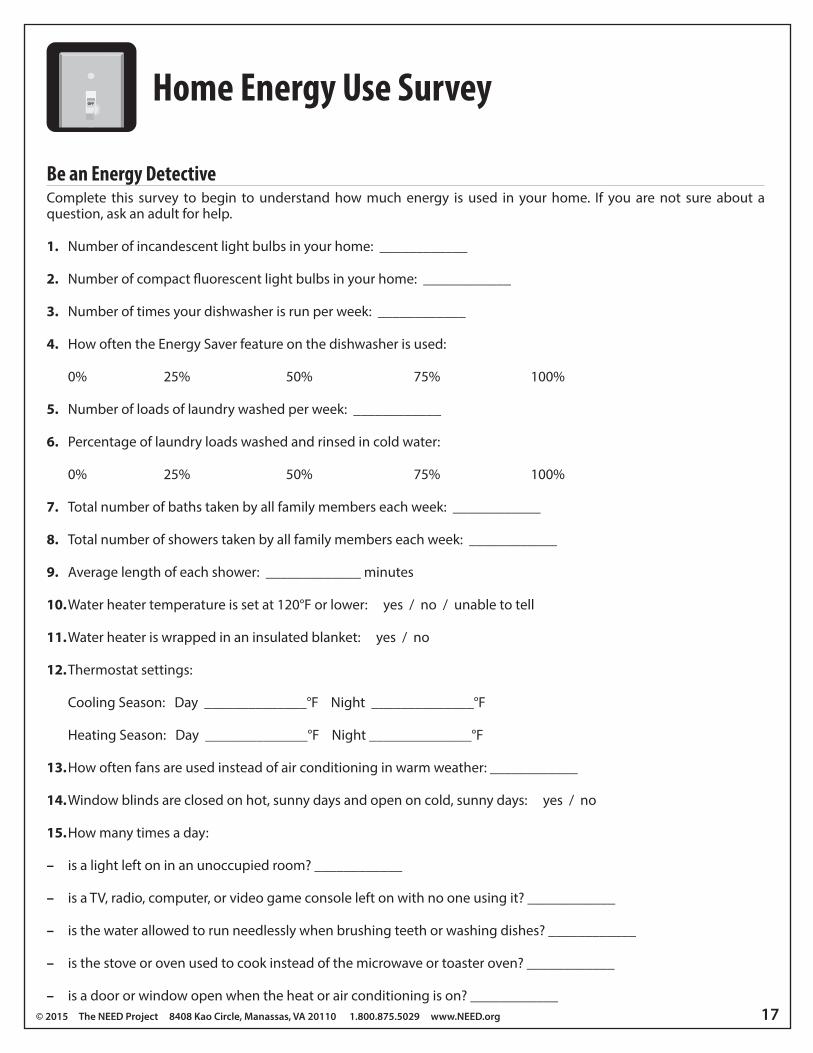
Be an Energy DetectiveComplete this survey to begin to understand how much energy is used in your home. If you are not sure about a question, ask an adult for help.
1. Number of incandescent light bulbs in your home: ____________
2. Number of compact fluorescent light bulbs in your home: ____________
3. Number of times your dishwasher is run per week: ____________
4. How often the Energy Saver feature on the dishwasher is used:
0% 25% 50% 75% 100%
5. Number of loads of laundry washed per week: ____________
6. Percentage of laundry loads washed and rinsed in cold water:
0% 25% 50% 75% 100%
7. Total number of baths taken by all family members each week: ____________
8. Total number of showers taken by all family members each week: ____________
9. Average length of each shower: _____________ minutes
10. Water heater temperature is set at 120°F or lower: yes / no / unable to tell
11. Water heater is wrapped in an insulated blanket: yes / no
12. Thermostat settings:
Cooling Season: Day ______________°F Night ______________°F
Heating Season: Day ______________°F Night ______________°F
13. How often fans are used instead of air conditioning in warm weather: ____________
14. Window blinds are closed on hot, sunny days and open on cold, sunny days: yes / no
15. How many times a day:
– is a light left on in an unoccupied room? ____________
– is a TV, radio, computer, or video game console left on with no one using it? ____________
– is the water allowed to run needlessly when brushing teeth or washing dishes? ____________
– is the stove or oven used to cook instead of the microwave or toaster oven? ____________
– is a door or window open when the heat or air conditioning is on? ____________
18 Monitoring and Mentoring
OFFKitchen and Classroom Diagrams
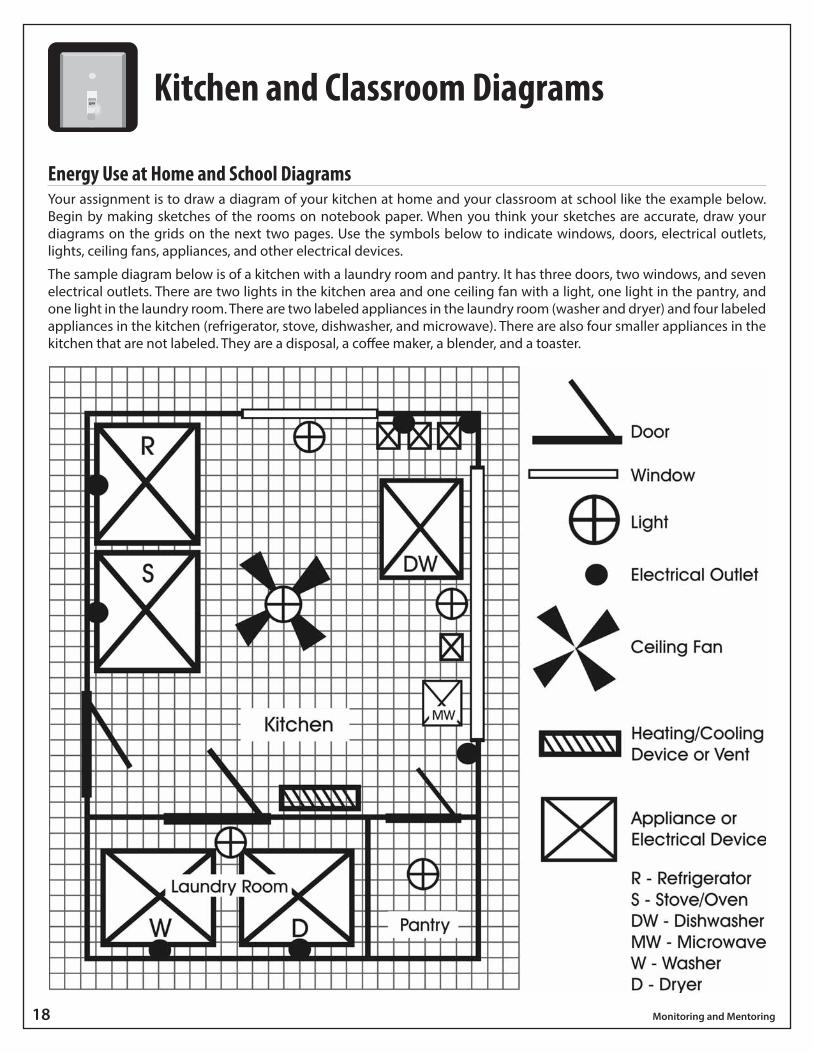
Energy Use at Home and School DiagramsYour assignment is to draw a diagram of your kitchen at home and your classroom at school like the example below. Begin by making sketches of the rooms on notebook paper. When you think your sketches are accurate, draw your diagrams on the grids on the next two pages. Use the symbols below to indicate windows, doors, electrical outlets, lights, ceiling fans, appliances, and other electrical devices.
The sample diagram below is of a kitchen with a laundry room and pantry. It has three doors, two windows, and seven electrical outlets. There are two lights in the kitchen area and one ceiling fan with a light, one light in the pantry, and one light in the laundry room. There are two labeled appliances in the laundry room (washer and dryer) and four labeled appliances in the kitchen (refrigerator, stove, dishwasher, and microwave). There are also four smaller appliances in the kitchen that are not labeled. They are a disposal, a coffee maker, a blender, and a toaster.
PAGE 16 Monitoring & Mentoring Student ©2009 THE NEED PROJECT • P.O. BOX 10101 • MANASSAS, VA 20108 • 1-800-875-5029
Kitchen & Classroom DiagramsENERGY USE AT HOME & SCHOOL DIAGRAMSYour assignment is to draw a diagram of your kitchen at home and your classroom at school like the examplebelow. Begin by making sketches of the rooms on notebook paper. When you think your sketches are accurate,draw your diagrams on the grids on the next two pages. Use the symbols below to indicate windows, doors,electrical outlets, lights, ceiling fans, and appliances and other electrical devices.
The sample diagram below is of a kitchen with a laundry room and pantry. It has three doors, two windows, andseven electric outlets. There are two lights in the kitchen area and one ceiling fan with a light, one light in thepantry, and one light in the laundry room. There are two labeled appliances in the pantry (washer and dryer) andfour labeled appliances in the kitchen (refrigerator, stove, dishwasher, and microwave). There are also four smallerappliances in the kitchen that are not labeled. They are a disposal, a coffee maker, an electric can opener, and atoaster.

© 2015 The NEED Project 8408 Kao Circle, Manassas, VA 20110 1.800.875.5029 www.NEED.org 19
Classroom

20 Monitoring and Mentoring
My Kitchen
© 2015 The NEED Project 8408 Kao Circle, Manassas, VA 20110 1.800.875.5029 www.NEED.org 21
Reading an Electric Meter
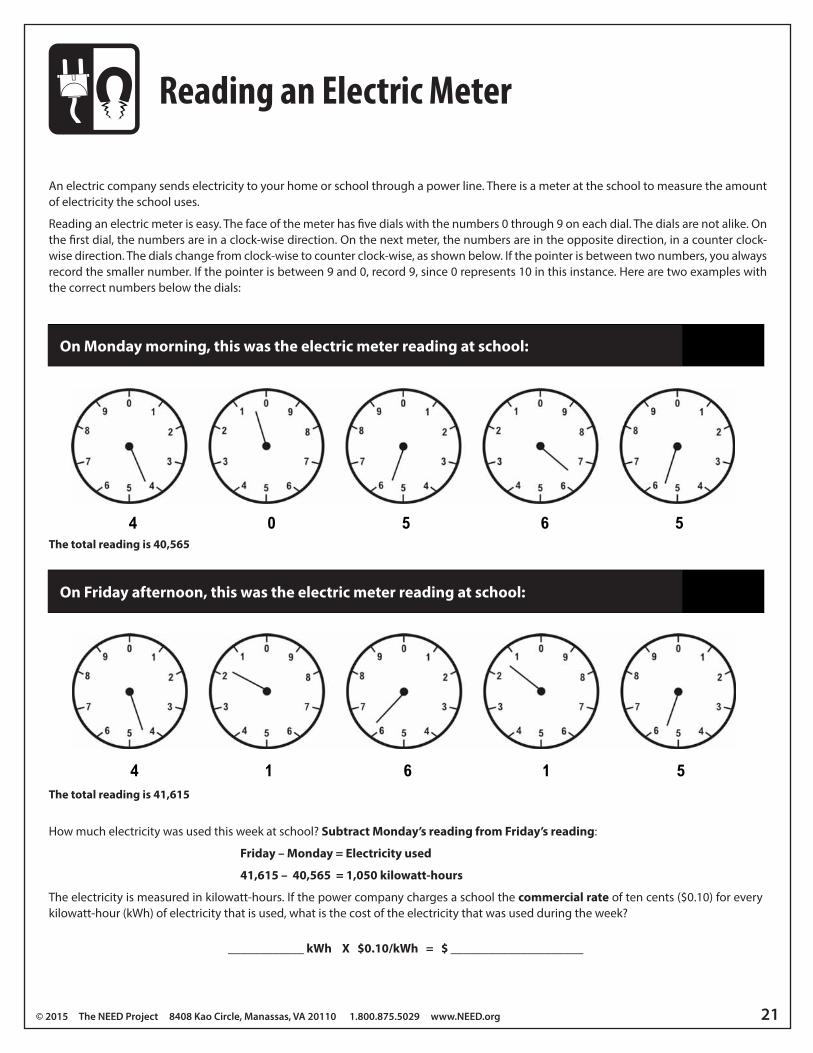
An electric company sends electricity to your home or school through a power line. There is a meter at the school to measure the amount of electricity the school uses.
Reading an electric meter is easy. The face of the meter has five dials with the numbers 0 through 9 on each dial. The dials are not alike. On the first dial, the numbers are in a clock-wise direction. On the next meter, the numbers are in the opposite direction, in a counter clock-wise direction. The dials change from clock-wise to counter clock-wise, as shown below. If the pointer is between two numbers, you always record the smaller number. If the pointer is between 9 and 0, record 9, since 0 represents 10 in this instance. Here are two examples with the correct numbers below the dials:
©2009 THE NEED PROJECT • P.O. BOX 10101 • MANASSAS, VA 20108 • 1-800-875-5029 Learning & Conserving Student PAGE 11
An electric company sends electricity to your home or school through a power line. There is a meter at theschool to measure the amount of electricity that the school uses.
Reading an electric meter is easy. The face of the meter has five dials with the numbers 0 through 9 on eachdial. The dials are not alike. On the first dial, the numbers are in a clock-wise direction. On the next meter, thenumbers are in the opposite direction, in a counter clock-wise direction. The dials change from clock-wise tocounter clock-wise, as shown below. If the pointer is between two numbers, you always record the smallernumber. If the pointer is between 9 and 0, record 9, since 0 represents 10. Here are two examples with thecorrect numbers below the dials:
Reading an Electric Meter
On Monday morning, this was the electric meter reading:
On Friday afternoon, this was the electric meter reading:
4 1 6 1 5
4 0 5 6 5
How much electricity was used this week? Subtract Monday’s reading from Friday’s reading:
41,615 – 40,565 = 1,050 kilowatt-hours
The electricity is measured in kilowatt-hours. If the power company charges a school ten cents ($0.10) forevery kilowatt-hour (kWh) of electricity that is used, what is the cost of the electricity that was used in January?
____________ kWh X $0.10/kWh = $ ______________________
How much electricity was used this week at school? Subtract Monday’s reading from Friday’s reading:
Friday – Monday = Electricity used
41,615 – 40,565 = 1,050 kilowatt-hours
The electricity is measured in kilowatt-hours. If the power company charges a school the commercial rate of ten cents ($0.10) for every kilowatt-hour (kWh) of electricity that is used, what is the cost of the electricity that was used during the week?
____________ kWh X $0.10/kWh = $ _____________________
©2009 THE NEED PROJECT • P.O. BOX 10101 • MANASSAS, VA 20108 • 1-800-875-5029 Learning & Conserving Student PAGE 11
An electric company sends electricity to your home or school through a power line. There is a meter at theschool to measure the amount of electricity that the school uses.
Reading an electric meter is easy. The face of the meter has five dials with the numbers 0 through 9 on eachdial. The dials are not alike. On the first dial, the numbers are in a clock-wise direction. On the next meter, thenumbers are in the opposite direction, in a counter clock-wise direction. The dials change from clock-wise tocounter clock-wise, as shown below. If the pointer is between two numbers, you always record the smallernumber. If the pointer is between 9 and 0, record 9, since 0 represents 10. Here are two examples with thecorrect numbers below the dials:
Reading an Electric Meter
On Monday morning, this was the electric meter reading:
On Friday afternoon, this was the electric meter reading:
4 1 6 1 5
4 0 5 6 5
How much electricity was used this week? Subtract Monday’s reading from Friday’s reading:
41,615 – 40,565 = 1,050 kilowatt-hours
The electricity is measured in kilowatt-hours. If the power company charges a school ten cents ($0.10) forevery kilowatt-hour (kWh) of electricity that is used, what is the cost of the electricity that was used in January?
____________ kWh X $0.10/kWh = $ ______________________
The total reading is 40,565
The total reading is 41,615
On Monday morning, this was the electric meter reading at school:
On Friday afternoon, this was the electric meter reading at school:
22 Monitoring and Mentoring
Electric Meters
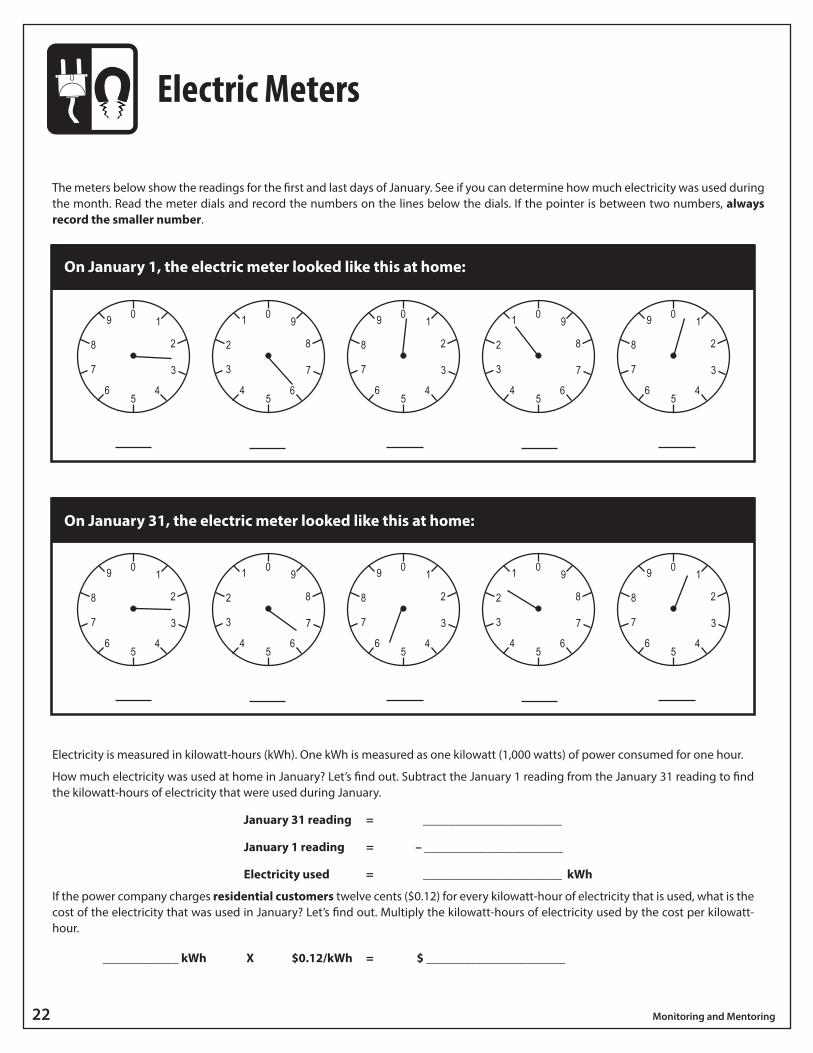
The meters below show the readings for the first and last days of January. See if you can determine how much electricity was used during the month. Read the meter dials and record the numbers on the lines below the dials. If the pointer is between two numbers, always record the smaller number.
Electricity is measured in kilowatt-hours (kWh). One kWh is measured as one kilowatt (1,000 watts) of power consumed for one hour.
How much electricity was used at home in January? Let’s find out. Subtract the January 1 reading from the January 31 reading to find the kilowatt-hours of electricity that were used during January.
January 31 reading = ______________________
January 1 reading = – ______________________
Electricity used = ______________________ kWh
If the power company charges residential customers twelve cents ($0.12) for every kilowatt-hour of electricity that is used, what is the cost of the electricity that was used in January? Let’s find out. Multiply the kilowatt-hours of electricity used by the cost per kilowatt-hour.
____________ kWh X $0.12/kWh = $ ______________________
On January 1, the electric meter looked like this at home:
On January 31, the electric meter looked like this at home:
© 2015 The NEED Project 8408 Kao Circle, Manassas, VA 20110 1.800.875.5029 www.NEED.org 23
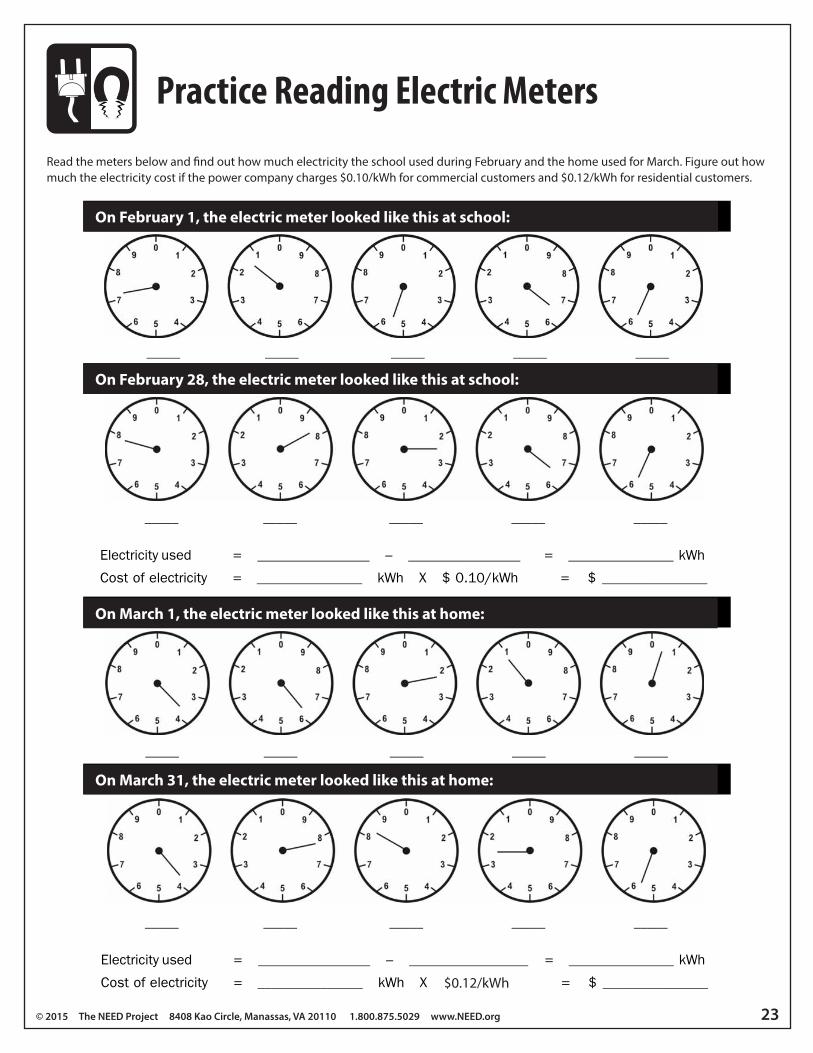
Practice Reading Electric Meters
Read the meters below and find out how much electricity the school used during February and the home used for March. Figure out how much the electricity cost if the power company charges $0.10/kWh for commercial customers and $0.12/kWh for residential customers.
©2009 THE NEED PROJECT • P.O. BOX 10101 • MANASSAS, VA 20108 • 1-800-875-5029 Monitoring & Mentoring Student PAGE 21
On February 28, the electric meter looked like this:
On February 1, the electric meter looked like this:
_____ _____ _____ _____ _____
On March 31, the electric meter looked like this:
On March 1, the electric meter looked like this:
PRACTICE READING METERSRead the school meters below and find out how much electricity the school used during February andMarch. Figure out how much the electricity cost if the power company charges $0.10/kWh.
Electricity used = ________________ – ________________ = _______________ kWh
Cost of electricity = _______________ kWh X $ 0.10/kWh = $ _______________
Electricity used = ________________ – _________________ = _______________ kWh
Cost of electricity = _______________ kWh X $ 0.10/kWh = $ _______________
_____ _____ _____ _____ _____
_____ _____ _____ _____ _____
_____ _____ _____ _____ _____
On February 1, the electric meter looked like this at school:
On February 28, the electric meter looked like this at school:
On March 1, the electric meter looked like this at home:
On March 31, the electric meter looked like this at home:
$0.12/kWh
24 Monitoring and Mentoring
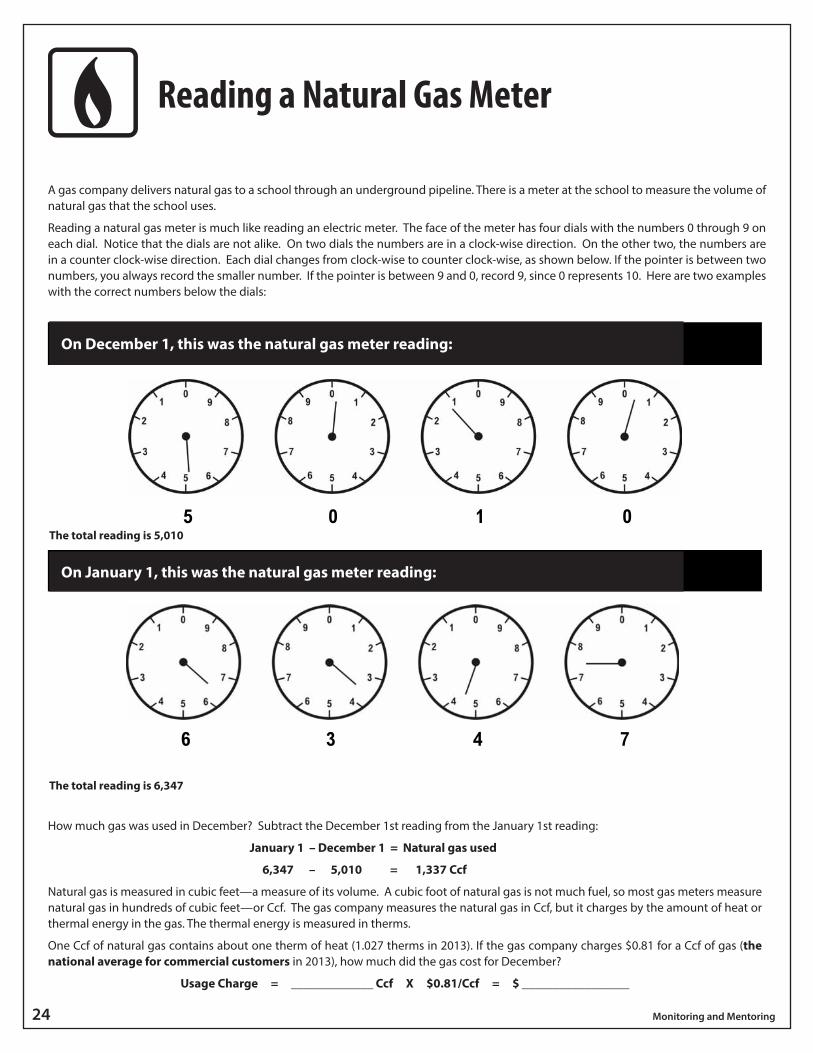
Reading a Natural Gas Meter
A gas company delivers natural gas to a school through an underground pipeline. There is a meter at the school to measure the volume of natural gas that the school uses.
Reading a natural gas meter is much like reading an electric meter. The face of the meter has four dials with the numbers 0 through 9 on each dial. Notice that the dials are not alike. On two dials the numbers are in a clock-wise direction. On the other two, the numbers are in a counter clock-wise direction. Each dial changes from clock-wise to counter clock-wise, as shown below. If the pointer is between two numbers, you always record the smaller number. If the pointer is between 9 and 0, record 9, since 0 represents 10. Here are two examples with the correct numbers below the dials:
PAGE 12 Learning & Conserving Student ©2009 THE NEED PROJECT • P.O. BOX 10101 • MANASSAS, VA 20108 • 1-800-875-5029
On December 1, this was the natural gas meter reading:
Reading a Natural Gas Meter
5 0 1 0
6 3 4 7
On January 1, this was the natural gas meter reading:
A gas company delivers natural gas to a school through an underground pipeline. There is a meter at theschool to measure the volume of natural gas that the school uses.
Reading a natural gas meter is much like reading an electric meter. The face of the meter has four dials withthe numbers 0 through 9 on each dial. Notice that the dials are not alike. On two dials the numbers are in aclock-wise direction. On the other two, the numbers are in a counter clock-wise direction. Each dial changesfrom clock-wise to counter clock-wise, as shown below. If the pointer is between two numbers, you alwaysrecord the smaller number. If the pointer is between 9 and 0, record 9, since 0 represents 10. Here are twoexamples with the correct numbers below the dials:
How much gas was used in December? Subtract the December 1st reading from the January 1st reading:
6,347 – 5,010 = 1,337 CCF
Natural gas is measured in CF or cubic feet––a measure of its volume. A cubic foot of natural gas is not muchfuel, so most gas meters measure natural gas in hundreds of cubic feet––or CCF. The gas company measuresthe natural gas in CCF, but it charges by the amount of heat or thermal energy in the gas. The thermal energy ismeasured in therms.
One CCF of natural gas contains about one therm of heat (1 CCF = 1 therm). If the gas company charges$1.34 for a therm of gas, how much did the gas cost in January?
Cost = _____________ therm X $1.34/therm = $ _________________
How much gas was used in December? Subtract the December 1st reading from the January 1st reading:
January 1 – December 1 = Natural gas used
6,347 – 5,010 = 1,337 Ccf
Natural gas is measured in cubic feet—a measure of its volume. A cubic foot of natural gas is not much fuel, so most gas meters measure natural gas in hundreds of cubic feet—or Ccf. The gas company measures the natural gas in Ccf, but it charges by the amount of heat or thermal energy in the gas. The thermal energy is measured in therms.
One Ccf of natural gas contains about one therm of heat (1.027 therms in 2013). If the gas company charges $0.81 for a Ccf of gas (the national average for commercial customers in 2013), how much did the gas cost for December?
Usage Charge = _____________ Ccf X $0.81/Ccf = $ _________________
PAGE 12 Learning & Conserving Student ©2009 THE NEED PROJECT • P.O. BOX 10101 • MANASSAS, VA 20108 • 1-800-875-5029
On December 1, this was the natural gas meter reading:
Reading a Natural Gas Meter
5 0 1 0
6 3 4 7
On January 1, this was the natural gas meter reading:
A gas company delivers natural gas to a school through an underground pipeline. There is a meter at theschool to measure the volume of natural gas that the school uses.
Reading a natural gas meter is much like reading an electric meter. The face of the meter has four dials withthe numbers 0 through 9 on each dial. Notice that the dials are not alike. On two dials the numbers are in aclock-wise direction. On the other two, the numbers are in a counter clock-wise direction. Each dial changesfrom clock-wise to counter clock-wise, as shown below. If the pointer is between two numbers, you alwaysrecord the smaller number. If the pointer is between 9 and 0, record 9, since 0 represents 10. Here are twoexamples with the correct numbers below the dials:
How much gas was used in December? Subtract the December 1st reading from the January 1st reading:
6,347 – 5,010 = 1,337 CCF
Natural gas is measured in CF or cubic feet––a measure of its volume. A cubic foot of natural gas is not muchfuel, so most gas meters measure natural gas in hundreds of cubic feet––or CCF. The gas company measuresthe natural gas in CCF, but it charges by the amount of heat or thermal energy in the gas. The thermal energy ismeasured in therms.
One CCF of natural gas contains about one therm of heat (1 CCF = 1 therm). If the gas company charges$1.34 for a therm of gas, how much did the gas cost in January?
Cost = _____________ therm X $1.34/therm = $ _________________
The total reading is 5,010
The total reading is 6,347
On December 1, this was the natural gas meter reading:
On January 1, this was the natural gas meter reading:
© 2015 The NEED Project 8408 Kao Circle, Manassas, VA 20110 1.800.875.5029 www.NEED.org 25
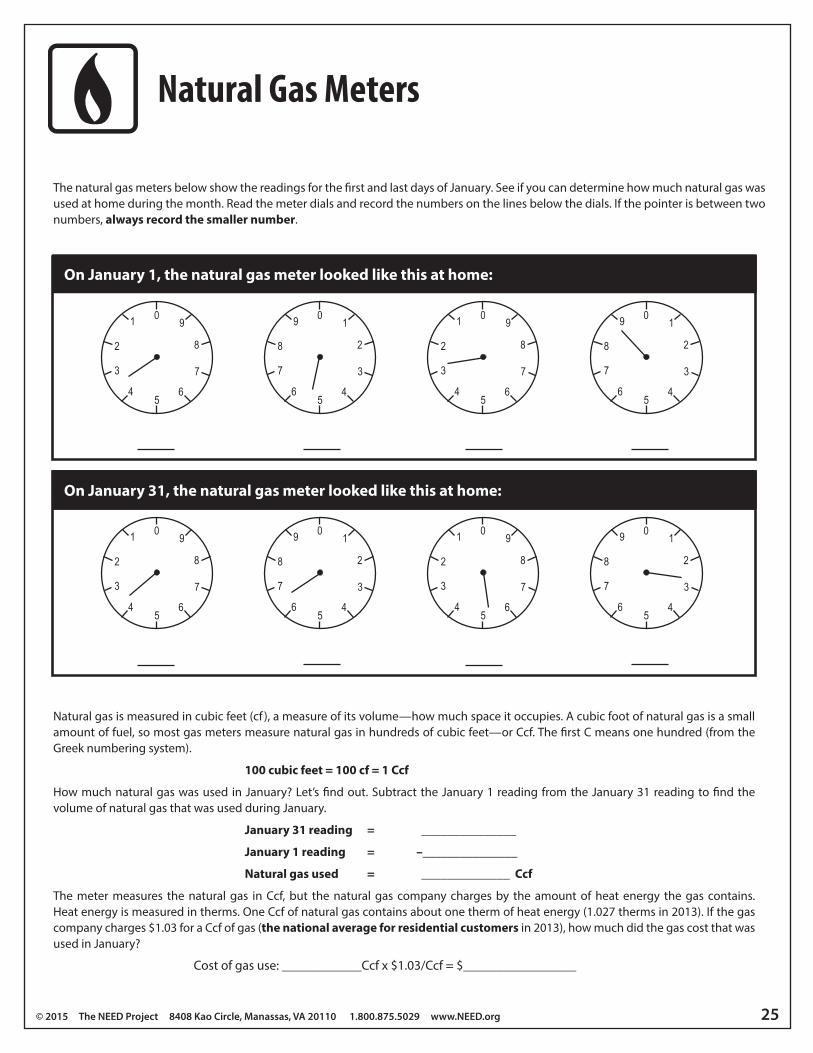
Natural Gas Meters
The natural gas meters below show the readings for the first and last days of January. See if you can determine how much natural gas was used at home during the month. Read the meter dials and record the numbers on the lines below the dials. If the pointer is between two numbers, always record the smaller number.
Natural gas is measured in cubic feet (cf ), a measure of its volume—how much space it occupies. A cubic foot of natural gas is a small amount of fuel, so most gas meters measure natural gas in hundreds of cubic feet—or Ccf. The first C means one hundred (from the Greek numbering system).
100 cubic feet = 100 cf = 1 Ccf
How much natural gas was used in January? Let’s find out. Subtract the January 1 reading from the January 31 reading to find the volume of natural gas that was used during January.
January 31 reading = _______________
January 1 reading = –_______________
Natural gas used = ______________ Ccf
The meter measures the natural gas in Ccf, but the natural gas company charges by the amount of heat energy the gas contains. Heat energy is measured in therms. One Ccf of natural gas contains about one therm of heat energy (1.027 therms in 2013). If the gas company charges $1.03 for a Ccf of gas (the national average for residential customers in 2013), how much did the gas cost that was used in January?
Cost of gas use: ____________Ccf x $1.03/Ccf = $_________________
On January 1, the natural gas meter looked like this at home:
On January 31, the natural gas meter looked like this at home:
26 Monitoring and Mentoring
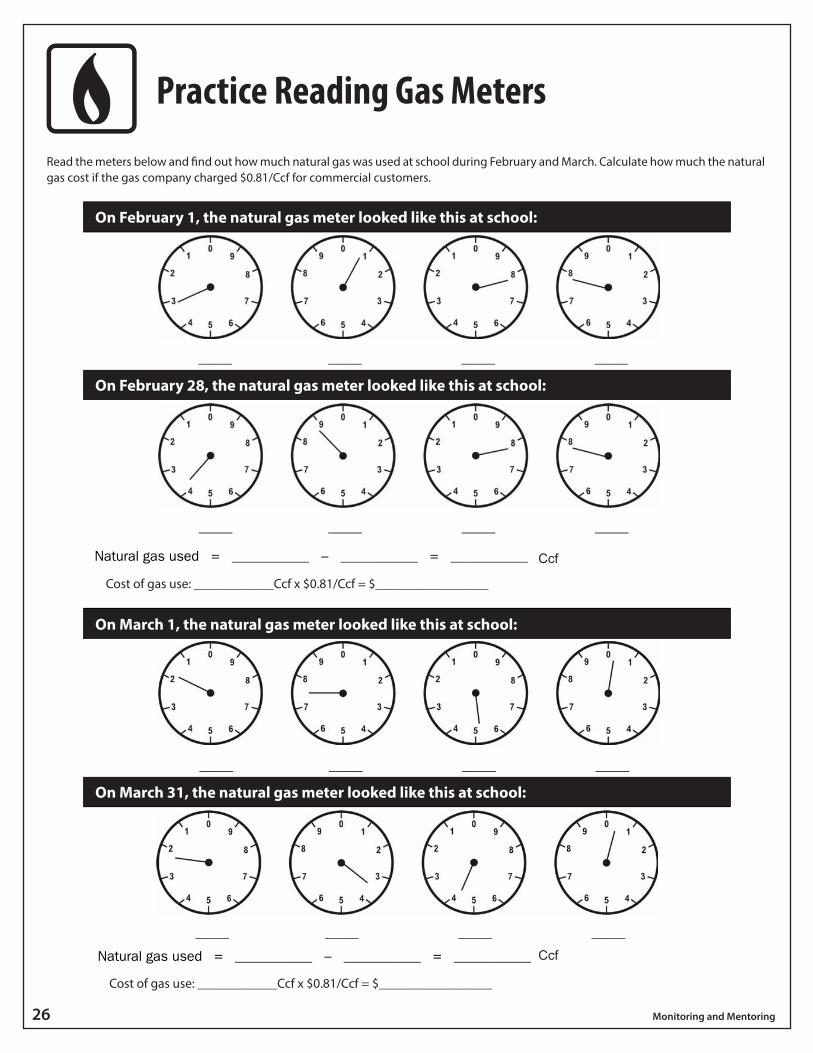
Practice Reading Gas Meters
Read the meters below and find out how much natural gas was used at school during February and March. Calculate how much the natural gas cost if the gas company charged $0.81/Ccf for commercial customers.
PAGE 24 Monitoring & Mentoring Student ©2009 THE NEED PROJECT • P.O. BOX 10101 • MANASSAS, VA 20108 • 1-800-875-5029
PRACTICE READING GAS METERSRead the meters below and find out how much natural gas was used during February and March. Calculatehow much the natural gas cost if the gas company charged $1.34/therm.
Natural gas used = ___________ – ___________ = ___________ CCF (1 CCF = 1 therm)
Cost = ___________ therm x $1.20/therm = $ ______________
On February 28, the natural gas meter looked like this:
On February 1, the natural gas meter looked like this:
_____ _____ _____ _____
_____ _____ _____ _____
On March 31, the natural gas meter looked like this:
On March 1, the natural gas meter looked like this:
_____ _____ _____ _____
_____ _____ _____ _____
Natural gas used = ___________ – ___________ = ___________ CCF (1 CCF = 1 therm)
Cost = ___________ therm x $1.20/therm = $ ______________
On February 1, the natural gas meter looked like this at school:
On February 28, the natural gas meter looked like this at school:
On March 1, the natural gas meter looked like this at school:
On March 31, the natural gas meter looked like this at school:
Cost of gas use: ____________Ccf x $0.81/Ccf = $_________________
Ccf
Ccf
Cost of gas use: ____________Ccf x $0.81/Ccf = $_________________
© 2015 The NEED Project 8408 Kao Circle, Manassas, VA 20110 1.800.875.5029 www.NEED.org 27
Insulation Investigation
ObjectiveStudents will investigate the insulating properties of different materials.
Materials �2 Radiation cans �2 Thermometers �Insulating material �Tape �2 Rubber bands �Hot water (provided by teacher)
? QuestionAre some materials better insulators than others?
Hypothesis
Procedure1. Remove the tops from the cans.
2. Use the insulating material to insulate one can on the sides only.
3. Ask your teacher to fill both of your cans with hot water. Replace the tops.
4. Suspend a thermometer through the hole in each top, making sure it does not touch the bottom or the sides of the can.
5. In the chart on the next page, record the temperature (°C) of the water in the cans at two-minute intervals for 20 minutes. Your teacher will keep track of the time with a timer.
6. Calculate the overall change in temperature (∆T) for both cans, and graph the results in the space provided on the next page.
7. With the class, compare the results from the different insulating materials.
28 Monitoring and Mentoring
Data
TYPE OF INSULATION: ____________________________________
TIME (MIN) 0 2 4 6 8 10 12 14 16 18 20 ∆T
Insulated
Uninsulated
ConclusionUsing the Heat Loss information on the next page, the R-value diagram on page 4, and your class results, describe what kind of insulation you think might be best for where you live.
© 2015 The NEED Project 8408 Kao Circle, Manassas, VA 20110 1.800.875.5029 www.NEED.org 29
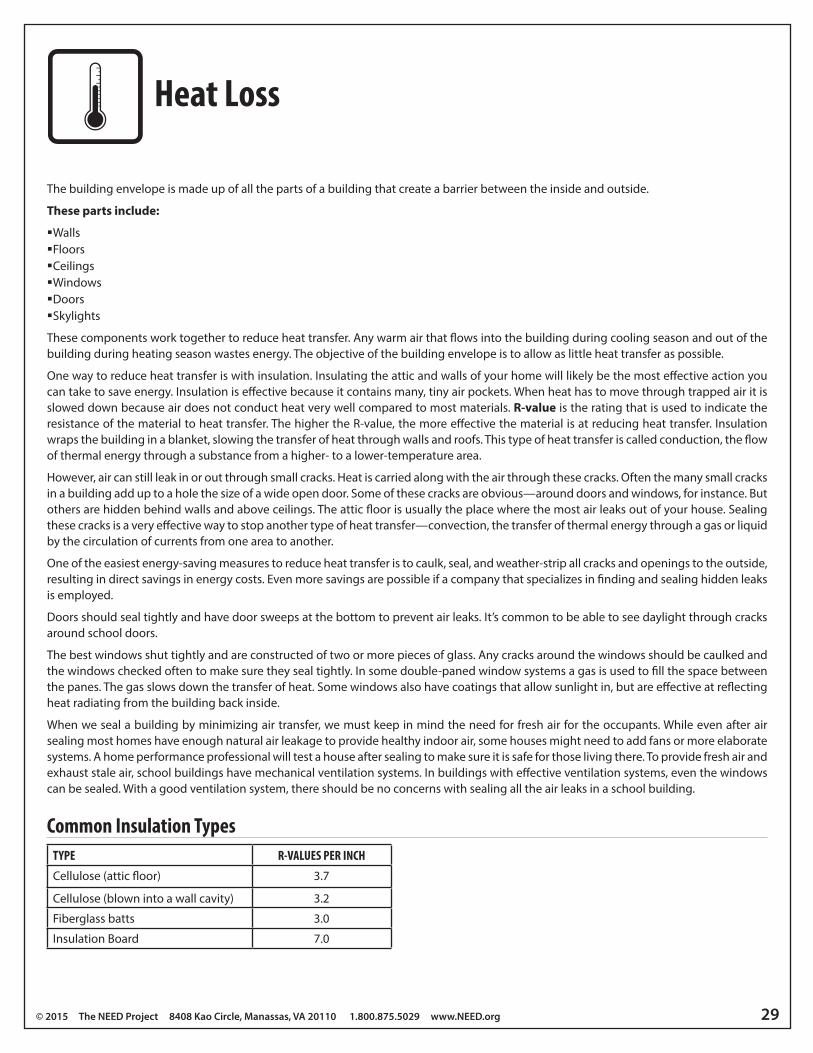
The building envelope is made up of all the parts of a building that create a barrier between the inside and outside.
These parts include:
�Walls �Floors �Ceilings �Windows �Doors �Skylights
These components work together to reduce heat transfer. Any warm air that flows into the building during cooling season and out of the building during heating season wastes energy. The objective of the building envelope is to allow as little heat transfer as possible.
One way to reduce heat transfer is with insulation. Insulating the attic and walls of your home will likely be the most effective action you can take to save energy. Insulation is effective because it contains many, tiny air pockets. When heat has to move through trapped air it is slowed down because air does not conduct heat very well compared to most materials. R-value is the rating that is used to indicate the resistance of the material to heat transfer. The higher the R-value, the more effective the material is at reducing heat transfer. Insulation wraps the building in a blanket, slowing the transfer of heat through walls and roofs. This type of heat transfer is called conduction, the flow of thermal energy through a substance from a higher- to a lower-temperature area.
However, air can still leak in or out through small cracks. Heat is carried along with the air through these cracks. Often the many small cracks in a building add up to a hole the size of a wide open door. Some of these cracks are obvious—around doors and windows, for instance. But others are hidden behind walls and above ceilings. The attic floor is usually the place where the most air leaks out of your house. Sealing these cracks is a very effective way to stop another type of heat transfer—convection, the transfer of thermal energy through a gas or liquid by the circulation of currents from one area to another.
One of the easiest energy-saving measures to reduce heat transfer is to caulk, seal, and weather-strip all cracks and openings to the outside, resulting in direct savings in energy costs. Even more savings are possible if a company that specializes in finding and sealing hidden leaks is employed.
Doors should seal tightly and have door sweeps at the bottom to prevent air leaks. It’s common to be able to see daylight through cracks around school doors.
The best windows shut tightly and are constructed of two or more pieces of glass. Any cracks around the windows should be caulked and the windows checked often to make sure they seal tightly. In some double-paned window systems a gas is used to fill the space between the panes. The gas slows down the transfer of heat. Some windows also have coatings that allow sunlight in, but are effective at reflecting heat radiating from the building back inside.
When we seal a building by minimizing air transfer, we must keep in mind the need for fresh air for the occupants. While even after air sealing most homes have enough natural air leakage to provide healthy indoor air, some houses might need to add fans or more elaborate systems. A home performance professional will test a house after sealing to make sure it is safe for those living there. To provide fresh air and exhaust stale air, school buildings have mechanical ventilation systems. In buildings with effective ventilation systems, even the windows can be sealed. With a good ventilation system, there should be no concerns with sealing all the air leaks in a school building.
Common Insulation TypesTYPE R-VALUES PER INCH
Cellulose (attic floor) 3.7
Cellulose (blown into a wall cavity) 3.2
Fiberglass batts 3.0
Insulation Board 7.0
Heat Loss
30 Monitoring and Mentoring
Facts of Light
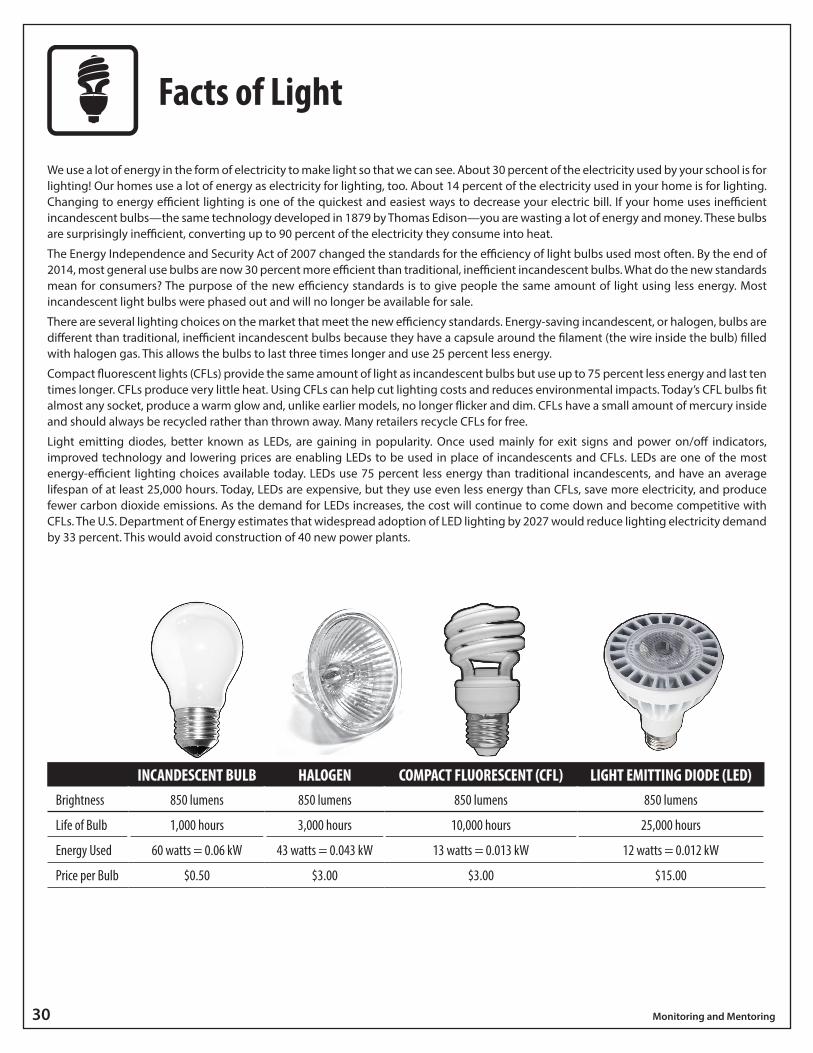
We use a lot of energy in the form of electricity to make light so that we can see. About 30 percent of the electricity used by your school is for lighting! Our homes use a lot of energy as electricity for lighting, too. About 14 percent of the electricity used in your home is for lighting. Changing to energy efficient lighting is one of the quickest and easiest ways to decrease your electric bill. If your home uses inefficient incandescent bulbs—the same technology developed in 1879 by Thomas Edison—you are wasting a lot of energy and money. These bulbs are surprisingly inefficient, converting up to 90 percent of the electricity they consume into heat.
The Energy Independence and Security Act of 2007 changed the standards for the efficiency of light bulbs used most often. By the end of 2014, most general use bulbs are now 30 percent more efficient than traditional, inefficient incandescent bulbs. What do the new standards mean for consumers? The purpose of the new efficiency standards is to give people the same amount of light using less energy. Most incandescent light bulbs were phased out and will no longer be available for sale.
There are several lighting choices on the market that meet the new efficiency standards. Energy-saving incandescent, or halogen, bulbs are different than traditional, inefficient incandescent bulbs because they have a capsule around the filament (the wire inside the bulb) filled with halogen gas. This allows the bulbs to last three times longer and use 25 percent less energy.
Compact fluorescent lights (CFLs) provide the same amount of light as incandescent bulbs but use up to 75 percent less energy and last ten times longer. CFLs produce very little heat. Using CFLs can help cut lighting costs and reduces environmental impacts. Today’s CFL bulbs fit almost any socket, produce a warm glow and, unlike earlier models, no longer flicker and dim. CFLs have a small amount of mercury inside and should always be recycled rather than thrown away. Many retailers recycle CFLs for free.
Light emitting diodes, better known as LEDs, are gaining in popularity. Once used mainly for exit signs and power on/off indicators, improved technology and lowering prices are enabling LEDs to be used in place of incandescents and CFLs. LEDs are one of the most energy-efficient lighting choices available today. LEDs use 75 percent less energy than traditional incandescents, and have an average lifespan of at least 25,000 hours. Today, LEDs are expensive, but they use even less energy than CFLs, save more electricity, and produce fewer carbon dioxide emissions. As the demand for LEDs increases, the cost will continue to come down and become competitive with CFLs. The U.S. Department of Energy estimates that widespread adoption of LED lighting by 2027 would reduce lighting electricity demand by 33 percent. This would avoid construction of 40 new power plants.
INCANDESCENT BULB HALOGEN COMPACT FLUORESCENT (CFL) LIGHT EMITTING DIODE (LED)Brightness 850 lumens 850 lumens 850 lumens 850 lumens
Life of Bulb 1,000 hours 3,000 hours 10,000 hours 25,000 hours
Energy Used 60 watts = 0.06 kW 43 watts = 0.043 kW 13 watts = 0.013 kW 12 watts = 0.012 kW
Price per Bulb $0.50 $3.00 $3.00 $15.00
© 2015 The NEED Project 8408 Kao Circle, Manassas, VA 20110 1.800.875.5029 www.NEED.org 31
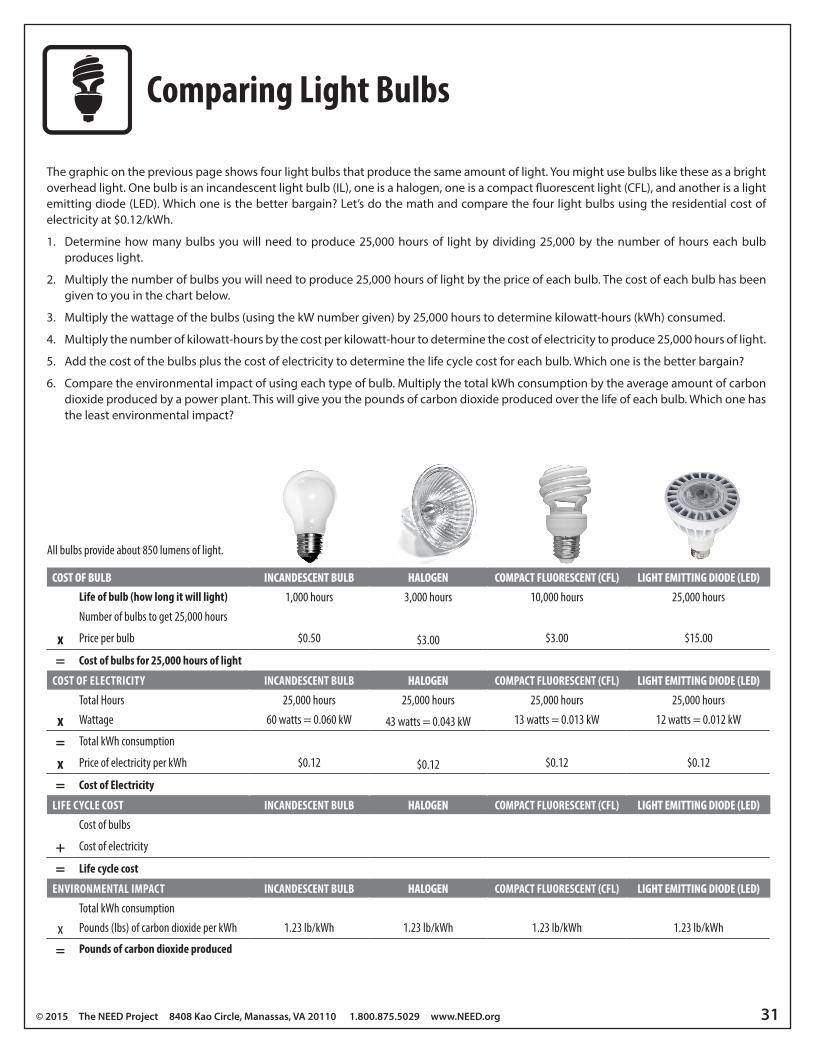
Comparing Light Bulbs
The graphic on the previous page shows four light bulbs that produce the same amount of light. You might use bulbs like these as a bright overhead light. One bulb is an incandescent light bulb (IL), one is a halogen, one is a compact fluorescent light (CFL), and another is a light emitting diode (LED). Which one is the better bargain? Let’s do the math and compare the four light bulbs using the residential cost of electricity at $0.12/kWh.
1. Determine how many bulbs you will need to produce 25,000 hours of light by dividing 25,000 by the number of hours each bulb produces light.
2. Multiply the number of bulbs you will need to produce 25,000 hours of light by the price of each bulb. The cost of each bulb has been given to you in the chart below.
3. Multiply the wattage of the bulbs (using the kW number given) by 25,000 hours to determine kilowatt-hours (kWh) consumed.
4. Multiply the number of kilowatt-hours by the cost per kilowatt-hour to determine the cost of electricity to produce 25,000 hours of light.
5. Add the cost of the bulbs plus the cost of electricity to determine the life cycle cost for each bulb. Which one is the better bargain?
6. Compare the environmental impact of using each type of bulb. Multiply the total kWh consumption by the average amount of carbon dioxide produced by a power plant. This will give you the pounds of carbon dioxide produced over the life of each bulb. Which one has the least environmental impact?
COST OF BULB INCANDESCENT BULB HALOGEN COMPACT FLUORESCENT (CFL) LIGHT EMITTING DIODE (LED)Life of bulb (how long it will light) 1,000 hours 3,000 hours 10,000 hours 25,000 hoursNumber of bulbs to get 25,000 hours
x Price per bulb $0.50 $3.00 $3.00 $15.00
= Cost of bulbs for 25,000 hours of light
COST OF ELECTRICITY INCANDESCENT BULB HALOGEN COMPACT FLUORESCENT (CFL) LIGHT EMITTING DIODE (LED)
Total Hours 25,000 hours 25,000 hours 25,000 hours 25,000 hours
x Wattage 60 watts = 0.060 kW 43 watts = 0.043 kW 13 watts = 0.013 kW 12 watts = 0.012 kW
= Total kWh consumption
x Price of electricity per kWh $0.12 $0.12 $0.12 $0.12
= Cost of Electricity
LIFE CYCLE COST INCANDESCENT BULB HALOGEN COMPACT FLUORESCENT (CFL) LIGHT EMITTING DIODE (LED)
Cost of bulbs
+ Cost of electricity
= Life cycle cost
ENVIRONMENTAL IMPACT INCANDESCENT BULB HALOGEN COMPACT FLUORESCENT (CFL) LIGHT EMITTING DIODE (LED)
Total kWh consumption
x Pounds (lbs) of carbon dioxide per kWh 1.23 lb/kWh 1.23 lb/kWh 1.23 lb/kWh 1.23 lb/kWh
= Pounds of carbon dioxide produced
All bulbs provide about 850 lumens of light.
32 Monitoring and Mentoring
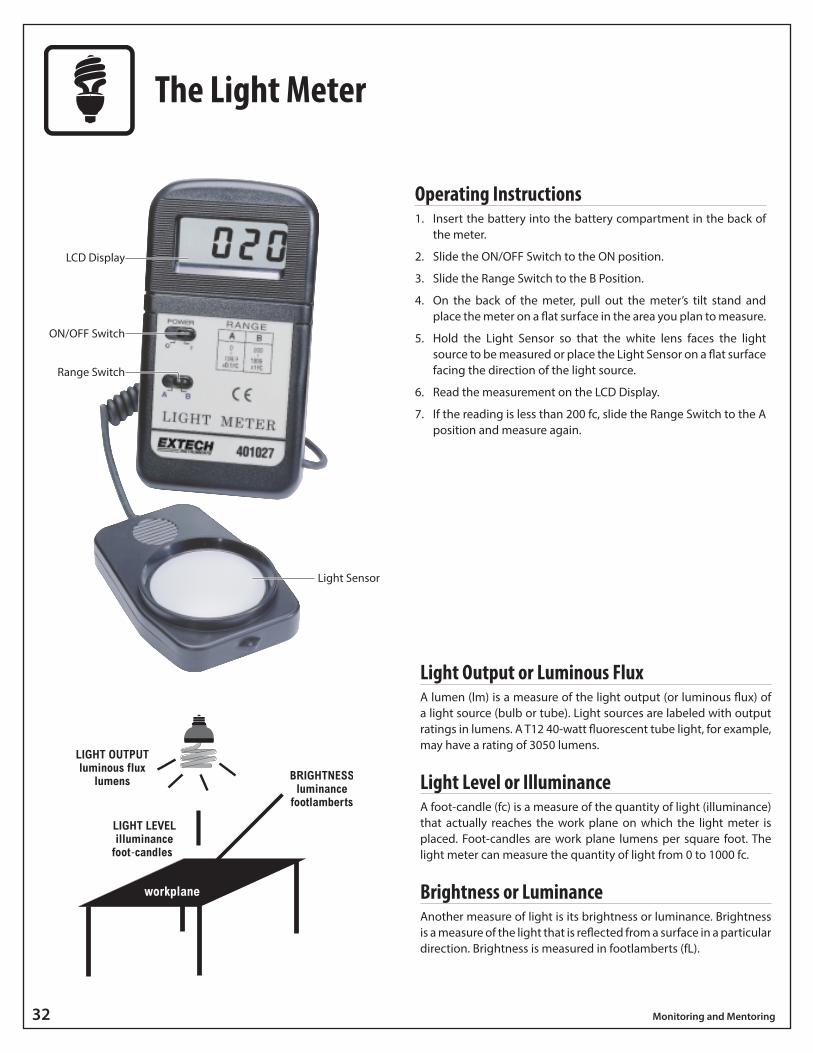
The Light Meter
Operating Instructions1. Insert the battery into the battery compartment in the back of
the meter.
2. Slide the ON/OFF Switch to the ON position.
3. Slide the Range Switch to the B Position.
4. On the back of the meter, pull out the meter’s tilt stand and place the meter on a flat surface in the area you plan to measure.
5. Hold the Light Sensor so that the white lens faces the light source to be measured or place the Light Sensor on a flat surface facing the direction of the light source.
6. Read the measurement on the LCD Display.
7. If the reading is less than 200 fc, slide the Range Switch to the A position and measure again.
Light Output or Luminous FluxA lumen (lm) is a measure of the light output (or luminous flux) of a light source (bulb or tube). Light sources are labeled with output ratings in lumens. A T12 40-watt fluorescent tube light, for example, may have a rating of 3050 lumens.
Light Level or IlluminanceA foot-candle (fc) is a measure of the quantity of light (illuminance) that actually reaches the work plane on which the light meter is placed. Foot-candles are work plane lumens per square foot. The light meter can measure the quantity of light from 0 to 1000 fc.
Brightness or LuminanceAnother measure of light is its brightness or luminance. Brightness is a measure of the light that is reflected from a surface in a particular direction. Brightness is measured in footlamberts (fL).
LCD Display
ON/OFF Switch
Range Switch
Light Sensor
© 2015 The NEED Project 8408 Kao Circle, Manassas, VA 20110 1.800.875.5029 www.NEED.org 33
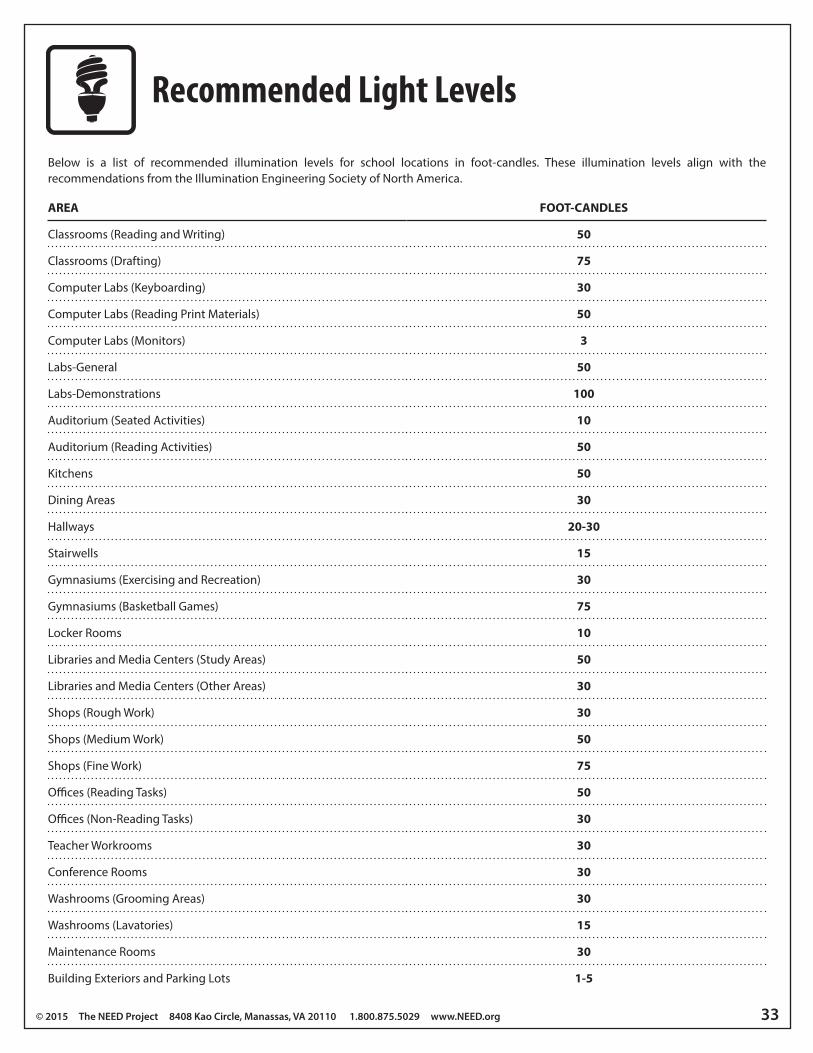
Recommended Light Levels
Below is a list of recommended illumination levels for school locations in foot-candles. These illumination levels align with the recommendations from the Illumination Engineering Society of North America.
AREA FOOT-CANDLES
Classrooms (Reading and Writing) 50
Classrooms (Drafting) 75
Computer Labs (Keyboarding) 30
Computer Labs (Reading Print Materials) 50
Computer Labs (Monitors) 3
Labs-General 50
Labs-Demonstrations 100
Auditorium (Seated Activities) 10
Auditorium (Reading Activities) 50
Kitchens 50
Dining Areas 30
Hallways 20-30
Stairwells 15
Gymnasiums (Exercising and Recreation) 30
Gymnasiums (Basketball Games) 75
Locker Rooms 10
Libraries and Media Centers (Study Areas) 50
Libraries and Media Centers (Other Areas) 30
Shops (Rough Work) 30
Shops (Medium Work) 50
Shops (Fine Work) 75
Offices (Reading Tasks) 50
Offices (Non-Reading Tasks) 30
Teacher Workrooms 30
Conference Rooms 30
Washrooms (Grooming Areas) 30
Washrooms (Lavatories) 15
Maintenance Rooms 30
Building Exteriors and Parking Lots 1-5
34 Monitoring and Mentoring
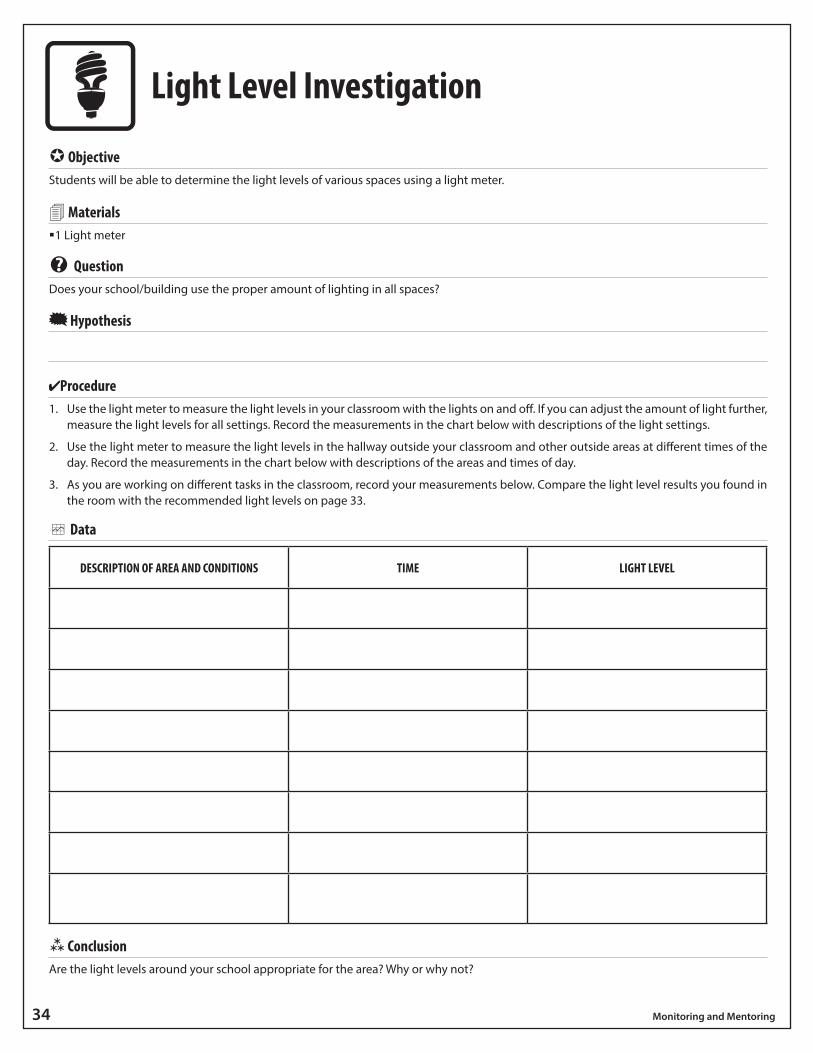
Light Level Investigation
ObjectiveStudents will be able to determine the light levels of various spaces using a light meter.
Materials �1 Light meter
? QuestionDoes your school/building use the proper amount of lighting in all spaces?
Hypothesis
Procedure1. Use the light meter to measure the light levels in your classroom with the lights on and off. If you can adjust the amount of light further,
measure the light levels for all settings. Record the measurements in the chart below with descriptions of the light settings.
2. Use the light meter to measure the light levels in the hallway outside your classroom and other outside areas at different times of the day. Record the measurements in the chart below with descriptions of the areas and times of day.
3. As you are working on different tasks in the classroom, record your measurements below. Compare the light level results you found in the room with the recommended light levels on page 33.
Data
DESCRIPTION OF AREA AND CONDITIONS TIME LIGHT LEVEL
ConclusionAre the light levels around your school appropriate for the area? Why or why not?
© 2015 The NEED Project 8408 Kao Circle, Manassas, VA 20110 1.800.875.5029 www.NEED.org 35
Light Bulb Investigation 1
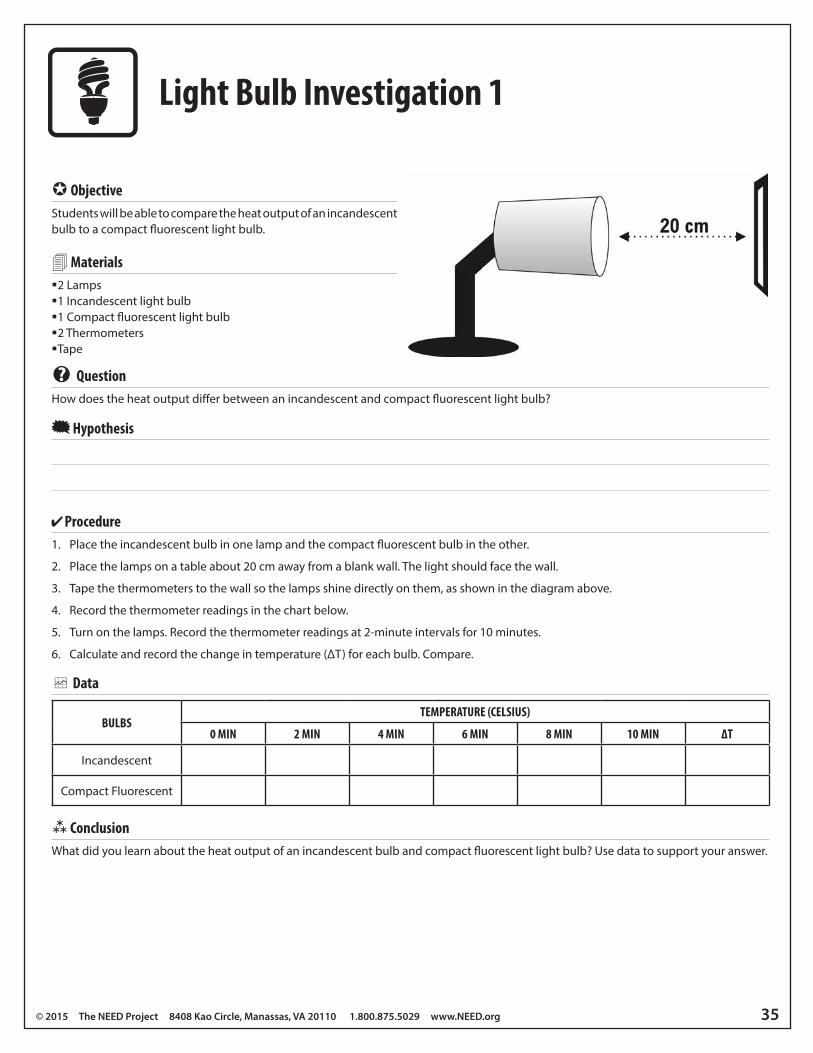
ObjectiveStudents will be able to compare the heat output of an incandescent bulb to a compact fluorescent light bulb.
Materials �2 Lamps �1 Incandescent light bulb �1 Compact fluorescent light bulb �2 Thermometers �Tape
? QuestionHow does the heat output differ between an incandescent and compact fluorescent light bulb?
Hypothesis
Procedure1. Place the incandescent bulb in one lamp and the compact fluorescent bulb in the other.
2. Place the lamps on a table about 20 cm away from a blank wall. The light should face the wall.
3. Tape the thermometers to the wall so the lamps shine directly on them, as shown in the diagram above.
4. Record the thermometer readings in the chart below.
5. Turn on the lamps. Record the thermometer readings at 2-minute intervals for 10 minutes.
6. Calculate and record the change in temperature (∆T) for each bulb. Compare.
Data
BULBSTEMPERATURE (CELSIUS)
0 MIN 2 MIN 4 MIN 6 MIN 8 MIN 10 MIN ∆T
Incandescent
Compact Fluorescent
ConclusionWhat did you learn about the heat output of an incandescent bulb and compact fluorescent light bulb? Use data to support your answer.
PAGE 30 Learning & Conserving Student ©2009 THE NEED PROJECT • P.O. BOX 10101 • MANASSAS, VA 20108 • 1-800-875-5029
Lightbulb Investigation 1GOAL: To compare the heat output of an incandescent to a compact fluorescent lightbulb.
MATERIALS: 2 lamps, 1 incandescent lightbulb, 1 compact fluorescent bulb, 2 thermometers, tape
PREPARATION: Read all of the steps in the procedure.
Write your hypothesis below:
HYPOTHESIS:
PROCEDURE:
1. Place the incandescent bulb in one lamp and the compact fluorescent bulb in the other.
2. Place the lamps on a table about 40 cm apart facing a blank wall.
3. Tape the thermometers to the wall so that the lamps shine directly on them, as shown in thediagram below.
4. Record the thermometer readings in the chart below.
5. Turn on the lamps. Record the thermometer readings at 2-minute intervals for 10 minutes.
6. Calculate and record the change in temperature for each bulb. Compare. ΔΔΔΔΔ = change.
RESULTS:
CONCLUSION:
36 Monitoring and Mentoring
Light Bulb Investigation 2
ObjectiveStudents will be able to compare the wattage of an incandescent bulb to a compact fluorescent light bulb.
Materials �2 Lamps �1 Incandescent light bulb �1 Compact fluorescent light bulb �1 Kill A Watt™ monitor
? QuestionHow does the wattage vary for different types of bulbs?
Hypothesis
Procedure1. Place the incandescent bulb in one lamp and the compact fluorescent bulb in the other.
2. Place the lamps on a table.
3. Plug the Kill A Watt™ monitor into an outlet and plug the lamp with the incandescent bulb into the monitor.
4. Turn on the lamp. Record the wattage using the Kill A Watt™ monitor. Turn off the lamp and unplug it from the monitor.
5. Plug the lamp with the compact fluorescent bulb into the monitor. Turn on the lamp and record the wattage. Turn off the lamp.
6. Compare the wattage measured by the monitor to the stated wattage of the bulbs found on their packaging, or printed on the bulbs themselves.
Data
BULBS WATTAGE FROM MONITOR STATED WATTAGE
Incandescent
Compact Fluorescent
ConclusionWhat did you learn about the wattage used by an incandescent bulb compared to wattage used by a compact fluorescent light bulb? Use data to support your answer.
© 2015 The NEED Project 8408 Kao Circle, Manassas, VA 20110 1.800.875.5029 www.NEED.org 37
Light Bulb Investigation 3
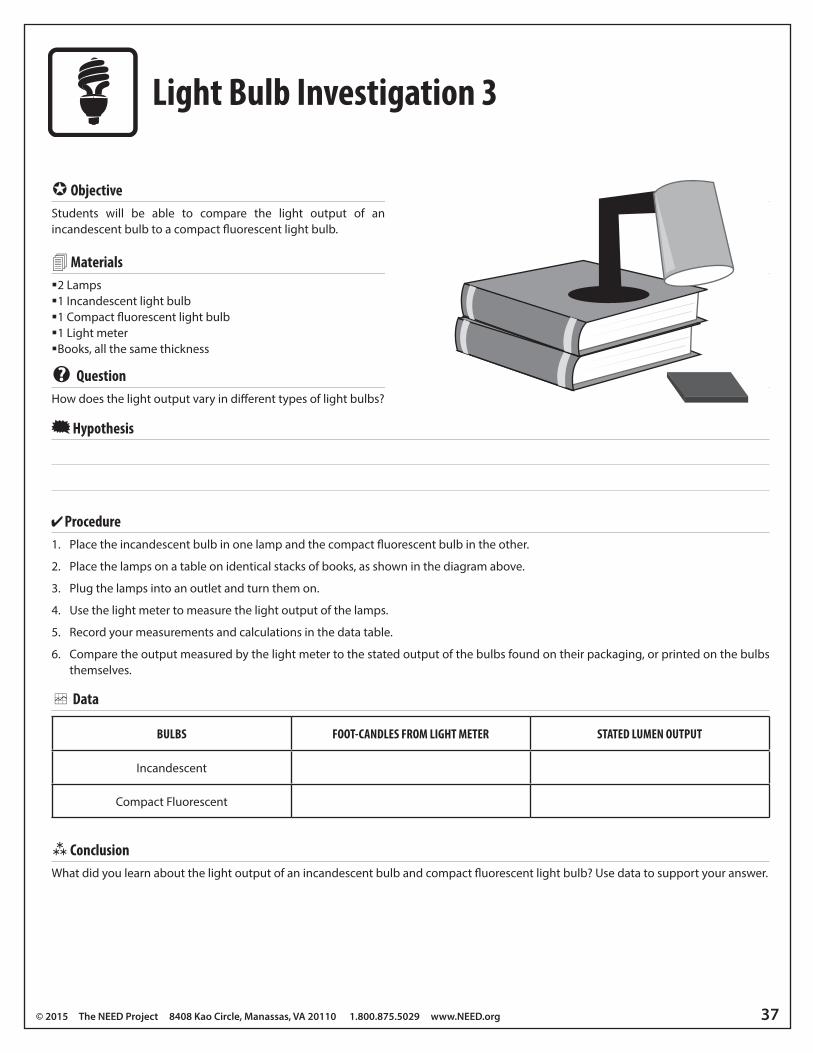
ObjectiveStudents will be able to compare the light output of an incandescent bulb to a compact fluorescent light bulb.
Materials �2 Lamps �1 Incandescent light bulb �1 Compact fluorescent light bulb �1 Light meter �Books, all the same thickness
? QuestionHow does the light output vary in different types of light bulbs?
Hypothesis
Procedure1. Place the incandescent bulb in one lamp and the compact fluorescent bulb in the other.
2. Place the lamps on a table on identical stacks of books, as shown in the diagram above.
3. Plug the lamps into an outlet and turn them on.
4. Use the light meter to measure the light output of the lamps.
5. Record your measurements and calculations in the data table.
6. Compare the output measured by the light meter to the stated output of the bulbs found on their packaging, or printed on the bulbs themselves.
Data
BULBS FOOT-CANDLES FROM LIGHT METER STATED LUMEN OUTPUT
Incandescent
Compact Fluorescent
ConclusionWhat did you learn about the light output of an incandescent bulb and compact fluorescent light bulb? Use data to support your answer.
38 Monitoring and Mentoring
An incandescent bulb produces light by passing electricity through a wire inside the bulb. This wire is called a filament. When electricity flows through the wire, it gets very hot and glows, producing light. Incandescent bulbs use 90 percent of the electricity to produce heat and only ten percent to produce light. They are very inefficient in their use of energy.
A fluorescent bulb produces light by passing electricity through a gas inside the bulb. The electrons in the gas molecules become more energetic and some escape. They bounce around and crash into the walls of the bulb. The walls of the bulb are painted with a special material that gives off light when hit by electrons.
Fluorescent lights have ballasts that help move the electricity through the gas inside the bulb. A ballast is an electromagnet that produces a large voltage between the two ends of the bulb so the electricity will flow between them.
There are two types of ballasts, magnetic and electronic. Magnetic ballasts produce a frequency of 60 Hertz (Hz), which means the light is flickering on and off 60 times a second. Electronic ballasts produce a frequency of 10,000-20,000 Hz. Fluorescent lights with electronic ballasts are more energy efficient than those with magnetic ballasts.
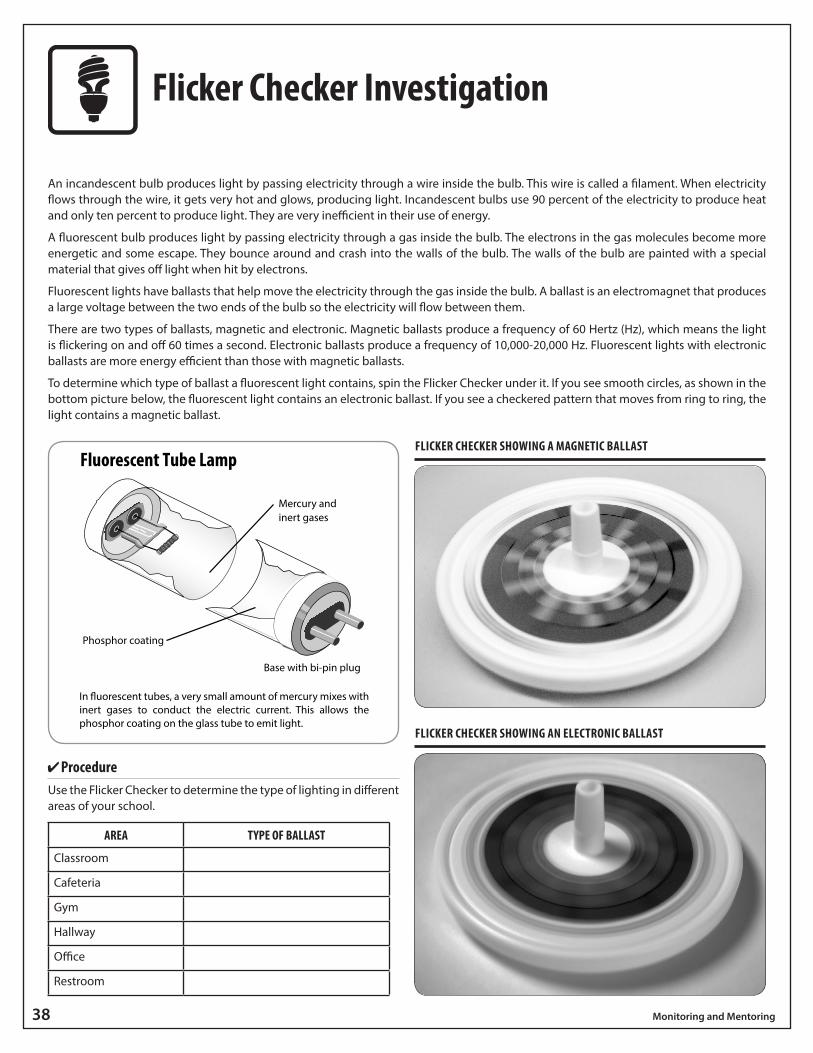
To determine which type of ballast a fluorescent light contains, spin the Flicker Checker under it. If you see smooth circles, as shown in the bottom picture below, the fluorescent light contains an electronic ballast. If you see a checkered pattern that moves from ring to ring, the light contains a magnetic ballast.
Flicker Checker Investigation
FLICKER CHECKER SHOWING A MAGNETIC BALLAST
FLICKER CHECKER SHOWING AN ELECTRONIC BALLAST
In �uorescent tubes, a very small amount of mercury mixes with inert gases to conduct the electric current. This allows the phosphor coating on the glass tube to emit light.
Fluorescent Tube Lamp
Mercury and inert gases
Phosphor coating
Base with bi-pin plug
ProcedureUse the Flicker Checker to determine the type of lighting in different areas of your school.
AREA TYPE OF BALLAST
Classroom
Cafeteria
Gym
Hallway
Office
Restroom
© 2015 The NEED Project 8408 Kao Circle, Manassas, VA 20110 1.800.875.5029 www.NEED.org 39
Electric Nameplates Investigation 1
Some appliances use more energy than others to accomplish the same task. Appliances that are very energy efficient are approved by the government’s ENERGY STAR® program and have the ENERGY STAR® label on them. This means they have met high standards set by the government for energy efficiency.
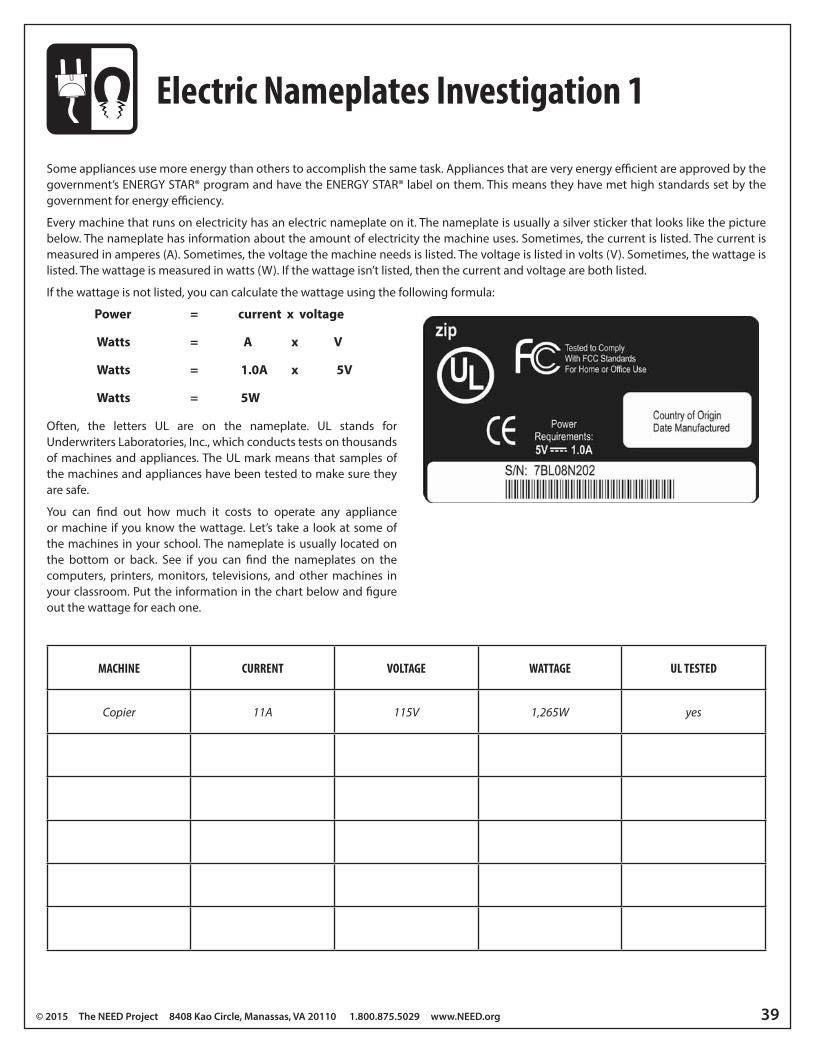
Every machine that runs on electricity has an electric nameplate on it. The nameplate is usually a silver sticker that looks like the picture below. The nameplate has information about the amount of electricity the machine uses. Sometimes, the current is listed. The current is measured in amperes (A). Sometimes, the voltage the machine needs is listed. The voltage is listed in volts (V). Sometimes, the wattage is listed. The wattage is measured in watts (W). If the wattage isn’t listed, then the current and voltage are both listed.
If the wattage is not listed, you can calculate the wattage using the following formula:
Power = current x voltage
Watts = A x V
Watts = 1.0A x 5V
Watts = 5W
Often, the letters UL are on the nameplate. UL stands for Underwriters Laboratories, Inc., which conducts tests on thousands of machines and appliances. The UL mark means that samples of the machines and appliances have been tested to make sure they are safe.
You can find out how much it costs to operate any appliance or machine if you know the wattage. Let’s take a look at some of the machines in your school. The nameplate is usually located on the bottom or back. See if you can find the nameplates on the computers, printers, monitors, televisions, and other machines in your classroom. Put the information in the chart below and figure out the wattage for each one.
MACHINE CURRENT VOLTAGE WATTAGE UL TESTED
Copier 11A 115V 1,265W yes
©2009 THE NEED PROJECT • P.O. BOX 10101 • MANASSAS, VA 20108 • 1-800-875-5029 Learning & Conserving Student PAGE 17
Some appliances use more energy than others to accomplish the same task. Appliancesthat are very energy efficient are approved by the government’s ENERGY STAR® programand have the ENERGY STAR® label on them. This means they have met high standards setby the government for energy efficiency.
Every machine that runs on electricity has an electric nameplate on it. The nameplate is usually a silversticker that looks like the picture below. The nameplate has information about the amount of electricity themachine uses. Sometimes, the current is listed. The current is measured in amperes (A). Sometimes, thevoltage the machine needs is listed. The voltage is listed in volts (V). Sometimes, the wattage is listed. Thewattage is measured in watts (W). If the wattage isn’t listed, then the current and voltage are both listed.
If the wattage isn’t listed, you can calculate the wattage using the following formula, like this:
Often, the letters UL are on the nameplate. UL stands for Underwriters Laboratories, Inc., which conductstests on thousands of machines and appliances. The UL mark means that samples of the machines andappliances have been tested to make sure they are safe.
You can find out how much it costs to operate any appliance or machine if you know the wattage. Take a lookat some of the machines in your school. The nameplate is usually located on the bottom or back. See if youcan find the nameplates on the computers, printers, monitors, televisions, and other machines in your classroom.Put the information in the chart below and figure out the wattage for each one.
Electric Nameplates
Machine Current Voltage Wattage UL tested
CopierCopierCopierCopierCopier 11 A 11 A 11 A 11 A 11 A 115 V 115 V 115 V 115 V 115 V 1,265 W 1,265 W 1,265 W 1,265 W 1,265 W yes yes yes yes yes
wattage = current x voltage
W = A x V
W = 1.0A x 5V
W = 5W
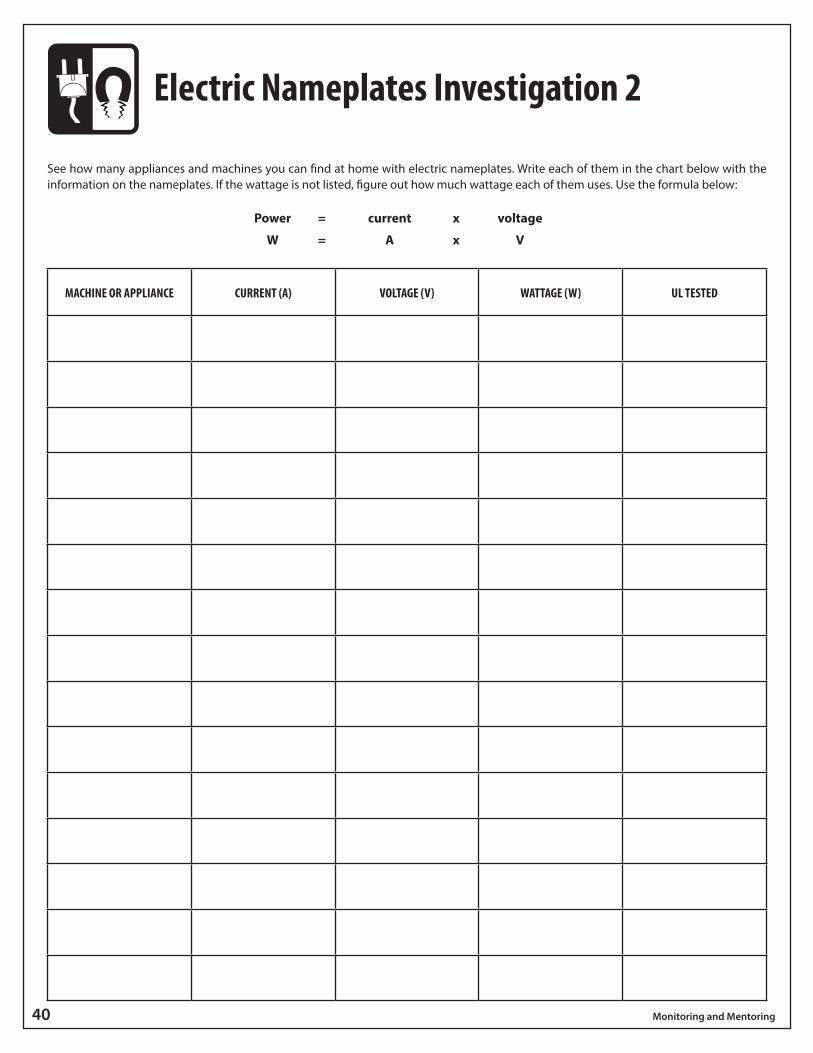
40 Monitoring and Mentoring
Electric Nameplates Investigation 2
See how many appliances and machines you can find at home with electric nameplates. Write each of them in the chart below with the information on the nameplates. If the wattage is not listed, figure out how much wattage each of them uses. Use the formula below:
Power = current x voltage
W = A x V
MACHINE OR APPLIANCE CURRENT (A) VOLTAGE (V) WATTAGE (W) UL TESTED
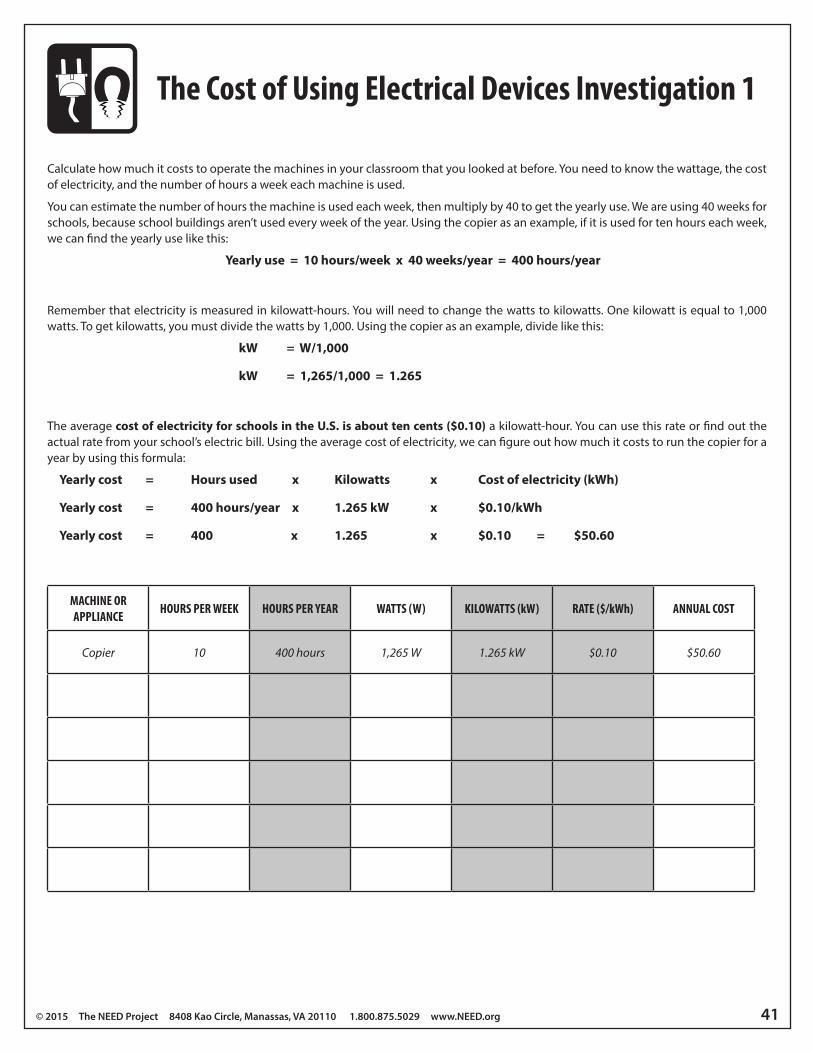
© 2015 The NEED Project 8408 Kao Circle, Manassas, VA 20110 1.800.875.5029 www.NEED.org 41
The Cost of Using Electrical Devices Investigation 1
Calculate how much it costs to operate the machines in your classroom that you looked at before. You need to know the wattage, the cost of electricity, and the number of hours a week each machine is used.
You can estimate the number of hours the machine is used each week, then multiply by 40 to get the yearly use. We are using 40 weeks for schools, because school buildings aren’t used every week of the year. Using the copier as an example, if it is used for ten hours each week, we can find the yearly use like this:
Yearly use = 10 hours/week x 40 weeks/year = 400 hours/year
Remember that electricity is measured in kilowatt-hours. You will need to change the watts to kilowatts. One kilowatt is equal to 1,000 watts. To get kilowatts, you must divide the watts by 1,000. Using the copier as an example, divide like this:
kW = W/1,000
kW = 1,265/1,000 = 1.265
The average cost of electricity for schools in the U.S. is about ten cents ($0.10) a kilowatt-hour. You can use this rate or find out the actual rate from your school’s electric bill. Using the average cost of electricity, we can figure out how much it costs to run the copier for a year by using this formula:
Yearly cost = Hours used x Kilowatts x Cost of electricity (kWh)
Yearly cost = 400 hours/year x 1.265 kW x $0.10/kWh
Yearly cost = 400 x 1.265 x $0.10 = $50.60
MACHINE OR APPLIANCE HOURS PER WEEK HOURS PER YEAR WATTS (W) KILOWATTS (kW) RATE ($/kWh) ANNUAL COST
Copier 10 400 hours 1,265 W 1.265 kW $0.10 $50.60
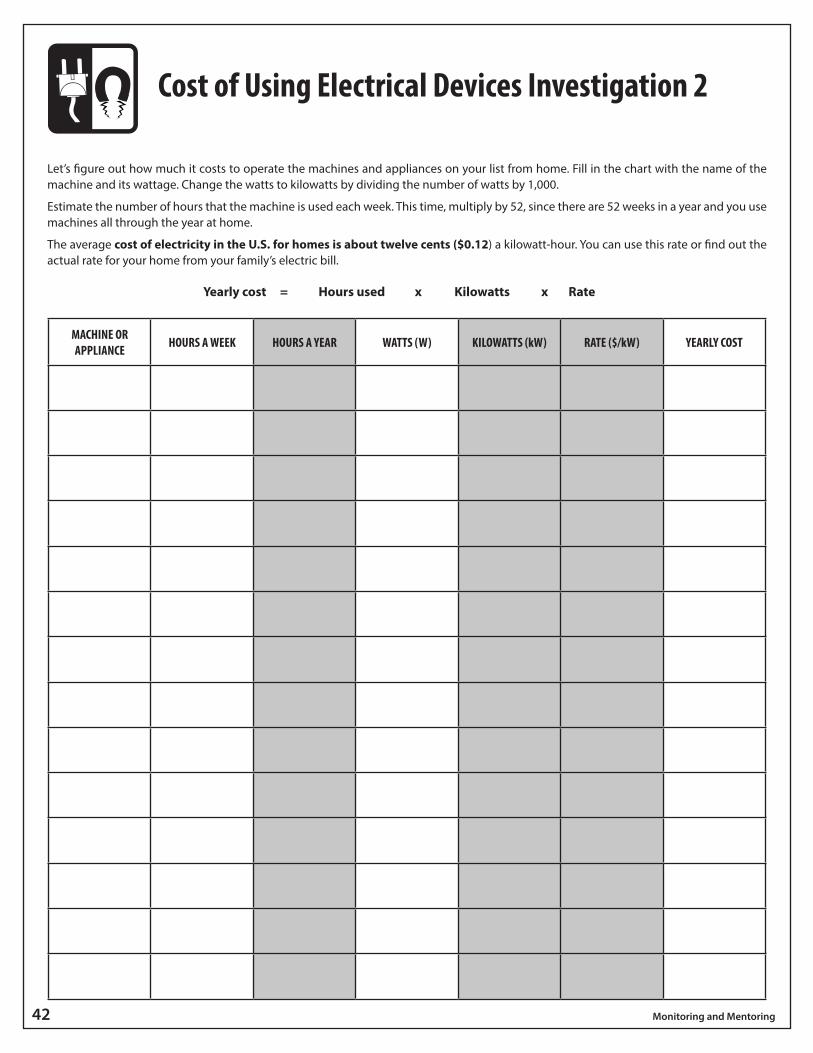
42 Monitoring and Mentoring
Cost of Using Electrical Devices Investigation 2
Let’s figure out how much it costs to operate the machines and appliances on your list from home. Fill in the chart with the name of the machine and its wattage. Change the watts to kilowatts by dividing the number of watts by 1,000.
Estimate the number of hours that the machine is used each week. This time, multiply by 52, since there are 52 weeks in a year and you use machines all through the year at home.
The average cost of electricity in the U.S. for homes is about twelve cents ($0.12) a kilowatt-hour. You can use this rate or find out the actual rate for your home from your family’s electric bill.
Yearly cost = Hours used x Kilowatts x Rate
MACHINE OR APPLIANCE HOURS A WEEK HOURS A YEAR WATTS (W) KILOWATTS (kW) RATE ($/kW) YEARLY COST
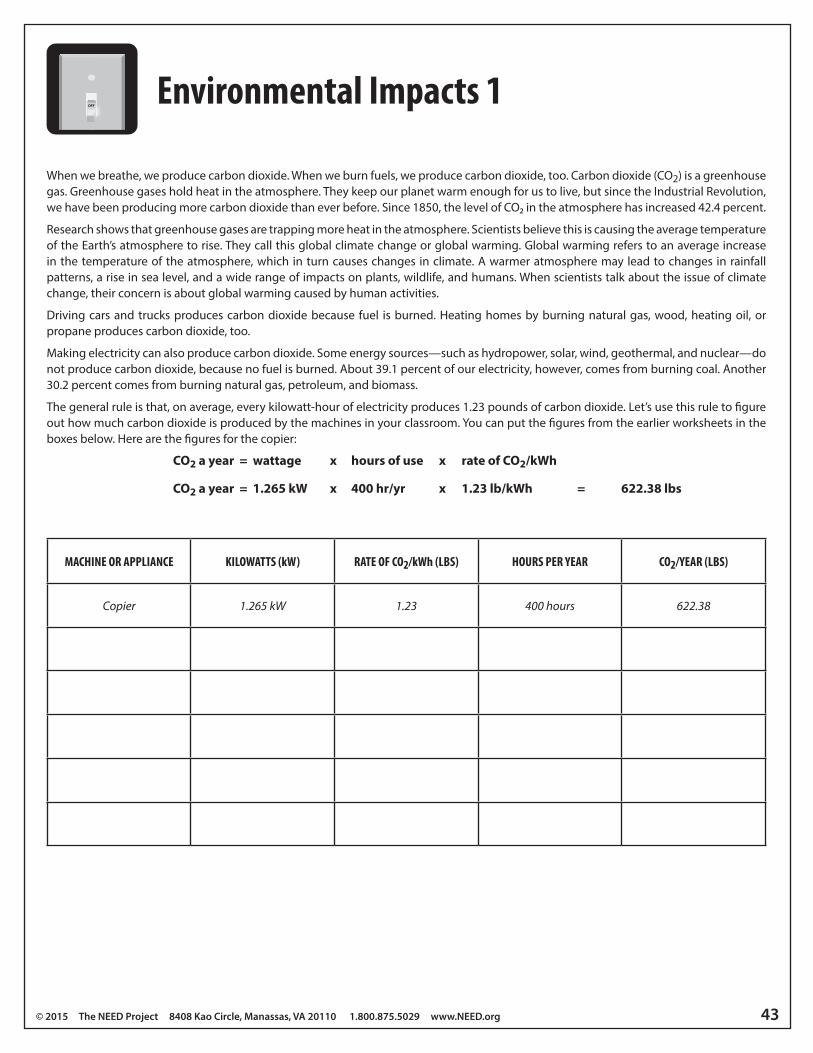
© 2015 The NEED Project 8408 Kao Circle, Manassas, VA 20110 1.800.875.5029 www.NEED.org 43
OFFEnvironmental Impacts 1
When we breathe, we produce carbon dioxide. When we burn fuels, we produce carbon dioxide, too. Carbon dioxide (CO2) is a greenhouse gas. Greenhouse gases hold heat in the atmosphere. They keep our planet warm enough for us to live, but since the Industrial Revolution, we have been producing more carbon dioxide than ever before. Since 1850, the level of CO2 in the atmosphere has increased 42.4 percent.
Research shows that greenhouse gases are trapping more heat in the atmosphere. Scientists believe this is causing the average temperature of the Earth’s atmosphere to rise. They call this global climate change or global warming. Global warming refers to an average increase in the temperature of the atmosphere, which in turn causes changes in climate. A warmer atmosphere may lead to changes in rainfall patterns, a rise in sea level, and a wide range of impacts on plants, wildlife, and humans. When scientists talk about the issue of climate change, their concern is about global warming caused by human activities.
Driving cars and trucks produces carbon dioxide because fuel is burned. Heating homes by burning natural gas, wood, heating oil, or propane produces carbon dioxide, too.
Making electricity can also produce carbon dioxide. Some energy sources—such as hydropower, solar, wind, geothermal, and nuclear—do not produce carbon dioxide, because no fuel is burned. About 39.1 percent of our electricity, however, comes from burning coal. Another 30.2 percent comes from burning natural gas, petroleum, and biomass.
The general rule is that, on average, every kilowatt-hour of electricity produces 1.23 pounds of carbon dioxide. Let’s use this rule to figure out how much carbon dioxide is produced by the machines in your classroom. You can put the figures from the earlier worksheets in the boxes below. Here are the figures for the copier:
CO2 a year = wattage x hours of use x rate of CO2/kWh
CO2 a year = 1.265 kW x 400 hr/yr x 1.23 lb/kWh = 622.38 lbs
MACHINE OR APPLIANCE KILOWATTS (kW) RATE OF CO2/kWh (LBS) HOURS PER YEAR CO2/YEAR (LBS)
Copier 1.265 kW 1.23 400 hours 622.38
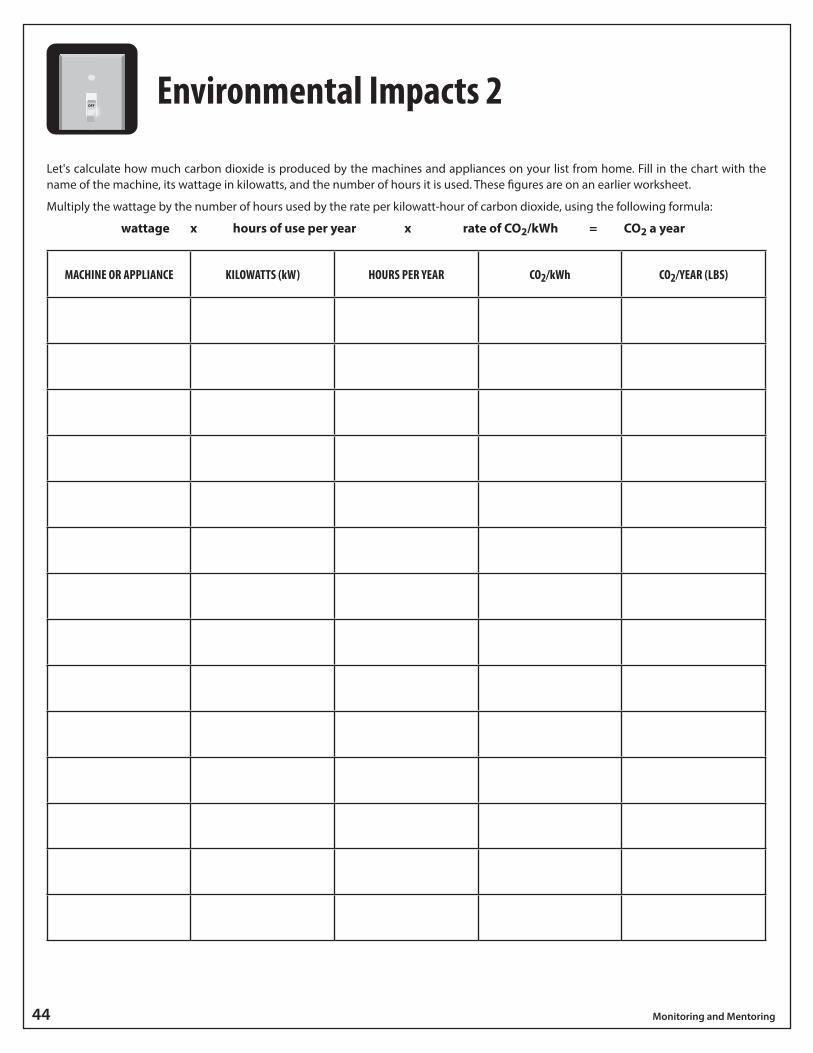
44 Monitoring and Mentoring
OFFEnvironmental Impacts 2
Let's calculate how much carbon dioxide is produced by the machines and appliances on your list from home. Fill in the chart with the name of the machine, its wattage in kilowatts, and the number of hours it is used. These figures are on an earlier worksheet.
Multiply the wattage by the number of hours used by the rate per kilowatt-hour of carbon dioxide, using the following formula:
wattage x hours of use per year x rate of CO2/kWh = CO2 a year
MACHINE OR APPLIANCE KILOWATTS (kW) HOURS PER YEAR CO2/kWh CO2/YEAR (LBS)
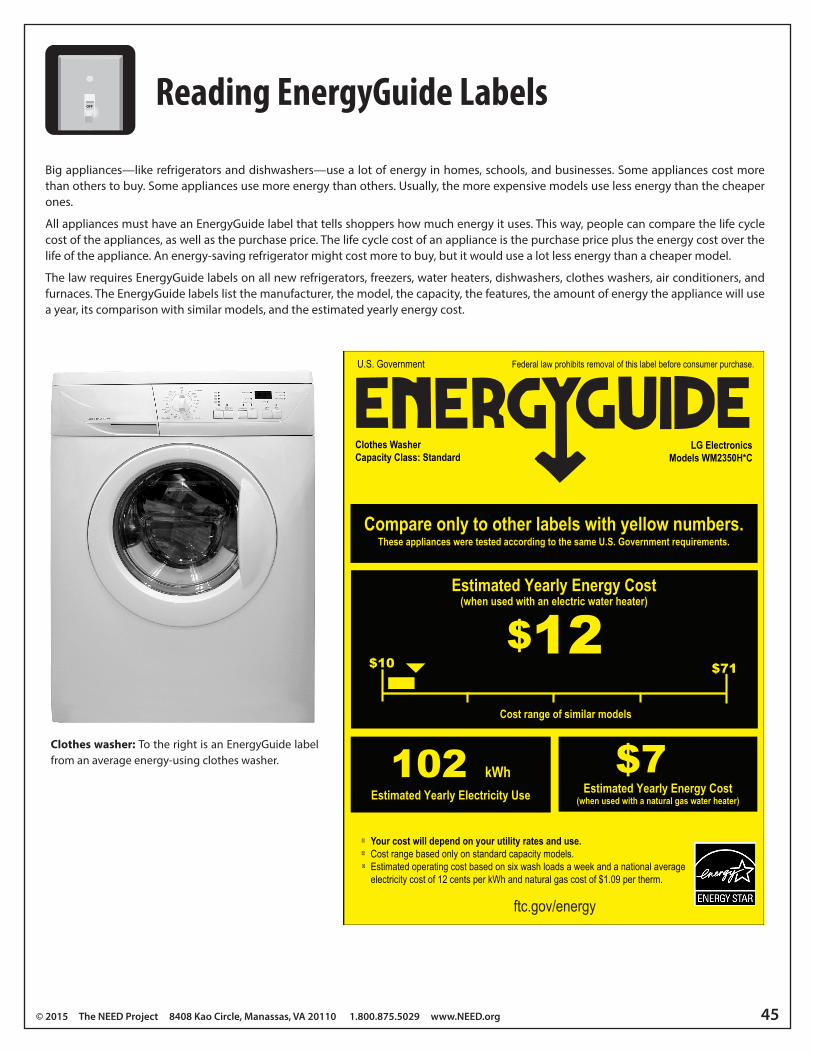
© 2015 The NEED Project 8408 Kao Circle, Manassas, VA 20110 1.800.875.5029 www.NEED.org 45
OFFReading EnergyGuide Labels
Big appliances—like refrigerators and dishwashers—use a lot of energy in homes, schools, and businesses. Some appliances cost more than others to buy. Some appliances use more energy than others. Usually, the more expensive models use less energy than the cheaper ones.
All appliances must have an EnergyGuide label that tells shoppers how much energy it uses. This way, people can compare the life cycle cost of the appliances, as well as the purchase price. The life cycle cost of an appliance is the purchase price plus the energy cost over the life of the appliance. An energy-saving refrigerator might cost more to buy, but it would use a lot less energy than a cheaper model.
The law requires EnergyGuide labels on all new refrigerators, freezers, water heaters, dishwashers, clothes washers, air conditioners, and furnaces. The EnergyGuide labels list the manufacturer, the model, the capacity, the features, the amount of energy the appliance will use a year, its comparison with similar models, and the estimated yearly energy cost.
Clothes washer: To the right is an EnergyGuide label from an average energy-using clothes washer.
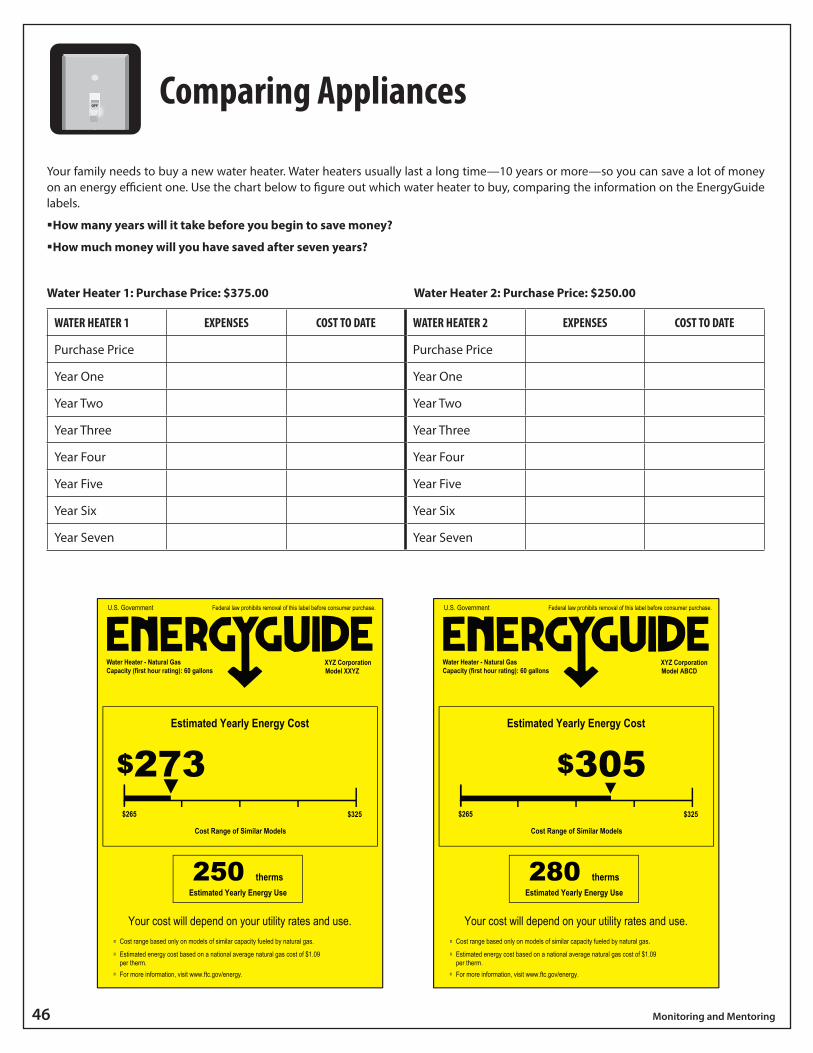
46 Monitoring and Mentoring
OFFComparing Appliances
Your family needs to buy a new water heater. Water heaters usually last a long time—10 years or more—so you can save a lot of money on an energy efficient one. Use the chart below to figure out which water heater to buy, comparing the information on the EnergyGuide labels.
�How many years will it take before you begin to save money?
�How much money will you have saved after seven years?
Water Heater 1: Purchase Price: $375.00 Water Heater 2: Purchase Price: $250.00
WATER HEATER 1 EXPENSES COST TO DATE WATER HEATER 2 EXPENSES COST TO DATE
Purchase Price Purchase Price
Year One Year One
Year Two Year Two
Year Three Year Three
Year Four Year Four
Year Five Year Five
Year Six Year Six
Year Seven Year Seven
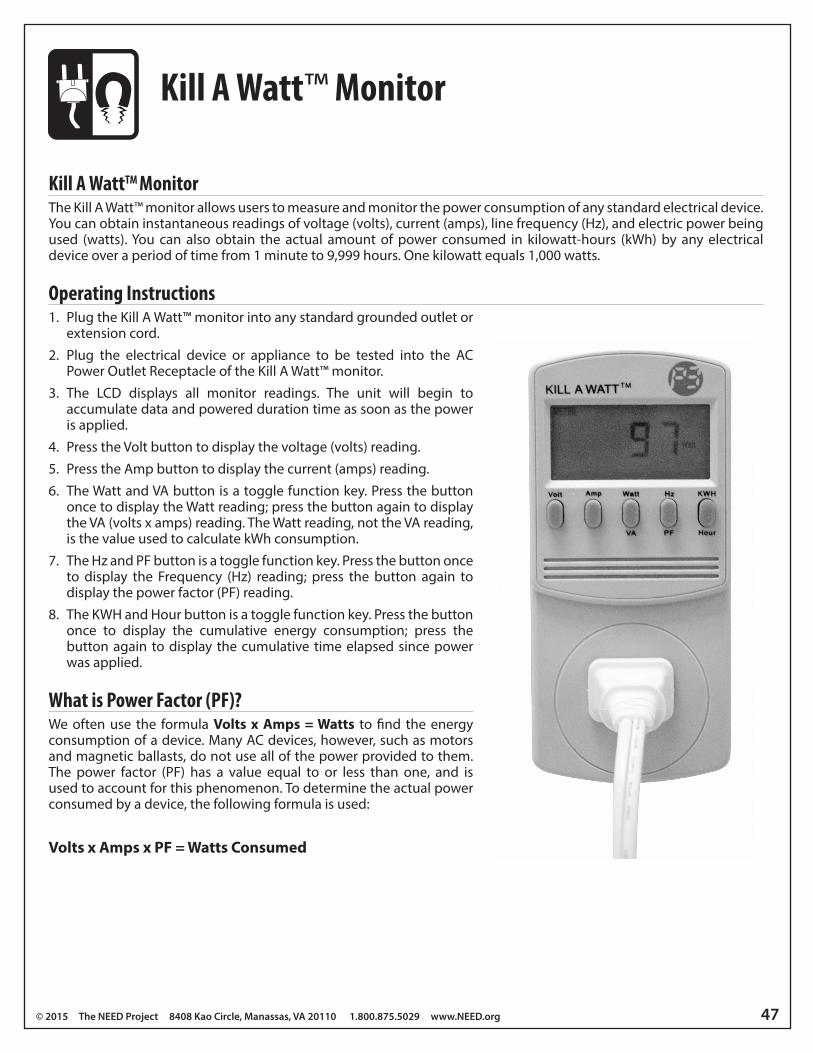
© 2015 The NEED Project 8408 Kao Circle, Manassas, VA 20110 1.800.875.5029 www.NEED.org 47
Kill A WattTM MonitorThe Kill A Watt™ monitor allows users to measure and monitor the power consumption of any standard electrical device. You can obtain instantaneous readings of voltage (volts), current (amps), line frequency (Hz), and electric power being used (watts). You can also obtain the actual amount of power consumed in kilowatt-hours (kWh) by any electrical device over a period of time from 1 minute to 9,999 hours. One kilowatt equals 1,000 watts.
Operating Instructions1. Plug the Kill A Watt™ monitor into any standard grounded outlet or
extension cord.2. Plug the electrical device or appliance to be tested into the AC
Power Outlet Receptacle of the Kill A Watt™ monitor.3. The LCD displays all monitor readings. The unit will begin to
accumulate data and powered duration time as soon as the power is applied.
4. Press the Volt button to display the voltage (volts) reading.5. Press the Amp button to display the current (amps) reading.6. The Watt and VA button is a toggle function key. Press the button
once to display the Watt reading; press the button again to display the VA (volts x amps) reading. The Watt reading, not the VA reading, is the value used to calculate kWh consumption.
7. The Hz and PF button is a toggle function key. Press the button once to display the Frequency (Hz) reading; press the button again to display the power factor (PF) reading.
8. The KWH and Hour button is a toggle function key. Press the button once to display the cumulative energy consumption; press the button again to display the cumulative time elapsed since power was applied.
What is Power Factor (PF)?We often use the formula Volts x Amps = Watts to find the energy consumption of a device. Many AC devices, however, such as motors and magnetic ballasts, do not use all of the power provided to them. The power factor (PF) has a value equal to or less than one, and is used to account for this phenomenon. To determine the actual power consumed by a device, the following formula is used:
Volts x Amps x PF = Watts Consumed
Kill A Watt™ Monitor
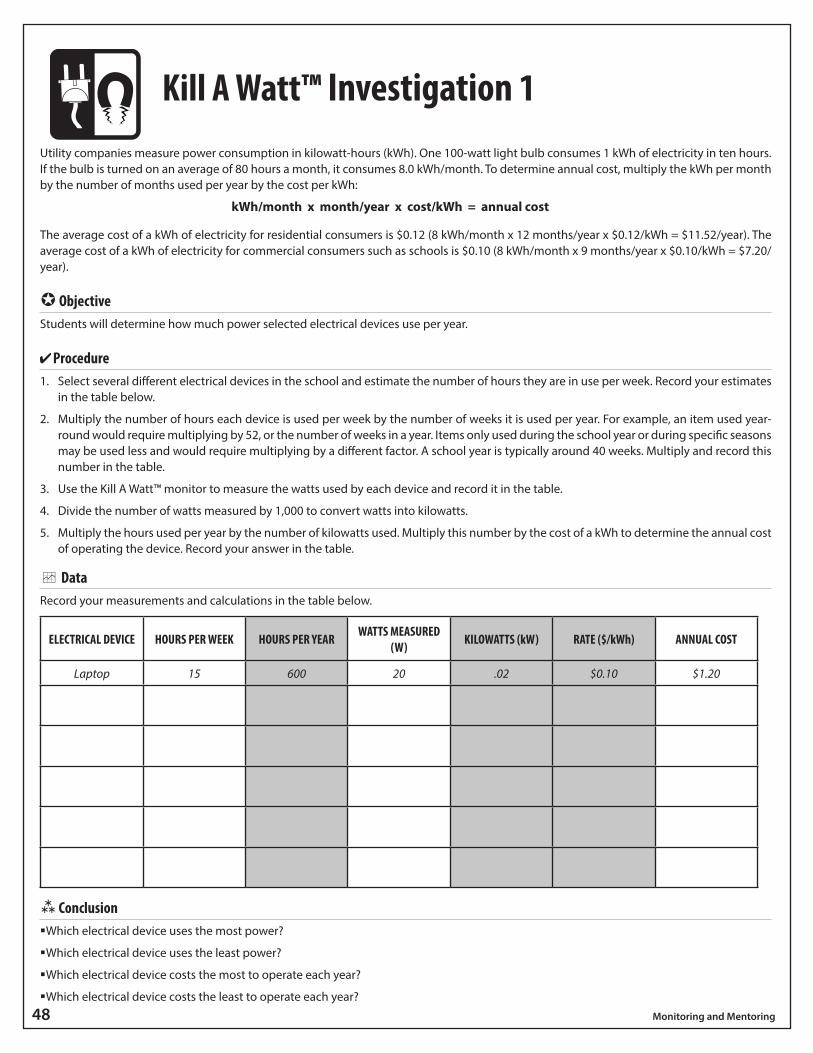
48 Monitoring and Mentoring
Kill A Watt™ Investigation 1Utility companies measure power consumption in kilowatt-hours (kWh). One 100-watt light bulb consumes 1 kWh of electricity in ten hours. If the bulb is turned on an average of 80 hours a month, it consumes 8.0 kWh/month. To determine annual cost, multiply the kWh per month by the number of months used per year by the cost per kWh:
kWh/month x month/year x cost/kWh = annual cost
The average cost of a kWh of electricity for residential consumers is $0.12 (8 kWh/month x 12 months/year x $0.12/kWh = $11.52/year). The average cost of a kWh of electricity for commercial consumers such as schools is $0.10 (8 kWh/month x 9 months/year x $0.10/kWh = $7.20/year).
ObjectiveStudents will determine how much power selected electrical devices use per year.
Procedure1. Select several different electrical devices in the school and estimate the number of hours they are in use per week. Record your estimates
in the table below.
2. Multiply the number of hours each device is used per week by the number of weeks it is used per year. For example, an item used year-round would require multiplying by 52, or the number of weeks in a year. Items only used during the school year or during specific seasons may be used less and would require multiplying by a different factor. A school year is typically around 40 weeks. Multiply and record this number in the table.
3. Use the Kill A Watt™ monitor to measure the watts used by each device and record it in the table.
4. Divide the number of watts measured by 1,000 to convert watts into kilowatts.
5. Multiply the hours used per year by the number of kilowatts used. Multiply this number by the cost of a kWh to determine the annual cost of operating the device. Record your answer in the table.
DataRecord your measurements and calculations in the table below.
ELECTRICAL DEVICE HOURS PER WEEK HOURS PER YEAR WATTS MEASURED (W) KILOWATTS (kW) RATE ($/kWh) ANNUAL COST
Laptop 15 600 20 .02 $0.10 $1.20
Conclusion �Which electrical device uses the most power?
�Which electrical device uses the least power?
�Which electrical device costs the most to operate each year?
�Which electrical device costs the least to operate each year?
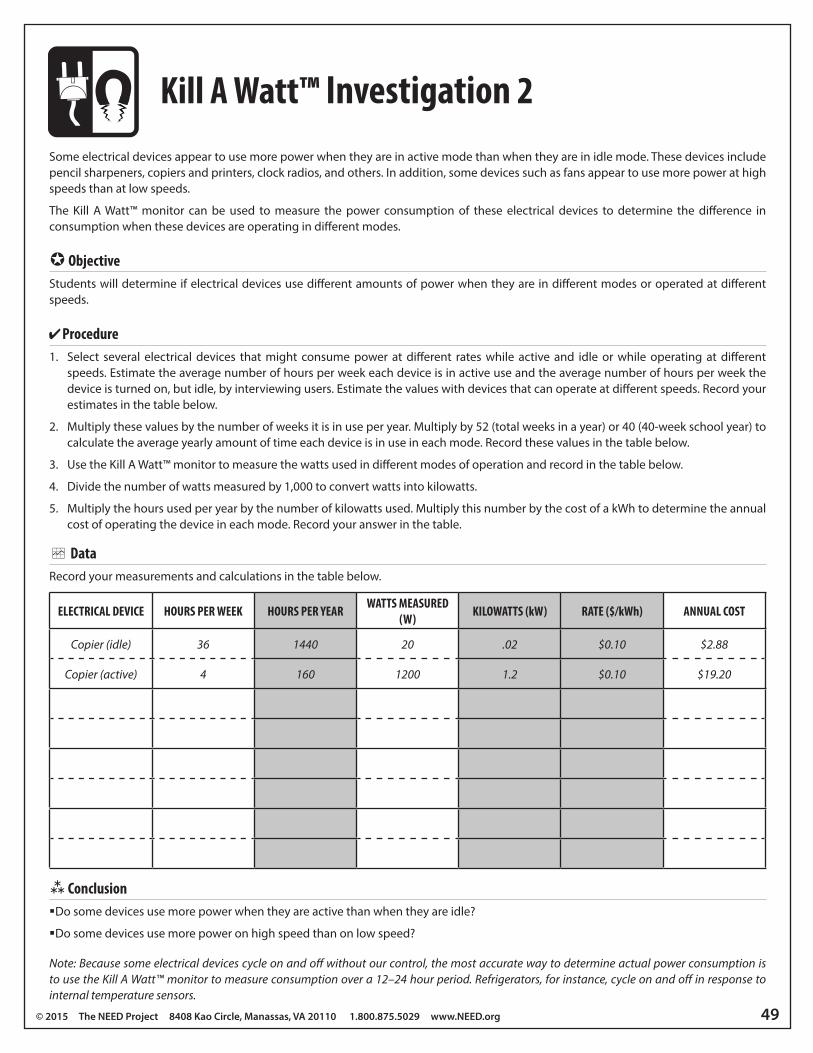
© 2015 The NEED Project 8408 Kao Circle, Manassas, VA 20110 1.800.875.5029 www.NEED.org 49
Kill A Watt™ Investigation 2Some electrical devices appear to use more power when they are in active mode than when they are in idle mode. These devices include pencil sharpeners, copiers and printers, clock radios, and others. In addition, some devices such as fans appear to use more power at high speeds than at low speeds.
The Kill A Watt™ monitor can be used to measure the power consumption of these electrical devices to determine the difference in consumption when these devices are operating in different modes.
ObjectiveStudents will determine if electrical devices use different amounts of power when they are in different modes or operated at different speeds.
Procedure1. Select several electrical devices that might consume power at different rates while active and idle or while operating at different
speeds. Estimate the average number of hours per week each device is in active use and the average number of hours per week the device is turned on, but idle, by interviewing users. Estimate the values with devices that can operate at different speeds. Record your estimates in the table below.
2. Multiply these values by the number of weeks it is in use per year. Multiply by 52 (total weeks in a year) or 40 (40-week school year) to calculate the average yearly amount of time each device is in use in each mode. Record these values in the table below.
3. Use the Kill A Watt™ monitor to measure the watts used in different modes of operation and record in the table below.
4. Divide the number of watts measured by 1,000 to convert watts into kilowatts.
5. Multiply the hours used per year by the number of kilowatts used. Multiply this number by the cost of a kWh to determine the annual cost of operating the device in each mode. Record your answer in the table.
DataRecord your measurements and calculations in the table below.
ELECTRICAL DEVICE HOURS PER WEEK HOURS PER YEAR WATTS MEASURED (W) KILOWATTS (kW) RATE ($/kWh) ANNUAL COST
Copier (idle) 36 1440 20 .02 $0.10 $2.88
Copier (active) 4 160 1200 1.2 $0.10 $19.20
Conclusion �Do some devices use more power when they are active than when they are idle?
�Do some devices use more power on high speed than on low speed?
Note: Because some electrical devices cycle on and off without our control, the most accurate way to determine actual power consumption is to use the Kill A Watt™ monitor to measure consumption over a 12–24 hour period. Refrigerators, for instance, cycle on and off in response to internal temperature sensors.
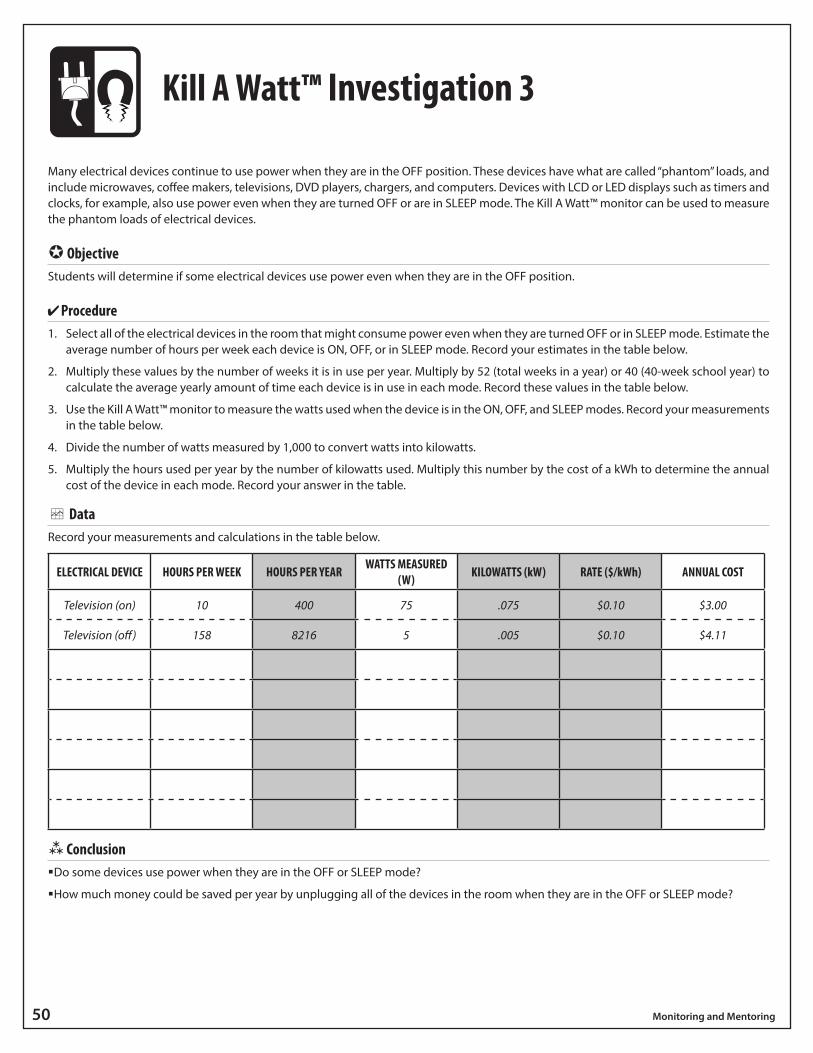
50 Monitoring and Mentoring
Kill A Watt™ Investigation 3
Many electrical devices continue to use power when they are in the OFF position. These devices have what are called “phantom” loads, and include microwaves, coffee makers, televisions, DVD players, chargers, and computers. Devices with LCD or LED displays such as timers and clocks, for example, also use power even when they are turned OFF or are in SLEEP mode. The Kill A Watt™ monitor can be used to measure the phantom loads of electrical devices.
ObjectiveStudents will determine if some electrical devices use power even when they are in the OFF position.
Procedure1. Select all of the electrical devices in the room that might consume power even when they are turned OFF or in SLEEP mode. Estimate the
average number of hours per week each device is ON, OFF, or in SLEEP mode. Record your estimates in the table below.
2. Multiply these values by the number of weeks it is in use per year. Multiply by 52 (total weeks in a year) or 40 (40-week school year) to calculate the average yearly amount of time each device is in use in each mode. Record these values in the table below.
3. Use the Kill A Watt™ monitor to measure the watts used when the device is in the ON, OFF, and SLEEP modes. Record your measurements in the table below.
4. Divide the number of watts measured by 1,000 to convert watts into kilowatts.
5. Multiply the hours used per year by the number of kilowatts used. Multiply this number by the cost of a kWh to determine the annual cost of the device in each mode. Record your answer in the table.
DataRecord your measurements and calculations in the table below.
ELECTRICAL DEVICE HOURS PER WEEK HOURS PER YEAR WATTS MEASURED (W) KILOWATTS (kW) RATE ($/kWh) ANNUAL COST
Television (on) 10 400 75 .075 $0.10 $3.00
Television (off) 158 8216 5 .005 $0.10 $4.11
Conclusion �Do some devices use power when they are in the OFF or SLEEP mode?
�How much money could be saved per year by unplugging all of the devices in the room when they are in the OFF or SLEEP mode?
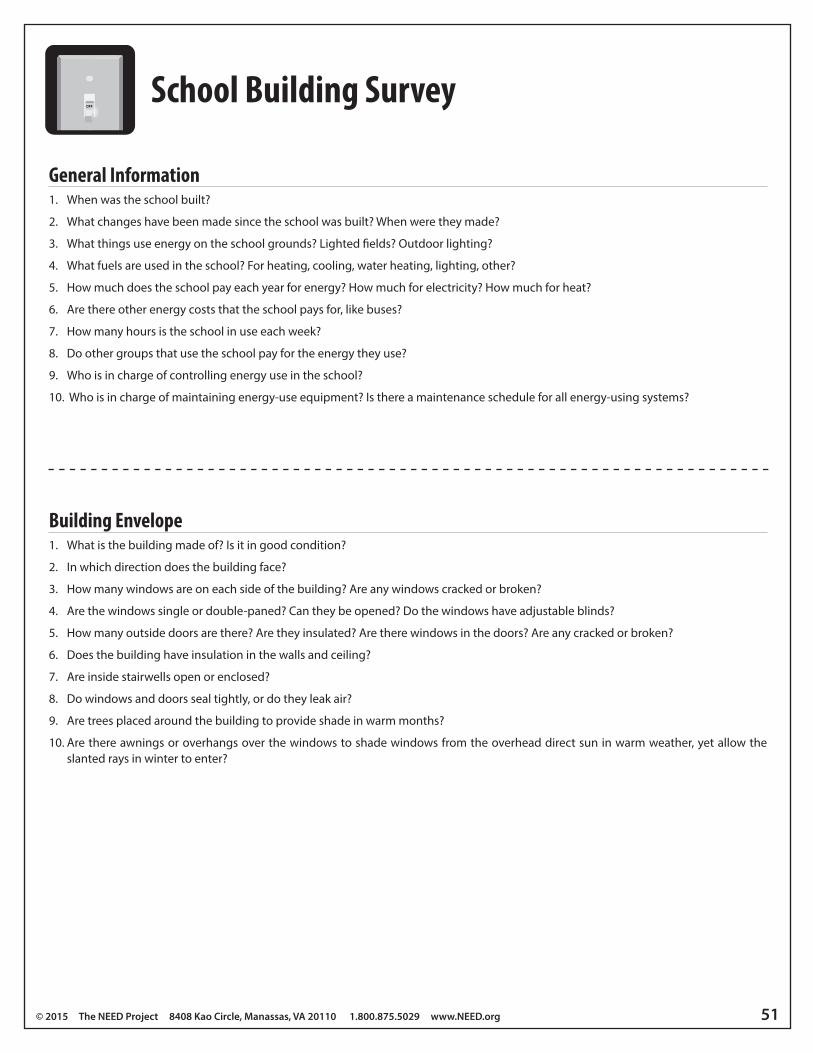
© 2015 The NEED Project 8408 Kao Circle, Manassas, VA 20110 1.800.875.5029 www.NEED.org 51
School Building SurveyOFF
General Information1. When was the school built?
2. What changes have been made since the school was built? When were they made?
3. What things use energy on the school grounds? Lighted fields? Outdoor lighting?
4. What fuels are used in the school? For heating, cooling, water heating, lighting, other?
5. How much does the school pay each year for energy? How much for electricity? How much for heat?
6. Are there other energy costs that the school pays for, like buses?
7. How many hours is the school in use each week?
8. Do other groups that use the school pay for the energy they use?
9. Who is in charge of controlling energy use in the school?
10. Who is in charge of maintaining energy-use equipment? Is there a maintenance schedule for all energy-using systems?
Building Envelope1. What is the building made of? Is it in good condition?
2. In which direction does the building face?
3. How many windows are on each side of the building? Are any windows cracked or broken?
4. Are the windows single or double-paned? Can they be opened? Do the windows have adjustable blinds?
5. How many outside doors are there? Are they insulated? Are there windows in the doors? Are any cracked or broken?
6. Does the building have insulation in the walls and ceiling?
7. Are inside stairwells open or enclosed?
8. Do windows and doors seal tightly, or do they leak air?
9. Are trees placed around the building to provide shade in warm months?
10. Are there awnings or overhangs over the windows to shade windows from the overhead direct sun in warm weather, yet allow the slanted rays in winter to enter?
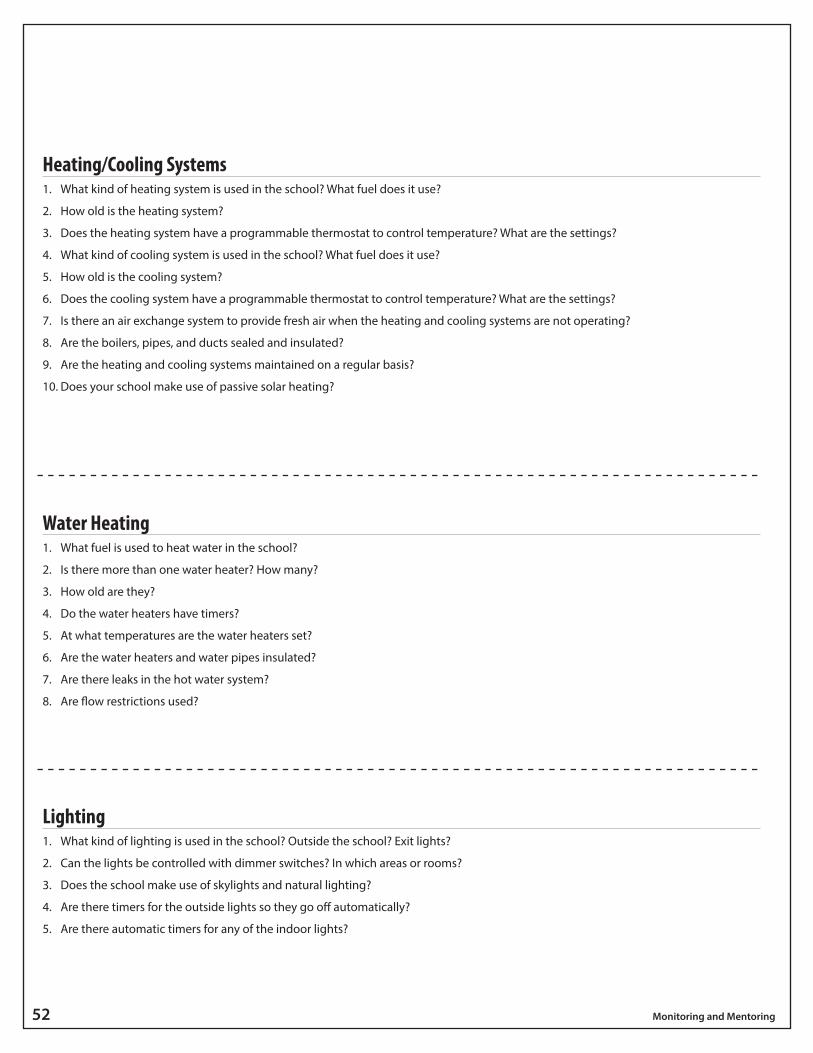
52 Monitoring and Mentoring
Heating/Cooling Systems1. What kind of heating system is used in the school? What fuel does it use?
2. How old is the heating system?
3. Does the heating system have a programmable thermostat to control temperature? What are the settings?
4. What kind of cooling system is used in the school? What fuel does it use?
5. How old is the cooling system?
6. Does the cooling system have a programmable thermostat to control temperature? What are the settings?
7. Is there an air exchange system to provide fresh air when the heating and cooling systems are not operating?
8. Are the boilers, pipes, and ducts sealed and insulated?
9. Are the heating and cooling systems maintained on a regular basis?
10. Does your school make use of passive solar heating?
Lighting1. What kind of lighting is used in the school? Outside the school? Exit lights?
2. Can the lights be controlled with dimmer switches? In which areas or rooms?
3. Does the school make use of skylights and natural lighting?
4. Are there timers for the outside lights so they go off automatically?
5. Are there automatic timers for any of the indoor lights?
Water Heating1. What fuel is used to heat water in the school?
2. Is there more than one water heater? How many?
3. How old are they?
4. Do the water heaters have timers?
5. At what temperatures are the water heaters set?
6. Are the water heaters and water pipes insulated?
7. Are there leaks in the hot water system?
8. Are flow restrictions used?

© 2015 The NEED Project 8408 Kao Circle, Manassas, VA 20110 1.800.875.5029 www.NEED.org 53
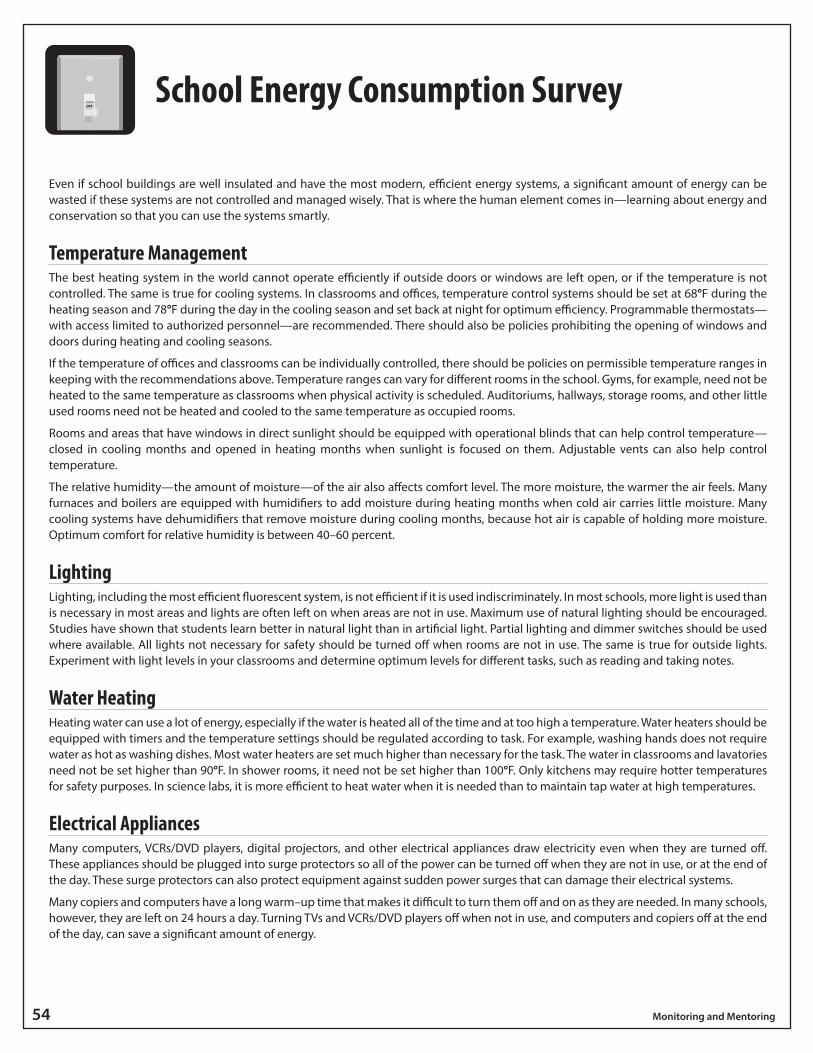
54 Monitoring and Mentoring
School Energy Consumption SurveyOFF
Even if school buildings are well insulated and have the most modern, efficient energy systems, a significant amount of energy can be wasted if these systems are not controlled and managed wisely. That is where the human element comes in—learning about energy and conservation so that you can use the systems smartly.
Temperature ManagementThe best heating system in the world cannot operate efficiently if outside doors or windows are left open, or if the temperature is not controlled. The same is true for cooling systems. In classrooms and offices, temperature control systems should be set at 68°F during the heating season and 78°F during the day in the cooling season and set back at night for optimum efficiency. Programmable thermostats—with access limited to authorized personnel—are recommended. There should also be policies prohibiting the opening of windows and doors during heating and cooling seasons.
If the temperature of offices and classrooms can be individually controlled, there should be policies on permissible temperature ranges in keeping with the recommendations above. Temperature ranges can vary for different rooms in the school. Gyms, for example, need not be heated to the same temperature as classrooms when physical activity is scheduled. Auditoriums, hallways, storage rooms, and other little used rooms need not be heated and cooled to the same temperature as occupied rooms.
Rooms and areas that have windows in direct sunlight should be equipped with operational blinds that can help control temperature—closed in cooling months and opened in heating months when sunlight is focused on them. Adjustable vents can also help control temperature.
The relative humidity—the amount of moisture—of the air also affects comfort level. The more moisture, the warmer the air feels. Many furnaces and boilers are equipped with humidifiers to add moisture during heating months when cold air carries little moisture. Many cooling systems have dehumidifiers that remove moisture during cooling months, because hot air is capable of holding more moisture. Optimum comfort for relative humidity is between 40–60 percent.
LightingLighting, including the most efficient fluorescent system, is not efficient if it is used indiscriminately. In most schools, more light is used than is necessary in most areas and lights are often left on when areas are not in use. Maximum use of natural lighting should be encouraged. Studies have shown that students learn better in natural light than in artificial light. Partial lighting and dimmer switches should be used where available. All lights not necessary for safety should be turned off when rooms are not in use. The same is true for outside lights. Experiment with light levels in your classrooms and determine optimum levels for different tasks, such as reading and taking notes.
Water HeatingHeating water can use a lot of energy, especially if the water is heated all of the time and at too high a temperature. Water heaters should be equipped with timers and the temperature settings should be regulated according to task. For example, washing hands does not require water as hot as washing dishes. Most water heaters are set much higher than necessary for the task. The water in classrooms and lavatories need not be set higher than 90°F. In shower rooms, it need not be set higher than 100°F. Only kitchens may require hotter temperatures for safety purposes. In science labs, it is more efficient to heat water when it is needed than to maintain tap water at high temperatures.
Electrical AppliancesMany computers, VCRs/DVD players, digital projectors, and other electrical appliances draw electricity even when they are turned off. These appliances should be plugged into surge protectors so all of the power can be turned off when they are not in use, or at the end of the day. These surge protectors can also protect equipment against sudden power surges that can damage their electrical systems.
Many copiers and computers have a long warm–up time that makes it difficult to turn them off and on as they are needed. In many schools, however, they are left on 24 hours a day. Turning TVs and VCRs/DVD players off when not in use, and computers and copiers off at the end of the day, can save a significant amount of energy.
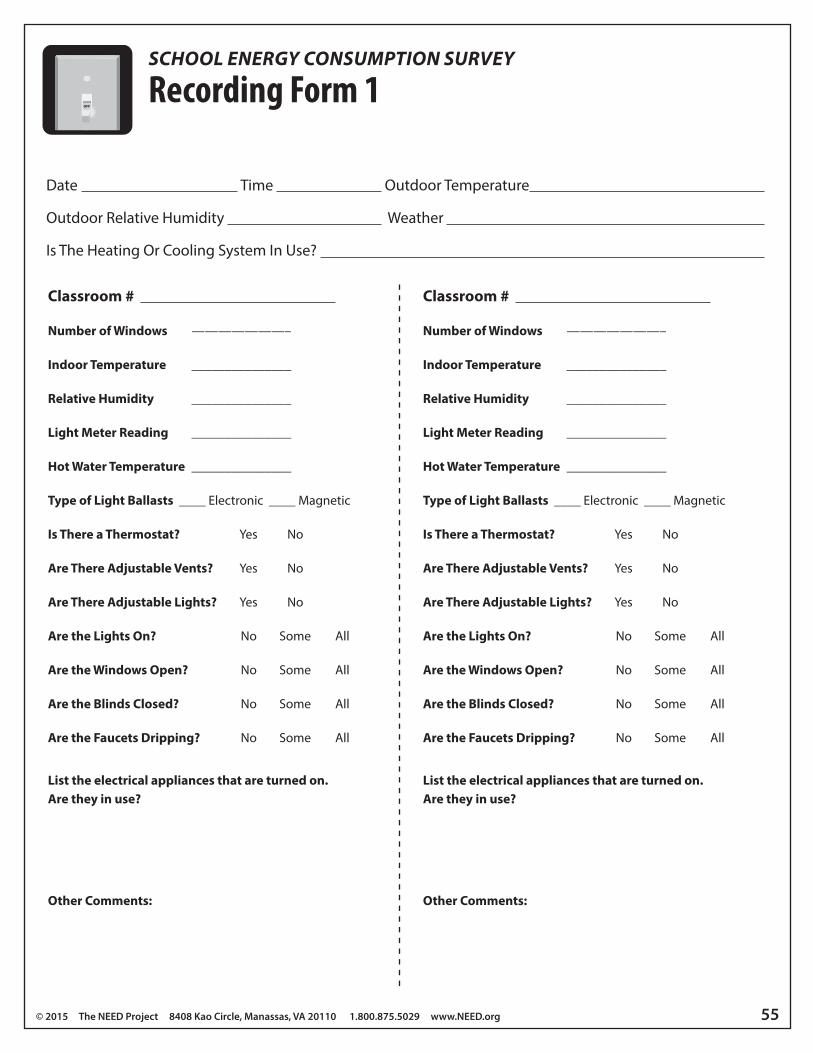
© 2015 The NEED Project 8408 Kao Circle, Manassas, VA 20110 1.800.875.5029 www.NEED.org 55
Recording Form 1OFF
Date Time Outdoor Temperature
Outdoor Relative Humidity Weather
Is The Heating Or Cooling System In Use?
Classroom #
Number of Windows ———————–
Indoor Temperature _______________
Relative Humidity _______________
Light Meter Reading _______________
Hot Water Temperature _______________
Type of Light Ballasts ____ Electronic ____ Magnetic
Is There a Thermostat? Yes No
Are There Adjustable Vents? Yes No
Are There Adjustable Lights? Yes No
Are the Lights On? No Some All
Are the Windows Open? No Some All
Are the Blinds Closed? No Some All
Are the Faucets Dripping? No Some All
List the electrical appliances that are turned on. Are they in use?
Other Comments:
SCHOOL ENERGY CONSUMPTION SURVEY
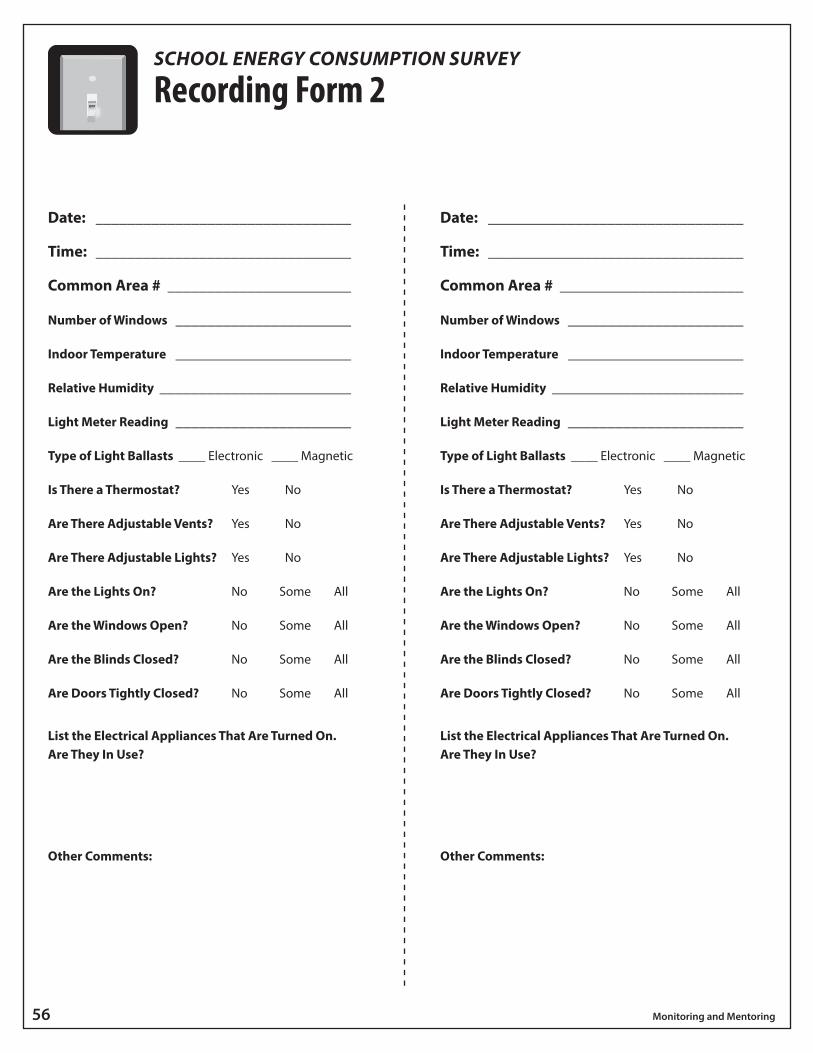
56 Monitoring and Mentoring
Recording Form 2OFF
Date: ________________________________
Time: ________________________________
Common Area # _______________________
Number of Windows ______________________
Indoor Temperature ______________________
Relative Humidity ________________________
Light Meter Reading ______________________
Type of Light Ballasts ____ Electronic ____ Magnetic
Is There a Thermostat? Yes No
Are There Adjustable Vents? Yes No
Are There Adjustable Lights? Yes No
Are the Lights On? No Some All
Are the Windows Open? No Some All
Are the Blinds Closed? No Some All
Are Doors Tightly Closed? No Some All
List the Electrical Appliances That Are Turned On. Are They In Use?
Other Comments:
SCHOOL ENERGY CONSUMPTION SURVEY
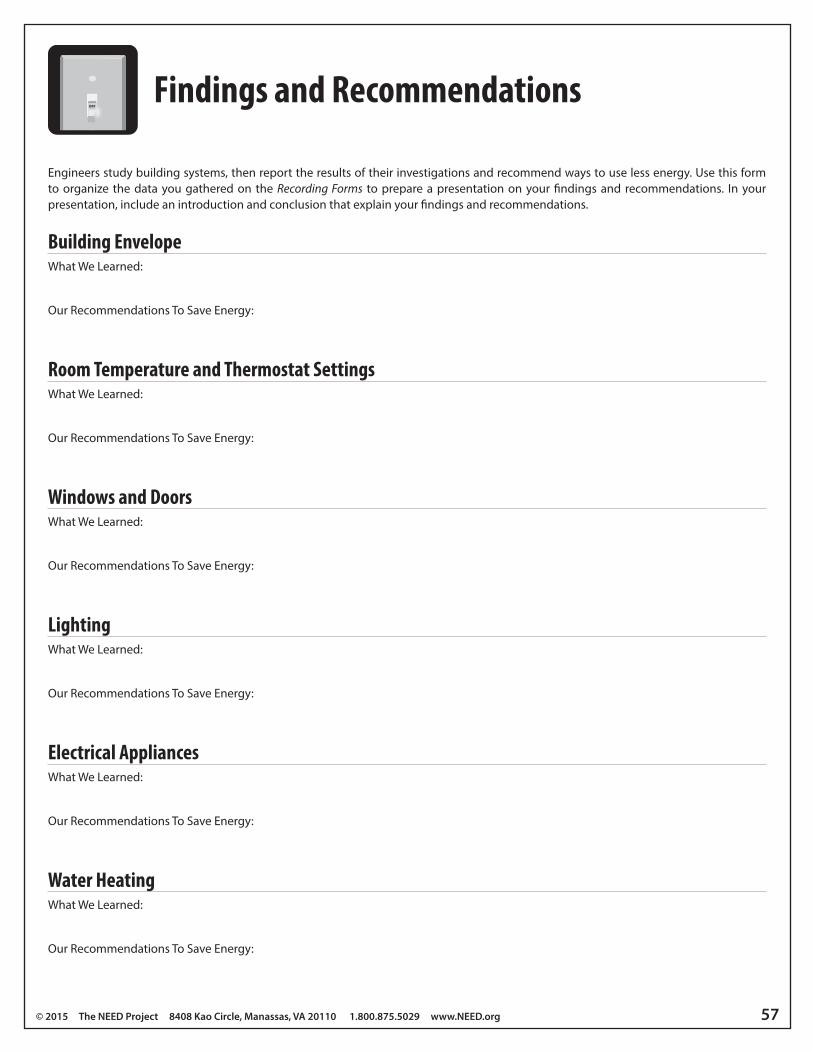
© 2015 The NEED Project 8408 Kao Circle, Manassas, VA 20110 1.800.875.5029 www.NEED.org 57
Findings and RecommendationsOFF
Engineers study building systems, then report the results of their investigations and recommend ways to use less energy. Use this form to organize the data you gathered on the Recording Forms to prepare a presentation on your findings and recommendations. In your presentation, include an introduction and conclusion that explain your findings and recommendations.
Building EnvelopeWhat We Learned:
Our Recommendations To Save Energy:
Room Temperature and Thermostat SettingsWhat We Learned:
Our Recommendations To Save Energy:
Windows and DoorsWhat We Learned:
Our Recommendations To Save Energy:
LightingWhat We Learned:
Our Recommendations To Save Energy:
Electrical AppliancesWhat We Learned:
Our Recommendations To Save Energy:
Water HeatingWhat We Learned:
Our Recommendations To Save Energy:
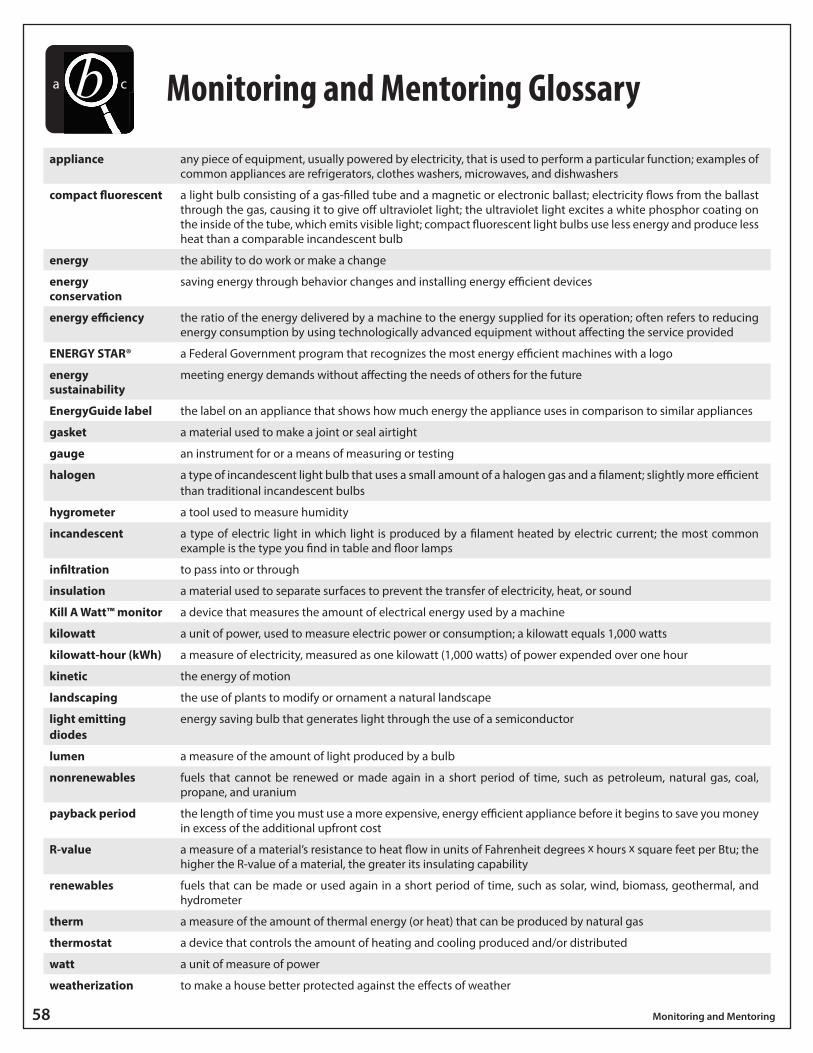
58 Monitoring and Mentoring
Monitoring and Mentoring Glossary
appliance any piece of equipment, usually powered by electricity, that is used to perform a particular function; examples of common appliances are refrigerators, clothes washers, microwaves, and dishwashers
compact fluorescent a light bulb consisting of a gas-filled tube and a magnetic or electronic ballast; electricity flows from the ballast through the gas, causing it to give off ultraviolet light; the ultraviolet light excites a white phosphor coating on the inside of the tube, which emits visible light; compact fluorescent light bulbs use less energy and produce less heat than a comparable incandescent bulb
energy the ability to do work or make a change
energy conservation
saving energy through behavior changes and installing energy efficient devices
energy efficiency the ratio of the energy delivered by a machine to the energy supplied for its operation; often refers to reducing energy consumption by using technologically advanced equipment without affecting the service provided
ENERGY STAR® a Federal Government program that recognizes the most energy efficient machines with a logo
energy sustainability
meeting energy demands without affecting the needs of others for the future
EnergyGuide label the label on an appliance that shows how much energy the appliance uses in comparison to similar appliances
gasket a material used to make a joint or seal airtight
gauge an instrument for or a means of measuring or testing
halogen a type of incandescent light bulb that uses a small amount of a halogen gas and a filament; slightly more efficient than traditional incandescent bulbs
hygrometer a tool used to measure humidity
incandescent a type of electric light in which light is produced by a filament heated by electric current; the most common example is the type you find in table and floor lamps
infiltration to pass into or through
insulation a material used to separate surfaces to prevent the transfer of electricity, heat, or sound
Kill A Watt™ monitor a device that measures the amount of electrical energy used by a machine
kilowatt a unit of power, used to measure electric power or consumption; a kilowatt equals 1,000 watts
kilowatt-hour (kWh) a measure of electricity, measured as one kilowatt (1,000 watts) of power expended over one hour
kinetic the energy of motion
landscaping the use of plants to modify or ornament a natural landscape
light emitting diodes
energy saving bulb that generates light through the use of a semiconductor
lumen a measure of the amount of light produced by a bulb
nonrenewables fuels that cannot be renewed or made again in a short period of time, such as petroleum, natural gas, coal, propane, and uranium
payback period the length of time you must use a more expensive, energy efficient appliance before it begins to save you money in excess of the additional upfront cost
R-value a measure of a material’s resistance to heat flow in units of Fahrenheit degrees x hours x square feet per Btu; the higher the R-value of a material, the greater its insulating capability
renewables fuels that can be made or used again in a short period of time, such as solar, wind, biomass, geothermal, and hydrometer
therm a measure of the amount of thermal energy (or heat) that can be produced by natural gas
thermostat a device that controls the amount of heating and cooling produced and/or distributed
watt a unit of measure of power
weatherization to make a house better protected against the effects of weather
a cb
© 2015 The NEED Project 8408 Kao Circle, Manassas, VA 20110 1.800.875.5029 www.NEED.org 59
SOCIAL MEDIAStay up-to-date with NEED. “Like” us on Facebook! Search for The NEED Project, and check out all we’ve got going on!
Follow us on Twitter. We share the latest energy news from around the country, @NEED_Project.
Follow us on Instagram and check out the photos taken at NEED events, instagram.com/theneedproject.
Follow us on Pinterest and pin ideas, Pinterest.com/NeedProject.
NEED’S SMUGMUG GALLERYhttp://need-media.smugmug.com/
On NEED’s SmugMug page, you’ll � nd pictures of NEED students learning and teaching about energy. Would you like to submit images or videos to NEED’s gallery? E-mail [email protected] for more information. Also use SmugMug to � nd these visual resources:
VideosNeed a refresher on how to use Science of Energy? Watch the Science of Energy videos. Also check out our Energy Chants videos! Find videos produced by NEED students teaching their peers and community members about energy.
Online Graphics LibraryWould you like to use NEED’s graphics in your own presentations? Download graphics for easy use in your classroom.
E-Publications The NEED Project o� ers e-publication versions of various guides for in-classroom use. Guides that are currently available as an e-publication will have a link next to the relevant guide title on NEED’s curriculum resources page, www.NEED.org/curriculum.
NEED’s Online Resources
Supplemental MaterialsLooking for more resources? Our supplemental materials page contains PowerPoints, animations, and other great resources! This page is available under the Educators tab at www.NEED.org.
The BlogWe feature new curriculum, teacher news, upcoming programs, and exciting resources regularly. To read the latest from the NEED network, visit www.NEED.org/blog_home.asp.
NEED Energy BooklistLooking for cross-curricular connections, or extra background reading? NEED’s booklist provides an extensive list of � ction and non� ction titles for all grade levels to sup-port energy units in the science, social studies, or language arts setting. Check it out atwww.NEED.org/booklist.asp.
U.S. Energy GeographyGo to www.NEED.org/maps to see energy production, consumption, and reserves all over the country!

National Sponsors and PartnersAmerican Electric PowerArizona Public ServiceArizona Science CenterArmstrong Energy CorporationAssociation of Desk & Derrick ClubsAudubon Society of Western PennsylvaniaBarnstable County, MassachusettsRobert L. Bayless, Producer, LLCBP America Inc.Blue Grass EnergyBoulder Valley School DistrictBrady TraneCalifornia State UniversityCape Light Compact–MassachusettsChevronChugach Electric Association, Inc. Colegio RochesterColumbia Gas of MassachusettsComEdConEdison SolutionsConocoPhillipsConstellationCuesta CollegeDaniel Math and Science CenterDavid Petroleum CorporationDesk and Derrick of Roswell, NMDominionDonorsChooseDuke EnergyEast Kentucky PowerEastern Kentucky UniversityElba Liquifaction CompanyEl Paso CorporationE.M.G. Oil PropertiesEncanaEncana Cares FoundationEnergy Education for MichiganEnergy Training SolutionsEversourceExelon FoundationFirst Roswell CompanyFJ Management. Inc. Foundation for Environmental EducationFPLThe Franklin InstituteFrontier AssociatesGovernment of Thailand–Energy MinistryGreen Power EMCGuilford County Schools – North CarolinaGulf PowerGerald Harrington, GeologistGranite Education FoundationHarvard PetroleumHawaii Energy
Houston Museum of Natural ScienceIdaho PowerIdaho National LaboratoryIllinois Clean Energy Community FoundationIndependent Petroleum Association of AmericaIndependent Petroleum Association of New MexicoIndiana Michigan Power – An AEP CompanyInterstate Renewable Energy CouncilJames Madison UniversityKentucky Clean Fuels CoalitionKentucky Department of EducationKentucky Department of Energy Development and IndependenceKentucky Power – An AEP CompanyKentucky River Properties LLCKentucky Utilities CompanyKinder MorganLeidosLinn County Rural Electric CooperativeLlano Land and ExplorationLouisiana State University Cooperative ExtensionLouisville Gas and Electric CompanyMaine Energy Education ProjectMassachusetts Division of Energy ResourcesMichigan Oil and Gas Producers Education FoundationMiller EnergyMississippi Development Authority–Energy DivisionMojave Environmental Education ConsortiumMojave Uni�ed School DistrictMontana Energy Education CouncilNASANational Association of State Energy O�cialsNational FuelNational GridNational Hydropower AssociationNational Ocean Industries AssociationNational Renewable Energy LaboratoryNebraska Public Power DistrictNew Mexico Oil CorporationNew Mexico Landman’s AssociationNicor Gas – An AGL Resources CompanyNorthern Rivers Family ServicesNorth Shore GasNRG Energy, Inc.O�shore Energy CenterO�shore Technology ConferenceOhio Energy ProjectOpterra EnergyOxnard School DistrictPaci�c Gas and Electric Company
Paxton ResourcesPECOPecos Valley Energy CommitteePeoples GasPetroleum Equipment and Services Associa-tionPhillips 66PNMProvidence Public SchoolsRead & Stevens, Inc. Renewable Energy Alaska ProjectRhode Island O�ce of Energy ResourcesRiver Parishes Community CollegeRiverQuestRobert ArmstrongRoswell Geological SocietySalt River ProjectSandia National LaboratorySaudi AramcoScience Museum of VirginiaC.T. Seaver TrustShellShell ChemicalsSociety of Petroleum EngineersSociety of Petroleum Engineers – Middle East, North Africa and South AsiaDavid SorensonSouthern CompanySpace Sciences Laboratory of the University of California BerkeleyTennessee Department of Economic and Community Development–Energy DivisionTioga EnergyToyotaTri-State Generation and TransmissionTXU EnergyUnited States Energy AssociationUniversity of GeorgiaUnited Way of Greater Philadelphia and Southern New JerseyUniversity of Nevada–Las Vegas, NVUniversity of North CarolinaUniversity of TennesseeUniversity of Texas - AustinUniversity of Texas - TylerU.S. Department of EnergyU.S. Department of Energy–O�ce of Energy E�ciency and Renewable EnergyU.S. Department of Energy–Wind for SchoolsU.S. Department of the Interior–Bureau of Land ManagementU.S. Energy Information AdministrationWest Bay ExplorationWest Virginia State UniversityYates Petroleum Corporation
©2015 The NEED Project 8408 Kao Circle, Manassas, VA 20110 1.800.875.5029 www.NEED.org