monitoring & evaluating success
TRANSCRIPT

Prepared for Sustainable Cities
by
Sabrina Dekker Jessie Singer
Dec, 2011
Integrated Community Sustainability Plans:
Monitoring & Evaluating Success

1
Table of Contents
Sustainable Cities 3
Introduction 4
Problem Statement 5
Methods 6
Integrated Community Sustainability Plans – The Canadian Experience 7
Indicator Programs ‐ Measuring Progress towards Sustainability 8
Monitoring & Evaluation Tools for Sustainability Plans 10
Evaluating ICSPs: City Case Studies 20
Toolkit for Cities 24
Conclusion 29
References 30
Appendixes 33

2
Sustainable Cities Sustainable Cities International is a registered not for profit organization based in Vancouver, Canada. Launched in 1993, the mission of Sustainable Cities is to catalyze action on urban sustainability in cities around the world. Sustainable Cities works by connecting and mobilizing people around innovation for urban sustainability, linking technical and social innovations, to build capacity in cities for the shift towards a more sustainable future. Sustainable Cities facilitates a thriving, international network of cities that acts as an urban laboratory: adopting, testing and improving on innovations. Ideas are accelerated through sharing of experience between cities that are making transformational change a reality. In order to accelerate knowledge creation and transfer, Sustainable Cities believes that the ideas, information and concepts generated should be open source and shared, in written form, through our website, social networks or personal contacts. The work undertaken here supports this goal.

3
Introduction This paper examines the progress that Canadian municipalities have made in developing monitoring and evaluation tools to track the success of their sustainability plans. The research being undertaken is to draw lessons from current initiatives to advance urban sustainability in the Canadian context. The lessons can then be shared amongst cities in the Sustainable Cities Network. Focusing on the progress of Canadian municipalities in the implementation of sustainability plans will present areas where there are gaps and serve as the basis for guiding future research on sustainability practices globally. The primary objective is to provide practicing planners and municipalities in the network with practical examples and case studies of current work being done in Canadian cities to monitor and evaluate the implementation of their sustainability plans. The intent is to inform planning work and advance cities’ progress towards their sustainability targets and goals as well as suggest how Canadian municipalities can benefit from learning from other cities locally and globally. This paper includes a toolkit that aims to serve as guidance for cities that want to start tracking their sustainability indicators. Secondary objectives include:
1. Facilitating knowledge exchange and dialogue on sustainability between municipalities locally and globally
2. Promoting creative solutions and innovative projects used by cities to reduce their ecological impact and advance healthy, liveable communities
3. Assist planners to move from plan‐writing to implementation and measuring sustainability targets
4
Problem Statement Canadian municipalities over the past decade have been taking steps to integrate sustainability principles into all planning activities in recognition of the realities of climate change, resource constraints, social challenges, and economic uncertainty. Local governments must look towards implementing policies and actions, which will increase the resiliency of cities. Currently, the majority of Canadian municipalities have some form of environmental and/or sustainability plan or strategy completed in various stages of implementation. How to monitor and evaluate progress towards sustainability goals and targets remains a challenge for many planners and local governments. Measuring sustainability is a complex issue and is often place‐specific, as each city operates within a distinct ecosystem and social cultural context. City officials must reconcile how to monitor quantitative indicators of sustainability such as air and water quality, with qualitative measures of human well being and civic engagement. The challenges faced are:
• Identifying relevant data to measure success under the various indicators. • Bridging the gap between academic understandings of sustainability indicators and ecosystem
functions and municipal planning organizational structures, which have traditionally concerned themselves with land use, infrastructure and transportation, social planning, and recreation and culture programming.
• Limited staff, time and resources, particularly smaller communities. • Availability of data from organizations like StatsCan.
The toolkit will help mitigate these challenges and others by establishing a feasible means for municipalities to invest in monitoring and evaluation tools, and by streamlining the process.

5
Methods In order to address these challenges, this paper will begin by outlining the Canadian experience with Integrated Community Sustainability Plans (ICSPs); the successes and challenges faced. Providing an overview of current frameworks being used for sustainability planning and sustainability measures will set the context for developing the toolkit. This is followed by case studies of specific Canadian cities and their experience with monitoring and evaluating their sustainability plans. The paper concludes with an analysis of approaches that have succeeded and how they apply in the Canadian municipal context. Development of the Toolkit is primarily based on literature review and analysis of current methodologies. Selection of methods and indicators to be included in the toolkit were based on the objectives of the ICSPs identified by the Federal Government. Additions to the supplemental toolkit were guided by discussions with practitioners in the planning and policy fields related to sustainable development. Data was collected mainly through a thorough review of available official plans and supporting municipal documents. Academic literature was consulted to situate the sustainability planning approaches used within the wider context of current thinking around implementing sustainability in urban centres. Informal discussions with practicing planners in the various municipalities, NGOs working on sustainability issues and academics provided further insights and research directions.

6
ICSPs – The Canadian Experience In 2005, the Federal Government introduced Integrated Community Sustainability Plans (ICSPs) under the New Deal for Cities and Communities, to facilitate dialogue on the future of cities in Canada. ICSPs are:
“Long‐term plan(s), developed in consultation with community that provides direction for the community to realize sustainability objectives it has for the environmental, cultural, social and economic dimensions of its identity.” ‐ Planning for Sustainable Canadian Communities Roundtable, 2005
Active consultation is a critical piece in the process of an ICSP, particularly in the development of a long‐term community vision looking 40 to 50 years into the future. Further in contrast to traditional planning, ICSPs demand that new dimensions be considered in the planning process while continuing to meet citizens’ needs. Rooted in the concept of sustainability ICSPs make environmental sustainability, economic sustainability, social sustainability and cultural sustainability the cornerstones of city plans, such that:
“Cities and communities are sustainable places of exceptional beauty, neighbourliness, prosperity rich in ideas, confidence, diversity, creativity and innovation, where all people are included economically, socially and politically.” – Prime Minister’s External Advisory Committee on Cities and Communities
In short environmental sustainability is targeted at reducing dependence on, consumption of, and participation in activities that require fossil fuels, extraction of metals and minerals, and chemicals that are harmful to the environment. Social sustainability is based on the recognition that social justice supports environmental sustainability. As such, poverty, crime, inequality, and poor health are hindrances to cities and citizens succeeding in their sustainability goals. The inclusion of cultural sustainability is a reflection of Canadian society, in particular its diversity. Culture also addresses the arts and the creative class that are linked to other aspects of sustainability such as economic development. Economic sustainability is focused on community economic development and takes into consideration the other dimensions of sustainability. While municipalities are left to develop their plans they are not without support from the Government. To support communities developing their ICSPs the Federal Government of Canada promised $5 billion in funding over 5 years and the Gas Tax Agreement. Collectively the federal government, the provinces/territories and municipalities are negotiating agreements that will allow municipalities to use a portion their gas tax allocation to develop ICSPs over a set time frame. Finally to provide additional support the Government has a set of guiding principles and elements of a recommended ICSP to assist planners as they move through the stages of developing ICSPs.

7
Measuring Progress towards Sustainability Cities and organizations are focusing on the development of indicators to measure progress. An indicator provides information on the state or condition of something. In terms of sustainability indicators, Astleithner et al (2004) narrow this definition to a policy‐relevant variable defined in such a way as to be measurable over time and space. Sustainability indicators can be quantitative or qualitative measures; however what differentiates them from familiar ecological or economic indicators is their focus on linkages across different sectors. Ecological and economic indicators are still part of sustainability indicators by means of integration Indicators are important in holding governments and communities accountable to their sustainability targets and goals (Newman & Jennings 2008). Indicators provide data to guide policy‐making and allow for comparisons to be made across municipalities and regions. The impacts and challenges of sustainability policies and plans on the urban environment can also be shown through indicators (Nolberto 2005). Indicators are most useful in sustainability planning when linked to sustainability thresholds or targets. Thresholds are scientifically determined points where the state of things will change dramatically. Targets are often determined by policy makers or through public consultation and point to levels that must be met in the future if sustainability goals are to be reached. There are a number of issues associated with the selection, use and reporting of sustainability indicators. The main debates over these issues are reviewed below.
Approaches to developing sustainability indicators The approach to selecting indicators generally falls into two general categories, top‐down or bottom‐up. The top‐down approach means policy makers define the goals and accompanying indicators, the data collected is usually highly technical and requires experts to interpret. The bottom‐up approach is community‐based and involves extensive consultation with stakeholders to select appropriate indicators. The key difference in the two approaches is complexity. Top down processes involve more tools that allow for greater depth of analysis, while bottom up processes are more basic and broad. (It is possible to combine the approaches to create a hybrid approach; however this depends on the context.) These two approaches reflect the need to develop indicators that are based on accurate scientific data as well as indicators that are easy to understand for the public and decision‐makers. A solution to this problem that has been put forward is to select a set of “core” indicators, which span the breadth of a community’s sustainability goals. These core indicators should be easily understood and demonstrate the linkages between multiple sustainability goals. Alongside the core indicators, which will be widely publicized, there would remain a longer list of more technical and specific indicators for use by city staff.
Indicators: selected statistics or parameters related to key objectives that, when monitored over time, represents trends.
Index: subjective combinations of indicators used to describe overall performance in a particular area.
Targets: a measurable goal set to be achieved within a specified time period.
8
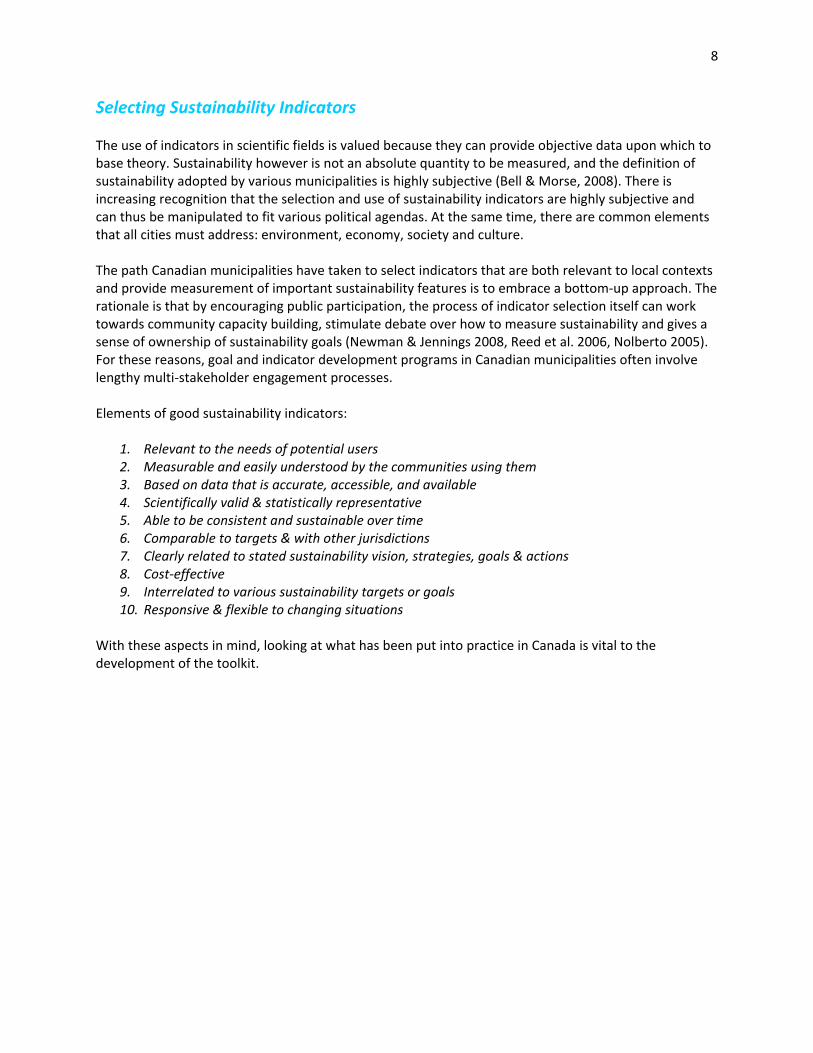
Selecting Sustainability Indicators The use of indicators in scientific fields is valued because they can provide objective data upon which to base theory. Sustainability however is not an absolute quantity to be measured, and the definition of sustainability adopted by various municipalities is highly subjective (Bell & Morse, 2008). There is increasing recognition that the selection and use of sustainability indicators are highly subjective and can thus be manipulated to fit various political agendas. At the same time, there are common elements that all cities must address: environment, economy, society and culture. The path Canadian municipalities have taken to select indicators that are both relevant to local contexts and provide measurement of important sustainability features is to embrace a bottom‐up approach. The rationale is that by encouraging public participation, the process of indicator selection itself can work towards community capacity building, stimulate debate over how to measure sustainability and gives a sense of ownership of sustainability goals (Newman & Jennings 2008, Reed et al. 2006, Nolberto 2005). For these reasons, goal and indicator development programs in Canadian municipalities often involve lengthy multi‐stakeholder engagement processes. Elements of good sustainability indicators:
1. Relevant to the needs of potential users 2. Measurable and easily understood by the communities using them 3. Based on data that is accurate, accessible, and available 4. Scientifically valid & statistically representative 5. Able to be consistent and sustainable over time 6. Comparable to targets & with other jurisdictions 7. Clearly related to stated sustainability vision, strategies, goals & actions 8. Cost‐effective 9. Interrelated to various sustainability targets or goals 10. Responsive & flexible to changing situations
With these aspects in mind, looking at what has been put into practice in Canada is vital to the development of the toolkit.

9
Monitoring & Evaluation Tools for Sustainability Plans Assessing a city’s progress towards a sustainable future is essential for an ICSP. Selection of monitoring and evaluation tools is a challenge for assessment. A one size fits all toolkit would be ideal, for comparative purposes and absolute goals; however cities, communities, and regions are subject to diverse geographies, demographics and economic conditions that impact sustainability. Creating a toolkit that can acknowledge the breadth and depth of sustainability plans will be a challenge. Following the assumption that cities share a core of basic needs a general or core toolkit has been created, and differences can be considered via a tailored toolkit that can be constructed from a bank of indicators. What is essential to both is a baseline assessment of a city’s current state in terms of the sustainability indicators to be measured. Without baseline data, which most municipalities have gathered in the process towards developing their ICSPs, monitoring and evaluation is impossible. The data will guide the selection of indicators used to monitor progress from the indicator bank. Development of the toolkits has given consideration to adaptability and transferability for use in various contexts. Both toolkits consist of quantitative and qualitative measurement tools. The core toolkit is rooted in the basic principles of ICSPs: Economy, Environment, Society and Culture. The tailored toolkit (and core) gleans ideas and examples from work that has been done in municipalities across Canada and by organizations globally. This section provides a summary of indexes and methodologies that are available to municipalities. The first section presents the methods that are currently being used by Canadian Municipalities. The second section presents methods that are being developed in the US and Internationally.
Methodologies used in Canada Currently in Canada three methodologies dominate the monitoring and evaluation domain: Triple Bottom Line, Smart Growth and The Natural Step. The methodologies provide a springboard for municipalities to develop indicators to monitor their progress. Consequently the methodologies are broad in their scope and serve as guide. Triple Bottom Line The Triple Bottom Line is an accounting methodology being used in the public, private and non‐profit sectors to measure financial outcomes. The context is that organizations can move away from a single bottom line where only the financial outcomes are considered to 3 bottom lines where the environmental and social aspects of a venture can be accounted for. The advantage of this approach is that it can be widely applied to all municipal decisions. The challenge with this methodology is the equal weight applied to each outcome. Place context is not given consideration, leaving a void in understanding the long‐term impacts of policies on the environment and economy. Resources Triple Bottom Line Approach http://www.triplebottomlineapproach.com/

10
Smart Growth Smart growth is a collection of land use and development principles meant to help communities to develop in way, which are in line with environmental conservation, social equity and fiscal responsibility. It is a response to the rapid urban sprawl seen in North America, which saw large suburbs removed from proximate services that necessitate the use of single occupancy vehicles. The Smart Growth movement is an attempt to move away from this type of development by prioritizing urban growth boundaries, increased green space and infill projects. The goal of Smart Growth is to create compact, higher‐density communities, which encourage alternative modes of transportation and preserves valuable natural spaces such as wetlands and agricultural land. Smart Growth BC, a joint project of the University of Victoria and the West Coast Environmental Law Association, was a leading advocate for the adoption of Smart Growth principles by communities. The non‐profit society provides a number of online guides and toolkits for communities to better understand Smart Growth principals and how to implement them. In May 2010, the Canadian Green Building Council (CaGBC), an organization which promotes green building in Canada, acquired Smart Growth BC’s programs and brand to continue the provincial program. This was the beginning of a national approach to supporting a Smart Growth Canada Program that combines the provincial success of Smart Growth BC and the national network of CaGBC. The online toolkits provided by Smart Growth BC provide information on the benefits of the approach and how to get citizens involved in the process in order to have broad based buy in to Smart Growth Principles. Indicator programmes are promoted as a means of measuring progress towards implementing Smart Growth principles alongside organizational restructuring which can assist in ensuring continuity of monitoring programmes; for example the formation of a watchdog committee. The Online Smart Growth Toolkit contains 4 sections which includes an overview of why municipalities should use this approach, how to measure progress towards it in your community and further readings/links for reference purposes. Section II, “Smart Growth Tools, Turning Principles into Practice”; identifies specific tools planners can use to limit sprawl and promote green space and ecosystem planning. Example tools include OCPs, urban growth boundaries and development standards. Section III of the online toolkit, “Citizens Involvement Tools”, provides a checklist which links Smart Growth Principles and Goals with the appropriate planning tools. For example the principle of integrating urban development into ecosystems is accompanied by the tools of watershed planning, integrated greenways planning and comprehensive development zones. Resources: Smart Growth BC http://smartgrowth.bc.ca/ Ontario Smart Growth Network (OSGN) http://www.smartgrowth.on.ca/index.htm Canada Green Building Council (CaGBC) http://www.cagbc.org/ The Natural Step Framework The Natural Step (TNS) is an international organization that specializes in sustainability solutions from the household to the community level with the goal of creating a better world for all. In the Canadian context TNS is working with communities to help them achieve their ICSPs with the development of ICSP guide.

11
TNS constructed the guide using a planning approach called ‘backcasting from sustainability principles’ which involves beginning with the end goal. It is also called The Natural Step Framework. Starting with the description of success the process calls for the linking of the future with the present context. Participants are asked to think strategically about “what shall we do today to get there?” Building on the Planning for Sustainability Guide, the TNS framework centres on five core concepts:
• The Sustainability Challenge: Curbing the demand for resources, is the next challenge. All communities are impacted by the changes to air, water and ecosystems. The best option is to reduce the pressure.
• Backcasting: Driven by the end result, backcasting is the process of deciding what the desired outcome is for the future, then determining how to achieve it.
• The Sustainability Principles: The TNS Framework is based on defining the system conditions for a sustainable society, determined from scientific research. The result is four sustainability principles that provide the parameters for society to operate sustainability.
• Backcasting from Sustainability Principles: The sustainability principles have been translated into long‐term goals: Reduce and eliminate contribution to the accumulation of materials from the earth’s crust, the accumulation of substances produced by society, the ongoing physical degradation of nature, and conditions that undermine people’s ability to meet their basic needs.
• The ABCD Planning Process: The ABCD planning process is the backcasting from sustainability principles in action. There are four steps: Awareness, Baseline Analysis, Compelling Vision, and Down to Action. A feedback loop allows for revisiting of steps as new considerations for sustainability arise.
TNS recognized that sustainability planning is an iterative process. There is more than one‐way to develop an ICSP. TNS has derived key lessons captured in the adjacent text box, from work on ICSPs in Canada In light of these lessons TNS provides an overview of Integrated Community Sustainability Planning consisting of 6 phases, the final being Continuing the Journey and Monitoring Progress. The desired outcomes of this phase are:
• A governance and partnerships approach established to guide the implementation of the ICSP in the community
• Initiatives are implemented in the community • Progress on the implementation of the ICSP is monitored and evaluated
TNS being rooted in systems theory follows an evaluation strategy that uses a feedback loop, it calls for ICSPs to be reviewed periodically to assess what is working and develop new ideas for success. Indicators for measuring the success of plans are not suggested directly by TNS, rather it is the prerogative of communities to develop their indicators and take ownership of them. Ownership on all
TNS Key Lessons:
1. It’s a Journey, not a document
2. Invest in education and capacity building
3. Build shared intention
4. Know your sustainability gap
5. Collaborate
6. Feed the momentum with strategic actions
7. Evaluate progress

12
levels is the key to the success in the TNS approach. Buy in from all stakeholders is required. TNS ultimately calls for a shift in lifestyle. Resources The Natural Step Toolkits for Sustainability http://www.naturalstep.org/en/canada/toolkits
International Initiatives As sustainability is a global concern organizations outside of Canada have been working towards developing methodologies to track progress. From the US there are the STAR Community Index, and The Boston Indicators Project. The OECD is currently working on its indicators through the Cities and Green Growth Project. STAR Community Index The STAR Community Index was developed as a national framework for sustainability. It is in the process of being developed by ICLEI‐Local Governments for Sustainability (managing partner), the U.S. Green Building Council, and the Center for American Progress.
“Much as LEED™ transformed the building industry, STAR will transform the way local governments set priorities and implement policies and practices to improve their sustainability performance. It will become the definitive means by which local governments measure and “certify” their achievements” – (ICLEI, 2010)
Methodology STAR is a rating system like LEED that awards points for achieving targets. The rating system will be:
• Applicable to diverse localities • Designed to evolve so that new indicators and metrics can be included • Have multiple metrics: Policy, Performance, Practice • Rating achievements similar to LEED
Proposed Metrics and Indicators
METRIC INDICATORS Environment Natural Systems Ecosystems, habitat, water, air quality, waste, resource conservation Planning & Design Land use; transportation and mobility; parks, open space and
recreation
STAR guiding principles:
1. Think –and act – systematically
2. In‐still resiliency
3. Foster innovation
4. Redefine progress
5. Live within means
6. Cultivate collaboration
7. Ensure equity
8. Embrace diversity
9. Inspire leadership
10. Continuously improve

13
Energy & Climate Energy, emissions, renewable energy, and green building
Economy Economic Development Clean technologies and green jobs, local commerce, tourism, and local
food system Employment & Workforce Training
Green job training, employment and workforce wages, and youth skills
Society Education, Arts & Community Education excellence, arts and culture, and civic engagement and
vitality Children, Health & Safety Community health and wellness, access to health care, and public
safety Affordability & Social Equity Affordable and workforce housing, poverty, human services and race
and social equity Essentially the proposed metrics and indicators comprise a menu of options. Cities can select ones that are applicable to their context. Additionally they serve as the base for the 10 guiding principles and 81 goals that currently comprise the STAR Index. The purpose of these guidelines is to direct technical advisory committees as they develop indicators to track the success of the 81 goals. The 81 goals are divided amongst the proposed metrics and indicators. Accompanying the goals are purpose statements, which express the desired outcomes and aspirations of each goal in a community. The STAR index is comprehensive and broad in scope. It has the potential to provide municipalities with a wealth of choice with regards to their selection of indicators. The challenge comes in the selection of indicators. Balancing the genuine needs of a community over the desire to achieve a higher rating must be reckoned. Resources Local Governments for Sustainability (ICLEI) http://www.icleiusa.org/star Public‐Private Partnerships for Indicator Initiatives Public‐private partnerships to develop city‐based indicator programs are gaining popularity as the need for selecting place‐specific sustainability indicators is recognized. These types of partnerships are useful as they often involve multiple stakeholders outside of city council who contribute their own experience to the process. Partnerships between the city, NGOs, environmental groups, post secondary institutions and citizens have the potential to transform how communities perceive of and implement sustainability goals. The process of developing indicators can encourage discussion of the concept of sustainability and influence behaviour change while fostering community ownership of the project. Initiatives such as Sustainable Seattle and Sustainable Calgary are indicator projects which were begun by concerned citizens interested in the future of their cities and have continued as deliberate voluntary organizations which attempt to reach out to all citizens with an interest in sustainability issues. The Victoria’s Vital Signs was initiated by the Victoria Foundation, a registered Canadian charity, and produces an annual report, which evaluates the city based on various economic, environmental, social and cultural indicators.

14
Below is a more in‐depth look at one specific city‐based indicator project, The Boston Indicators, which is a good example of how a city can benefit from partnerships with post secondary institutions and the engagement of a wide swath of citizens and non‐profits. Boston Indicators The Boston Indicators Project began as a means to understand the City of the Boston in various contexts: regional, national and global. Setting out to facilitate civic engagement, track progress and reform the city in 10 key sectors, the project is an example of monitoring success comprehensively in a relevant manner. Civic Vitality, Cultural Life and Arts, the Economy, Education, the Environment, Health, Housing, Public Safety, Technology and Transportation were the ten sectors chosen to be the focus of the project. Engagement of school children, residents, academics, policy makers and community‐based experts to shape a Civic Agenda was the main goal of the project. Genuinely understanding what is at the core of the challenges that Boston faces are vital to this project. Having data that supports the report is important to the project and its direction. The Boston Indicators Project in partnership with Metropolitan Area Planning Council (MAPC) offers an online data website (www.MetroBostonDataCommon.org) that enables comprehensive data mapping. Further adding to the rich information sources the Project has become a part of the University of Massachusetts‐Lowell’s Open Indicators Consortium, which is focused on developing an open source of indicators and data for use across the region and nation. The project is rooted in using quantifiable data to track changes and progress. Each of the ten sectors has several indicators that have been quantified and compared to a base year. The objective of the ten sectors is to present a comprehensive picture of Boston in terms of long‐term and recent trends that are impacting the quality of life in Boston. Each sectors uses data obtained at the regional level to present the current state of the sector. Sectors and their indicators are as follows:
INDICATOR MEASUREMENT/ TRACKING METHOD Civic Vitality
Electoral Participation Voter registration, voter turnout Access to Information Library circulation, local news outlets Neighbourly Trust and Volunteerism Cultural Life and the Arts
Equitable Access to Cultural Resources Access for children and families, access to free and low cost events, Access to arts education
Cultural Vibrancy and the Creative Economy
Attendance at museums and cultural attractions, tourism, funding for the Mass Cultural Council, Artist Housing, and cultural organizations and funding
Economy
Employment and unemployment Cost of living Median Household Income

15
Poverty: Families with Children Taxes Business and corporate taxes, personal taxes, contributions by
tax type and income quintile, by educational attainment Small Business Minority‐ and women‐owned businesses, neighbourhoods,
community investments Education
Educational Attainment High Quality Early Education and Care Third Grade Reading Proficiency Test scores Tenth Grade MCAS Proficiency Test scores for math, English, language arts, and science High School Completion Graduation rates, dropout rates College Enrolment and Completion Environment and Energy
Urban Environment Urban tree cover and recycling Environmental Health Air quality, water quality, and elevated lead levels Sustainability GHG emissions, green building code and green buildings Energy Renewable energy Health
Costs and Coverage Health care costs and health insurance coverage Child Health Birth weight, immunization, and food insecurity Health Behaviours Teen behaviours and physical activity Racial/Ethnic Disparities Chronic disease and mortality Housing
Foreclosures and Sub‐prime Lending Race, ethnicity, and Boston neighbourhood Housing Costs Median home price, median asking rent Housing Production and Stability Public and subsidized housing, student housing and
homelessness Public Safety
Property Crime Robberies, burglaries, larceny, and vehicle theft Violent Crime Total violent crimes (homicides, rape, aggravated assault) Youth Safety Risky behaviour and youth homicide Perceptions Systems Funding for public safety, incarceration Technology
Bridging the Digital Divide Boston Public Library, the Timothy Smith Network, computer access in Boston public schools
The Innovation Economy STEM (Science, Technology, Engineering, Math) Education
BPS 5th and 8th Grade Science, BSP 10th Grade Science, and intended college major
Transportation
Greater Boston’s Transportation Roads and bridges, Massachusetts Bay Transportation

16
System Authority Ridership, Bikes Modes and Cost Burden Transportation to work, the impact of transportation costs on
households Sustainability Vehicle miles traveled Funding and Stability Resources Sustainable Calgary http://www.sustainablecalgary.ca/Page‐3.html Victoria’s Vital Signs http://www.victoriafoundation.bc.ca/web/vitalsigns2010 Sustainable Seattle http://sustainableseattle.org/ The Boston Indicators Project http://www.bostonindicators.org/Indicators2008/ OECD – Cities and Green Growth The OECD is in the process of developing indicators for measuring the success of green growth in several cities. The project was born out the demand for monitoring and evaluating strategies by cities that will enable them to mitigate the impacts of climate change. Recently the OECD released Toward Green Growth ‐ Monitoring Progress OECD Indicators. The report outlines four key groups for indicators with complementing generic indicators: 1. Indicators monitoring the environmental and resource productivity of production and consumption
• Carbon and energy productivity • Resource productivity: materials,
nutrients, water • Multi‐factor productivity
2. Indicators describing the natural asset base • Renewable stocks: water, forests, fish,
resources • Non‐renewable stocks: mineral resources • Biodiversity and ecosystems
3. Indicators monitoring the environmental dimension of quality of life
• Environmental health and risks • Environmental services and amenities
4. Indicators describing policy response and economic opportunities
• Technology and innovation • Environmental goods and services • International financial flows • Prices and transfers • Skills and training • Regulation and management approaches
There is a ‘fifth category’ the socio‐economic context and characteristics of growth with its generic indicators: economic growth and structure, productivity and trade, labour markets, education and income, and socio‐demographic patterns. The OECD has in its report emphasized the importance of “policies that promote green growth need to be founded on a good understanding of the determinants of green growth and of related trade‐offs or synergies”. Internationally comparable data is a vital piece in the development of indicators. Clarity is invaluable in this situation, especially in relation to the four areas identified as the main features of green growth.
17
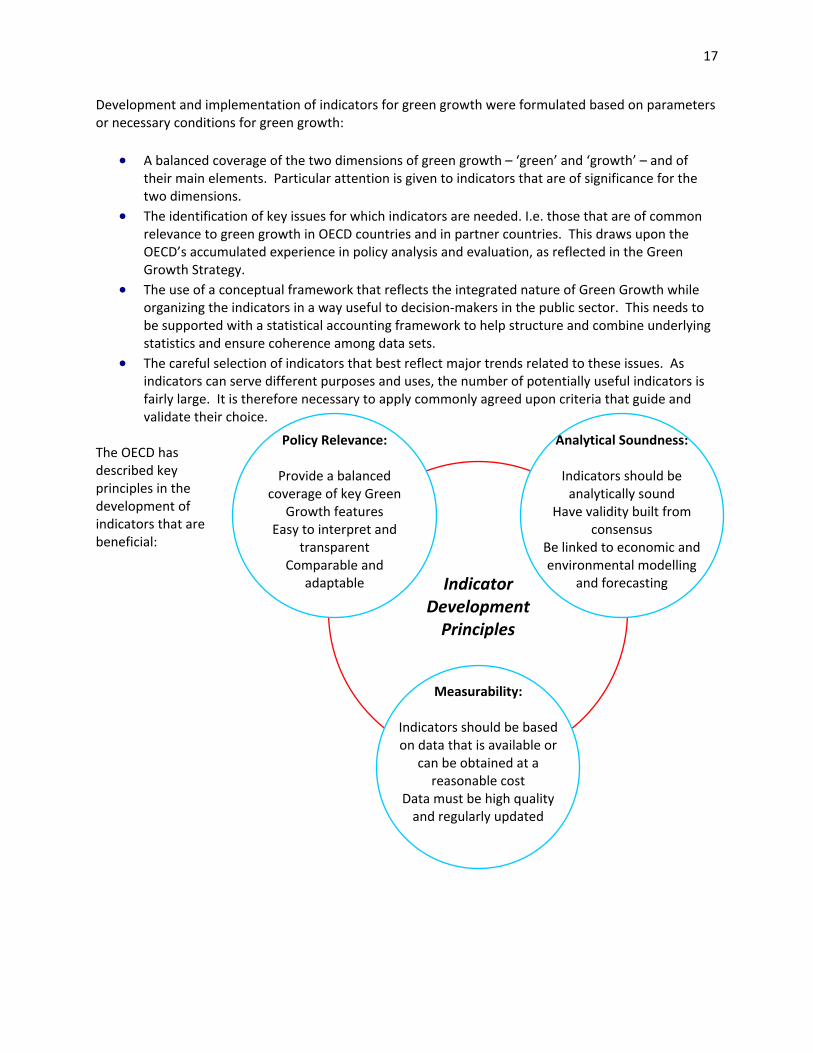
Indicator
Development Principles
Measurability:
Indicators should be based on data that is available or
can be obtained at a reasonable cost
Data must be high quality and regularly updated
Analytical Soundness:
Indicators should be analytically sound
Have validity built from consensus
Be linked to economic and environmental modelling
and forecasting
Policy Relevance:
Provide a balanced coverage of key Green
Growth features Easy to interpret and
transparent Comparable and
adaptable
Development and implementation of indicators for green growth were formulated based on parameters or necessary conditions for green growth:
• A balanced coverage of the two dimensions of green growth – ‘green’ and ‘growth’ – and of their main elements. Particular attention is given to indicators that are of significance for the two dimensions.
• The identification of key issues for which indicators are needed. I.e. those that are of common relevance to green growth in OECD countries and in partner countries. This draws upon the OECD’s accumulated experience in policy analysis and evaluation, as reflected in the Green Growth Strategy.
• The use of a conceptual framework that reflects the integrated nature of Green Growth while organizing the indicators in a way useful to decision‐makers in the public sector. This needs to be supported with a statistical accounting framework to help structure and combine underlying statistics and ensure coherence among data sets.
• The careful selection of indicators that best reflect major trends related to these issues. As indicators can serve different purposes and uses, the number of potentially useful indicators is fairly large. It is therefore necessary to apply commonly agreed upon criteria that guide and validate their choice.
The OECD has described key principles in the development of indicators that are beneficial:

18
Environment Canada’s Indicators This section concludes with a final example from the Government of Canada. The Canadian Environmental Sustainability Indicators (CESI) are a concrete example of quantitative analysis of indicators. Intended to meet the objectives of the Federal Sustainable Development Strategy and directed at the National, Provincial and Territorial levels, CESI provides valuable measurements that are applicable at the municipal and regional levels. Monitoring of the various indicators focuses on various levels of measurement: national, regional and local. These measurements are further compared to international performance to give context to Canadian achievements in sustainable development. The list of indicators is comprehensive in regards to the specific areas that are targeted currently the indicators are categorized into air and climate, water and nature. What is notable is that some of the indicators are easily measured, such as greenhouse gas emissions, where data can be collected on various levels. In other cases that are not straight forward, the methodology for measuring the indicator is provided by CESI. Reports providing a description of the indicator, how it was derived, sources of information, and caveats and limitations are provided to enable users of CESI to understand the indicator fully in a variety of contexts. CESI is comprehensive and rooted in scientific methods, and thus uses equipment and resources that are not available to municipalities. Municipalities faced with limited financial resources can nevertheless use CESI as a guide to select feasible measurement tools. Resources Environment Canada – CESI http://www.ec.gc.ca/indicateurs‐indicators/

Evaluating ICSPs: City Case Studies Canadian cities are in various stages of the ICSP process; some are still drafting their plans while others are beginning implementation and moving towards monitoring and evaluating their plans. The case studies presented in the following table are intended to demonstrate how Canadian cities are monitoring their progress towards sustainability. It is recognized that there is not a one‐size fits all approach to sustainability planning. Therefore the case studies are meant to present a broad range of indicators and ideas that can be shared amongst cities as they strive for sustainability success. What will also be evident is that there are key elements (society, environment and economy) and goals (growth, safety, waste reduction) to sustainability planning that are common to cities. The case studies are therefore examples. Below is an overview of the cities examined in this paper, their ICSP initiatives and accompanying monitoring and reporting formats. This is merely a brief sampling of the work that is being done across Canada. Selection of the cities was based on available information at the time that research began.
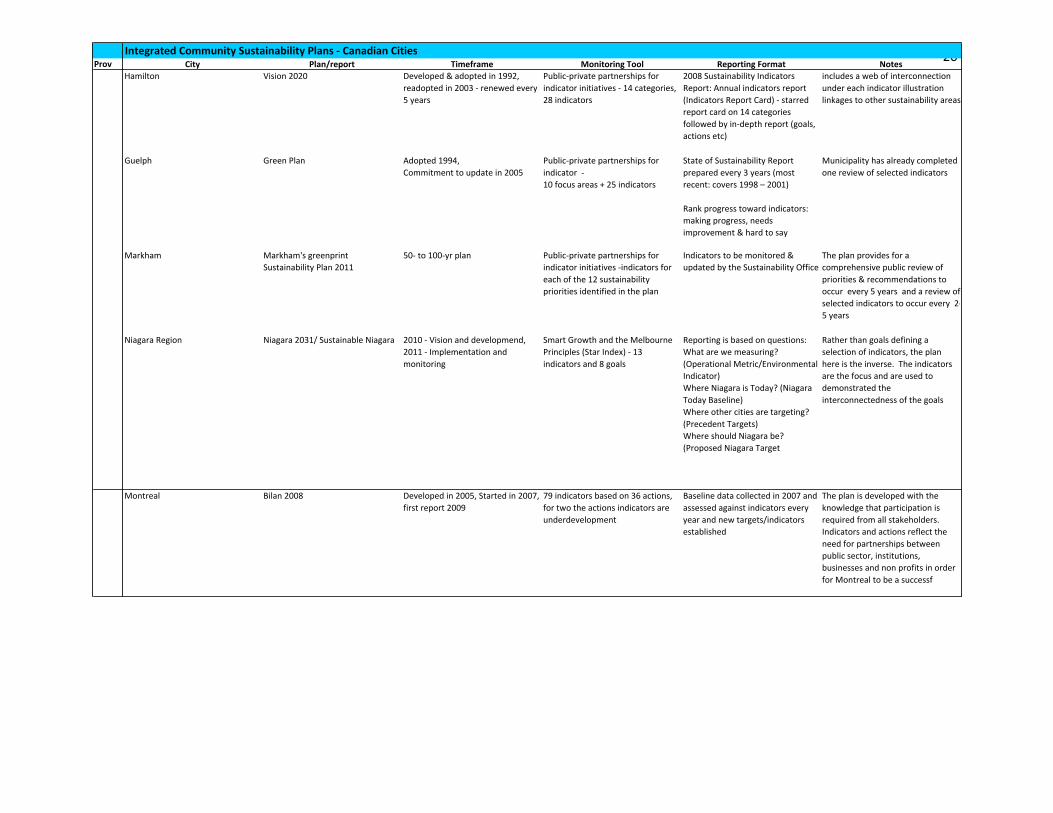
20
Prov City Plan/report Timeframe Monitoring Tool Reporting Format NotesHamilton Vision 2020 Developed & adopted in 1992,
readopted in 2003 ‐ renewed every 5 years
Public‐private partnerships for indicator initiatives ‐ 14 categories, 28 indicators
2008 Sustainability Indicators Report: Annual indicators report (Indicators Report Card) ‐ starred report card on 14 categories followed by in‐depth report (goals, actions etc)
includes a web of interconnection under each indicator illustration linkages to other sustainability areas
Guelph Green Plan Adopted 1994,Commitment to update in 2005
Public‐private partnerships for indicator ‐10 focus areas + 25 indicators
State of Sustainability Report prepared every 3 years (most recent: covers 1998 – 2001)
Rank progress toward indicators:making progress, needs improvement & hard to say
Municipality has already completed one review of selected indicators
Markham Markham's greenprint Sustainability Plan 2011
50‐ to 100‐yr plan Public‐private partnerships for indicator initiatives ‐indicators for each of the 12 sustainability priorities identified in the plan
Indicators to be monitored & updated by the Sustainability Office
The plan provides for a comprehensive public review of priorities & recommendations to occur every 5 years and a review of selected indicators to occur every 2‐5 years
Niagara Region Niagara 2031/ Sustainable Niagara 2010 ‐ Vision and developmend, 2011 ‐ Implementation and monitoring
Smart Growth and the Melbourne Principles (Star Index) ‐ 13 indicators and 8 goals
Reporting is based on questions: What are we measuring? (Operational Metric/Environmental Indicator)Where Niagara is Today? (Niagara Today Baseline)Where other cities are targeting? (Precedent Targets)Where should Niagara be? (Proposed Niagara Target
Rather than goals defining a selection of indicators, the plan here is the inverse. The indicators are the focus and are used to demonstrated the interconnectedness of the goals
Montreal Bilan 2008 Developed in 2005, Started in 2007, first report 2009
79 indicators based on 36 actions, for two the actions indicators are underdevelopment
Baseline data collected in 2007 and assessed against indicators every year and new targets/indicators established
The plan is developed with the knowledge that participation is required from all stakeholders. Indicators and actions reflect the need for partnerships between public sector, institutions, businesses and non profits in order for Montreal to be a successf
Integrated Community Sustainability Plans ‐ Canadian Cities
21
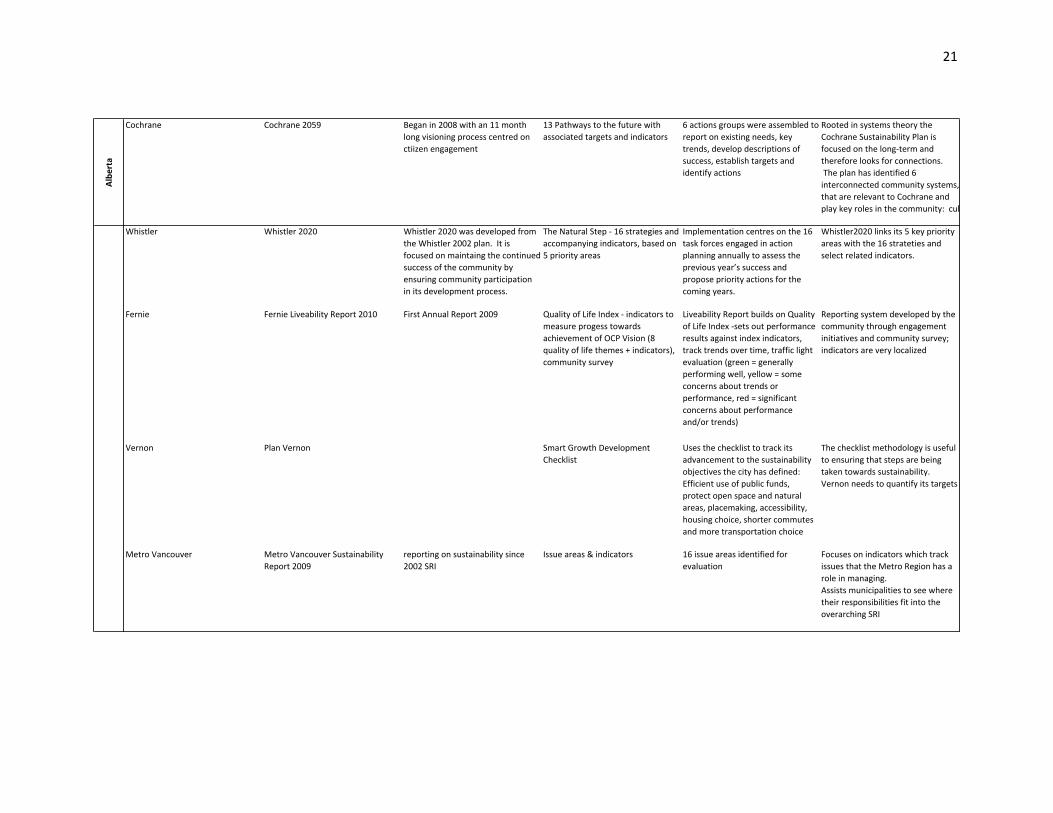
Alberta
Cochrane Cochrane 2059 Began in 2008 with an 11 month long visioning process centred on ctiizen engagement
13 Pathways to the future with associated targets and indicators
6 actions groups were assembled to report on existing needs, key trends, develop descriptions of success, establish targets and identify actions
Rooted in systems theory the Cochrane Sustainability Plan is focused on the long‐term and therefore looks for connections. The plan has identified 6 interconnected community systems, that are relevant to Cochrane and play key roles in the community: cul
Whistler Whistler 2020 Whistler 2020 was developed from the Whistler 2002 plan. It is focused on maintaing the continued success of the community by ensuring community participation in its development process.
The Natural Step ‐ 16 strategies and accompanying indicators, based on 5 priority areas
Implementation centres on the 16 task forces engaged in action planning annually to assess the previous year’s success and propose priority actions for the coming years.
Whistler2020 links its 5 key priority areas with the 16 strateties and select related indicators.
Fernie Fernie Liveability Report 2010 First Annual Report 2009 Quality of Life Index ‐ indicators to measure progess towards achievement of OCP Vision (8 quality of life themes + indicators), community survey
Liveability Report builds on Quality of Life Index ‐sets out performance results against index indicators, track trends over time, traffic light evaluation (green = generally performing well, yellow = some concerns about trends or performance, red = significant concerns about performance and/or trends)
Reporting system developed by the community through engagement initiatives and community survey; indicators are very localized
Vernon Plan Vernon Smart Growth Development Checklist
Uses the checklist to track its advancement to the sustainability objectives the city has defined: Efficient use of public funds, protect open space and natural areas, placemaking, accessibility, housing choice, shorter commutes and more transportation choice
The checklist methodology is useful to ensuring that steps are being taken towards sustainability. Vernon needs to quantify its targets
Metro Vancouver Metro Vancouver Sustainability Report 2009
reporting on sustainability since 2002 SRI
Issue areas & indicators 16 issue areas identified for evaluation
Focuses on indicators which track issues that the Metro Region has a role in managing. Assists municipalities to see where their responsibilities fit into the overarching SRI

Case Studies: Concluding remarks It is evident that there is a limited availability of monitoring reports from cities across Canada as cities are at various stages of their ICSPs. The presence of a comprehensive and ambitious sustainability plan does not necessarily translate into implementation and reporting in all cases. Implementation is tied to resources in terms of staff capacity, political will, and finances. This creates challenges for planners as they develop indicators for their communities, as there are few examples from which to learn. However the reports that are available provide a strong base which other cities can use. From a review of the indicators being used in various municipalities, a number of conclusions about how indicators are being adapted to various local needs can be drawn. Three themes arose:
• Inclusion of a description of the linkages between the indicators and sustainability goals, • Acknowledgement of any weaknesses or limitations in current data collection or measurement
techniques. • Use of localized measurements and data.
The majority of the reports and plans reviewed provided a description of how the selected indicators helped to monitor progress towards multiple sustainability goals. For example, the provision of accessible and affordable transportation choices relates primarily to GHG emission reduction but also social equity, individual health and fostering a social lifestyle in the city through walking and biking. Hamilton and Whistler provide visual representations to demonstrate the interconnections between indicators and goals. Limitations of the current measurement techniques and data sources are also discussed in the available reports. Acknowledgement of the challenges in fulfilling sustainability goals demonstrates the commitment municipalities have to create a culture of transparency and accountability around their sustainability plans. As an example, while conducting a community survey for their Liveability Report, the City of Fernie found that residents were concerned with monitoring community consumption of local food. The data for this particular indicator was not available at the time of publishing, however a question on local food production was included in the survey in response to residents’ request and the data inserted into the final report. This approach demonstrated commitment to the participatory process and can help communities move towards their sustainability goals by identifying where the gaps in data are. Municipalities have used creativity in their data gathering in an attempt to address the issue of finding appropriate data to measure progress towards sustainability goals. Some municipalities have formed partnerships with local non‐profits, societies and clubs to access data outside of official city statistics, simultaneously building a sense of community and common ownership of sustainability goals. For example, the City of Guelph to measure their progress in protecting wildlife habitat within the city turned to local bird watchers for assistance. The data included in their State of Sustainability Report came from a seven‐day period of bird counts conducted by the local bird watchers in the southern end of the city. Though acknowledged as not a long‐term fix for measuring habitat preservation, in the interim, the city is working to make use of local assets.

Toolkit for Cities In moving towards developing a monitoring and evaluation toolkit it must be recognized that every municipality has unique features that shape its policies and planning decisions. Therefore it follows that a toolkit will not be a one size fits all box. The proposed toolkit presented here recognizes that at their core municipalities have obligations to meet the basic needs of its citizens. Development of the toolkit begins with the four aspects of sustainability outlined by the Federal Government for ICSPs: Environmental, Economic, Social and Cultural. Using these four areas as the base provides the common ground from which all municipalities across Canada are creating their ICSPs. Differences between municipalities are acknowledged by dividing the tools used as general or specific. To clarify, specific will refer to tools that can be used based on their value to the municipality. For example, a city on a fresh water lake will not be concerned with indicators related to using marine life as a determinant of improved water quality. To provide context and to reiterate the general aspects outlined by the federal government:
1. Environmental sustainability: reducing dependence on, consumption of, and participation in activities that require fossil fuels, extraction of metals and minerals, and chemicals that are harmful to the environment.
2. Social sustainability: Recognition that social justice supports environmental sustainability. 3. Cultural sustainability: Reflection of Canadian society and its diversity, the arts and the creative
class that are linked to other aspects of sustainability such as economic development. 4. Economic sustainability: Community economic development and takes into consideration the
other dimensions of sustainability. Prior to presenting the toolkit, clarifying the definitions of goals, indicators and targets is essential. Goals in the context of sustainability, is the ‘end’ result to which all actions are directed. In sustainability though, the goal is constantly shifting over time as each ‘end’ is achieved. Targets are steps or milestones that comprise the goal. Indicators are groups of statistical values that indicate progress towards the targets and goal. NOTE: The research that has served as the basis for the development for this toolkit presented challenges with the definitions that the toolkit will attempt to amend. In several of the plans and reports from municipalities targets were stated and quantified, however the indicators were left as implied. It is understood that ICSPs are in various stages and that indicators are constantly evolving to meet changing circumstance; however this toolkit developed from a broad range of sources sets out to present municipalities with a bank of indicator ideas.
The Toolkit There are four sections in the toolkit under which indicators are categorized: Environment, Economy, Social and Cultural. Quantitative and qualitative indicators and measures are presented for each of the sub categories within the four main categories. Indicators that are adaptable to meet place specific characteristics will be italicized. A summary table presents the indicators and measures in terms of

24
possible sources for methodology. In short the table directs users towards projects, which have strong examples of indicators that specialize in a given area of sustainability. Environmental Sustainability primarily includes Ecosystems, Water Quality, and Air Quality. Given its base in science and its history in sustainability, measuring environmental sustainability is the ‘simplest’. Many cities and organizations have a broad range of indicators for assessing progress towards targets and goals. Ecosystem Indicators Quantitative • Hectares of protected areas • Number of species and plants in a given area • Numbers of a specific plant (endangered
species) • Numbers of a specific animal (endangered
species) • Rates of adverse events that impact
ecosystems (ie major storms) • Forest fires in summer • Flooding in spring • Extreme temperatures • Number and size of natural protected areas
Qualitative • Focus Groups, Surveys and Interviews
o Assess attitudes towards conservation and protection
o Track incidence of litter in parks o Attitudes towards pollution
Water Quality & Availability Quantitative • Level of pollution in freshwater, ocean • Amount of waste deposited in fresh water
by industry • Number of fish species living in a stream • Fresh water quality rating • Water usage by use (per capita, household) • Water usage by month
Qualitative • Focus Groups, Surveys and Interviews
o Breakdown of water uses o How are household adapting and
recycling water
Air Quality/GHG Quantitative • Level of Pollution • Quantity of Airborne irritants • Air temperature/ humidity by month • Level of GHG emission by household and
industry/sector • Fine particulate matter NO2, SOx
Qualitative • Focus Groups, Surveys and Interviews
o Perceptions of pollution and GHG o How can air quality and GHG be
changed o What actions are being taken to reduce
GHG and improve Air Quality
Environmental indicators that are not applicable to all cities would be ones that are specific to urban environments and rural environments. Urban Environment Quantitative Qualitative

25
• Urban heat Island effect: Temperature changes
• Number of public green spaces • Number of initiatives to reduce heat islands • Number of buildings retrofitted for energy
efficiency • Percentage of buildings built green and
above required building codes • Number of people using alternative modes
of transportation; walking, cycling, using public transit
• Waste management Strategies • Number of community gardens • Walk‐ability (walkscore)
• Focus Groups, Surveys and interviews o Perceptions of sustainability practices o How citizens are practicing
sustainability
Rural Environment Quantitative • Crop yields over time (decreases/increases)
and correlation to temperature • Number of alternative modes of transporting
goods to urban centres • Number of farmers shifting towards
sustainable farming practices (pesticide use, irrigation)
Qualitative • Focus Groups, Surveys and interviews
o Perceptions of sustainability practices o How citizens are practicing
sustainability o Rural Environment
Social Sustainability recognizes the role of social justice in achieving sustainability. Poverty, crime, inequality and poor health all hinder individuals and communities in their progression towards sustainability. Measuring social sustainability leans more towards needing place specific indicators. However there are basic aspects of social sustainability that are needed: Education, Health, and Security. These aspects can impact cities in varying degrees. For example threats to security can range from fear of children not being able to cross the street safely to gang violence that forces everyone to stay indoors. Indicators will therefore need to cover the spectrum of social needs with the basic assumption that everyone wants to live a life free from fear and want. Education Quantitative • Attainment of scholastic aptitude tests for
reading and math in specific grades (5, 8 and 12)
• Number of children who complete high school
• Number of children who enter post secondary school
• Number of people with high school degrees, diplomas, undergraduate degrees, graduate degrees etc
Qualitative • Focus Groups, Surveys and Interviews
o Perceptions of education o Curriculum – links to community

26
• Student to teacher ratios • Library rates of use and access
Health Quantitative • Cost of healthcare • Access to healthcare • Rates of obesity/ malnutrition • Rates of disease (diabetes, asthma etc) • Recreation facilities rates of use • Physical activity level in schools • Number of physical activity programs
available
Qualitative • Focus Groups, Surveys and Interviews
o Perceptions of community wellness o Perceptions of health/ mental health
Safety Quantitative • Number of minor crimes • Number of violent crimes • Number of car accidents • Police force size • Percentage children that go to school by
themselves
Qualitative • Focus Groups, Surveys and Interviews
o Perceptions of security and safety o What is safety
Housing Quantitative • Cost of housing relative to household
income o Mortgage rates per unit size o Rental rates per unit size
• Rate of home ownership • Rate of home rental • Number of affordable housing units • Number of social housing units
Qualitative • Focus Groups, Surveys and Interviews
o Perceptions of housing affordability
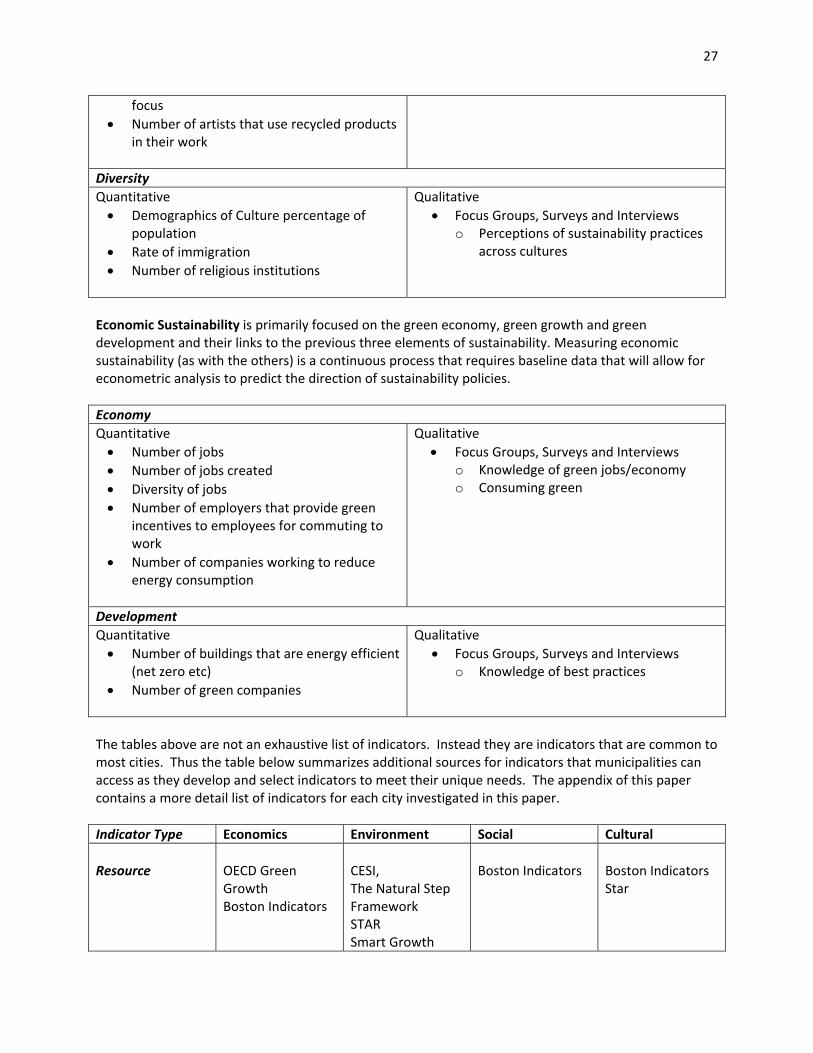
Cultural Sustainability, at first glance culture would logically be seen as a social sustainability. However, cultural sustainability is concerned with the arts and culture activities that characterize community. Additionally in the Canadian context culture is also a reflection of the nation’s diversity and the ability to embrace new ideas. Arts (and the Creative Class) Quantitative • Number of art galleries, theatres • Number of festivals by type • Attendance at festivals • Number of events with an environmental
Qualitative • Focus Groups, Surveys and Interviews
o Perceptions of the relationship between art and sustainability
27
focus • Number of artists that use recycled products
in their work Diversity Quantitative • Demographics of Culture percentage of
population • Rate of immigration • Number of religious institutions
Qualitative • Focus Groups, Surveys and Interviews
o Perceptions of sustainability practices across cultures
Economic Sustainability is primarily focused on the green economy, green growth and green development and their links to the previous three elements of sustainability. Measuring economic sustainability (as with the others) is a continuous process that requires baseline data that will allow for econometric analysis to predict the direction of sustainability policies. Economy Quantitative • Number of jobs • Number of jobs created • Diversity of jobs • Number of employers that provide green
incentives to employees for commuting to work
• Number of companies working to reduce energy consumption
Qualitative • Focus Groups, Surveys and Interviews
o Knowledge of green jobs/economy o Consuming green
Development Quantitative • Number of buildings that are energy efficient
(net zero etc) • Number of green companies
Qualitative • Focus Groups, Surveys and Interviews
o Knowledge of best practices
The tables above are not an exhaustive list of indicators. Instead they are indicators that are common to most cities. Thus the table below summarizes additional sources for indicators that municipalities can access as they develop and select indicators to meet their unique needs. The appendix of this paper contains a more detail list of indicators for each city investigated in this paper. Indicator Type Economics Environment Social Cultural Resource
OECD Green Growth Boston Indicators
CESI, The Natural Step Framework STAR Smart Growth
Boston Indicators
Boston Indicators Star

28
OECD Green Growth
City with Strong Indicators
Whistler, Niagara
Whistler, Cochrane, Niagara
Montreal, Fernie, Markham,
Montreal, Markham, Whistler
29
Conclusion
Ultimately cities across Canada are in various stages of their ICSPs and are successfully developing unique strategies for their communities. It has become clear that the greatest challenge for cities is developing indicators to monitor and evaluate their progress. However this investigation into ICSPs and indicators tools has demonstrated that cities are rising to the challenge by the following:
1. Placing emphasis on bottom‐up approaches to developing sustainability indicators and producing reporting mechanisms, which can be easily understood by the community and a broad range of stakeholders.
2. Cities are embracing the challenge and formulating creative means to track their success. 3. Developing strong partnerships with business, institutions, and non‐profits to gain access to
data and ideas to creatively measure progress towards sustainability targets. 4. Further there is strong evidence that cities are actively engaging citizens in the process thereby
strengthening the commitment to sustainability. In order for cities to maintain the momentum of their ICSPs and advance their progress, there are several key lessons to keep in mind:
• Resources: Cities can be constrained by the availability of data and information, however planners and policy makers must remember that there are other agencies in government and in the non‐profit sector that have access to resources. One example is the Canadian Environmental Sustainability Indicators, from Environment Canada. This is an excellent source of data rooted in scientific research that will enable cities to track environmental progress. Others, not specific to the Canadian context but that provide clear examples of indicators are: STAR Index, Boston Indicators Project, The Natural Step, Smart Growth, and the OECD’s Cities and Green Growth. Ultimately, innovation and creativity by cities will enable them to tap into available data sources related to sustainability to develop their indicators and track their success.
• Baseline Data: Connected to resources is baseline data; ICSPs have little value in the absence of baseline data. Cities must have a starting point, from which to establish their sustainability goals. The Resort Municipality of Whistler is a strong example of a city that has baseline data supporting their ICSP. Data provides a quantifiable means to measure success.
• Clear Vision: Cities need to have a vision of their future in the context of sustainability. Further the vision needs to be shared by all members of the community, to achieve success. Civic engagement is a vital piece in the development of ICSPs. As most of the case studies have demonstrated public engagement has played a key role in developing the plan and continues to serve as a tool for evaluating success yearly (Whistler, Cochrane, Guelph, and Niagara Region).
• Knowledge Exchange: The purpose of this paper is to present what has been done by Canadian cities in relation to integrated sustainability planning; creating an opportunity to learn and exchange ideas. Cities may face unique challenges to sustainability, based on their geography, however an opportunity to learn from another city can serve as a starting point for innovation to addressing sustainability challenges specific to their context.

30
Canadian cities are committed to sustainability as demonstrated by indicators and plans that have been presented in this paper. Thus it is hoped that as cities progress they will continue to engage in dialogue that will enable them to share knowledge and ideas related to measuring sustainability.
31
REFERENCES Astleithner, Florentina, Hamedinger, Alexander, Holman, Nancy & Rydin, Yvonne. Institutions and
Indicators – the discourse about indicators in the context of sustainability. Journal of Housing and the Built Environment. Vol. 19, Iss. 1, 2004, p. 7‐24.
Barca, Fabrizio & McCann, Philip (2011). Outcome Indicators and Targets‐ Towards a Performance
Oriented EU Cohesion Policy. High Level Group Reflecting on Future Cohesion Policy, Meeting no. 8
Bell, Simon & Morse, Stephen. (2008). Sustainability Indicators: Measuring the immeasurable? London,
UK: Earthscan. Elkington, John. (2004). Enter the Triple Bottom Line. Ghosh, Sumita, Vale, Robert & Vale, Brenda. (2006). Indications from sustainability indicators. Journal of
Urban Design. Vol. 11, Iss. 2. P. 263‐275. Hoornweg, Daniel et al. (2006). City Indicators: Now to Nanjing. Paper presented by the World Bank at
the Third World Urban Forum, Vancouver, June 22, 2006. Ling, Christopher, et. al. (2009). A Template for Integrated Community Sustainability Planning.
Environmental Management. Vol. 44, pp 228‐242. Maclaren, Virginia, W. (1996). Developing indicators of urban sustainability: A focus on the Canadian
experience. Toronto, ON: ICURR Press. Munier, Nolberto. (2005). Introduction to sustainability: road to a better future. Dordrecht, Netherlands:
Springer. Newman, Peter & Jennings, Isabella. (2008). Cities as sustainable ecosystems: principles and practices.
Washington, DC: Island Press. Reed, Mark S., Fraser, Evan D.G., & Dougill, Andrew J. (2006). An adaptive learning process for
developing and applying sustainability indicators with local communities. Ecological Economics. Vol. 59. P. 406‐418.
Scerri, Andy & James, Paul. (2010). Accounting for sustainability: combining qualitative and quantitative
research in developing ‘indicators’ of sustainability. International Journal of Social Research Methodology. Vol 13, Iss. 1, p. 41‐53.
www.bostonindicators.org

32
CITY RESOURCES City of Montreal PREMIER PLAN STRATÉGIQUE DE DÉVELOPPEMENT DURABLE DE LA COLLECTIVITÉ MONTRÉALAISE Bilan 2008 de la phase 2007‐2009 Resort Municipality of Whistler Whistler 2020 http://www.whistler2020.ca/whistler/site/homepage.acds?instanceid=1930792&context=1930501 http://www.whistler.ca/index.php?option=com_content&task=view&id=154&Itemid=203 City of Fernie The Quality of Life Index and Liveability Project http://www.fernie.ca/siteengine/ActivePage.asp?PageID=345 Fernie Liveability Report 2010 http://fernie.iwebez.com/files/%7BD77B8C6D‐65E7‐4805‐AAB4‐73D991F4BF8C%7D110120%20liveabilility%20report%20final%20ADOPTED%20JAN%2024‐11.pdf City of Guelph Green Plan website http://guelph.ca/living.cfm?smocid=1948 City of Guelph State of Sustainability Report: 2nd Edition – 1998 to 2001 http://guelph.ca/uploads/ET_Group/admin/GPSC_SOSR_2003.pdf City of Hamilton Sustainability website http://www.hamilton.ca/CityDepartments/PlanningEcDev/Divisions/StrategicServicesSpecialProjects/Sustainability.htm 2008 Sustainability Indicators Report http://www.hamilton.ca/ProjectsInitiatives/V2020/IndicatorsMeasuringProgress/2008+Sustainability+Indicators+Report.htm Town of Markham Markham’s Greenprint Sustainability Plan http://www.markham.ca/wps/wcm/connect/0c98f70047b7a0ae8da6fd81675ea5bc/GreenPrint+FINAL+Plan_2011_lower+res.pdf?MOD=AJPERES&CACHEID=0c98f70047b7a0ae8da6fd81675ea5bc City of Toronto Toronto Green Development Standard http://www.toronto.ca/planning/environment/greendevelopment.htm#standards Comox Comox Valley Sustainability Strategy

33
Metro Vancouver Sustainable Region Initiative http://www.metrovancouver.org/ABOUT/SRI/Pages/default.aspx Metro Vancouver Sustainability Report 2009 http://www.metrovancouver.org/about/publications/Publications/SustainabilityReport2009.pdf

34
Appendix A – Cities Investigated
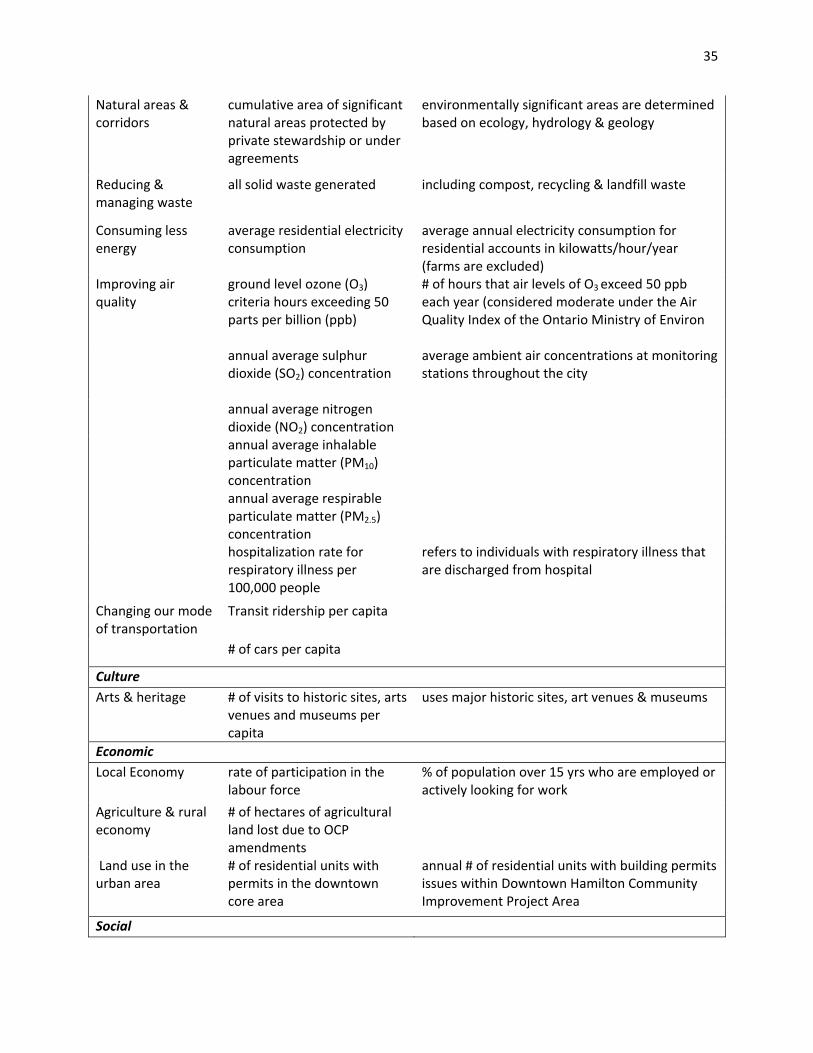
City of Hamilton, Ontario ‐ 2008 Sustainability Indicators Report Sustainability website http://www.hamilton.ca/CityDepartments/PlanningEcDev/Divisions/StrategicServicesSpecialProjects/Sustainability.htm VISION 2020 is a long‐term vision for the City of Hamilton that is meant to guide how the city works to build a sustainable community. It was first adopted by council in 1992 and has been renewed every five years since. The Annual Indicators Report is intended to demonstrate the progress being made towards the goals outlined in VISION 2020 as well as to highlight areas, which require further action. These reports are meant to provide a starting place for debate and resulting action for council and the community to take action on their sustainability goals. The indicators, which are reported on in the Annual Indicators Reports, were first defined in 1994 and then updated in 1999 to reflect new understandings of sustainability goals. During the 2003 renewal of VISION 2020, City Council sought to implement the goals outlined in the vision by integrating it directly into some of the city’s decision‐making processes. This was done under the “Building a Strong Foundation” initiative, which integrated VISION 2020 goals into other planning processes such as the Growth Related Integrated Development Strategy (GRIDS), and the Official Community Plan (OCP). Hamilton’s definition of sustainability gives equal weight to social/health, economic and environmental costs, benefits and risks when making decisions. It is recognized that moving towards the goals outlined in VISION 2020 requires a widespread understanding of the relationship between people and their environment. The city further recognizes that equity and fairness are requisites for a sustainable community.
Category Indicators Notes Environment Improving quality of water resources
total loading of ammonia in Hamilton Harbour
ammonia can increase algal growth which reduces the amount of light that reaches aquatic plants below the surface, decomposing algae consumes oxygen & is toxic to fish in excess
total loading of phosphorous into Hamilton Harbour
excess phosphorous promotes algal growth
total water consumption for all uses
average consumption for residential, commercial & heavy industrial per metered accounts
# of "all beaches open for swimming days"
total % of days open during swimming season between Victoria Day & Labour Day based on levels of bacteria
35
Natural areas & corridors
cumulative area of significant natural areas protected by private stewardship or under agreements
environmentally significant areas are determined based on ecology, hydrology & geology
Reducing & managing waste
all solid waste generated including compost, recycling & landfill waste
Consuming less energy
average residential electricity consumption
average annual electricity consumption for residential accounts in kilowatts/hour/year (farms are excluded)
Improving air quality
ground level ozone (O3) criteria hours exceeding 50 parts per billion (ppb)
# of hours that air levels of O3 exceed 50 ppb each year (considered moderate under the Air Quality Index of the Ontario Ministry of Environ
annual average sulphur dioxide (SO2) concentration
average ambient air concentrations at monitoring stations throughout the city
annual average nitrogen dioxide (NO2) concentration
annual average inhalable particulate matter (PM10) concentration
annual average respirable particulate matter (PM2.5) concentration
hospitalization rate for respiratory illness per 100,000 people
refers to individuals with respiratory illness that are discharged from hospital
Changing our mode of transportation
Transit ridership per capita
# of cars per capita
Culture Arts & heritage # of visits to historic sites, arts
venues and museums per capita
uses major historic sites, art venues & museums
Economic Local Economy rate of participation in the
labour force % of population over 15 yrs who are employed or actively looking for work
Agriculture & rural economy
# of hectares of agricultural land lost due to OCP amendments
Land use in the urban area
# of residential units with permits in the downtown core area
annual # of residential units with building permits issues within Downtown Hamilton Community Improvement Project Area
Social

36
Education #of adult education high school equivalency diplomas granted
% of grade 3 students performing at levels 3 and 4
level 3 ("B" grade) is provincial standard, level 4 is "A"
Personal health & well‐being
# of low birth weight babies born per 1000 live births
hospitalization rate for falls by persons 65+ years
rate of mortality due to heart disease
Community well‐being an capacity building
# of community contacts at volunteer Hamilton
Volunteer Hamilton makes all volunteer positions accessible through their website & offices
shelter occupancy rate "on any given night" in November
# of individuals accessing shelters on one night in November, collected by social planning & research council (captures shelter occupancy & # of beds available)
Safety and Security # of robberies thefts involving physical violence or threat of violence or theft while armed
# of pedestrians and cyclists injured by motor vehicles
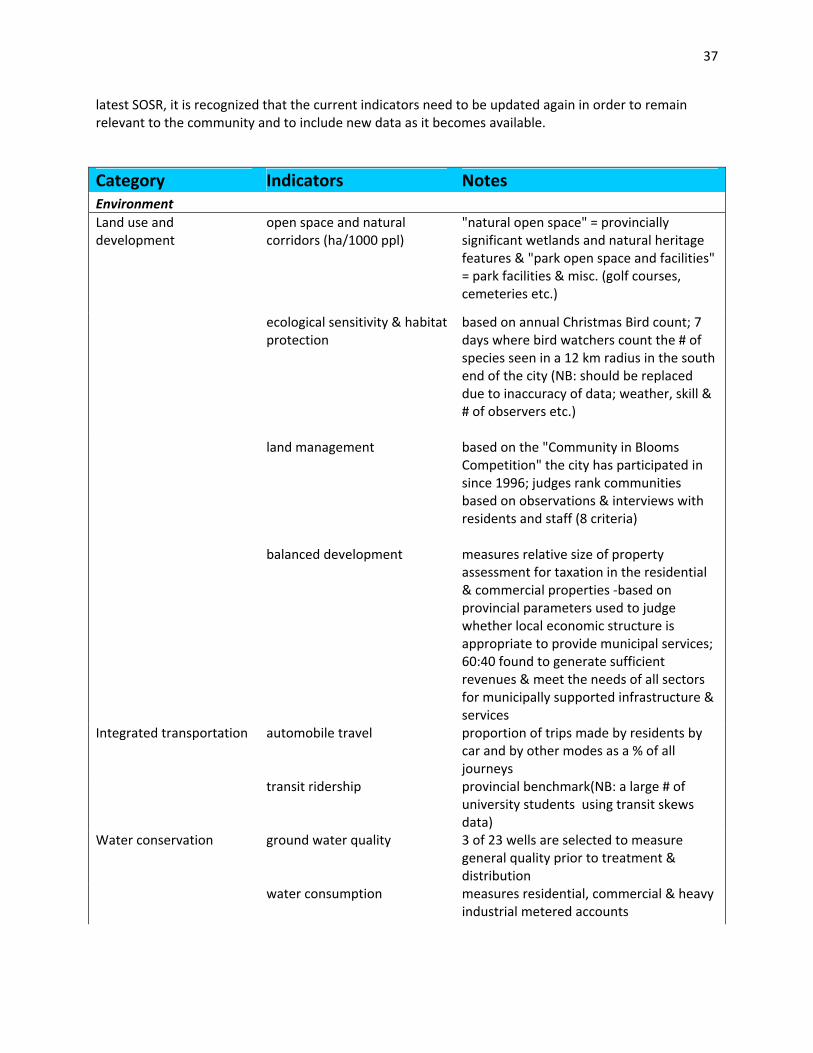
City of Guelph – State of Sustainability Report, 2nd Edition ‐ 1998 to 2001 Green Plan website http://guelph.ca/living.cfm?smocid=1948 Guelph’s Green Plan was prepared from 1992‐1994 and served as the first step in a strategic planning process to fulfill the city’s vision of environmental sustainability in harmony with economic and social development. When the plan was adopted, council required that a State of Sustainability Report (SOSR) be prepared every 3 years; the 1998 to 2001 SOSR is the most recent available. The SOSR covers environmental, social and economic indicators of the community and relates them to the long and short‐term goals outlined in the Green Plan. It is recognized that the judgements of “making progress,” “needs improvement,” and “hard to say” can make it difficult to get a single, all‐inclusive result. Despite this, the indicators are useful in illustrating trends over time and identifying potential future stresses. The sustainability indicators being used have been updated once, in 2001, since their selection in 1996/1997. This review process involved a survey of all data providers in order to gather their views on the current data’s meaningfulness. From this process, a number of new indicators were included while others were removed for future reports; this iteration is documented in the 1998 to 2001 SOSR. In the
37
latest SOSR, it is recognized that the current indicators need to be updated again in order to remain relevant to the community and to include new data as it becomes available.
Category Indicators Notes Environment Land use and development
open space and natural corridors (ha/1000 ppl)
"natural open space" = provincially significant wetlands and natural heritage features & "park open space and facilities" = park facilities & misc. (golf courses, cemeteries etc.)
ecological sensitivity & habitat protection
based on annual Christmas Bird count; 7 days where bird watchers count the # of species seen in a 12 km radius in the south end of the city (NB: should be replaced due to inaccuracy of data; weather, skill & # of observers etc.)
land management based on the "Community in Blooms Competition" the city has participated in since 1996; judges rank communities based on observations & interviews with residents and staff (8 criteria)
balanced development measures relative size of property assessment for taxation in the residential & commercial properties ‐based on provincial parameters used to judge whether local economic structure is appropriate to provide municipal services; 60:40 found to generate sufficient revenues & meet the needs of all sectors for municipally supported infrastructure & services
Integrated transportation automobile travel proportion of trips made by residents by car and by other modes as a % of all journeys
transit ridership provincial benchmark(NB: a large # of university students using transit skews data)
Water conservation ground water quality 3 of 23 wells are selected to measure general quality prior to treatment & distribution
water consumption measures residential, commercial & heavy industrial metered accounts
38
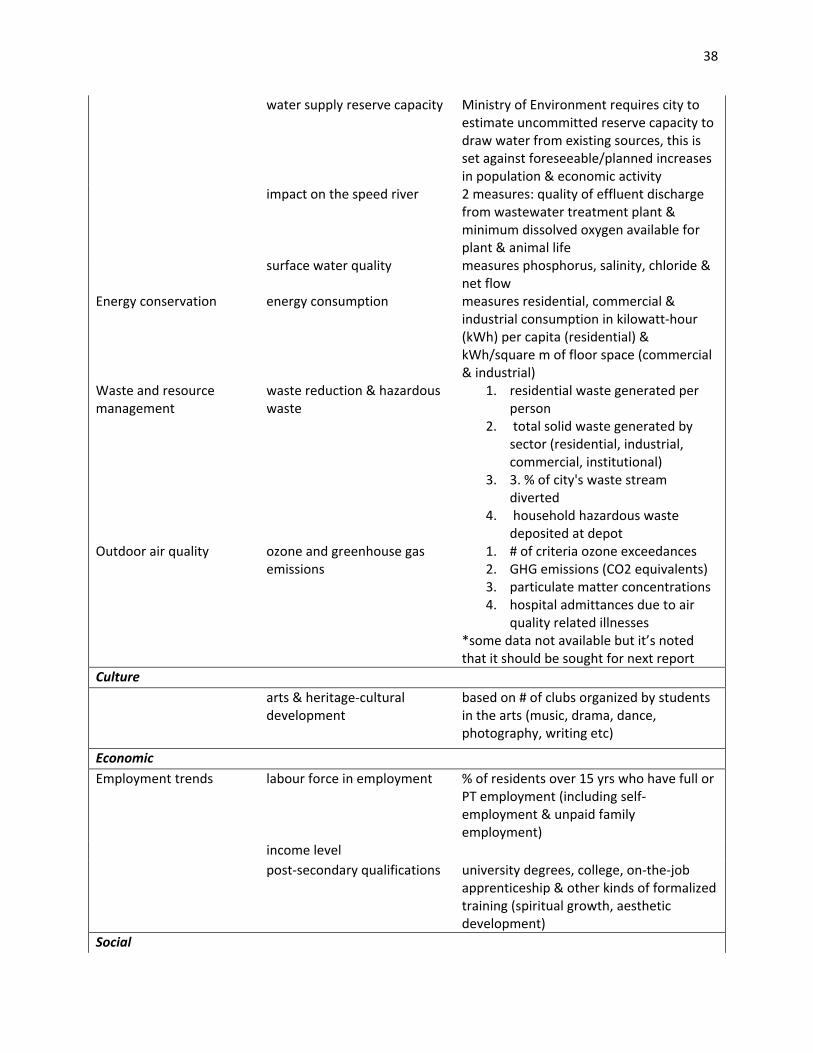
water supply reserve capacity Ministry of Environment requires city to estimate uncommitted reserve capacity to draw water from existing sources, this is set against foreseeable/planned increases in population & economic activity
impact on the speed river 2 measures: quality of effluent discharge from wastewater treatment plant & minimum dissolved oxygen available for plant & animal life
surface water quality measures phosphorus, salinity, chloride & net flow
Energy conservation energy consumption measures residential, commercial & industrial consumption in kilowatt‐hour (kWh) per capita (residential) & kWh/square m of floor space (commercial & industrial)
Waste and resource management
waste reduction & hazardous waste
1. residential waste generated per person
2. total solid waste generated by sector (residential, industrial, commercial, institutional)
3. 3. % of city's waste stream diverted
4. household hazardous waste deposited at depot
Outdoor air quality ozone and greenhouse gas emissions
1. # of criteria ozone exceedances 2. GHG emissions (CO2 equivalents) 3. particulate matter concentrations 4. hospital admittances due to air
quality related illnesses *some data not available but it’s noted that it should be sought for next report
Culture arts & heritage‐cultural
development based on # of clubs organized by students in the arts (music, drama, dance, photography, writing etc)
Economic Employment trends labour force in employment % of residents over 15 yrs who have full or
PT employment (including self‐employment & unpaid family employment)
income level post‐secondary qualifications university degrees, college, on‐the‐job
apprenticeship & other kinds of formalized training (spiritual growth, aesthetic development)
Social

39
Stable healthy families children in care and domestic disputes
public safety and security 1. # of robberies/burglaries 2. # of fires in residential units
personal health 2 measures used:
potential years of life lost (PYLL)= yrs of life a person might potentially have had which are lost as a result of premature death from illness leading causes of death (LCOD) as a % of all deaths that year
incidence of low birth weight infants
falls among those over 65 yrs deaths from all forms of
cancer
deaths from heart disease Community capacity building
recreation facilities # of recreational facilities available to the public
environmental education no systematic measurement possible; qualitative assessment of opportunities at schools
Community cohesion local government participation
municipal election voting rates
Community concern Measured by donations & volunteer time to programmes at United Way
Town of Markham, Ontario – Markham's Greenprint Sustainability Plan 2011 Markham’s Greenprint Sustainability Plan http://www.markham.ca/wps/wcm/connect/0c98f70047b7a0ae8da6fd81675ea5bc/GreenPrint+FINAL+Plan_2011_lower+res.pdf?MOD=AJPERES&CACHEID=0c98f70047b7a0ae8da6fd81675ea5bc Markham’s Greenprint Sustainability Plan is a 50 to 100 year overarching plan intended to integrate municipal planning and decision making with the town’s sustainability goals. The plan aligns other initiatives, policies and plans with the vision of a sustainable Markham in an attempt to reduce redundancy and make use of efficiencies. A participatory planning process was undertaken from March 2008 to the spring of 2011 to produce the Greenprint. A number of workshops, a world cafe and open house were held to provide opportunities for community consultation. The public reviewed the draft plan in June 2010.
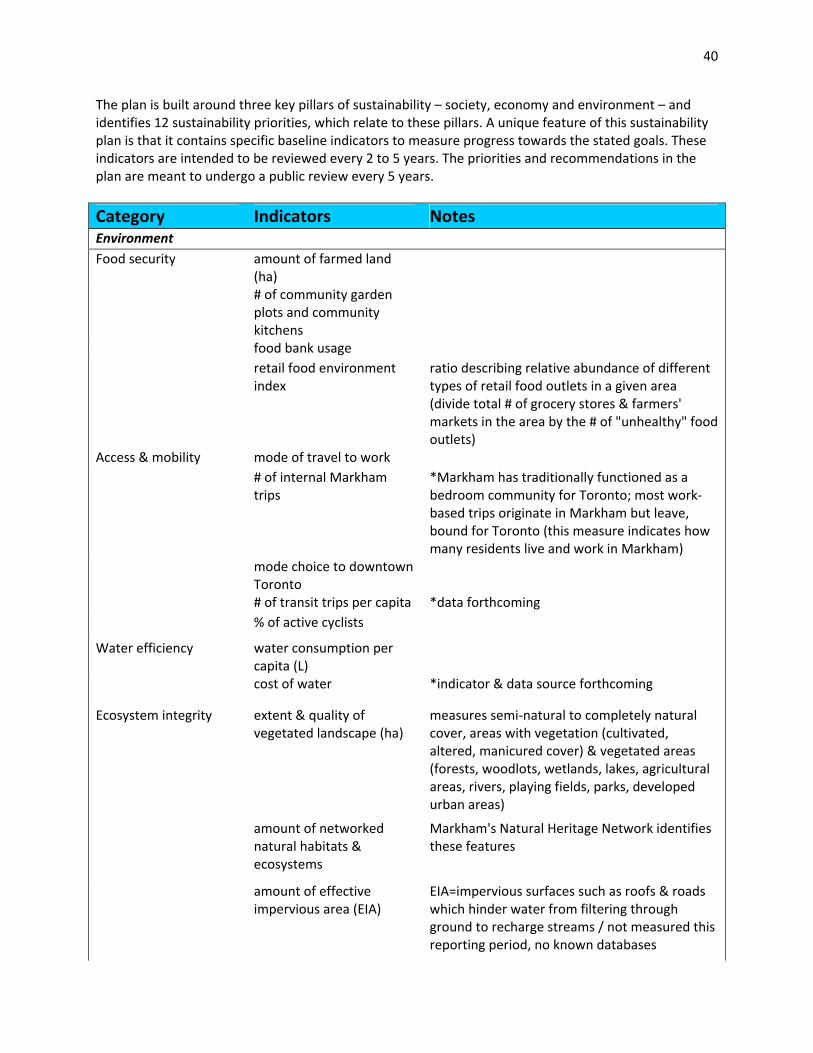
40
The plan is built around three key pillars of sustainability – society, economy and environment – and identifies 12 sustainability priorities, which relate to these pillars. A unique feature of this sustainability plan is that it contains specific baseline indicators to measure progress towards the stated goals. These indicators are intended to be reviewed every 2 to 5 years. The priorities and recommendations in the plan are meant to undergo a public review every 5 years.
Category Indicators Notes Environment Food security amount of farmed land
(ha)
# of community garden plots and community kitchens
food bank usage retail food environment
index ratio describing relative abundance of different types of retail food outlets in a given area (divide total # of grocery stores & farmers' markets in the area by the # of "unhealthy" food outlets)
Access & mobility mode of travel to work # of internal Markham
trips *Markham has traditionally functioned as a bedroom community for Toronto; most work‐based trips originate in Markham but leave, bound for Toronto (this measure indicates how many residents live and work in Markham)
mode choice to downtown Toronto
# of transit trips per capita *data forthcoming % of active cyclists
Water efficiency water consumption per capita (L)
cost of water *indicator & data source forthcoming
Ecosystem integrity extent & quality of vegetated landscape (ha)
measures semi‐natural to completely natural cover, areas with vegetation (cultivated, altered, manicured cover) & vegetated areas (forests, woodlots, wetlands, lakes, agricultural areas, rivers, playing fields, parks, developed urban areas)
amount of networked natural habitats & ecosystems
Markham's Natural Heritage Network identifies these features
amount of effective impervious area (EIA)
EIA=impervious surfaces such as roofs & roads which hinder water from filtering through ground to recharge streams / not measured this reporting period, no known databases

41
urban canopy not measured this reporting period, no known databases
Energy & climate amount of emissions by sector
energy consumption by fuel source
total amount of money spent on energy
*performance forthcoming
amount of energy produced by fuel source
*performance forthcoming
amount of money earned from energy production
*performance forthcoming
inventory of vulnerabilities associated with changing climate
*anticipated climate change impacts on local community
Materials management landfill diversion rate amount of waste
generated per capita
Culture Identity and Culture mosaic index measures # of foreign‐born citizens (indicator of
openness & diversity) representation of diversity
on Council, Committees, and Boards
measures visible minorities
# of major cultural establishments
talent & bohemian indices talent index: % of population with a university certificate, diploma or degree (or higher) bohemian index: compares % of "bohemians" (writers, designers, musicians, actors & other arts‐related personnel) in a region to national pattern; a measure of an area's cultural amenities & level of diversity
Economic
Education & skills resident employment by sector
main sectors that employ residents indicate the knowledge & skills that are important to develop to benefit residents in their current work & reveal opportunities to develop additional sectors
Economic vibrancy # of businesses undertaking public sustainability reporting / are Greenprint partners
*data forthcoming ‐ can use business license system to get this information
annual # of new businesses established

42
# of businesses that have been in the city for more than 5 years
measures business retention
business sector diversity index
*note in plan = if diverse business types representing value chain are classed as part of a single sector, then lack of sector diversity could be interpreted as regional specialization/clustering success
business size diversity index
calculated using Simpson's Diversity Index (1 = infinite diversity, 0 = no diversity)
Social Individual health rate of residents with
diabetes and respiratory disease
rate of adult obesity life expectancy consider both traditional life expectancy &
Disability‐Free Life Expectancy (represents average # of yrs a person can expect to live in good health)
Community involvement
participation counts at town recreation facilities
"people counts" tallies attendance but does not consider activity undertaken during visit
Shelter housing type diversity index
measured on scale of 0‐1 (0=no diversity, 1=high diversity)
housing tenure diversity index
measured on scale of 0‐1 (0=no diversity, 1=high diversity)
households paying more than 30% on housing
measure of affordability; defined as spending less than 30% of household income on housing costs
# of households in core need housing
"core need" = housing that is in need of major repair, does not have enough bedrooms for the size & makeup of household, costs 30% + of total household income
# of residents at risk of homelessness
threshold for being at risk are households spending more than 50% of total household income on housing
Social equity # of low‐income households & persons
measured using after‐tax Low Income Cut‐Off (LICO)
% of child poverty (residents 18 yrs and under)
measured as a function of household income & spending (prepared by Children's Aid Society)
# of low‐income seniors measured using after‐tax Low Income Cut‐Off (LICO) for persons over 65 yrs
youth participation in programs
# of youth registered in Town programs though potential to extend to other programs
# of persons with disabilities
unmeasured as of yet, no know databases in Markham

43
sense of community index measured using a survey (qualitative questions) ‐ feeling of belonging, commitment to meet needs etc.
Education & skills # of people without knowledge of English or French
local unemployment rate # of library visits % of payroll supporting
employee development *data forthcoming
Niagara Region The Niagara Region unlike the other examples in the case studies is comprised of several cities and towns that have unique characteristics defining their geographies. They are unified in the desire to develop a ‘more sustainable framework for urban development’. Niagara 2031 and Sustainable Niagara were constructed using Smart Growth and the Melbourne Principles. The result has been a plan that services the needs of the communities that make up the Niagara Region by building more complete communities. The website address provides a summary of the indicators and their relationship to the goals and the progress made to date. http://www.niagararegion.ca/government/planning/Sustainability/measuring‐progress.aspx#ind1
Indicators Goals Notes Environment Species Abundance Infrastructure Systems
Culture, Learning, Social Development Ecosystems & Natural Areas Economy Agriculture & Food
Evaluates overall health of ecosystems and looks at storm water management to reduce need for built infrastructure. Currently there is a need to work with conservation authorities and community groups for tree planting
Commuting Distance or Public Transit Access
Infrastructure Systems Health & Security Built Environments Economy
Focuses on distances traveled to work via transit or personal vehicle to determine accessibility of amenities and reliance on personal vehicles. Need to work towards mixed‐use and transit oriented communities and a sustainable mobility plan
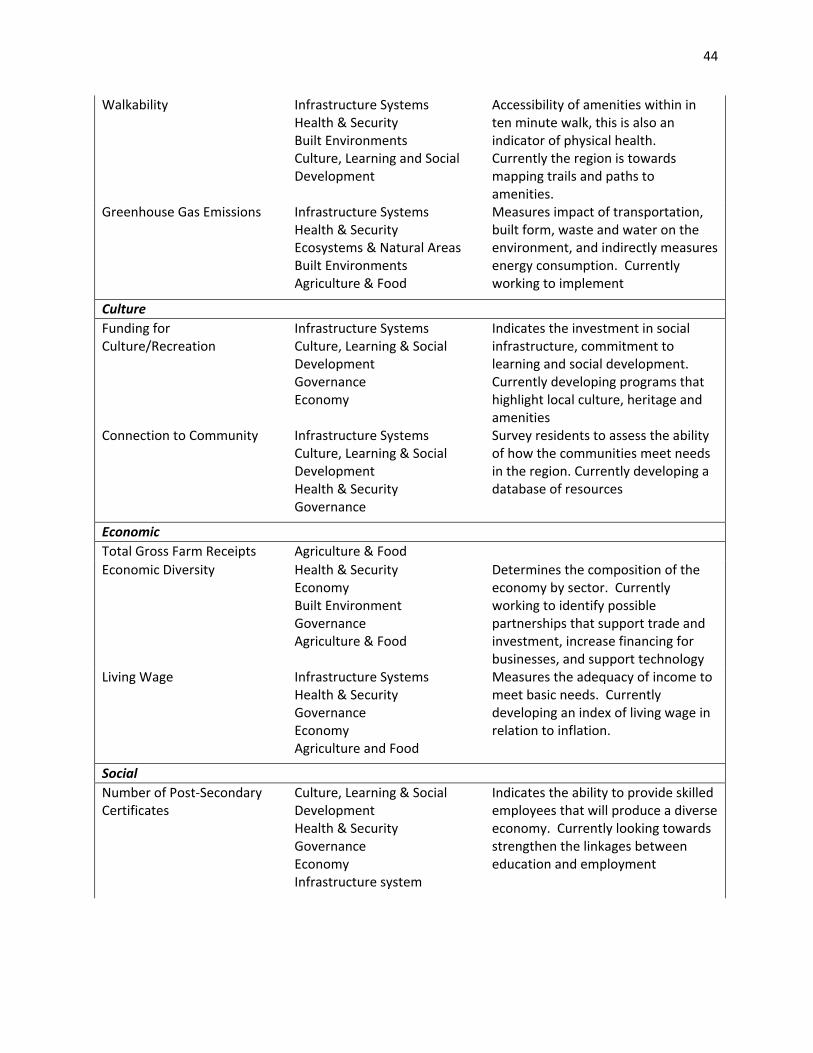
44
Walkability Infrastructure Systems Health & Security Built Environments Culture, Learning and Social Development
Accessibility of amenities within in ten minute walk, this is also an indicator of physical health. Currently the region is towards mapping trails and paths to amenities.
Greenhouse Gas Emissions Infrastructure Systems Health & Security Ecosystems & Natural Areas Built Environments Agriculture & Food
Measures impact of transportation, built form, waste and water on the environment, and indirectly measures energy consumption. Currently working to implement
Culture Funding for Culture/Recreation
Infrastructure Systems Culture, Learning & Social Development Governance Economy
Indicates the investment in social infrastructure, commitment to learning and social development. Currently developing programs that highlight local culture, heritage and amenities
Connection to Community Infrastructure Systems Culture, Learning & Social Development Health & Security Governance
Survey residents to assess the ability of how the communities meet needs in the region. Currently developing a database of resources
Economic Total Gross Farm Receipts Agriculture & Food Economic Diversity Health & Security
Economy Built Environment Governance Agriculture & Food
Determines the composition of the economy by sector. Currently working to identify possible partnerships that support trade and investment, increase financing for businesses, and support technology
Living Wage Infrastructure Systems Health & Security Governance Economy Agriculture and Food
Measures the adequacy of income to meet basic needs. Currently developing an index of living wage in relation to inflation.
Social Number of Post‐Secondary Certificates
Culture, Learning & Social Development Health & Security Governance Economy Infrastructure system
Indicates the ability to provide skilled employees that will produce a diverse economy. Currently looking towards strengthen the linkages between education and employment

45
Food Security Infrastructure Systems Health & Security Economy Ecosystems & Natural Areas Built Environments Agriculture & Food
Sustainability of food system is indicated by the costs of purchasing food and the amount produced locally. Currently working towards community gardens and growing locally
Access to Healthy Food Health & Security Economy Ecosystems Governance Agriculture & Food
Compares household income and access to healthy food. Currently looking at means to improve access to healthy foods where necessary, i.e. food banks
Physical and Mental Health Infrastructure Systems Culture, Learning & Social. Development Health & Security Economy Ecosystems Built Environment Physical
Provides a direct measure of physical and mental health in the community and indirectly measures access to health food and physical activity. Currently working to develop additional indicators with Public Health professionals.
Montreal Montreal Bilan 2008 www.ville.montreal.qc.ca/developpementdurable The report used in this appendix addresses the year 2008 of the first sustainability plan 2007‐2009 for the city of Montreal, (the second is for 2010 to 2015). There are 4 priority areas of the plan:
• Improve the quality of air and reduce the emission of GHGs • Insure the best quality of life for all citizens • Practice responsible resource management • Adopt best practices of sustainability
As part of the process of evaluating success towards its goals the plan is monitored yearly and the results are reported. Thus this report presents the City’s progress towards its 2009 targets based on successes in 2007 and 2008. The hallmark of Montreal’s sustainability strategy is the commitment to continually monitoring and evaluating progress towards targets, and assessing the success of indicators, then adjusting accordingly. The table below summarizes the actions and indicators prioritized by the city and the progress in each in 2007 and 2008.
Action Indicator Notes Environment

46
Eliminate reliance on commercial vehicle use
Number of partners engaging in activities that eliminate reliance on commercial vehicles
Results available for 2007 and 2008
Reduce parking spaces in the centre
Number of outside parking stations eliminated in the Ville‐Marie Neighbourhood
Results available for 2007 and 2008
Minimize the circulation of cars around the Mont Royal
Number of pilot interventions in effect
Implementation began in 2008
Accumulation of infrastructure for bike use
Number of partners that install new supports for bicycles Number of new infrastructure Number of KMs of bike lanes
Results available for 2007 and 2008
Favour the development of carpooling
Number of local governments that implement measures favouring car pooling
Results available for 2007 and 2008
Implement measures that favour durable transportation at work places (public transport, car pooling, biking and walking)
Number of partners that adhere to ALLEGO Number of partners that follow ALLEGO Evolution of modes of transportation from home to work replacement of public transportation (COSTS)???
Results available for 2007 and 2008, work is being done on transportation from home and replacement of transportation.
Put into work measures that reduce GHG emissions
Number of projects that reduce GHG emissions through partnerships Number of partners in a plan for reducing GHG emissions Rate of reduction for GHG emissions
Results available for 2007 and 2008
Continue to go green in selection of materials
Number of partnerships with green material
Results available for 2007 and 2008
Implement a compensation mechanism for replacement to carbon neutral
Number of partners participating in carbon neutral program Number of replacements compensated Number of tones of CO2 reduced
Results available for 2007 and 2008
Multiply the points of contact with water
Number of new points of contact with water
In the process of being developed
Reduce the presence of urban heat islands
Number and amplification of projects to reduce urban heat Number of partners engaged in reducing the effects urban
In the process of being developed
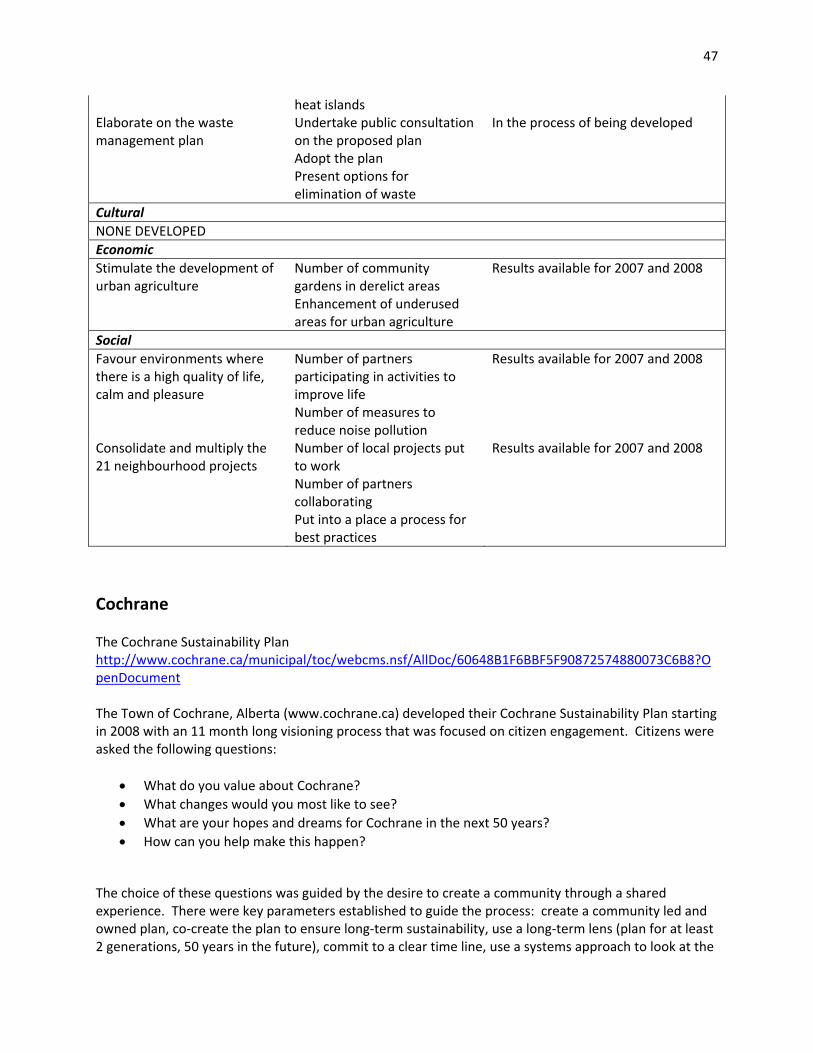
47
heat islands Elaborate on the waste management plan
Undertake public consultation on the proposed plan Adopt the plan Present options for elimination of waste
In the process of being developed
Cultural NONE DEVELOPED Economic Stimulate the development of urban agriculture
Number of community gardens in derelict areas Enhancement of underused areas for urban agriculture
Results available for 2007 and 2008
Social Favour environments where there is a high quality of life, calm and pleasure
Number of partners participating in activities to improve life Number of measures to reduce noise pollution
Results available for 2007 and 2008
Consolidate and multiply the 21 neighbourhood projects
Number of local projects put to work Number of partners collaborating Put into a place a process for best practices
Results available for 2007 and 2008
Cochrane The Cochrane Sustainability Plan http://www.cochrane.ca/municipal/toc/webcms.nsf/AllDoc/60648B1F6BBF5F90872574880073C6B8?OpenDocument The Town of Cochrane, Alberta (www.cochrane.ca) developed their Cochrane Sustainability Plan starting in 2008 with an 11 month long visioning process that was focused on citizen engagement. Citizens were asked the following questions:
• What do you value about Cochrane? • What changes would you most like to see? • What are your hopes and dreams for Cochrane in the next 50 years? • How can you help make this happen?
The choice of these questions was guided by the desire to create a community through a shared experience. There were key parameters established to guide the process: create a community led and owned plan, co‐create the plan to ensure long‐term sustainability, use a long‐term lens (plan for at least 2 generations, 50 years in the future), commit to a clear time line, use a systems approach to look at the
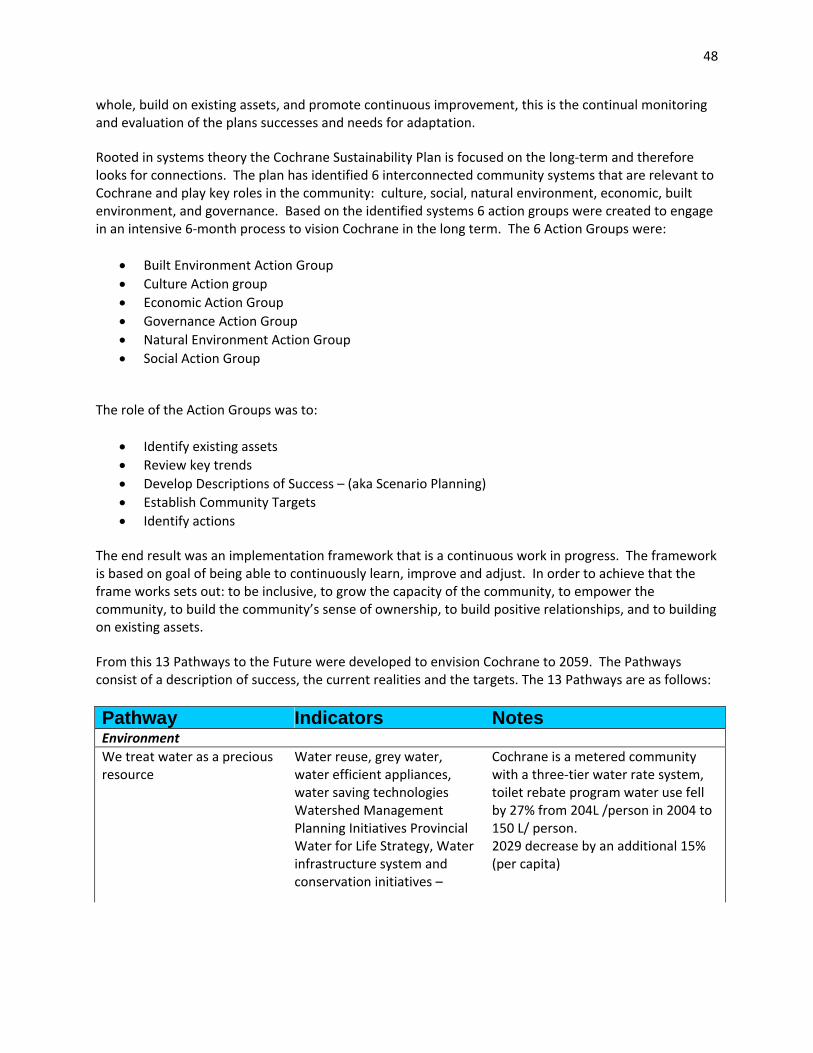
48
whole, build on existing assets, and promote continuous improvement, this is the continual monitoring and evaluation of the plans successes and needs for adaptation. Rooted in systems theory the Cochrane Sustainability Plan is focused on the long‐term and therefore looks for connections. The plan has identified 6 interconnected community systems that are relevant to Cochrane and play key roles in the community: culture, social, natural environment, economic, built environment, and governance. Based on the identified systems 6 action groups were created to engage in an intensive 6‐month process to vision Cochrane in the long term. The 6 Action Groups were:
• Built Environment Action Group • Culture Action group • Economic Action Group • Governance Action Group • Natural Environment Action Group • Social Action Group
The role of the Action Groups was to:
• Identify existing assets • Review key trends • Develop Descriptions of Success – (aka Scenario Planning) • Establish Community Targets • Identify actions
The end result was an implementation framework that is a continuous work in progress. The framework is based on goal of being able to continuously learn, improve and adjust. In order to achieve that the frame works sets out: to be inclusive, to grow the capacity of the community, to empower the community, to build the community’s sense of ownership, to build positive relationships, and to building on existing assets. From this 13 Pathways to the Future were developed to envision Cochrane to 2059. The Pathways consist of a description of success, the current realities and the targets. The 13 Pathways are as follows:
Pathway Indicators Notes Environment We treat water as a precious resource
Water reuse, grey water, water efficient appliances, water saving technologies Watershed Management Planning Initiatives Provincial Water for Life Strategy, Water infrastructure system and conservation initiatives –
Cochrane is a metered community with a three‐tier water rate system, toilet rebate program water use fell by 27% from 204L /person in 2004 to 150 L/ person. 2029 decrease by an additional 15% (per capita)
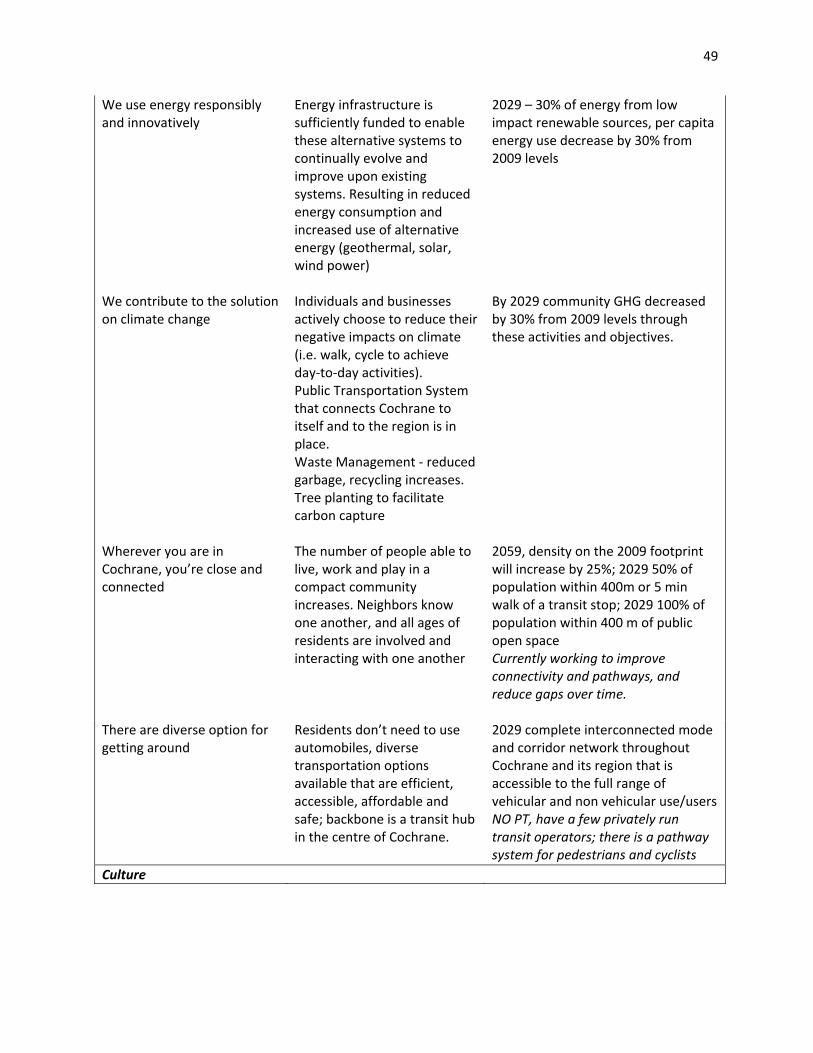
49
We use energy responsibly and innovatively
Energy infrastructure is sufficiently funded to enable these alternative systems to continually evolve and improve upon existing systems. Resulting in reduced energy consumption and increased use of alternative energy (geothermal, solar, wind power)
2029 – 30% of energy from low impact renewable sources, per capita energy use decrease by 30% from 2009 levels
We contribute to the solution on climate change
Individuals and businesses actively choose to reduce their negative impacts on climate (i.e. walk, cycle to achieve day‐to‐day activities). Public Transportation System that connects Cochrane to itself and to the region is in place. Waste Management ‐ reduced garbage, recycling increases. Tree planting to facilitate carbon capture
By 2029 community GHG decreased by 30% from 2009 levels through these activities and objectives.
Wherever you are in Cochrane, you’re close and connected
The number of people able to live, work and play in a compact community increases. Neighbors know one another, and all ages of residents are involved and interacting with one another
2059, density on the 2009 footprint will increase by 25%; 2029 50% of population within 400m or 5 min walk of a transit stop; 2029 100% of population within 400 m of public open space Currently working to improve connectivity and pathways, and reduce gaps over time.
There are diverse option for getting around
Residents don’t need to use automobiles, diverse transportation options available that are efficient, accessible, affordable and safe; backbone is a transit hub in the centre of Cochrane.
2029 complete interconnected mode and corridor network throughout Cochrane and its region that is accessible to the full range of vehicular and non vehicular use/users NO PT, have a few privately run transit operators; there is a pathway system for pedestrians and cyclists
Culture

50
We build Cochrane on the strengths of our natural and cultural heritage
Strong sense of community pride and identity: We honor our heritage, respect the land, protect and preserve our culture and history to sustain for future generations Proud of western and ranching heritage and natural landscapes
2020 natural areas and habitat are maintained or increased (no numbers given); Values of western heritage and meeting needs of currently reality of Agricultural sector reflected in development, planning and decision making processes
Everyone has an opportunity to purse their potential in Cochrane
People feel connected through a sense of pride and belonging and are inspired to purse their potential Arts, programs, supports and events, recreation, community meeting places, learning
2029 increase in the number of multi‐use facilities (no number given) 2029 the number of businesses in Cochrane across all sectors increases by 50%
We are a caring community that lives and celebrates together.
Increased community inclusion, everyone shares in the community’s past, its natural beauty, increased opportunities to get to know their neighbors and continued safety of the community. Maintained and improved quality of life by responding to requests of citizens
2019, every community represented by a community association. 2029 20% increase in attendance at all Cochrane events and celebrations 98% of residents currently say their quality of life is good, passionate about their town
Economy We consume the bounty of our local economy
Opportunities for work, play and a high quality of life are provided for all. Increase in residents shopping locally and using local goods and services whenever feasible
2029 – increase local food consumption and local goods & services by 50%
Our local economy is healthy and diverse
Economic Diversity – 2005 Cochrane Economic Base Analysis 36 companies; services offered diversify, tourism increases, housing options support employment base and grow the number of green businesses.
2029 – increase number of businesses across all sectors by 50%
Social

51
Everyone has a roof over their head
Balanced inventory of residential, non residential and open space fosters diversity in land use and supports affordable housing choices; Residents basic needs are met from affluent to young population, etc;
2029 a variety of tenure and housing types on the market (rental, own, rent‐to‐own, attainable housing) Housing challenges 2009 Cochrane Affordable Housing Needs Assessment Update, reports that housing affordability appears to be improving, but not for renters
There’s enough room for everything a community should have
Local food production, diversity of educational and career choices, transit options, land use is balanced; open space and natural systems support healthy ecosystems and are accessible to residents
2039, municipal tax revenues are 60% residential/40% non residential with 100% environmentally sensitive areas protected Land is expensive and underutilized; imbalanced; currently there are provincial and regional land use plans being developed to guide communities toward adequate planning for growth
We are a socially responsible and empowered community
2013 Voter turn out 50%, 2020 ‐ 65%, 2030 – 80%, 2019 increase participation in CSP by 500%, 2029 increase volunteer hours and charitable donations by 20%
Currently ‐ Voter turn out around 40% in 2007, 68% of the population volunteers, Food bank distributions are decreasing, Family and Community Support services Programs enrollment is high
Whistler – Whistler2020 Plan The Whislter2020 Plan http://www.whistler2020.ca/whistler/site/homepage.acds?instanceid=1930792&context=1930501 The Resort Municipality of Whistler embarked on the development of its ICSP in response to the demand for growth management. Moving from a small ski town to a resort community that has become a premier travel destination has placed significant demands on Whistler and demands from residents to guarantee the preservation of the natural environment. As a community that is limited in its capacity for growth developing an ICSP that would account for this was imperative the result was the development of a comprehensive community development plan (CDP) entitled Whister2020. Building upon Whistler 2002, Whistler2020 is a shared vision, strategic plan and process developed to guarantee the continued success of the community through to 2020. As it is a community plan the vision of Whistler2020 is to be what Whistler aspires to be, a community that meets the needs of both residents and visitors in a sustainable manner. The Municipality is unique as the economy is solely dependent upon tourism. Limiting the economy is a conscious choice tied to the branding of Whistler as a premier resort. Sustainable development must work within the confines of this economy and pay special attention to this demand. Whistler2020 is a demonstration of place‐based policy/planning in practice that respects

52
community identity and need. The plan was developed in 4 phases: 1. Development of factors for success 2. Exploration and assessment of 5 alternative futures related to sustainability 3. Crafting of a blended future draft strategic plan 4. Completion of draft plan named Whister2020 ‐ Moving Toward a Sustainable Future. The key take away point from the phases of development was the importance of public engagement in achieving success. The guiding forces behind the development of Whistler2020 were local values and the Natural Step Sustainability Objectives Guide for visioning, planning, decisions and actions. Visioning Whistler in 2020 focuses strategic plans and the actions necessary to achieve Whislter2020. There are 16 strategies linked to significant aspects related to the operation of the resort in particular there are five priority areas that have been identified. Community task forces for each strategy have been formed to define and describe success in 2020. Associated with each strategy are select indicators that measure the success of the strategies based on the descriptions. The interconnectivity between the priorities, strategies and indicators demonstrates the comprehensive nature of the plan and its roots in realism. Whistler2020 sets out to address the global and local challenges that have highlighted the increasing need for an ‘overarching sustainability‐based approach to long‐term planning’ in a systematic manner. The 16 strategies that have been identified in the Whister2020 plan and their indicators are as follows:
Category Indicators Notes Environment
2. Built Environment Dwelling density, development foot print, housing livability, services proximity, Whistler atmosphere
Total # of dwellings in a subdivision/total of all zoned developable areas; Sum the area of all zoned parcel layers and omit the following zones; Total the distance from each parcel to the nearest convenience service node, report average; "What is your level of satisfaction with your stay in Whistler as regards to the following: atmosphere and ambiance." – Scaled response
4. Energy Renewable energy, energy uses. Renewable fuel, greenhouse gas emissions, regional Air Quality
Sum all energy source inputs at the point of generation or use (thermal plant, hydro site, gas stove etc.); Sum all GHG emissions from energy sources input into the stationary energy system at the generation (thermal plant, gas stove etc.) phase and add emissions from fleet vehicles, transportation within Whistler and Whistler's solid waste; Total hours

53
where air quality was below good.
8. Materials and Solid Waste Land filled Waste, Material Use, Waste Diversion, Hazardous Materials
Total weight of all materials received at landfill; Sum weight of solid materials collected by waste service providers; Weight of all waste materials diverted from landfill/ total weight of waste material; weight of household hazardous materials collected in yellow stewardship bins/ total amount of hazardous waste estimated to be sent to the landfill
9. Natural Areas Sensitive Area Foot Print, Species at Risk, Development Foot print, Stream Health, Length of Roads
Total Ha changes to permanent wetlands, old growth and mature forests, forested floodplains and riparian ecosystems; count the number of Squamish District blue and red listed species
14. Transportation ‐ Local Transportation Satisfaction, commuting mode, visitor transport, transit proximity, Local air quality
Response to "Overall how satisfied are you with the transportation alternatives to private vehicles that are available in Whistler?"; "What mode of transportation do you tend to use most often to travel to and from work in Whistler?"
16. Water ‐ Water use, Drinking water quality, water effluent quality, Stream Health
Total water flows entering all RMOW water treatment plants and the flows used non‐potable uses; Determine the hours of reduced service due to infrastructure breaks and boil water advisories, and multiply the result by the number of dwellings affected; Count the number of days where at least one of the environmental measures is over the permitted license level
Culture 1. Arts, Culture and Heritage Culture participation, Culture
opportunities, Culture satisfaction
Number of activities participated in during visit; Responses to question: "How satisfied are you with the selection of arts, culture and heritage offerings in Whistler?" Count responses for 'somewhat' or 'very satisfied' then divide by the total number of responses;
11. Recreation and Leisure Recreation Opportunities, Recreation Participation, Recreation Satisfaction, Park
Response to “How satisfied are you with opportunities for physical recreation in Whistler?”; "How often

54
Availability, Injuries Treated
do you participate in physical recreation based activities on weekly basis?" sum the number more than 3 times per week/ total; "What is your level of satisfaction with your stay in Whistler as regards to the following: The Quality and Diversity of Activities?" 5‐point scale.
15. Visitor experience ‐ Whistler Atmosphere, Visitor Satisfaction, Intention to Recommend, Recreation Satisfaction, length of stay
Response to “Again, on a scale of 1 ‐ 5, what is your overall level of satisfaction with your stay at Whistler?”
Economic 3. Economic Business licenses, full‐time
employees, rooms sold, occupancy rate, visitor number
# Of new business licenses, renewed business licenses and closed business licenses; Employers were asked, "How many total employees, including management/owners, did your business have during the last winter season?" and "How many hours a week on average did each part‐time employee work?" Sum part‐time employees into full time equivalents and add to total number of full time employees; 75% of accommodations sampled for number of nights sold;
5. Finance Financial Reserves, Municipal Revenue Mix, Economic Dependency Ratio, Occupancy Rate
Sum of Reserves; Sum of various revenue streams, report on total and mix
12. Resident Affordability Cost to income, single living income, family living income, income below costs, housing affordability
Total cost of individual basket items vs. median income reported from previous year; Sum the various costs of a individual/family basket of goods, adjust to gross compensation required to afford that basket of goods, and divide by the number of full‐time paid work hours (2080);
Social 6. Health and Social Health status, Volunteer
Rates, Sense of Belonging, Length of Tenure, Resident Satisfaction
Responses to “Thinking of your physical, mental and social wellbeing, in general, how would you rate your health?”; "In the past 12 months did you do any unpaid voluntary work for any organization or group in Whistler? And on average how many hours per month?"# of those who volunteered at

55
least one hour per month/ total number of respondents; "How would you describe your sense of belonging to your local community, Whistler?"; "Approximately how many years have you [lived as a year round resident in Whistler (Permanent residents), come to stay in Whistler for a season (Seasonal residents), or owned property (Second homeowners)] in Whistler?"; "Overall how satisfied are you with Whistler as a place to live?" Count those ‘very satisfied’ and ‘somewhat satisfied’ ‐ Scaled
7. Learning Education attainment, learning opportunities, child development, decision input
Response to "What’s the highest level of education you have had the opportunity to complete?"; “How satisfied are you with your personal opportunities for formal learning through schools and colleges and other organizations with accredited courses in Whistler and in the Sea‐to‐Sky corridor?”; # of vulnerable Kindergartners/ total # of kindergartners.
10. Partnerships Information Quality, Decision Input, Voter Turnout, Decision Trust, Partnerships
Response to “Thinking about accuracy, timeliness and completeness of information that is provided about decisions being made in Whistler, are you very satisfied, somewhat satisfied, neither, somewhat dissatisfied, very dissatisfied with the quality of information?”; “How satisfied are you with the existing opportunities to provide your input into decision making in Whistler?” Scaled question; # of people who voted against those who are eligible to vote
13. Resident Housing Restricted housing, resident ownership, housing affordability, local workforce, restricted wait time
Number of dwellings with restrictive covenants; total housing costs/ gross family income; "How many of your total employees including management lived in Whistler during the past winter season?”; Number of years that waitlist applicants wait to receive an opportunity to purchase each unit type. Divide by the total number of potential purchasers for

56
each unit type during the period.
City of Fernie ‐ Fernie Liveability Report 2010 The Quality of Life Index and Liveability Project http://www.fernie.ca/siteengine/ActivePage.asp?PageID=345 Fernie’s annual liveability reports (the first was completed in 2009) are intended to build upon the Quality of Life Index, which is comprised of indicators most valued by the community. The 2010 Fernie Liveability Report is the most recent and was prepared by Halcrow Consulting Inc. The Quality of Life Index indicators are meant to measure progress towards achieving Fernie’s OCP Vision of a sustainable population who enjoys a quality of life that is planned and managed in a manner compatible with the surrounding natural environment. The Quality of Life Index was developed in partnership with the Fernie OCP Implementation Committee and representatives of the community. Two workshops were held in January and May 2010 to define what quality of life means to residents. As a result of this participatory process, the indicators included in the index are highly localized. The Liveability Report sets out performance results against the indicators listed in the index in order to track trends over time. The qualitative data included in the Liveability Report is based on a community survey, which was distributed to residents in both paper form and an online version. 133 complete surveys were received, a relatively low number, but does serve as a starting point for assessing resident attitudes. The City hopes to broaden the number of residents involved in the next survey and ensure continuing public participation in the current process to produce the 2011 Liveability Report.
Category Indicators Notes Environment
Accessibility and transport
Mode of travel for work trips
Availability of alternative transportation options
Types & frequency of transit services & access to travel options other than private car
Disabled access Availability & condition of sidewalks, proportion of the in‐town trail network which is universally accessible
Proportion of trail & sidewalk network which is regularly cleared by the City & community satisfaction with snow removal
Winter accessibility
Natural environment Fernie's development footprint
Total developed & currently developable area & protected areas (open spaces, parks, watershed protection areas, very low density resource conservation land)

57
Total amount of waste (liquid & solid) generated by Greater Fernie Area
# Of water advisory days, including water boil advisories
Total amount of potable water consumed
Quantity of greenhouse gasses emitted
Measured as the carbon dioxide equivalent (CO2e)
Production of local food From consultation it was found that citizens wanted to monitor consumption of locally sourced food (or within 100 miles) ‐ this data not currently available
Culture Sense of community & identity
Proportion of residents reporting engagement in cultural activities locally
*Data from community survey
Level of satisfaction with arts & cultural facilities
*Data from community survey
Economic Economic development
Diversity of the local economy Occupation of labour force by industry
Median income of residents Used as a substitute for average salary data which is not available for the city
# Of new business formations & change in the # of registered businesses
Proportion of residents who work in the city
Social Demographics Total # of people permanently
residing in the city
Population stability Proportion of the population (over 5 yrs old) who have lived in the same census sub‐division for the past 5 years
Housing Rate of occupied dwellings Proportion of dwellings occupied by Fernie residents relative to proportion of housing which is unoccupied, used as second homes or vacation properties
Diversity of housing options Housing tenure # Of renting households relative to the # of
homeowners Cost of housing relative to
residents' income

58
Ability to walk to amenities from home, evaluated through Walkscore
Walkscore is an online walkability assessmenttool http://www.walkscore.com/
Learning and wellness Secondary school pass rates Proportion of students graduating grade 12 & transitioning from grade to grade
Satisfaction with learning & education opportunities
*Data from community survey
Local availability of healthcare options
1. Total number of medical practitioners in Fernie
2. Total number of medical practitioners per capita
3. # Of unscheduled emergency department visits at Elk Valley Hospital
4. Average per capita # of visits outside the community required to access non‐specialist health care services
Recreation Variety and # of recreational facilities
Active, cultural, indoor/outdoor facilities
# Of people using recreational & sporting facilities
Data not currently available (Leisure Services working on the collection of data)
Level of resident satisfaction with existing facilities
*Data from community survey
Annual # of visitors to the city Additional Hotel Room Tax revenue (2% applied to the cost of hotel accommodation) provides indication of annual variations in # of overnight stays in registered Fernie visitor accommodation
Sense of community & identity
Proportion of residents who report volunteering & average monthly hours spent on volunteer activities
*Data from community survey
# Of residents who make donations & median donation value
Based on amounts claimed for tax credit on T1 income tax returns
Pride in community and sense of belonging
*Data from community survey
# Of reported incidents of serious crime for every 1,000 people for property and violent crime
Popsicle index Proportion of surveyed residents who consider that a child in Fernie could safely leave their home, walk to the nearest store to buy a popsicle and return home

59
Vernon The mission of the City of Vernon with its ICSP is: To preserve and enhance our unique environment and lifestyle on behalf of the people of Vernon through the provision of dynamic and accountable leadership and effective municipal services. Recognition that development plays a vital role in the future of any city, has led Vernon to ensure that council, staff and the community work together to achieve the long term goals and objectives of the community for a sustainable future. The city has decided to implement the Smart Growth Development Checklist to advance its sustainability objectives in its Plan Vernon ICSP:
• Efficient use of public funds – Mixed use development, density, reduction of demands for new roads and services, reduced maintenance costs
• Protect open space and natural areas – Prevent urban sprawl, environmental protection, • Place making – Foster culture that leads to a vibrant community life and celebrates history • Accessibility – Compact mixed used development that promotes public transportation, and
transportation choices. • Housing choice – expansion of housing choices that consider life stages and affordability issues • Shorter commutes and more transportation choices – reduce automobile dependency and
promote transportation options
Category Indicators Notes Economic Policy Gains for direct employment:
number of jobs, type and income.
Economic policy seeks to ensure “adequate, suitable land is available for commercial and light industrial and agricultural activities to provide expanded opportunities for employment and to strengthen the municipal tax base”.
Environmental Policy Built environment – Distance to bus stops, trails, greenways, cycling routes; supports for alternative transportation Natural Environment – Green space and the natural environment
Environmental Policy sets out: “To reinforce and enhance the recreational value of the natural environment while preserving environmentally‐sensitive natural areas, locations with outstanding vistas, and pine meadows, grasslands and wetlands. To participate in regional efforts to preserve and enhance water and air quality by establishing suitable standards”

60
Social Policy Housing in terms of price range, average prices per square foot, non market housing and rental housing
Social Policy entails the objectives: “To provide housing opportunities to meet the changing needs of residents with varying lifestyles and income levels at all stages of their lives. To provide community services, utilities and parks and recreational facilities within the financial means of the municipality. To continue working towards enhancing the social well‐being of residents, within the resources and jurisdiction of the City in a facilitative, encouraging and lobbying role.”
Metro Vancouver ‐ Metro Vancouver Sustainability Report 2009 Sustainable Region Initiative http://www.metrovancouver.org/ABOUT/SRI/Pages/default.aspx Metro Vancouver has been producing Regional Sustainability Reports since 2002 when the Sustainable Regional Initiative (SRI) was launched to formally place the concept of sustainability at the centre of the Region’s operating and planning frameworks. This focus has been maintained at the regional level since then and in 2008, the Board adopted a Sustainability Framework, which outlines the sustainability priorities for the organization. The 2009 Sustainability Report is broken down into 16 issue areas with accompanying indicators to assess progress towards becoming a sustainable region. The Sustainability Reports demonstrate strong leadership from a Metro Region in pushing for the integration of sustainability considerations in planning processes. The reports further assist municipalities to see where their responsibilities fit into the overarching SRI.
Category Indicators Notes Environment Drinking water Per capita water use during peak
summer period
Total coliform bacteria Measures quality of drinking water Total per capital water
consumption Annual litres delivered per day
Liquid waste Levels of surfactants or methylene blue active substances (MBAS) in effluent of Lions Gate WWTP

61
Wastewater treatment plant performance to expectations
Reduce biochemical oxygen demand (BOD) and total suspended solids (TSS) in wastewater effluent
Levels of PCBs and PBDEs in the Strait of Georgia
PCBs (polychlorinated biphenyls), PBDEs (flame retardants)
Net energy recovered from waste water treatment plants
Solid waste Annual total waste generated and recycled
% Of total waste landfilled and % of total waste diverted
Disposed: % waste to energy & % to landfill Diverted: % to composting, product stewardship, recycling
Annual amount of solid waste generated per capita
Annual net energy recovered from solid waste operations
% Waste disposal and recycling by sector
% Disposed waste & % recycled waste
Land use and transportation Area of urbanized land (ha) Housing completions in metro
van region by type Measures increase in multi‐storey residential buildings (helps densification)
Median commute distance in metro Vancouver (km)
Journey to work by mode split Tracks commuting choice Air quality Emissions of air contaminants Measures nitrogen oxides (NOX),
diesel particulate & fine particulate matter
Diesel particulate matter emissions by sector
Measures emissions from locomotives, motor vehicles, marine vessels, non‐road engines
Ambient air quality Measures levels of ozone, particulates, nitrogen dioxide & sulphur dioxide
Climate change % Of GHG emissions by sector Motor vehicles, buildings, cement plants, energy generation, landfills, misc, other point sources, aircraft, marine rail & non‐road equipment
Changes in annual mean sea level
Ecological health Water quality and habitat of streams within Metro Vancouver
Measures affect of storm runoff in urban areas & agricultural operations
Changes in the conservation status of species in the region
Data from BC's Conservation Data Centre

62
% Of wetlands with high levels of protection
% Area of tree canopy Agriculture Variety of agricultural products Total land farmed & average
farm size (ha)
Gross annual farm receipts Gross receipts = before expenses related to farming are deducted
Age of farmers Indicator of viability of farming (if young people are entering the sector)
Energy Inventory of energy used by source type (tera joules)
Non‐renewable (gasoline, natural gas, diesel) & renewable (electricity)
Total energy used (tera joules) Non‐industrial per capita energy
use (giga joules)
Culture Arts & Culture # Of cultural facilities in
municipalities with populations of 75,000+
Performing arts/theatres, art gallery/visual arts, multi‐discipline/arts centres, studio/rehearsal, heritage (including museums), library branches
Total # of people employed in cultural sector & % of labour force employed in cultural sector
Economic Financial management Cost impact per "average
household" for liquid waste services
Cost impact per "average household" for solid waste services
Cost impact per "average household" for drinking water
Cost impact per "average household" for other regional services
Total regional expenditures as a % of median household income in region
Gives perspective on affordability of services
Economy Annual percentage growth in employment
Unemployment rate Median income Educational attainment of
population, age 25‐66
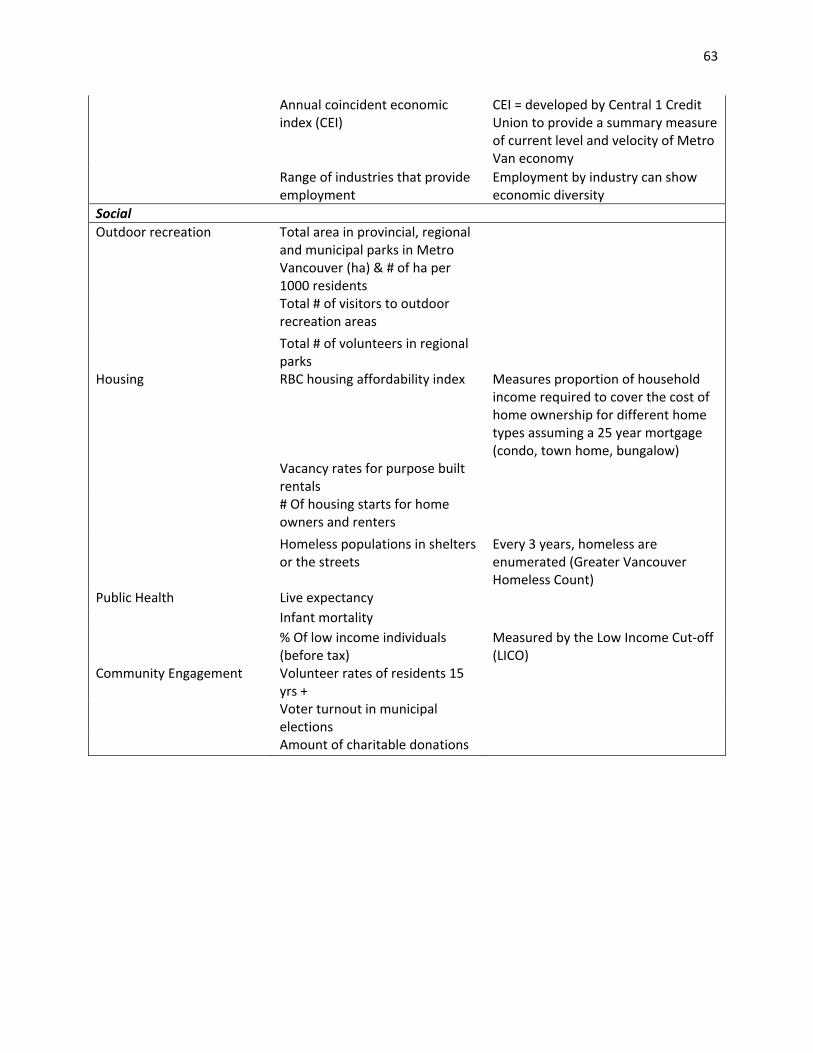
63
Annual coincident economic index (CEI)
CEI = developed by Central 1 Credit Union to provide a summary measure of current level and velocity of Metro Van economy
Range of industries that provide employment
Employment by industry can show economic diversity
Social Outdoor recreation Total area in provincial, regional
and municipal parks in Metro Vancouver (ha) & # of ha per 1000 residents
Total # of visitors to outdoor recreation areas
Total # of volunteers in regional parks
Housing RBC housing affordability index Measures proportion of household income required to cover the cost of home ownership for different home types assuming a 25 year mortgage (condo, town home, bungalow)
Vacancy rates for purpose built rentals
# Of housing starts for home owners and renters
Homeless populations in shelters or the streets
Every 3 years, homeless are enumerated (Greater Vancouver Homeless Count)
Public Health Live expectancy Infant mortality % Of low income individuals
(before tax) Measured by the Low Income Cut‐off (LICO)
Community Engagement Volunteer rates of residents 15 yrs +
Voter turnout in municipal elections
Amount of charitable donations

64
APPENDIX B ‐ Indicator Example The Canadian Environmental Standards Indicators were presented briefly in the main body of the paper. What follows here is an example of CESI indicator. The indicator selected is Air Quality. The example begins with a description of the indicators, how they are used, how they are calculated and describe the limitations of the indicator. 2.1 Description of the air quality indicators Poor air quality has significant negative effects on the natural environment, human health, and economic and biological productivity. The CESI air quality indicators track ground‐level ozone and fine particulate matter (PM2.5) concentrations. These pollutants are key components of smog and are two of the most widespread air pollutants to which people are exposed. The air quality indicators are population‐weighted estimates based on warm‐season (April 1 to September 30) average concentrations of ground‐level ozone and PM2.5. The ground‐level ozone exposure indicator is based on the highest 8‐hour daily average concentrations, while the PM2.5 exposure indicator is based on the 24‐hour average daily concentration. The CESI air quality indicators have been designed to approximate human population exposure to ground‐level ozone and PM2.5 over time. They are intended as a general indicator to alert policy analysts and decision‐makers as to whether progress towards improved air quality is being made or if problems persist. Other methods exist to measure ground‐level ozone and PM2.5 concentrations, often with different purposes in mind and often providing different results. For example, the Canada‐wide Standard (CWS) for ozone, based on the three‐year average of the annual fourth highest daily maximum eight‐hour concentration, is focused on reflecting the effects of acute (short‐term) exposure to peak air pollution. 2.2 How the air quality indicators are used The CESI initiative aims to provide Canadians with regular and reliable information on the state of Canada’s environment and the related impact of human activities. The CESI air quality indicators, ground‐level ozone and PM2.5, are intended as state/condition indicators to inform policy analysts, decision makers and the public as to whether progress is being made towards improved air quality. 2.3 How the air quality indicators are calculated Ground‐level ozone Calculating the daily maximum 8‐hour average concentration There are 24 consecutive 8‐hour averages (8‐hour rolls) that can be possibly calculated for each day. The daily maximum 8‐hour average concentration for a given day is the highest of the 24 possible 8‐hour averages computed for that day. See Table 1 for an illustration of the 8‐hour averages.
65
Calculating the warm‐season average value The warm‐season average value for a given ground‐level ozone monitor is the average of the highest daily maximum 8‐hour average concentrations during the period from April 1 to September 30. Fine particulate matter (PM2.5) Calculating the 24‐hour average concentration The PM2.5 indicator is calculated the same way as the ground‐level ozone exposure indicator, but uses a single roll, or 24‐hour average concentration. A daily value for PM2.5 refers to the 24‐hour average concentration of PM2.5 measured from midnight to midnight. Calculating the warm‐season average value The warm‐season average value for a given PM2.5 monitor is the average of the 24‐hour average daily concentrations during the period from April 1 to September 30. 2.3.1 Daily Averages Since some adverse health effects of air pollution (e.g., cardiovascular and respiratory effects) are observed even at low levels of exposure, especially for ground‐level ozone and PM2.5, the calculation of each respective air indicator is based on daily relative average concentrations rather than on daily peak concentrations. Over the course of the warm season, peak concentrations are rather sporadic, while daily average concentrations are relatively more common and hence a better measure of exposure. 2.3.2 Time Period The air quality indicators consider daily ground‐level ozone and PM2.5concentrations during the warm season (April 1–September 30), which is also the period when Canadians are most active outdoors (Leech et al. 2002). These months tend to have meteorological conditions that favour the formation of ground‐level ozone. While fine particulate matter is a concern in winter, current monitoring methods present challenges with instrument variability in cold weather. Omitting this portion of the data also allows for better comparability with the ground‐level ozone data. Warm‐season PM2.5 data are, therefore, used in this release of CESI Air Quality and Emissions Indicators. 2.3.3 Population Weighting In this release of CESI, the air quality indicators were calculated using a population‐weighted approach, weighting annual warm‐season average values of monitoring stations across Canada. Monitoring stations are scattered from coast to coast, in different areas with different populations. Therefore, proportionally adjusting air pollution levels measured at a monitoring site based on the size of the population residing near the station provides a surrogate estimate of exposure to ground‐level ozone and PM2.5.[1] An annual population‐weighted concentration level was calculated for each year by estimating the number of people living within a 40‐km radius of each monitoring station, hence assigning each monitoring station a weight relative to its population. The population‐weighted concentration level for each year (Eyear) is calculated by multiplying the population (P) of a monitoring station by the average
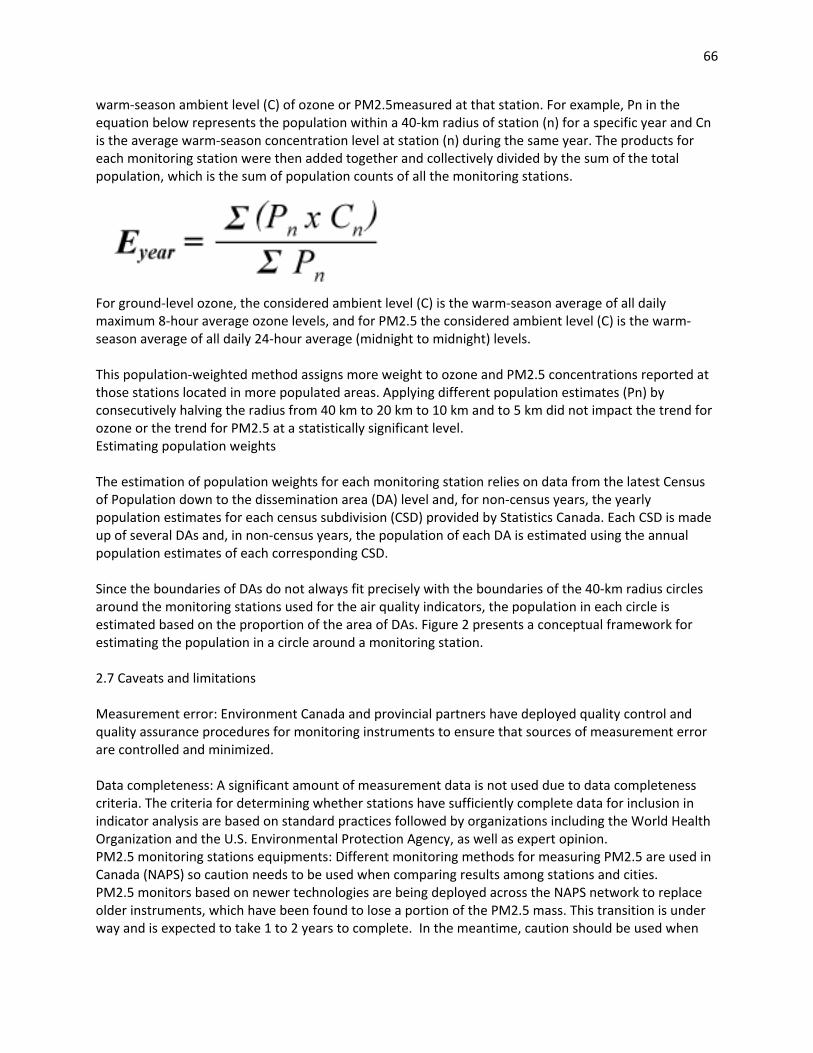
66
warm‐season ambient level (C) of ozone or PM2.5measured at that station. For example, Pn in the equation below represents the population within a 40‐km radius of station (n) for a specific year and Cn is the average warm‐season concentration level at station (n) during the same year. The products for each monitoring station were then added together and collectively divided by the sum of the total population, which is the sum of population counts of all the monitoring stations.
For ground‐level ozone, the considered ambient level (C) is the warm‐season average of all daily maximum 8‐hour average ozone levels, and for PM2.5 the considered ambient level (C) is the warm‐season average of all daily 24‐hour average (midnight to midnight) levels. This population‐weighted method assigns more weight to ozone and PM2.5 concentrations reported at those stations located in more populated areas. Applying different population estimates (Pn) by consecutively halving the radius from 40 km to 20 km to 10 km and to 5 km did not impact the trend for ozone or the trend for PM2.5 at a statistically significant level. Estimating population weights The estimation of population weights for each monitoring station relies on data from the latest Census of Population down to the dissemination area (DA) level and, for non‐census years, the yearly population estimates for each census subdivision (CSD) provided by Statistics Canada. Each CSD is made up of several DAs and, in non‐census years, the population of each DA is estimated using the annual population estimates of each corresponding CSD. Since the boundaries of DAs do not always fit precisely with the boundaries of the 40‐km radius circles around the monitoring stations used for the air quality indicators, the population in each circle is estimated based on the proportion of the area of DAs. Figure 2 presents a conceptual framework for estimating the population in a circle around a monitoring station. 2.7 Caveats and limitations Measurement error: Environment Canada and provincial partners have deployed quality control and quality assurance procedures for monitoring instruments to ensure that sources of measurement error are controlled and minimized. Data completeness: A significant amount of measurement data is not used due to data completeness criteria. The criteria for determining whether stations have sufficiently complete data for inclusion in indicator analysis are based on standard practices followed by organizations including the World Health Organization and the U.S. Environmental Protection Agency, as well as expert opinion. PM2.5 monitoring stations equipments: Different monitoring methods for measuring PM2.5 are used in Canada (NAPS) so caution needs to be used when comparing results among stations and cities. PM2.5 monitors based on newer technologies are being deployed across the NAPS network to replace older instruments, which have been found to lose a portion of the PM2.5 mass. This transition is under way and is expected to take 1 to 2 years to complete. In the meantime, caution should be used when

67
interpreting PM2.5 levels and trends, as measurements from these newer methods may not be directly comparable with data from the older instruments. Regional groupings: The definitions of the regions used for reporting are not the same as those used in the 2006 and earlier releases of CESI. Accordingly, the “Quebec and eastern Ontario” region as presented in the earlier reports has been changed to include stations that are only in southern Quebec. Consequently, the “snapshot” indicator levels (i.e., yearly values) for all regions can only be compared to the last two previous releases of CESI’s air quality indicators to do analysis that incorporates trends and spatial patterns. However, the trend indicators themselves (i.e., national and regional trends) are generally comparable regardless of minor adjustments in regional boundaries. Population weighting: The population weighting method used in CESI assumes uniform concentrations of ground‐level ozone and PM2.5 within relatively arbitrary zones. These uniform concentrations therefore do not factor prevailing winds and the location of major emissions sources. International comparison: Although efforts were made to limit the amount of data inconsistencies between international cities, caveats and limitations can still be found in each country’s monitoring methods, instrument operations and station siting procedures; therefore, comparisons among international cities should not be viewed as a definitive ranking. Rather, they should be viewed as an approximation. A valid annual mean required at least 6570 hourly readings. In addition, the second and third quarters of the year should have 75% valid data for ozone, whereas for PM2.5, each quarter of the year should have 75% valid data. For the international cities comparison, population city size and the availability of data were city selection criteria. Also, because an annual air quality definition was used, it may be that the impact of weather is more important than if a three years average, like the Canada Wide Standard (CWS) definition, were used. No other selection criteria were used for this comparison Caution needs to be exercised when comparing Canadian cities. As an example, a comparison of PM2.5 concentrations for Montreal and Toronto using data from our reference samplers reveals that levels are almost identical. However, because different monitoring methods were used for measuring PM2.5 in 2008 for the two cities, it appears that Montreal has a much higher annual concentration, which may not actually be the case. Source: http://www.ec.gc.ca/indicateurs‐indicators/