monitoring enzyme catalytic reactions supporting ... · monitoring enzyme catalytic reactions ......
TRANSCRIPT

Supporting Information for
Multi-doped carbon dots with ratiometric pH sensing property for
monitoring enzyme catalytic reactions
Ya Wang,a Linlin Lu,a Hui Peng,b Jie Xu,a Fengyang Wang,a Ruijuan Qi,b Zhiai Xu,*,a Wen Zhang*,a
a School of Chemistry and Molecular Engineering, East China Normal University, Shanghai 200241, P.R. China.
b Key Laboratory of Polarized Materials and Devices, Ministry of Education, East China Normal University, Shanghai 200241, P.R. China.
* Corresponding author, E-mail: [email protected]; [email protected]. Tel: +86-21-5434-0053
Electronic Supplementary Material (ESI) for ChemComm.This journal is © The Royal Society of Chemistry 2016

Experimental Section
Materials. 3-Aminophenylboronic acid hydrochloride (3-APBA),4-carboxyphenylboronic
acid, glucose oxidase (GOx), acetylcholinesterase (AChE), urease and acetylthiocholine (ATCh)
were purchased from Sigma-Aldrich China (Shanghai, China). 4-Mercaptophenylboronic acid, 3-
carboxyphenylboronic acid and phenylboronic acid were obtained from J&K Chemicals (Beijing,
China). Ethanol, acetic acid, sodium acetate, boric acid, phosphoric acid, glucose, urea, NaOH and
phenylamine were obtained from Sinopharm Group Chemical Reagent Co., Ltd. (Shanghai,
China). All the chemicals were used as received without further purification. MilliQ water (18.2
MΩ·cm) was used throughout the experiment.
Instruments and Measurements. Absorption spectra were measured with a Cary 60 UV–vis
spectrophotometer (Agilent Technologies, Palo Alto, CA, USA). Fluorescence spectra were
measured with a Cary Eclipse spectrofluorophotometer (Agilent Technologies, Palo Alto, CA,
USA) at room temperature. Fourier transform infrared (FTIR) spectra were measured with a
Thermo Nicolet 380 FTIR spectrometer (Thermo Nicolet Co., USA). X-ray photoelectron
spectroscopy (XPS) measurements were performed on ESCALab 220-Xi (VG, UK). Raman
spectra were recorded with a Renishaw InVia micro-Raman (Renishaw, UK) with excitation
wavelength of 532 nm. Transmission electron spectroscopy (TEM) images were collected with
JEM-2100F microscopy (JEOL Ltd., Tokyo, Japan).
Synthesis of the multi-doped C-dots. Typically, 0.1 g of 3-aminophenylboronic acid was
dissolved in 50 mL of ethanol to form a clear solution. Then the solution was transferred to the
Teflon-lined autoclave chamber and heat to 180 °C for 12 h. After cooling to room temperature,
the C-dots-containing solution was centrifuged at 10 000 rpm for 10 min to remove large
aggregates. The resulting C-dots in the supernatant were then purified by using silica column
chromatography with a mixture of methanol and methylene chloride as the eluent. The purified C-
dots were redispersed in ethanol for optical measurements or in the mixture of the buffer and
ethanol (10 vol%) for pH sensing.
Silica column chromatography. Firstly, a thin layer chromatography (TLC) experiment was
carried out to optimize the eluents. Silica gel (300−400 mesh) was used as the stationary phase for
the column chromatography. A gradient of CH2Cl2 and methanol at a volume ratio of 16/1 to 10/1
was used as the eluent. The purity of each fraction was verified by using TLC measurement. The

solvents were evaporated and the products were redissolved in ethanol. Finally, three different
fractions of 3-APBA-based C-dots were obtained, and the third fraction showing three dominant
fluorescence emissions was used for pH sensing.
The C-dots synthesized with 4-carboxyphenylboronic acid, 4-mercaptophenylboronic acid, 3-
carboxyphenylboronic acid, phenylboronic acid or phenylamine was all purified by using silica
column chromatography as described above.
Glucose, ATCh and urea sensing with the C-dots. To demonstrate the potential of the C-dots
for glucose, ATCh and urea sensing, the concentrations of GOx, AChE and urease were fixed at
1.0, 0.5 and 0.5 mg/mL, respectively. Upon addition of the substrates, the mixtures were incubated
at 37C (25C for urease) for 1 h to complete the catalytic reactions. Afterwards, the C-dots were
added as the fluorescence probe.

Fig. S1 Raman spectra of the C-dots prepared based on 3-APBA.

Fig. S2 (A) TLC examination of the three fractions of the 3-APBA-based C-dots purified with a
silica chromatography. (B-D) The fluorescence spectra of (B) the 1st fraction, (C) 2nd fraction; (D)
3rd fraction.
Fig. S3 FTIR spectra of the C-dots synthesized with 3-APBA.

Fig. S4 The absorbance (A) and excitation-dependent fluorescence spectra (B-F) of the C-dots
prepared with (B) 4-carboxyphenylboronic acid, (C) 4-mercaptophenylboronic acid, (D) 3-
carboxyphenylboronic acid, (E) phenylboronic acid or (F) phenylamine. All the C-dots were
synthesized in the Teflon-lined autoclave chamber at 180 °C for 12 h. These C-dots displayed
excitation-dependent emission and the intensities decrease rapidly with the red-shift of the
excitation wavelength.

Fig. S5 XPS analysis of the purified C-dots prepared with 4-carboxyphenylboronic acid, 4-
mercaptophenylboronic acid, 3-carboxyphenylboronic acid, phenylboronic acid or phenylamine.
Fig. S6 FTIR spectra of the purified C-dots prepared with 4-carboxyphenylboronic acid, 4-mercaptophenylboronic acid, 3-carboxyphenylboronic acid, phenylboronic acid or phenylamine.

Table S1 Elemental contents of the C-dots determined by XPS measurement.
C-dots from various raw materials C (%) O (%) N (%) B (%) S (%)3-APBA-3rd 77.4 20.1 1.8 0.74-Carboxyphenylboronic acid 73.7 25.1 1.24-Mercaptophenylboronic acid 81.2 13.6 3.2 2.13-Carboxyphenylboronic acid 82.9 14.6 2.4Phenylboronic acid 83.9 15.0 1.2Phenylamine 87.8 11.7 0.5
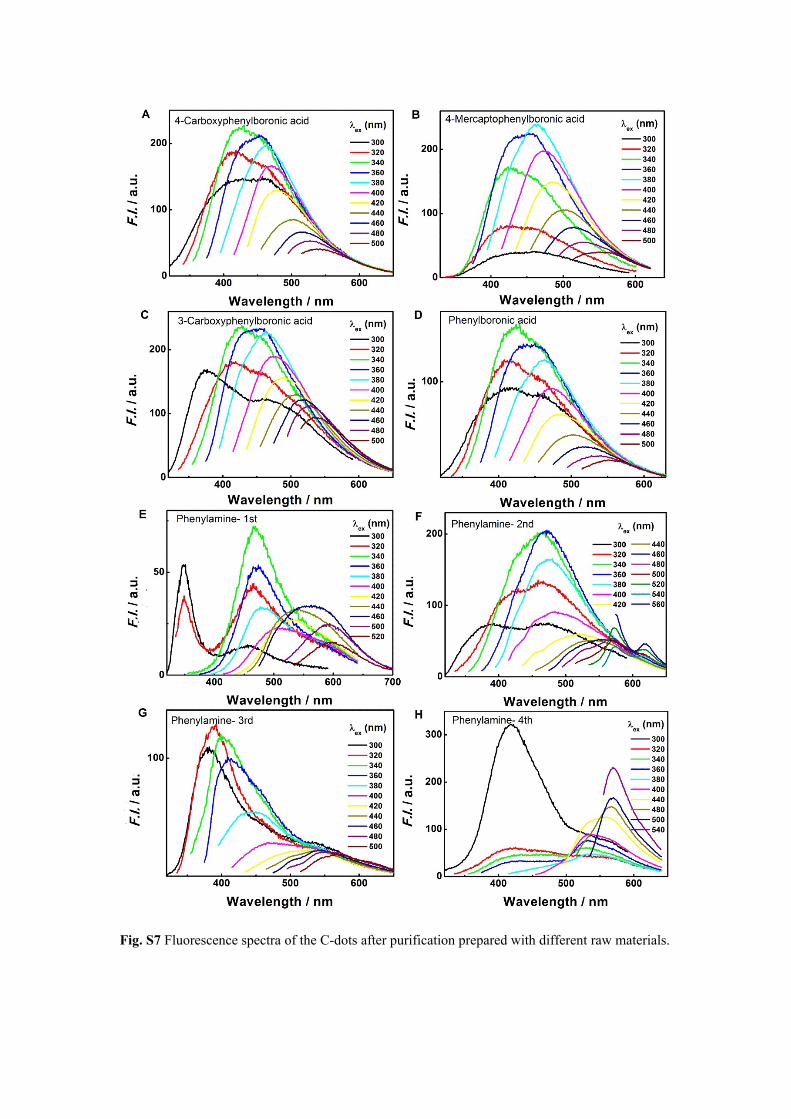
Fig. S7 Fluorescence spectra of the C-dots after purification prepared with different raw materials.

Fig. S8 Plots of F390/F495 versus pH in B-R buffer.
Fig. S9 The influence of buffer pH on the fluorescence spectra of the C-dots synthesized with (A)
phenylamine and (B) phenylboronic acid, respectively.
With pH increase, the emission intensity of the C-dots prepared with phenylamine decreases
firstly and then increases, which is thought to be caused by the deprotonation of the functional
groups related to nitrogen. The results agree with the response of the 495 nm emission to pH in
case of the C-dots synthesized with 3-APBA. The slight difference of the pH turn point of the
emission decrease to increase is probably attributed to the discrepancy of the N-doping contents in
two kinds of C-dots. As for the C-dots synthesized with phenylboronic acid, the fluorescence
intensity increases with pH increase and then becomes stable. Elemental boron is electron-
deficient. With pH increase, the dissociation of the functional groups correlated with B is
influenced, leading to the corresponding variation of fluorescence emission. This is in line with
the response of the 390 nm emission to pH in case of the C-dots synthesized with 3-APBA. The
simultaneous doping of N and B endows the C-dots with unique fluorescence performance.
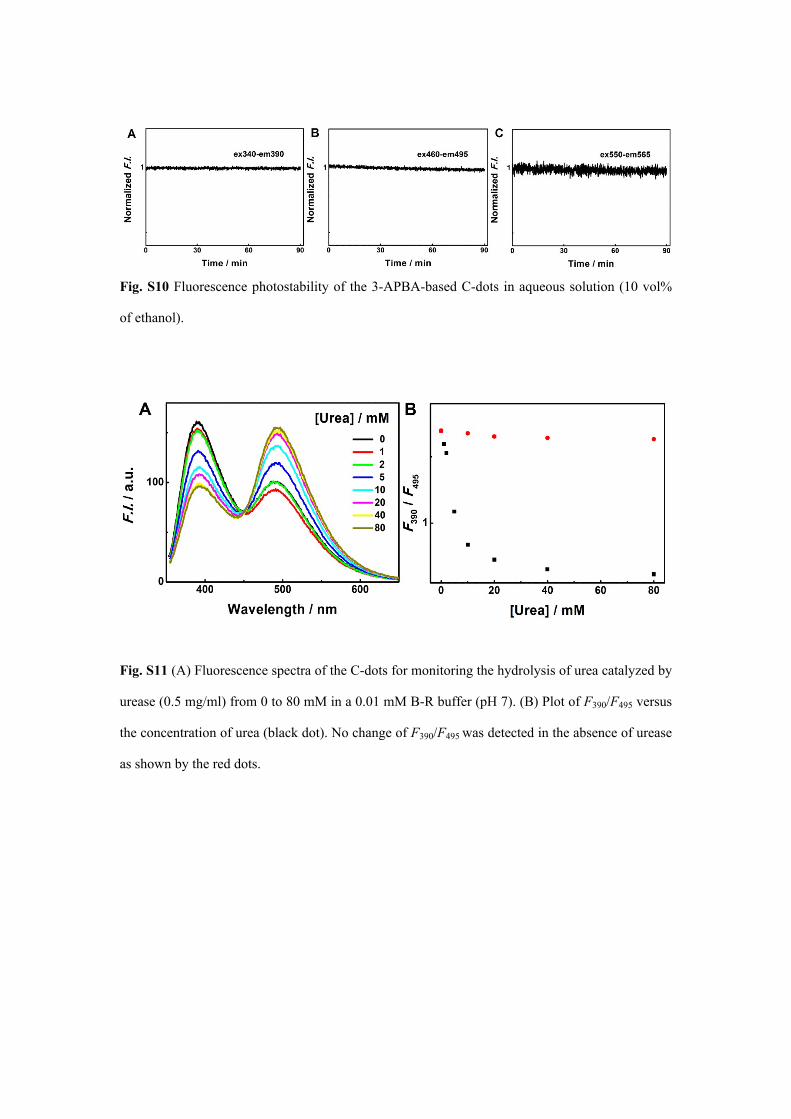
Fig. S10 Fluorescence photostability of the 3-APBA-based C-dots in aqueous solution (10 vol%
of ethanol).
Fig. S11 (A) Fluorescence spectra of the C-dots for monitoring the hydrolysis of urea catalyzed by
urease (0.5 mg/ml) from 0 to 80 mM in a 0.01 mM B-R buffer (pH 7). (B) Plot of F390/F495 versus
the concentration of urea (black dot). No change of F390/F495 was detected in the absence of urease
as shown by the red dots.