monitoring emulsion homopolymerization reactions …
TRANSCRIPT
ISSN 0104-6632 Printed in Brazil
www.abeq.org.br/bjche Vol. 22, No. 01, pp. 61 - 74, January - March, 2005
*To whom correspondence should be addressed
Brazilian Journal of Chemical Engineering
MONITORING EMULSION HOMOPOLYMERIZATION REACTIONS
USING FT-RAMAN SPECTROSCOPY
M. M. Reis, M. Uliana, C. Sayer, P. H. H. Araújo and R. Giudici*
Universidade de São Paulo, Escola Politécnica, Departamento de Engenharia Química, 05508-900 –SP, Phone: (11) 3091-2246, Fax: (11) 3813-2380, São Paulo - SP, Brazil.
E-mail: [email protected]
(Received: April 5, 2003 ; Accepted: August 19, 2004)
Abstract - The present work describes a methodology for estimation of monomer concentration during homopolymerization reactions by Raman spectroscopy. The estimation is done using linear models based on two different approaches: a univariate approach and a multivariate approach (with principal component regression, PCR, or partial least squares regression, PLS). The linear models are fitted with data from spectra collected from synthetic samples, i.e., samples prepared by dispersing a known concentration of monomer in polymer emulsions. Homopolymerizations of butyl acrylate and of vinyl acetate were monitored by collecting samples from the reactor, and results show that the methodology is efficient for the model fitting and that Raman spectroscopy is a promising technique for on-line monitoring of the emulsion polymerization process. Keywords: Polymerization process monitoring; FT-Raman spectroscopy; Multivariate linear models; Partial least squares regression.
INTRODUCTION
Emulsion polymerization has a wide range of
industrial applications, ranging from concrete additives to drug delivery systems (van den Brink et al., 2001), and is based on the principle of conversion of a dispersion of monomer(s) in an aqueous medium into a stable dispersion of polymer particles by free-radical polymerization (Kiparissides, 1996). The end-use properties of polymer emulsions depend on polymer structure, which in turn depends on the reaction conditions of polymer synthesis; thus, the control of emulsion processes has received a lot of attention in the last decades. In this context, the development of sensors for on-line monitoring of polymerization reactors to measure monomer and polymer concentrations as well as polymer quality-related variables, has become a challenging area in process engineering (Chien and Penlidis, 1990; Kammona et al., 1996).
Analytical spectroscopic techniques based on fiber optics have been developed, allowing sophisticated spectroscopic process measurements to be made in otherwise inaccessible environments. Raman spectroscopy, an established technique for analysis of polymers on a laboratory scale, has become a promising option for polymer process monitoring (Al-Khanbashi et al., 1996; van den Brink, 2000; Özpozan et al., 1997). For monitoring applications in emulsion polymerization processes, Raman spectroscopy offers the additional advantages of weak Raman scattering of water and strong scattering of vinyl bands, common in most of the monomers used in emulsion polymerization (Laserna, 1996; Hendra et al., 1991).
Besides the development of these instruments, process monitoring by spectroscopic techniques requires the development of calibration models to correlate the sensor measurements with the desired properties. In this case, process variability, i.e.,

62 M. M. Reis, M. Uliana, C. Sayer, P. H. H. Araújo and R. Giudici
Brazilian Journal of Chemical Engineering
variation in temperature, heterogeneous medium, difference in particle size, etc., presents a major problem to be addressed. Emulsion polymerization occurs in a heterogeneous medium (swollen polymer particles, aqueous phase, monomer droplets, micelles) that undergoes significant changes during the process; consequently, the model must be fitted with Raman spectra that reflect the same behavior as that found during the polymerization process. These spectra can basically be obtained in two ways: by collecting spectra from samples taken during the reaction process, and quantifying the monomer concentration by a reference method or by mimicking the behavior of the process with synthetic samples. The first way, using samples from reactions, usually produces good results, but this may not the best way to monitor reactions since during each reaction unexpected changes may take place and a model fitted for one reaction would not be able to predict another. The second way, mimicking the behavior of the reaction, may be more attractive because it is possible to produce several models without performing reactions, and additionally it is possible to ensure that all variation in the study is due to a desired property. Although the second way is more attractive, it is difficult and sometimes impossible to mimic all the stages of the reaction, especially when there are monomer droplets in the reaction medium.
The objective of this work is to discuss the calibration model fitting for the monitoring of emulsion polymerization and to describe the potential of Raman spectroscopy for monitoring vinyl acetate and butyl acrylate emulsion polymerization reactions. Two types of models are tested, the univariate linear model and the multivariate linear model. In both cases, synthetic samples are used in the model calibration step. A test simulating a loss of laser signal (which would occur when a probe is used to collect the spectra) was also conducted; in this case, the spectra for synthetic samples, used in the model fitting, were obtained with a laser power of 510mW and the spectra from samples collected during a reaction were obtained with a laser power of 450mW. The spectra were collected within a short acquisition time (15 seconds), resulting in a reduction in the signal-to-noise ratio. The short acquisition time is very important for on-line monitoring since the reaction medium may change very fast. By the end, three reactions were monitored on-line (with samples collected from the reaction) by Raman spectroscopy under realistic experimental
conditions and a methodology for model fitting is suggested.
EMULSION POLYMERIZATION
A typical emulsion polymerization recipe includes the dispersing medium (water), monomer(s), a water-soluble initiator, and an emulsifier. The reaction consists in the conversion of a dispersion of monomer(s) in water into a stable dispersion of polymer particles by free-radical polymerization. As the reaction takes place a very small amount of monomer is found in solution, some is solubilized by micelles, but most remains in the monomer droplets. Polymerization does not occur in the monomer droplets but mainly inside the micelles, forming (nucleating) new polymer particles swollen with monomer (Kiparissides, 1996). With the consumption of monomer and emulsifier by the swollen polymer particles, the micelles and monomer droplets eventually disappear from the reaction medium. Reaction proceeds with monomer-swollen polymer particles until all of the monomer has been consumed. The overall reaction can be divided into three stages. In the first stage, most of the monomer is found in monomers droplets and micelles; in the second stage, polymer particles are present and monomer is found in monomer droplets and in polymer particles; and finally at the end of the reaction, there are polymer particles dispersed in the medium and residual monomer is found in the swollen polymer particles.
FT-RAMAN SPECTROSCOPY
Raman spectroscopy is a light-scattering-based technique. The light (radiation) scattering can be elastic, without changes in the energy of the scattered light, or inelastic, with loss or gain of energy. Elastic scattering is known as Rayleigh scattering and inelastic, as Raman scattering. The classical theory of light scattered by molecules describes the molecule-radiation interaction by means of the oscillating dipole moment induced in the molecule by an incident radiation field. The Raman measurements discussed here are obtained by means of Fourier-transform Raman spectroscopy, FT-Raman (Laserna, 1996; Hendra et al., 1991).
For isotropic samples, such as a liquid, the Raman intensity can be written in terms of the mean polarizability and the anisotropy. In general terms,

Monitoring Emulsion Homopolymerization Reactions 63
Brazilian Journal of Chemical Engineering Vol. 22, No. 01, pp. 61 - 74, January - March, 2005
the intensities of Raman bands can be expressed in an equation analogous to the Beer-Lambert law, as given by Equation 1.
0I cI VKν ν= (1) where Iν is the Raman intensity for the band of wavelength ν, I0 is the intensity of the exciting radiation, V is the volume of sample illuminated by the source and viewed by the spectrometer, c is the sample concentration, and Kν is a constant characteristic for each band.
RAMAN SPECTRA OF THE MONOMERS
In this work linear models are developed for the monitoring of vinyl acetate and butyl acrylate semicontinuous emulsion homopolymerization. Figure 1 shows the Raman spectra of the pure monomers.
FT Raman is an appealing method for monitoring the polymerization of these monomers because C=C bond is a strong scattering group (van den Brink et al., 2001; Ellis et al., 1990) and the bands related to C=C stretching decrease during the reaction as illustrated in Figure 2.
Figure 1: Raman Spectra of vinyl acetate and butyl acrylate. At the top: the spectral region between
400 and 4000 cm-1; on the bottom: the bands due to C=C stretching (1637 and 1649 cm-1) and C=O stretching (1726 and 1760 cm-1).
(a) (b)
Figure 2: (a) Monomers, (b) general polymerization reaction based on vinyl groups.
64 M. M. Reis, M. Uliana, C. Sayer, P. H. H. Araújo and R. Giudici
Brazilian Journal of Chemical Engineering
LINEAR REGRESSION MODELS Raman Scattering Intensity Versus Monomer Concentration
Equation 1 shows that the intensity of Raman
scattering at wavelength ν1 is linear to the concentration of the active compound, as given, for example, for sample i of compound A at concentration cA,i as shown by Equation 2.
1 1,A,i A,i ,AI cυ υ= φ (2) where
1 1,A 0 ,AI VKν νφ = , corresponding to Equation 1.
The simplest way to perform quantification with Raman spectroscopy is to build a linear model (or a calibration curve) from a known data set. A linear model corresponding to Equation 2 is given by Equation 3.
( )1 1
1,A,i ,A A,iI c
−υ υφ = (3)
Thus, the calibration data set (the data set with
known concentrations) is used to calculate the value
of ( )1
1,A
−υφ , and for new samples the Raman
intensity for wavelength ν1 is measured and used to quantify the concentration of compound A in the new
sample by using ( )1
1,A
−υφ .
The Raman scattering intensity for a sample with more than one active compound in the wavelength ν1 , for example the compounds A, B and C, is given by Equation 4 or in matrix form as given by Equation 5.
1 1 1 1,i A,i ,A B,i ,B C,i ,CI c c cυ υ υ υ= φ + φ + φ (4)
( )1
1 1
1
,A
,i A,i B,i C,i ,B
,C
I c c cυ
υ υ
υ
φ
= φ φ
(5)
For the case of only one compound, the linear
model is obtained by taking the inverse of ( )1,Aυφ ;
in the three-compound case the inverse of the corresponding term in Equation 5 can not be obtained. To solve this problem it is necessary to use the intensities of more than one wavelength, as shown in Equation 6.
( ) ( )1 2 3
1 2 3 1 2 3
1 2 3
,A ,A ,A
,i ,i ,i A,i B,i C,i ,B ,B ,B
,C ,C ,C
I I I c c cυ υ υ
υ υ υ υ υ υ
υ υ υ
φ φ φ
= φ φ φ φ φ φ
(6)
The matrix at the right side of Equation 6 can be inverted, resulting in Equation 7.
( ) ( )1 2 3
1 2 3 1 2 3
1 2 3
1,A ,A ,A
,i ,i ,i ,B ,B ,B A,i B,i C,i
,C ,C ,C
I I I c c c
−υ υ υ
υ υ υ υ υ υ
υ υ υ
φ φ φ
φ φ φ = φ φ φ
(7)
Linear Models
In general terms, Equation 7 can be written in
terms of a linear model, as given in Equation 8.
XBY = (8) where
A,1 B,1 C,1
A,2 B,2 C,2
A,n B,n C,n
c c cc c c
c c c
=
Y M M M (9)
321
2 31
31 3
,1,1,1
,2 ,2,2
,n,n ,n
III
I II
II I
υυυ
υ υυ
υυ υ
=
XMM M
(10)
1 2 3
1 2 3
1 2 3
1,A ,A ,A
,B ,B ,B
,C ,C ,C
−υ υ υ
υ υ υ
υ υ υ
φ φ φ
= φ φ φ φ φ φ
B (11)
For the calibration data set (a data set with known
concentrations), the model described by Equation 8
Monitoring Emulsion Homopolymerization Reactions 65
Brazilian Journal of Chemical Engineering Vol. 22, No. 01, pp. 61 - 74, January - March, 2005
has as unknown matrix B, whose estimation is discussed below.
The simplest way to estimate B is given by the least squares method, which provides Equation 12.
( ) YXXXB TT 1−= (12)
Equation 12 is a solution for a minimization
problem where the function f(B)=||Y-XB||2 must be minimized (|| x ||2 is the sum of the squares of the x elements). Equation 12 is valid if X is a full-rank matrix (Jackson, 1991); otherwise the inverse (XTX)-
1 does not exist. This condition is not always attained and an alternative way of calculating B must be used.
Projection-Based Linear Models
As mentioned previously, the inverse (XTX)-1 does not exist when matrix X is not full rank; thus, an alternative for estimating B is the projection of X on an orthogonal basis set, for example as given in Equation 13.
XPT = (13) where
IPP =T (14) and the number of columns of T and P is set equal to the rank of matrix X (the number of columns of T and P is also called the number of latent variables or the number of principal components). The decomposition, i.e., X=TPT corresponds to principal component analysis, PCA, where T is called the matrix of scores and P of loadings (Jackson, 1991).
As X has been projected, B is estimated as shown by Equation 15.
( ) YTTTB TT 1−= (15)
The concentration estimation of a new sample
(new spectra) is obtained as given in Equation 16.
PBXY newnew =ˆ (16)
where newX and newY are the new spectra and the respective estimated concentration matrices.
This method is called principal component regression, PCR (Jackson, 1991; Geladi and Kowalski, 1986). Despite the fact that PCR is an
elegant algebraic approach, in some cases the estimation of T with information from Y produces a better approximation. One method widely used to estimate T by using information from Y is partial least squares, PLS (Geladi and Kowalski, 1986), which is described here in terms of the SIMPLS algorithm (de Jong, 1993). The SIMPLS estimation of B is given by Equation 17.
TSIMPLS RQB = (17)
where
( ) ( )Rx1Xy1YQ Tn
TTn −−= (18)
( )[ ]TTnn Y1y /1= (19)
( )[ ]TTnn X1x /1= (20)
x and y are column vectors with average values for columns X and Y, respectively. 1n denotes a column vector (n×1).
The estimation of R is not discussed here but it is important to emphasize that it depends on X and Y (de Jong, 1993). The estimation of the concentration for a new sample (new spectra) is given by Equation 21.
( )new new SIMPLS= + −y y x x B (21)
EXPERIMENTAL
The Raman spectra were collected in a FRA 106/S FT-Raman accessory attached to an IFS 28/N spectrometer from Bruker, equipped with a quartz beamsplitter. The acquisition mode was set to double-sided (forward-backward) and the correlation mode to Full I Gram Length, where all points of the new interferogram are compared. In case of deviations, the area that diverges is replaced by the corresponding part of the average spectrum. Scans are discarded only if they contain more than ten defective areas or if the number of defective points exceeds one-eighth of the total number of interferogram points. The following conditions were used during acquisition: a phase resolution of 32, a phase correction mode equal to the power spectrum, the Norton-Beer apodization function, and an error-filling factor of 4. Each spectrum is an average of 32

66 M. M. Reis, M. Uliana, C. Sayer, P. H. H. Araújo and R. Giudici
Brazilian Journal of Chemical Engineering
scans with a resolution of 8 cm –1, which takes about 15 seconds of acquisition time. The laser wavelength is 1064 nm. Two different laser powers were used for spectra acquisition. The first was 450 mW for collecting the spectra of reaction VA1 (to be described later) and the spectra for the synthetic samples prepared with the latex resulting from this reaction. The second was a laser power of 510mW for collecting the spectra of the other synthetic samples and reactions described below. To collect the spectra, 6 mm diameter glass tubes were used.
The semicontinuous polymerizations were performed by charging the reactor with an initial
mass composed of distilled and deionized water, emulsifier (sodium lauryl sulfate, SLS), and pH buffer (sodium bicarbonate), which was flushed with nitrogen for one hour and heated to 60ºC. Then monomer, vinyl acetate (VA) or butyl acrylate (BA) with a small amount of acrylic acid (AA), and initiator (sodium persulfate) were added to the reactor by feed streams 1 and 2. The initial charge and the total amount of monomer and initiator fed in during the reactions mentioned in this work are given in Table 1.
Reaction temperature was set to 60oC. Monomer and initiator feed profiles for each reaction are shown in Figure 3.
Table 1: Formulation of homopolymerization reactions (butyl acrylate - BA1 - and vinyl acetate - VA1, VA2 and VA3).
Monomer (g) AA (g) Water (g) SLS(g) Na2S2O8 Na2CO3
Initial charge - - 420.00 2.00 - 0.50
Feed stream 1 110.00 1.10 - - - -
Feed stream 2 - - 30.00 - 1.00 -
Figure 3: Amounts (ml) of monomer and initiator added during the reactions.
METHODOLOGY
The spectra to be used in developing a model for
monitoring the polymerization process must mimic the three stages of the emulsion polymerization reaction described above. The first stage is the most difficult to mimic, since the monomer droplets may aggregate inside the cuvette, changing the sample composition during analysis. In this work, several synthetic samples were obtained by dispersing a known concentration of monomer in a polymeric emulsion and then used to build the calibration models.
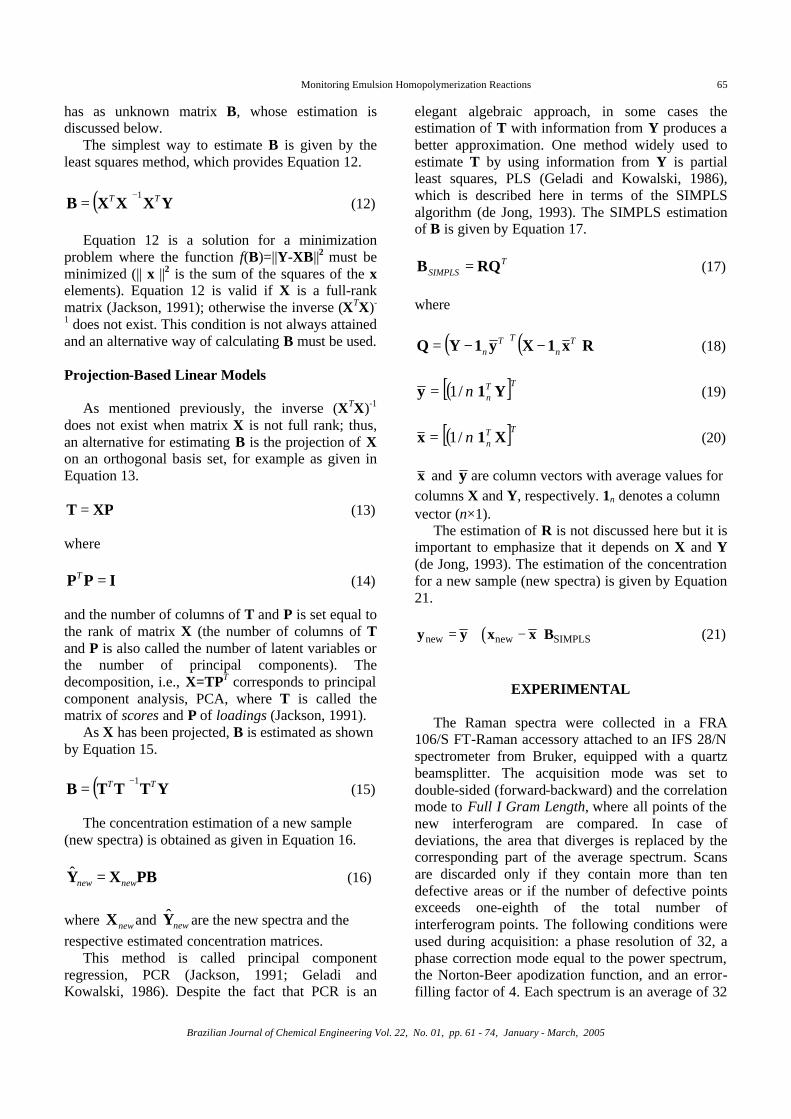
Three sets of samples were prepared, one for butyl acrylate and two for vinyl acetate. These three sets were used to fit two sets of calibration models, one for the polymerization of vinyl acetate and the other for the polymerization of butyl acrylate, as illustrated in Figure 4. Three kinds of models were tested, a univariate linear model and two multivariate linear models, PCR and PLS. For PLS, the algorithm developed by de Jong (1993) was used. The original spectra and the normalized spectra were evaluated in the building of the models. The normalization treatment corresponds to dividing each element of the spectrum by its element corresponding to the
Monitoring Emulsion Homopolymerization Reactions 67
Brazilian Journal of Chemical Engineering Vol. 22, No. 01, pp. 61 - 74, January - March, 2005
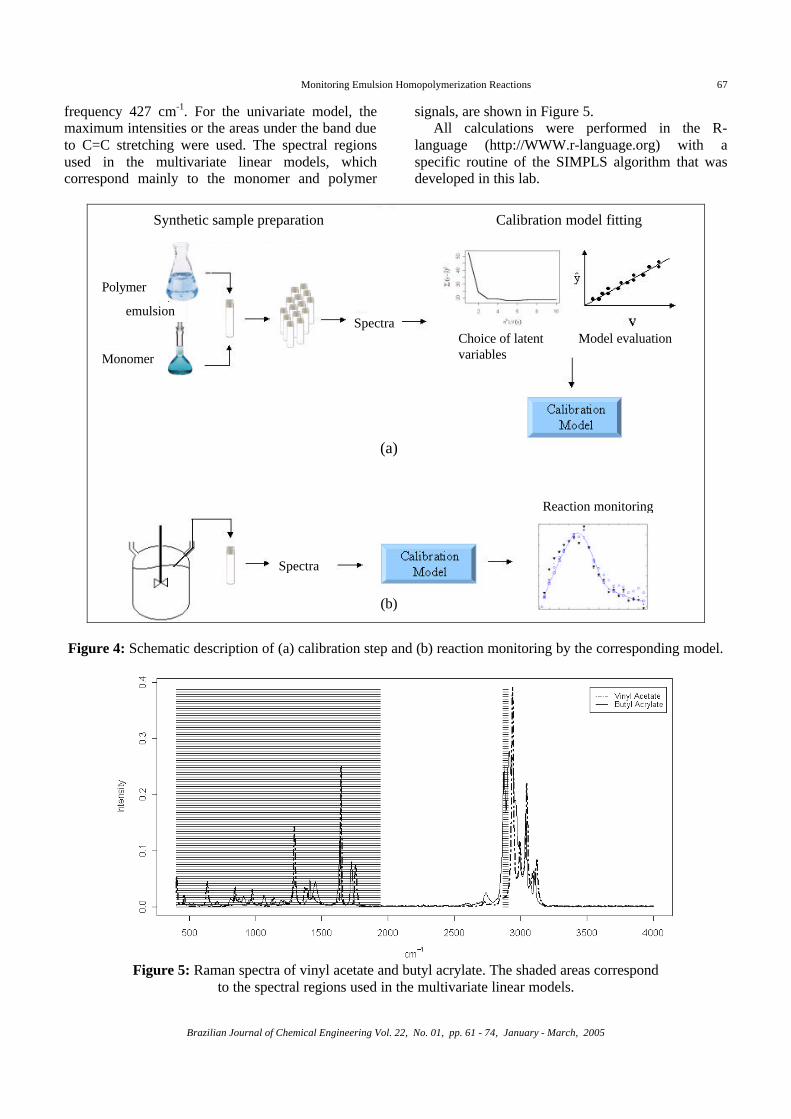
frequency 427 cm-1. For the univariate model, the maximum intensities or the areas under the band due to C=C stretching were used. The spectral regions used in the multivariate linear models, which correspond mainly to the monomer and polymer
signals, are shown in Figure 5. All calculations were performed in the R-
language (http://WWW.r-language.org) with a specific routine of the SIMPLS algorithm that was developed in this lab.
Model evaluation
Reaction monitoring
Spectra
Spectra
Monomer
Polymer
emulsion
Choice of latent variables
Synthetic sample preparation Calibration model fitting
(a)
(b)
Figure 4: Schematic description of (a) calibration step and (b) reaction monitoring by the corresponding model.
Figure 5: Raman spectra of vinyl acetate and butyl acrylate. The shaded areas correspond
to the spectral regions used in the multivariate linear models.

68 M. M. Reis, M. Uliana, C. Sayer, P. H. H. Araújo and R. Giudici
Brazilian Journal of Chemical Engineering
RESULTS
In general, the best results were obtained by models fitted with normalized spectra. Figure 6 shows Raman spectra collected during a semicontinuous polymerization of butyl acrylate. In this figure it is interesting to observe the increase in intensity of the band corresponding to the C=C stretching during monomer feeding and the decrease in intensity of this band after feeding had been stopped (at 90 minutes). The butyl acrylate concentration during this reaction calculated by the four models is shown in Figure 7. This figure shows that the univariate linear models have a bias at the beginning of the reaction, taking the monomer concentration quantified by head-space gas chromatography (GC) as reference; even so, the multivariate models do produce good predictions. As mentioned previously, at the beginning of the reaction, monomer droplets may be present in the reaction medium, enhancing its heterogeneity, and univariate linear models, which have information on only one band, are affected more adversely than multivariate linear models. On the other hand, the multivariate models have the advantage of information on a set of bands.
Two semicontinuous vinyl acetate homopolymerizations were monitored. In the first reaction (VA1), Raman spectra were collected during the reaction and the latex
resulting from this reaction was used to prepare a set of synthetic samples for the calibration model fitting, i.e., a PLS model (only the PLS results are discussed here, since it performed better than PCR). In the following step the model was applied to the spectra collected during the entire reaction. The number of latent variables (this is a PLS parameter that must be defined during the calibration step; see section (Projection-Based Linear Models) was evaluated by a leaving-one-out cross-validation procedure, where each spectrum collected from the set of synthetic samples is taken out and the other spectra are used in the model fitting and the resulting model is used to predict the vinyl acetate concentration in the sample corresponding to the spectrum left out. This procedure is followed to evaluate the ability of the model to predict the monomer concentration for a new spectrum. Results for the cross-validation method are shown in Figure 8.
According to Figure 8, the number of latent variables should be two or three, since increasing this number does not significantly decrease the prediction error. Thus three models were fitted: one with two latent variables, another with three, and the last with four latent variables. The results for these three models are shown in Figure 9.
(a)
(b)
Figure 6: Raman spectra collected during the homopolymerization of butyl acrylate (BA1) in (a) and Raman intensity at 1637 cm-1 corresponding to the C=C stretching of butyl acrylate (Lin-Vien et al., 1991) in (b).
Monitoring Emulsion Homopolymerization Reactions 69
Brazilian Journal of Chemical Engineering Vol. 22, No. 01, pp. 61 - 74, January - March, 2005
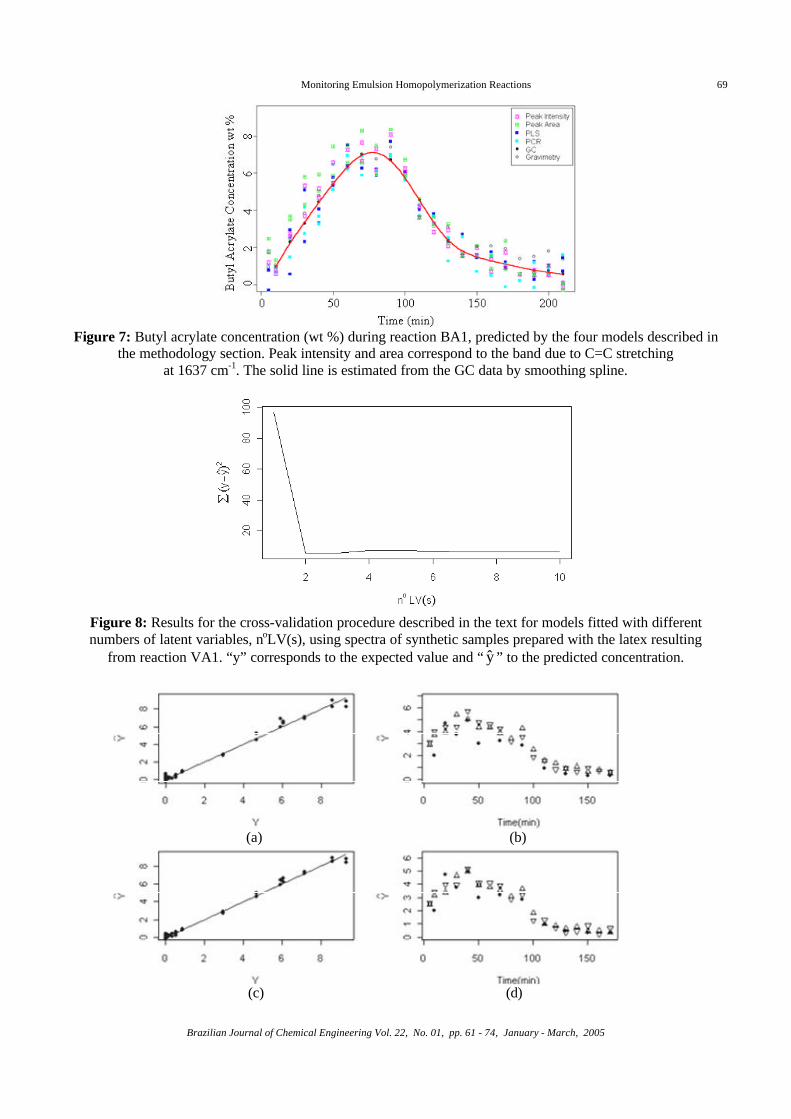
Figure 7: Butyl acrylate concentration (wt %) during reaction BA1, predicted by the four models described in
the methodology section. Peak intensity and area correspond to the band due to C=C stretching at 1637 cm-1. The solid line is estimated from the GC data by smoothing spline.
Figure 8: Results for the cross-validation procedure described in the text for models fitted with different numbers of latent variables, noLV(s), using spectra of synthetic samples prepared with the latex resulting
from reaction VA1. “y” corresponds to the expected value and “ y ” to the predicted concentration.
(a) (b)
(c) (d)
70 M. M. Reis, M. Uliana, C. Sayer, P. H. H. Araújo and R. Giudici
Brazilian Journal of Chemical Engineering
(e) (f)
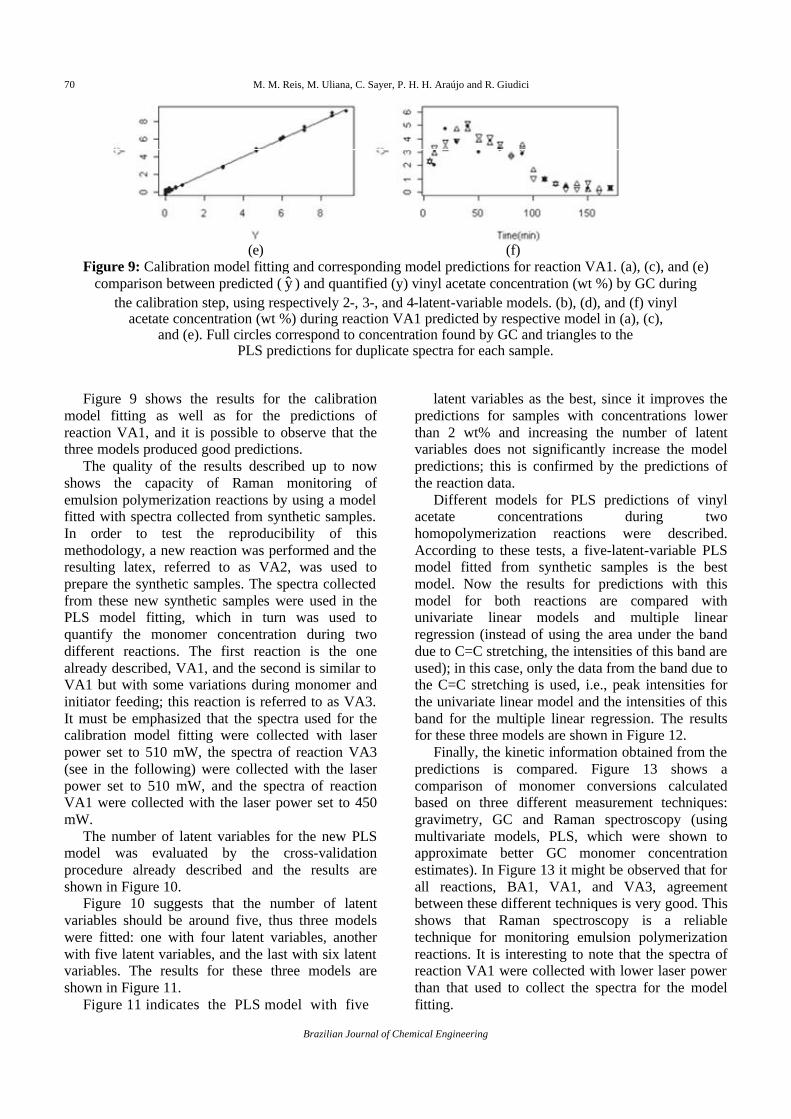
Figure 9: Calibration model fitting and corresponding model predictions for reaction VA1. (a), (c), and (e) comparison between predicted ( y ) and quantified (y) vinyl acetate concentration (wt %) by GC during
the calibration step, using respectively 2-, 3-, and 4-latent-variable models. (b), (d), and (f) vinyl acetate concentration (wt %) during reaction VA1 predicted by respective model in (a), (c),
and (e). Full circles correspond to concentration found by GC and triangles to the PLS predictions for duplicate spectra for each sample.
Figure 9 shows the results for the calibration
model fitting as well as for the predictions of reaction VA1, and it is possible to observe that the three models produced good predictions.
The quality of the results described up to now shows the capacity of Raman monitoring of emulsion polymerization reactions by using a model fitted with spectra collected from synthetic samples. In order to test the reproducibility of this methodology, a new reaction was performed and the resulting latex, referred to as VA2, was used to prepare the synthetic samples. The spectra collected from these new synthetic samples were used in the PLS model fitting, which in turn was used to quantify the monomer concentration during two different reactions. The first reaction is the one already described, VA1, and the second is similar to VA1 but with some variations during monomer and initiator feeding; this reaction is referred to as VA3. It must be emphasized that the spectra used for the calibration model fitting were collected with laser power set to 510 mW, the spectra of reaction VA3 (see in the following) were collected with the laser power set to 510 mW, and the spectra of reaction VA1 were collected with the laser power set to 450 mW.
The number of latent variables for the new PLS model was evaluated by the cross-validation procedure already described and the results are shown in Figure 10.
Figure 10 suggests that the number of latent variables should be around five, thus three models were fitted: one with four latent variables, another with five latent variables, and the last with six latent variables. The results for these three models are shown in Figure 11.
Figure 11 indicates the PLS model with five
latent variables as the best, since it improves the predictions for samples with concentrations lower than 2 wt% and increasing the number of latent variables does not significantly increase the model predictions; this is confirmed by the predictions of the reaction data.
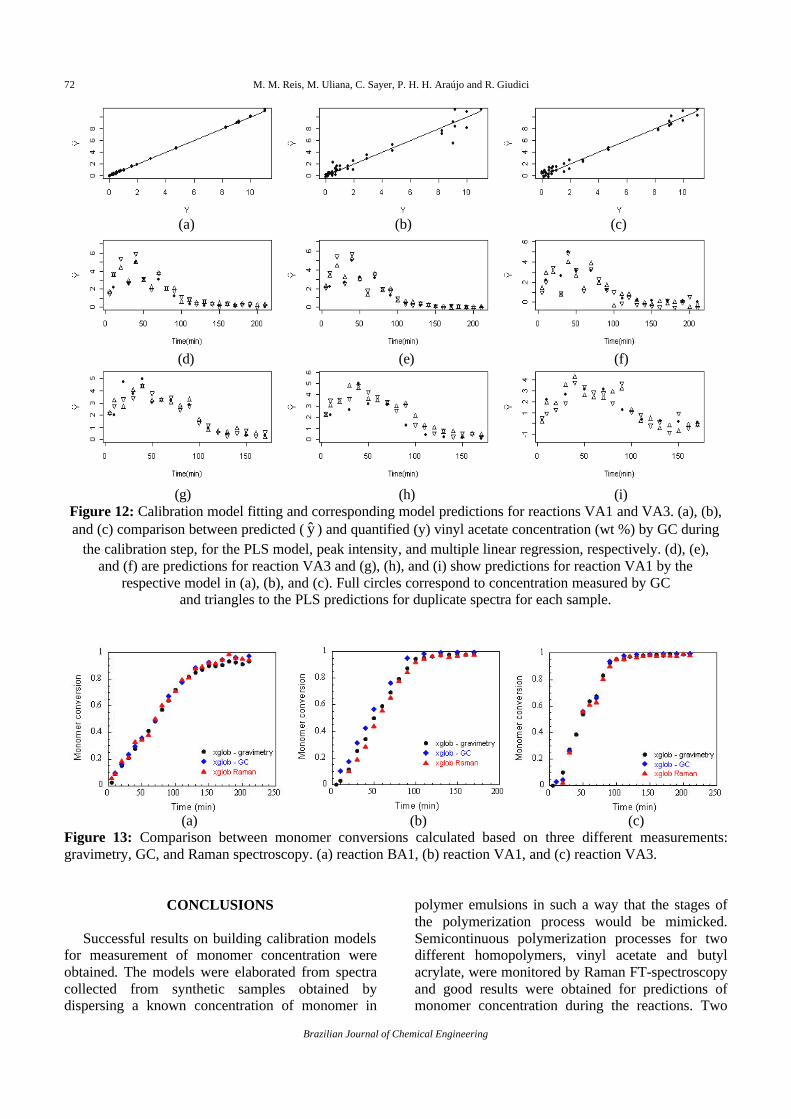
Different models for PLS predictions of vinyl acetate concentrations during two homopolymerization reactions were described. According to these tests, a five-latent-variable PLS model fitted from synthetic samples is the best model. Now the results for predictions with this model for both reactions are compared with univariate linear models and multiple linear regression (instead of using the area under the band due to C=C stretching, the intensities of this band are used); in this case, only the data from the band due to the C=C stretching is used, i.e., peak intensities for the univariate linear model and the intensities of this band for the multiple linear regression. The results for these three models are shown in Figure 12.
Finally, the kinetic information obtained from the predictions is compared. Figure 13 shows a comparison of monomer conversions calculated based on three different measurement techniques: gravimetry, GC and Raman spectroscopy (using multivariate models, PLS, which were shown to approximate better GC monomer concentration estimates). In Figure 13 it might be observed that for all reactions, BA1, VA1, and VA3, agreement between these different techniques is very good. This shows that Raman spectroscopy is a reliable technique for monitoring emulsion polymerization reactions. It is interesting to note that the spectra of reaction VA1 were collected with lower laser power than that used to collect the spectra for the model fitting.

Monitoring Emulsion Homopolymerization Reactions 71
Brazilian Journal of Chemical Engineering Vol. 22, No. 01, pp. 61 - 74, January - March, 2005
Figure 10: Results from the cross-validation procedure described in the text for models fitted with different
number of latent variables, noLV(s), using spectra of synthetic samples prepared with the latex VA2. “y” corresponds to the expected value and “ y ” to the predicted concentration.
Figure 11: Calibration model fitting and corresponding model predictions for reactions VA1 and VA3. (a), (d), and (g) comparison between predicted ( y ) and quantified (y) vinyl acetate concentration (wt %) by GC during the calibration step, using respectively 4-, 5-, and 6-latent-variable models, respectively in (a), (d), and (g). (b),
(e), and (h) are predictions for reaction VA3; (c), (f), and (i) for reaction VA1. Full circles correspond to concentration measured by GC and triangles to the PLS predictions for duplicate spectra for each sample.
72 M. M. Reis, M. Uliana, C. Sayer, P. H. H. Araújo and R. Giudici
Brazilian Journal of Chemical Engineering
(a) (b) (c)
(d) (e) (f)
(g) (h) (i) Figure 12: Calibration model fitting and corresponding model predictions for reactions VA1 and VA3. (a), (b), and (c) comparison between predicted ( y ) and quantified (y) vinyl acetate concentration (wt %) by GC during
the calibration step, for the PLS model, peak intensity, and multiple linear regression, respectively. (d), (e), and (f) are predictions for reaction VA3 and (g), (h), and (i) show predictions for reaction VA1 by the
respective model in (a), (b), and (c). Full circles correspond to concentration measured by GC and triangles to the PLS predictions for duplicate spectra for each sample.
(a) (b) (c)
Figure 13: Comparison between monomer conversions calculated based on three different measurements: gravimetry, GC, and Raman spectroscopy. (a) reaction BA1, (b) reaction VA1, and (c) reaction VA3.
CONCLUSIONS
Successful results on building calibration models for measurement of monomer concentration were obtained. The models were elaborated from spectra collected from synthetic samples obtained by dispersing a known concentration of monomer in
polymer emulsions in such a way that the stages of the polymerization process would be mimicked. Semicontinuous polymerization processes for two different homopolymers, vinyl acetate and butyl acrylate, were monitored by Raman FT-spectroscopy and good results were obtained for predictions of monomer concentration during the reactions. Two
Monitoring Emulsion Homopolymerization Reactions 73
Brazilian Journal of Chemical Engineering Vol. 22, No. 01, pp. 61 - 74, January - March, 2005
different approaches, one univariate and the other multivariate, were tested in building the calibration models. The results evaluated, having gravimetry and/or gas chromatography as reference methods, showed that multivariate models are more robust for heterogeneity at the beginning of the reaction as well as for noisy spectra than the univariate model. It must be emphasized that spectra from synthetic samples were used in model development rather than spectra from samples extracted during the reaction, as had already been widely reported in the literature. These results show that it is possible to fit calibration models for monitoring homopolymerization by Raman spectroscopy using synthetic samples instead of data collected from different reactions, which may be expensive and time-consuming. The synthetic samples can be designed to emulate different situations which may occur during process monitoring, such as changes in medium heterogeneity, variation in temperature, loss in laser power, etc. The setup for the process monitoring used in the present work employed sampling and off-line measurement of the spectra. This procedure allows prediction of monomer concentration during the reaction within less than one minute. Work is underway to explore the full potential of the Raman technique in truly on-line measurements and the results will be discussed in a future publication.
ACKNOWLEDGEMENTS
The financial support of FAPESP (Fundação de Amparo à Pesquisa do Estado de São Paulo) and CNPq (Conselho Nacional de Desenvolvimento Científico e Tecnológico) and the PROFIX fellowship received by P.H.H. Araujo from CNPq-Brazil for and post-doc fellowship received by M. M. Reis from FAPESP (grant number 01/13017-1) are gratefully acknowledged. The authors also thank Rhodia do Brasil for providing the monomers.
NOMENCLATURE
Note: Matrices are denoted by bold upper case, e.g. X; column vectors are denoted by bold lower case, e.g. x; the transpose of a matrix or vector is denoted by the superscript T and the inverse of a matrix by the superscript –1. Iν Raman intensity for the band at
wavelength ν Io intensity of the exciting radiation
V volume of the sample cA concentration of component A Kν constant characteristic of the band with
wavelength ν Y matrix of the component concentrations,
as defined in Equation 9 X matrix of the Raman intensities at selected
wavelengths, as defined in Equation 10 B matrix of the calibration coefficients, as
defined in Equation 11 T matrix of scores P matrix of loadings
REFERENCES Al-Khanbashi, A., Hansen, M.G., and Wachter,
E.A., Improved Fiber-Optic Method for Monitoring Emulsion Composition Using Raman Scattering, Applied Spectroscopy, 50, No. 8,1089 (1996).
Chien, D.C.H. and Penlidis, A., Online Sensors for Polymerization Reactors, Journal of Macromolecular Science − Reviews in Macromolecular Chemistry and Physics, 30, No. 1, 1 (1990).
de Jong, S., SIMPLS: An Alternative Approach to Partial Least Squares Regression, Chemometrics and Intelligent Laboratory Systems, 18, No. 3, 251 (1993).
Ellis, G., Claybourn, M., and Richards, S.E., The Application of Fourier Transform Raman Spectroscopy to Study of Paint Systems, Spectrochimica Acta, 46A, No. 2, 227 (1990).
Geladi, P. and Kowalski, B.R., Partial Least-Squares Regression − A Tutorial, Analytica Chimica Acta, 185, 1 (1986).
Hendra, P., Jones, C., and Warnes, G., Fourier Transform Raman Spectroscopy, Instrumentation and Chemical Application. Ellis Horwood, England, 127 (1991).
Jackson, J.E., A User’s Guide to Principal Component. John Wiley & Sons Inc., Canada (1991).
Kammona, O., Chatzi, E.G., and Kiparissides, C., Recent Developments in Hardware Sensors for the On-Line Monitoring of Polymerization Reactions, Journal of Macromolecular Science − Reviews in Macromolecular Chemistry and Physics, 39, No. 1, 57 (1996).
Kiparissides, C., Polymerization Reactor Modeling: A Review of Recent Developments and Future Directions, Chemical Engineering Science, 51, No. 10, 1637 (1996).

74 M. M. Reis, M. Uliana, C. Sayer, P. H. H. Araújo and R. Giudici
Brazilian Journal of Chemical Engineering
Laserna, J.J., Modern Techniques in Raman Spectroscopy. John Wiley & Sons Ltd., UK (1996).
Lin-Vien, D., Colthup, N.B., Fateley, W.G., and Grasselli, J.G., The Handbook of Infrared and Raman Characteristic Frequencies of Organic Molecules. Academic Press, San Diego-USA (1991).
Özpozan, T., Schrader, B., and Keller, S., Monitoring of the Polymerization of Vinyl Acetate by Near IR FT Raman Spectroscopy, Spectrochimica Acta, 53, No. 1, 1 (1997).
van den Brink, M., On-Line Monitoring of Polymerization Reactions by Raman Spectroscopy: Application to Control of Emulsion Copolymerizations and Copolymerizations Kinetics,, Ph.D. diss., Eindhoven University of Technology (2000).
van den Brink, M., Pepers, M., van Herk, A.M., and German, A.L., On-Line Monitoring and Composition Control of the Emulsion Copolymerization of VeoVA 9 and Butyl Acrylate by Raman Spectroscopy, Polymer Reaction Engineering, 9, No. 2, 101 (2001).