monetary policy and household debt - nordregio
TRANSCRIPT

Monetary Policy and Household Debt
Magnus Gulbrandsen (BI Norwegian Business School)Gisle J. Natvik (BI Norwegian Business School)
NEPR seminar: Financial Regulation and MacroeconomicStability
Helsinki, December 2019

Debt and House Prices in Nordic Countries0
5010
015
020
025
030
035
0D
ebt t
o In
com
e
1995 1997 1999 2001 2003 2005 2007 2009 2011 2013 2015 2017
Denmark Finland
Norway Sweden
(a) Debt relative to income10
015
020
025
0H
ouse
Pric
es to
Inco
me
1995 1997 1999 2001 2003 2005 2007 2009 2011 2013 2015 2017
Denmark Finland
Norway Sweden
(b) Houseprices relative to income
Source: OECD.
Gulbrandsen & Natvik (BI) MP Debt NEPR Dec 2019 1 / 32
Questions
1. Is household debt a relevant concern for monetary policy?
I ... out of the many potential concerns that exist, why household debt?
2. How can/does monetary policy affect household debt?
With a solid answer to question 2 we can address:
I What characterizes a monetary policy that stabilizes households’ debtburdens?
Note! We cannot trust answers to this question without evidence onquestion 2.
Gulbrandsen & Natvik (BI) MP Debt NEPR Dec 2019 2 / 32
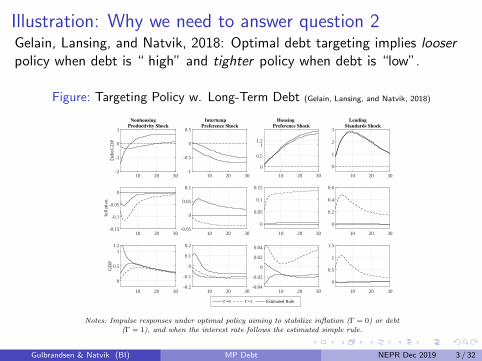
Illustration: Why we need to answer question 2Gelain, Lansing, and Natvik, 2018: Optimal debt targeting implies looserpolicy when debt is “ high” and tighter policy when debt is “low”.
Figure: Targeting Policy w. Long-Term Debt (Gelain, Lansing, and Natvik, 2018)
Figure 14. Optimal Debt-to-GDP and Inflation Targeting in the Estimated Model with LongTerm Debt
10 20 30
Deb
t/GD
P
-2
-1
0
1
Nonhousing
Productivity Shock
10 20 30
Infl
atio
n
-0.15
-0.1
-0.05
0
10 20 30
GD
P
0
0.5
11.2
10 20 30-1
-0.5
0
0.5
Intertemp
Preference Shock
10 20 30-0.05
0
0.05
0.1
10 20 30-0.2
-0.1
0
0.1
0.2
10 20 30
0
0.5
11.2
Housing
Preference Shock
10 20 30
0
0.05
0.1
0.15
10 20 30-0.04
-0.02
0
0.02
0.04
10 20 30
0
1
2
3
Lending
Standards Shock
10 20 30
0
0.2
0.4
0.6
Γ=0 Γ=1 Estimated Rule
10 20 30
0
0.5
1
1.5
Notes: Impulse responses under optimal policy aiming to stabilize inflation (Γ = 0) or debt(Γ = 1), and when the interest rate follows the estimated simple rule.
66
Gulbrandsen & Natvik (BI) MP Debt NEPR Dec 2019 3 / 32

This talk (and paper)
I Draw some lessons from the literature what we think are particularlyuseful for the 2 questions at handI Take-away 1: household debt matters for macroeconomic stabilityI Take-away 2: macro-level evidence and simple models question how/if
interest rate changes affect household debt burdensI Take-away 3: modern approach to studying monetary policy (MP)
transmission emphasizes more than intertemporal substitution – likelyto be important for MP and debt as well
I Take-away 4: recent micro-level evidence on MP highlights cash flows– household debt a key ingredient in this transmission channel
I Use Norwegian evidence to look into how monetary policy (MP)affects cash flows and debt
Gulbrandsen & Natvik (BI) MP Debt NEPR Dec 2019 4 / 32

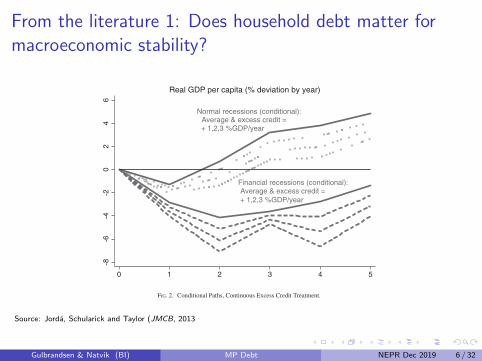
From the literature 1: Does household debt matter formacroeconomic stability?
Historical evidence (17 countries since 1870) from Jorda, Schularickand Taylor (2013, 2015, 2016, ...):
I Rapid increases in household debt come withI increased risk of financial crisesI worse recessions once they occur
I Asset price bubbles are more costly if accompanied by steep growth inhousehold debt
I Mortgage credit seems the main culprit
Gulbrandsen & Natvik (BI) MP Debt NEPR Dec 2019 5 / 32
From the literature 1: Does household debt matter formacroeconomic stability?
20 : MONEY, CREDIT AND BANKING
TABLE 8
LP CONDITIONAL PATHS—SEVEN-VARIABLE SYSTEM, NORMAL VERSUS FINANCIAL BINS AND EXCESS CREDIT
Year 1 Year 2 Year 3 Year 4 Year 5Log real GDP per capita (relative to year 0, ×100) (1) (2) (3) (4) (5)
Normal recession (N ) −1.3∗∗ 0.7 3.2∗∗ 3.8∗∗ 4.8∗∗(0.4) (0.6) (0.9) (1.1) (1.2)
Financial recession (F) −2.8∗∗ −4.1∗∗ −3.6∗∗ −2.8 −1.4(0.6) (1.0) (1.4) (1.8) (1.9)
Excess credit × normal recession (N × (ξ − ξN )) −0.3 −0.7∗∗ −0.8∗ −0.9∗ −0.7(0.2) (0.3) (0.4) (0.5) (0.6)
Excess credit × financial recession (F × (ξ − ξF )) −0.4∗ −1.0∗∗ −0.4 −1.3∗ −0.9(0.2) (0.4) (0.5) (0.7) (0.7)
F-test equality of coefficients, normal = financial (p) 0.01 0.00 0.00 0.00 0.00F-test equality of coefficients, interaction terms (p) 0.57 0.47 0.49 0.62 0.82Observations, normal 92 92 92 92 92Observations, financial 29 29 29 29 29Observations 121 121 121 121 121
NOTES: Dependent variable: �h yit(r )+h = (change in log real GDP per capita from year 0 to year h) ×100. Standard errors in parentheses.∗ p <
0.10, ∗∗ p < 0.05. Country fixed effects not shown. See text for a list of controls not shown here. LM test: All excess credit coefficients equalzero: F(10,585) = 3.026; p = 0.001. In each bin, recession indicators (N , F) are interacted with demeaned excess credit, (ξ − ξN , ξ − ξF ).
Normal recessions (conditional):Average & excess credit =+ 1,2,3 %GDP/year
Financial recessions (conditional):Average & excess credit =+ 1,2,3 %GDP/year
-8-6
-4-2
02
46
0 1 2 3 4 5
Real GDP per capita (% deviation by year)
FIG. 2. Conditional Paths, Continuous Excess Credit Treatment.
NOTES: See text. Solid lines show paths from Table 8, when excess credit ξ is at its mean in each bin. Dotted and dashedlines show paths when ξ is perturbed in three increments of +1 percentage points per year in each bin. For each case allthe controls are set to their historical mean values and the average country fixed effect is imposed.Source: Jorda, Schularick and Taylor (JMCB, 2013
Gulbrandsen & Natvik (BI) MP Debt NEPR Dec 2019 6 / 32

From the literature 1: Does household debt matter formacroeconomic stability?
Event studies of the 2007-09 financial crisis across US states byMian and Sufi (QJE 2013, ...):
I In zip code areas where leverage was higher before the crisis,consumption fell more strongly when house prices collapsed.I debt propagates the consumption responses to wealth changes
Micro evidence from households in the US by Baker (JPE 2018),Dynan (Brookings 2012):
I Households with greater debt have higher marginal propensities toconsume out of regular income shocksI debt propagates the consumption responses to income changes
Gulbrandsen & Natvik (BI) MP Debt NEPR Dec 2019 7 / 32

From the literature 2: Data and models on MP and debt
Panel-VAR on MP shocks in 18 countries over 1975–2014 by Bauerand Granziera (IJCB, 2017):354 International Journal of Central Banking September 2017
Figure 5. Responses to a Monetary Policy Shock
Notes: Impulse response functions after a 100 basis point contractionary mon-etary policy shock. Dashed lines indicate the average response; shaded areasindicate 68 percent confidence set obtained with the frequentist procedure inMoon, Schorfheide, and Granziera (2013).
and Gelain, Lansing, and Natvik (2015), the stock of nominal debtexhibits considerable inertia, as agents find it difficult to changeexisting contracts. Given that the fall in inflation is larger than thereduction in nominal debt, after a monetary policy shock real debtrises on impact. As nominal debt further decreases and inflationquickly rebounds, real debt falls below trend from the first quarterafter the shock.
As output shrinks on impact, the debt-to-GDP ratio rises byabout 0.85 percent (figure 5). However, starting from the first
Gulbrandsen & Natvik (BI) MP Debt NEPR Dec 2019 8 / 32

From the literature 2: Data and models on MP and debtTime-series (VAR) evidence on contractive MP shocks:
I Bauer and Granziera (2017): debt-to-income up in the short run,down in the short run.
I Robstad (2018): real debt down a little bit
Historical (1929-2011) decomposition of US householddebt-to-income by Mason and Jayadev (AEJ 2014):
I Debt-to-income fluctuations largely driven by variation in income,interest expenses and inflation
I ... not by borrowing
Micro-level evidence on interest rate reductions by DiMaggio et.al(AER 2018):I When households experience reduced interest rates on outstanding
debt (due to ARM resets)I On average 10% of the cash flow is used to repay debt
Gulbrandsen & Natvik (BI) MP Debt NEPR Dec 2019 9 / 32

From the literature 2: Data and models on MP and debt
DSGE model on MP and household debt by Gelain, Lansing, andNatvik (2018):I When debt is only infrequently re-financed, non-indexed, and
gradually amortizedI Debt-to-income responds little and likely positively to interest hikesI Simple rules to increase interest rates when debt is high are detrimentalI Debt targeting implies expansionary MP when debt is high
Cost-benefit analysis of leaning against the wind by Svensson (JME2017,...):I Cost most likely exceeds the benefits because
I Weaker economy if no crisisI ... and weaker economy once a crisis occursI Only gain is crisis probabilityI ... need implausibly strong effects on probability to outweigh costs
Gulbrandsen & Natvik (BI) MP Debt NEPR Dec 2019 10 / 32

From the literature 3: MP transmission beyondintertemporal substitutionMP transmission in heterogeneous agent models w. nominal rigidity(HANK) (Kaplan, Moll and Violante AER 2018; Auclert AER 2019;Luetticke 2019; ...):
I If model-implied distributions of wealth, liquidity and MPCs are“realistic”:I Effects via disposable income are the main transmission channelI ... not intertemporal substitution.
I Cross-sectional correlation between households’ general exposure tointerest rate changes and their MPCs is key to MP strength.
I What does a realistic MPC distribution mean?I Evidence from micro studies (Jappelli and Pistaferri, 2014; ...)I Consumption response out of transitory income shocks way bigger than
in permanent income hypothesis – say 0.25 at a quarterly frequency.I Correlation with liquidity - “wealthy hand-to-mouth” behavior
Gulbrandsen & Natvik (BI) MP Debt NEPR Dec 2019 11 / 32

From the literature 4: MP and household cash flows
Note:
I HANK literature has so far largely ignored the direct effect of MP onhouseholds’ interest expenditure – the “cash flow channel”
I Surge of recent empirical papers estimating the strength of thecash-flow channel
Gulbrandsen & Natvik (BI) MP Debt NEPR Dec 2019 12 / 32

From the literature 4: MP and household cash flows
Micro evidence on the cash flow channel in Sweden by Floden,Kilstrom, Sigurdsson and Vestman (2018):I Comparing high and low leveraged households’ response to interest
rate changes:I Out of interest expenditure, average MPC around one-half
Micro evidence on the cash flow channel in Australia by La Cava,Hughson and Kaplan (2016):I Comparing households with fixed vs adjustable rate mortgages after
interest rate changes:I Consumption responds more for ARM holders
Micro evidence on the cash flow channel in the US by Di Maggio etal. (2017):I When households experience reduced interest rates on outstanding
debt (due to ARM resets)I They increase durable consumption by 35%.
Gulbrandsen & Natvik (BI) MP Debt NEPR Dec 2019 12 / 32

Summing up: Likely transmission mechanism from MP tohousehold debt
I How should we expect an increase in the interest rate to affecthousehold debt accumulation?
I 3 channels:
1. Incentivize saving - intertemporal substitutionI “conventional logic”, but likely to be rather unimportant
2. Reduce cash flows of indebted households - a la negative transitoryincome shock
3. Deflate real debt via inflation - “Fisherian debt deflation”
I Caveat: Maybe house prices are a separate, fourth channel.
I We will look into 2 and 3 using Norwegian micro data.
Gulbrandsen & Natvik (BI) MP Debt NEPR Dec 2019 13 / 32
The Norwegian data
I Population tax record data from 1993 - 2006.I Household levelI Besides income tax, Norway also issues a wealth tax
I High-quality balance sheet data
I Observables: assets, liabilities, income, household characteristics
I All assets except non-listed stocks and housing are reported at marketvalueI Assessed value ≈ book value for privately held businessesI Transaction level data on housing used to construct local house price
indices (Fagereng, Holm & Torstensen, 2018)
I Third-party reporting: limited scope for tax evasion
Gulbrandsen & Natvik (BI) MP Debt NEPR Dec 2019 14 / 32

Income components over time
2500
0030
0000
3500
0040
0000
(mea
n) in
com
e_ex
cl_i
nter
est
010
000
2000
030
000
4000
050
000
1995 2000 2005 2010 2015year
Mean Interest Income (left axis)Mean Interest Expenses (left axis)Mean Income excl. Interest (right axis)
Gulbrandsen & Natvik (BI) MP Debt NEPR Dec 2019 15 / 32

The distribution of debt-to-income over time.
05
10
0 1 2 3 4 5 6 7 8 9 10
1993P
erce
nt
Debt−to−Income
05
10
0 1 2 3 4 5 6 7 8 9 10
2000
Per
cent
Debt−to−Income
05
10
0 1 2 3 4 5 6 7 8 9 10
2007
Per
cent
Debt−to−Income
05
10
0 1 2 3 4 5 6 7 8 9 10
2015
Per
cent
Debt−to−Income
Gulbrandsen & Natvik (BI) MP Debt NEPR Dec 2019 16 / 32
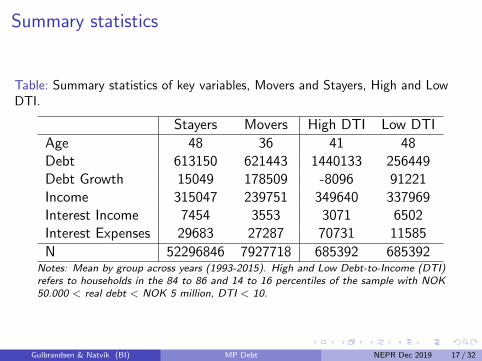
Summary statistics
Table: Summary statistics of key variables, Movers and Stayers, High and LowDTI.
Stayers Movers High DTI Low DTI
Age 48 36 41 48Debt 613150 621443 1440133 256449Debt Growth 15049 178509 -8096 91221Income 315047 239751 349640 337969Interest Income 7454 3553 3071 6502Interest Expenses 29683 27287 70731 11585
N 52296846 7927718 685392 685392Notes: Mean by group across years (1993-2015). High and Low Debt-to-Income (DTI)refers to households in the 84 to 86 and 14 to 16 percentiles of the sample with NOK50.000 < real debt < NOK 5 million, DTI < 10.
Gulbrandsen & Natvik (BI) MP Debt NEPR Dec 2019 17 / 32

Cash flows and nominal interest rates.
How do the components of disposable income – households’ cash flows –co-move with the nominal interest rate?
I We look at the mean real cash flows and the nominal interest rateover time
I First-differenced levels
Gulbrandsen & Natvik (BI) MP Debt NEPR Dec 2019 18 / 32

Cash flows and nominal interest rates. 1995 - 2018.
−.0
4−
.02
0.0
2.0
4
−50
−30
−10
1030
50
1993 1996 1999 2002 2005 2008 2011 2014year
Delta Total Income (left axis)
Delta Nominal Policy Rate (right axis)
(a) Total income
−.0
4−
.02
0.0
2.0
4
−50
−30
−10
1030
50
1993 1996 1999 2002 2005 2008 2011 2014year
Delta Income ex. interest (left axis)
Delta Nominal Policy Rate (right axis)
(b) Income excl. interest
−.0
4−
.02
0.0
2.0
4
−20
−10
010
20
1993 1996 1999 2002 2005 2008 2011 2014year
Delta Interest Income (left axis)
Delta Nominal Policy Rate (right axis)
(c) Interest income
−.0
4−
.02
0.0
2.0
4
−20
−10
010
20
1993 1996 1999 2002 2005 2008 2011 2014year
Delta Interest Expenses (left axis)
Delta Nominal Policy Rate (right axis)
(d) Interest expenses
Gulbrandsen & Natvik (BI) MP Debt NEPR Dec 2019 19 / 32

Cash flows and nominal interest rates
How do the components of disposable income – households’ cash flows –co-move with the nominal interest rate?
I Reasonable concern: Omitted variables driving both
I Simple solution: Compare households with high and lowdebt-to-income (DTI)I Diff-in-diff: p85 minus p15 households in the DTI distribution
I Why? Because p85 cash-flows should be more sensitive to interest ratechanges than p15.
Gulbrandsen & Natvik (BI) MP Debt NEPR Dec 2019 20 / 32

Diff-in-diff cash flows, high vs. low DTI households.
−.0
4−
.02
0.0
2.0
4
−50
−25
025
50
1995 2000 2005 2010 2015year
Change Total Income (Diff HighDTI−LowDTI)Change in Nominal Policy Rate
(e) Total income
−.0
4−
.02
0.0
2.0
4
−50
−25
025
50
1995 2000 2005 2010 2015year
Change Income ex. Interest (Diff HighDTI−LowDTI)Change in Nominal Policy Rate
(f) Income excl. interest
−.0
4−
.02
0.0
2.0
4
−5
−2.
50
2.5
5
1995 2000 2005 2010 2015year
Change Interest Income (Diff HighDTI−LowDTI)Change in Nominal Policy Rate
(g) Interest income
−.0
4−
.02
0.0
2.0
4
−30
−20
−10
010
2030
1995 2000 2005 2010 2015year
Change Interest Expenses (Diff HighDTI−LowDTI)Change in Nominal Policy Rate
(h) Interest expenses
Gulbrandsen & Natvik (BI) MP Debt NEPR Dec 2019 21 / 32

From cash flows to debt growth
How do the components of disposable income – households’ cash flows –co-move with the nominal interest rate?
I Distinct effects on deposit income and debt expenditure (notsurprising)
I ... but these are insufficient to dominate total income
I Hence: Unlikely to have big effects on debt accumulation
Next: How does debt growth co-move with interest and inflation?
I We look at mean real debt growth (level change), interest rates andinflation over time
I First-differenced
Gulbrandsen & Natvik (BI) MP Debt NEPR Dec 2019 22 / 32

Debt growth and interest rates
−.0
4−
.03
−.0
2−
.01
0.0
1.0
2.0
3.0
4
−50
−25
025
50
1995 2000 2005 2010 2015year
Change in Debt GrowthChange in Nominal Policy Rate
(i) Debt growth and nominal policy in-terest rate, first differences
−.0
4−
.02
0.0
2.0
4
−50
−25
025
50
1995 2000 2005 2010 2015year
Change in Debt GrowthChange in Real Policy Rate
(j) Debt growth and real interest rate,first differences
I Weak association with nominal rates, some positive association withreal rates.I Why?
Gulbrandsen & Natvik (BI) MP Debt NEPR Dec 2019 23 / 32

Debt growth and inflation
−.0
4−
.03
−.0
2−
.01
0.0
1.0
2.0
3.0
4
−50
000
−25
000
025
000
5000
0
1995 2000 2005 2010 2015year
Change in Debt Growth
Change in Inflation
Gulbrandsen & Natvik (BI) MP Debt NEPR Dec 2019 24 / 32

Debt growth and inflation
−.0
4−
.03
−.0
2−
.01
0.0
1.0
2.0
3.0
4
−50
000
−25
000
025
000
5000
0
1995 2000 2005 2010 2015year
Change in Debt Growth
Change in Inflation
−60
000
−40
000
−20
000
020
000
Deb
t Gro
wth
, Cha
nge
−.02 −.01 0 .01 .02 .03Inflation rate, Change
Mean Change in Debt growth Fitted values
I Variation in inflation strongly associated with variation in real debtgrowthI Well beyond any interest rate associationI Why?
Gulbrandsen & Natvik (BI) MP Debt NEPR Dec 2019 25 / 32
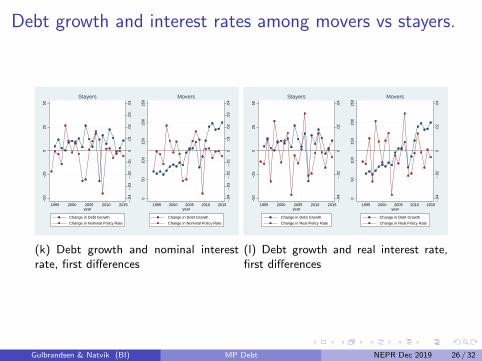
Debt growth and interest rates among movers vs stayers.
−.0
4−
.03
−.0
2−
.01
0.0
1.0
2.0
3.0
4
−50
−25
025
50
1995 2000 2005 2010 2015year
Change in Debt Growth
Change in Nominal Policy Rate
Stayers
−.0
4−
.03
−.0
2−
.01
0.0
1.0
2.0
3.0
4
050
100
150
200
250
1995 2000 2005 2010 2015year
Change in Debt Growth
Change in Nominal Policy Rate
Movers
(k) Debt growth and nominal interestrate, first differences
−.0
4−
.02
0.0
2.0
4
−50
−25
025
50
1995 2000 2005 2010 2015year
Change in Debt Growth
Change in Real Policy Rate
Stayers
−.0
4−
.02
0.0
2.0
4
050
100
150
200
250
1995 2000 2005 2010 2015year
Change in Debt Growth
Change in Real Policy Rate
Movers
(l) Debt growth and real interest rate,first differences
Gulbrandsen & Natvik (BI) MP Debt NEPR Dec 2019 26 / 32

Debt growth and inflation among movers and stayers
−.0
4−
.03
−.0
2−
.01
0.0
1.0
2.0
3.0
4
−50
000
−25
000
025
000
5000
0
1995 2000 2005 2010 2015year
Change in Debt Growth
Change in Inflation
Stayers
−.0
4−
.03
−.0
2−
.01
0.0
1.0
2.0
3.0
4
050
000
1000
0015
0000
2000
0025
0000
1995 2000 2005 2010 2015year
Change in Debt Growth
Change in Inflation
Movers
Gulbrandsen & Natvik (BI) MP Debt NEPR Dec 2019 27 / 32

Debt-growth and inflation among movers and stayers−
4000
0−
2000
00
2000
040
000
Deb
t Gro
wth
, Cha
nge
−.02 −.01 0 .01 .02 .03Inflation rate, Change
Change in Debt Growth Fitted values
(m) Stayers
050
000
1000
0015
0000
2000
0025
0000
Deb
t Gro
wth
, Cha
nge
−.02 −.01 0 .01 .02 .03Inflation rate, Change
Change in Debt Growth Fitted values
(n) Movers
I “Fisher dynamics” among the stayers
I Note: Remarkably consistent with the historical US macro evidence inMason and Jayadev (AEJ Macro, 2014)
Gulbrandsen & Natvik (BI) MP Debt NEPR Dec 2019 28 / 32

Differencing out omitted variables changes nothingI Omitted variables driving both inflation and debt growth among
stayers?I Difference-in-differences between high DTI and low DTI households
−.0
4−
.02
0.0
2.0
4
−25
0−
200
−15
0−
100
−50
0
1995 2000 2005 2010 2015year
Change Delta Debt (Diff HighDTI−LowDTI)
Change in Inflation Rate
Stayers
Gulbrandsen & Natvik (BI) MP Debt NEPR Dec 2019 29 / 32

Conclusion
I 10 years of evidence: Household debt matters for macro stability– in particular financial crises
I ... so it makes sense for central banks to consider the implications ofmonetary policy for household debt
I ... but it does not follow that monetary policy should target debtseparately from other conventional policy objectives
Gulbrandsen & Natvik (BI) MP Debt NEPR Dec 2019 30 / 32

ConclusionI 10 years of evidence: Household debt matters for macro stability
I Conventional logic about monetary policy and household debt:Intertemporal substitutionI Inconsistent with recent macro evidence on MP and debtI At odds with recent literature on MP and aggregate demand
I Plausible alternative channels: Cash flow effects and debt deflationI Similar to the recent (HANK) literature on MP and aggregate demandI Need for precise models with micro evidence!
I Suggestive micro evidence from Norway:I Debt matters for MP’s cash-flow effects, but less visible effects (if
any?) in the other direction.I Fisherian debt deflation seems prominent
I Preliminary policy conclusion: stick to targeting inflationI ... at a sufficiently high level.
Gulbrandsen & Natvik (BI) MP Debt NEPR Dec 2019 30 / 32

Diff-in-Diff debt growth, p85 minus p15 DTI. Stayers only.
−.0
4−
.02
0.0
2.0
4
−25
0−
200
−15
0−
100
−50
0
1995 2000 2005 2010 2015year
Change Delta Debt (Diff HighDTI−LowDTI)
Change in Nominal Policy Rate
Stayers; Difference btw HighDTI(p84−p86) and LowDTI(p14−p16) with debt>150K and <5mill. Correlation=
Stayers
(o) D-i-d of debt growth and first-differenced nominal rate
−.0
4−
.02
0.0
2.0
4
−25
0−
200
−15
0−
100
−50
0
1995 2000 2005 2010 2015year
Change Delta Debt (Diff HighDTI−LowDTI)
Change in Real Policy Rate
Stayers; Difference btw HighDTI(p84−p86) and LowDTI(p14−p16) with debt>150K and <5mill. Correlation=
Stayers
(p) D-i-d of debt growth and first-differenced real interest rate
Gulbrandsen & Natvik (BI) MP Debt NEPR Dec 2019 31 / 32

Diff-in-diff debt growth, p85 minus p15 DTI. Stayers only.
−25
0−
200
−15
0−
100
−50
Deb
t Gro
wth
, Cha
nge
−.02 −.01 0 .01 .02 .03Inflation rate, Change
Change in Debt Growth, Difference p85−p15, Stayers Fitted values
Gulbrandsen & Natvik (BI) MP Debt NEPR Dec 2019 32 / 32