part i framework - school of arts & sciencesdludden/wdr2001ch1.pdfusing monetary income or...
TRANSCRIPT
PA RT I
Framework

15
CHAPTER 1
The Nature and Evolutionof Poverty
Poverty is pronounced deprivation in well-being.But what precisely is deprivation? The voices of poorpeople bear eloquent testimony to its meaning (box1.1). To be poor is to be hungry, to lack shelter andclothing, to be sick and not cared for, to be illiterateand not schooled. But for poor people, living in povertyis more than this. Poor people are particularly vulnerableto adverse events outside their control. They are oftentreated badly by the institutions of state and society andexcluded from voice and power in those institutions.
Poverty’s many dimensions
This report accepts the now traditional view of poverty(reflected, for example, in World Development Report1990 ) as encompassing not only material deprivation(measured by an appropriate concept of income or con-sumption) but also low achievements in education andhealth. Low levels of education and health are of con-cern in their own right, but they merit special attentionwhen they accompany material deprivation. This re-port also broadens the notion of poverty to include vul-nerability and exposure to risk—and voicelessness andpowerlessness. All these forms of deprivation severely re-
strict what Amartya Sen calls the “capabilities that a per-son has, that is, the substantive freedoms he or she en-joys to lead the kind of life he or she values.”1
This broader approach to deprivation, by giving abetter characterization of the experience of poverty, in-creases our understanding of its causes. This deeper un-derstanding brings to the fore more areas of action andpolicy on the poverty reduction agenda (chapter 2).
Another important reason for considering a broaderrange of dimensions—and hence a broader range ofpolicies—is that the different aspects of poverty interactand reinforce one another in important ways (chap-ter 2). This means that policies do more than simplyadd up. Improving health outcomes not only im-proves well-being but also increases income-earning po-tential. Increasing education not only improveswell-being—it also leads to better health outcomes andto higher incomes. Providing protection for poor peo-ple (reducing vulnerability in dealing with risk) not onlymakes them feel less vulnerable—it also allows themto take advantage of higher-risk, higher-return op-portunities. Increasing poor people’s voice and par-ticipation not only addresses their sense of exclusion—italso leads to better targeting of health and education

⁄
services to their needs. Understanding these comple-mentarities is essential for designing and implement-ing programs and projects that help people escapepoverty.
Measuring poverty in its multipledimensions
Measuring poverty permits an overview of poverty thatgoes beyond individual experiences. It aids the formula-tion and testing of hypotheses on the causes of poverty.It presents an aggregate view of poverty over time. Andit enables a government, or the international community,to set itself measurable targets for judging actions. In whatfollows, the chapter discusses the measurement of incomepoverty and the indicators of education and health—andthen turns to vulnerability and voicelessness.
Income povertyUsing monetary income or consumption to identify andmeasure poverty has a long tradition. Though separated
by a century, Seebohm Rowntree’s classic study of povertyin the English city of York in 1899 and the World Bank’scurrent estimates of global income poverty share a com-mon approach and a common method (box 1.2). Basedon household income and expenditure surveys, the ap-proach has become the workhorse of quantitative povertyanalysis and policy discourse. It has several strengths.Because it is based on nationally representative samples,it allows inferences about the conditions and evolutionof poverty at the national level. Moreover, since house-hold surveys collect information beyond monetary incomeor consumption, the approach makes it possible to ob-tain a broader picture of well-being and poverty, inves-tigate the relationships among different dimensions ofpoverty, and test hypotheses on the likely impact of pol-icy interventions.
Poverty measures based on income or consumption arenot problem free. Survey design varies between countriesand over time, often making comparisons difficult. Forexample, some countries ask respondents about theirfood spending over the past month, while others do so
Box 1.1
Poverty in the voices of poor people
Poor people in 60 countries were asked to analyze and sharetheir ideas of well-being (a good experience of life) and “ill-being”(a bad experience of life).
Well-being was variously described as happiness, harmony,peace, freedom from anxiety, and peace of mind. In Russia peo-ple say, “Well-being is a life free from daily worries about lack ofmoney.” In Bangladesh, “to have a life free from anxiety.” In Brazil,“not having to go through so many rough spots.”
People describe ill-being as lack of material things, as bad ex-periences, and as bad feelings about oneself. A group of youngmen in Jamaica ranks lack of self-confidence as the second biggestimpact of poverty: “Poverty means we don’t believe in self, wehardly travel out of the community—so frustrated, just locked upin a house all day.”
Although the nature of ill-being and poverty varies among lo-cations and people—something that policy responses must takeinto account—there is a striking commonality across countries. Notsurprising, material well-being turns out to be very important.Lack of food, shelter, and clothing is mentioned everywhere ascritical. In Kenya a man says: “Don’t ask me what poverty is be-cause you have met it outside my house. Look at the house andcount the number of holes. Look at my utensils and the clothes Iam wearing. Look at everything and write what you see. What yousee is poverty.”
Alongside the material, physical well-being features promi-nently in the characterizations of poverty. And the two meld to-gether when lack of food leads to ill health—or when ill health leadsto an inability to earn income. People speak about the importanceof looking well fed. In Ethiopia poor people say, “We are skinny,”“We are deprived and pale,” and speak of life that “makes youolder than your age.”
Security of income is also closely tied to health. But insecu-rity extends beyond ill health. Crime and violence are often men-tioned by poor people. In Ethiopia women say, “We live hour tohour,” worrying about whether it will rain. An Argentine says, “Youhave work, and you are fine. If not, you starve. That’s how it is.”
Two social aspects of ill-being and poverty also emerged. For manypoor people, well-being means the freedom of choice and action andthe power to control one’s life. A young woman in Jamaica says thatpoverty is “like living in jail, living in bondage, waiting to be free.”
Linked to these feelings are definitions of well-being as socialwell-being and comments on the stigma of poverty. As an oldwoman in Bulgaria says, “To be well means to see your grand-children happy and well dressed and to know that your childrenhave settled down; to be able to give them food and moneywhenever they come to see you, and not to ask them for help andmoney.” A Somali proverb captures the other side: “Prolonged sick-ness and persistent poverty cause people to hate you.”
Source: Narayan, Chambers, Shah, and Petesch 2000; Narayan, Patel, Schafft, Rademacher, and Koch-Schulte 2000.

for the past week. One-month recall data tend to resultin higher poverty estimates than one-week recall data.Converting the information on income or consumptioncollected in household surveys into measures of well-being requires many assumptions, such as in deciding howto treat measurement errors and how to allow for house-
hold size and composition in converting household datainto measures for individuals. Poverty estimates are verysensitive to these assumptions (see, for example, the dis-cussion in box 1.8, later in the chapter).2
Moreover, income or consumption data collected at thehousehold level have a basic shortcoming: they cannot re-
Box 1.2
Measuring income poverty: 1899 and 1998
In a classic study first published in 1901, Seebohm Rowntree cal-culated that 10 percent of the population of the English city of Yorkin 1899 was living in poverty (below minimum needed expendi-tures). As we enter the next century, the World Bank calculatesthat a fourth of the population of the developing world—about 1.2billion people—is living in poverty (below $1 a day). These two cal-culations of income poverty are separated by a century and havevery different coverage. Nevertheless, the basic concepts and meth-ods they embody have strong similarities.
Rowntree’s approach
Rowntree’s method was to conduct a survey covering nearlyevery working-class family in York to collect information on earn-ings and expenditures. He then defined poverty as a level of totalearnings insufficient to obtain the minimum necessities for the main-tenance of “merely physical efficiency,” including food, rent, andother items. He calculated that for a family of five—a father,mother, and three children—the minimum weekly expenditure tomaintain physical efficiency was 21 shillings, 8 pence; he proposedother amounts for families of different size and composition.Comparing these poverty lines with family earnings, he arrived athis poverty estimate.
The World Bank’s approach
The World Bank has been estimating global income poverty figuressince 1990. The latest round of estimation, in October 1999, usednew sample survey data and price information to obtain comparablefigures for 1987, 1990, 1993, 1996, and 1998 (the figures for 1998are preliminary estimates). The method is the same as in past es-timates (World Bank 1990, 1996d).
Consumption. Poverty estimates are based on consumptionor income data collected through household surveys. Data for 96countries, from a total of 265 nationally representative surveys,corresponding to 88 percent of the developing world’s people, arenow available, up from only 22 countries in 1990. Of particular noteis the increase in the share of people covered in Africa from 66to 73 percent, a result of extensive efforts to improve householddata in the region.
Consumption is conventionally viewed as the preferred wel-fare indicator, for practical reasons of reliability and because con-sumption is thought to better capture long-run welfare levels thancurrent income. Where survey data were available on incomes butnot on consumption, consumption was estimated by multiplyingall incomes by the share of aggregate private consumption in na-
tional income based on national accounts data. This procedure, un-changed from past exercises, scales back income to obtain con-sumption but leaves the distribution unchanged.
Prices. To compare consumption levels across countries, es-timates of price levels are needed, and the World Bank’s purchasingpower parity (PPP) estimates for 1993 were used. These estimatesare based on new price data generated by the International Com-parison Program (ICP), which now covers 110 countries, up from64 in 1985, and a more comprehensive set of commodities.
Poverty lines. The 1990 calculations of the international povertylines had to be updated using 1993 price data and the 1993 PPPestimates. In 1990 national poverty lines for 33 countries were con-verted into 1985 PPP prices, and the most typical line among thelow-income countries for which poverty lines were available wasselected. In 1999 the same lines were converted into 1993 PPPprices, and the new line was obtained as the median of the 10 low-est poverty lines. That line is equal to $1.08 a day in 1993 PPP terms(referred to as “$1 a day” in the text). This line has a similar pur-chasing power to the $1 a day line in 1985 PPP prices, in termsof the command over domestic goods. The upper poverty line (re-ferred to as “$2 a day”) was calculated by doubling the amountof the lower poverty line, as in 1990, reflecting poverty lines morecommonly used in lower-middle-income countries.
Estimates for 1998. To obtain consumption levels for 1998where survey data were not yet available, estimated growth ratesof per capita private consumption from national accounts statisticswere used to update consumption data from the latest survey yearto 1998. This meant assuming that the distribution of consumptiondid not change from the time of the last survey to 1998. The percapita private consumption growth rates came from estimatesbased on the model used for other World Bank forecasts (WorldBank 1999j). Surveys were available for 1997 or 1998 only for Be-larus, China, India, Jordan, Latvia, Nigeria, Pakistan, Panama, Rus-sia, Thailand, and Yemen. So the 1998 figures should be consideredtentative, and trends should be interpreted cautiously, particularlyin light of the controversy surrounding Indian data (see box 1.8 laterin the chapter).
Country-specific poverty lines. The $1 and $2 a day poverty es-timates described here are useful only as indicators of globalprogress, not to assess progress at the country level or to guidecountry policy and program formulation. Country-specific povertylines, reflecting what it means to be poor in each country’s situ-ation and not affected by international price comparisons, areused in country-level analysis.
Source: Chen and Ravallion 2000.

⁄
veal inequality within the household, so they can under-state overall inequality and poverty. One study that dis-aggregated household consumption by individual membersfound that relying only on household information couldlead to an understatement of inequality and poverty bymore than 25 percent.3 In particular, the conventionalhousehold survey approach does not allow direct mea-surement of income or consumption poverty amongwomen. That is one reason why data on education andhealth, which can be collected at the individual level, areso valuable—they allow a gender-disaggregated perspec-tive on key dimensions of poverty.
A key building block in developing income and con-sumption measures of poverty is the poverty line—thecritical cutoff in income or consumption below which anindividual or household is determined to be poor. The in-ternationally comparable lines are useful for producingglobal aggregates of poverty (see box 1.2). In principle, theytest for the ability to purchase a basket of commoditiesthat is roughly similar across the world. But such a uni-versal line is generally not suitable for the analysis ofpoverty within a country. For that purpose, a country-specific poverty line needs to be constructed, reflecting thecountry’s economic and social circumstances. Similarly, thepoverty line may need to be adjusted for different areas(such as urban and rural) within the country if prices oraccess to goods and services differs.4 The construction ofcountry profiles based on these country-specific povertylines is now common practice.
Once a poverty line has been specified, it remains tobe decided how to assess the extent of poverty in a par-ticular setting. The most straightforward way to measurepoverty is to calculate the percentage of the populationwith income or consumption levels below the poverty line.This “headcount” measure is by far the most commonlycalculated measure of poverty. But it has decided disad-vantages. It fails to reflect the fact that among poor peo-ple there may be wide differences in income levels, withsome people located just below the poverty line and oth-ers experiencing far greater shortfalls. Policymakers seek-ing to make the largest possible impact on the headcountmeasure might be tempted to direct their poverty allevi-ation resources to those closest to the poverty line (andtherefore least poor).
Other poverty measures, which take into account thedistance of poor people from the poverty line (the povertygap) and the degree of income inequality among poor peo-ple (the squared poverty gap), can be readily calculated.
In comparing poverty estimates across countries or overtime, it is important to check the extent to which con-clusions vary with the selection of poverty measure.5
Health and education Measuring deprivation in the dimensions of health andeducation has a tradition that can be traced back to suchclassical economists as Malthus, Ricardo, and Marx. De-spite Rowntree’s primarily income-based approach tomeasuring poverty, he devoted an entire chapter of hisstudy to the relation of poverty to health and went on toargue that the death rate is the best instrument for mea-suring the variations in the physical well-being of peo-ple.6 Classifying his sample into three groups ranging frompoorest to richest, he found that the mortality rate wasmore than twice as high among the very poor as amongthe best paid sections of the working classes. Calculatinginfant mortality, he found that in the poorest areas onechild out of every four born dies before the age of 12months. According to this argument, mortality could beused as an indicator both of consumption poverty andof ill-being in a broader sense.
The tradition of measuring deprivation in health andeducation is well reflected in the international develop-ment goals (see box 2 in the overview). But data on thesenonincome indicators have their own problems. For ex-ample, infant and under-five mortality rates derivedmostly from census and survey information are availablefor most countries only at periodic intervals.7 A completevital registration system would be the best source formortality data, but such a system exists in only a few de-veloping countries. For the period between censuses orsurveys, estimates of vital rates are derived by interpola-tion and extrapolation based on observed trends andmodels, such as life tables that estimate survival from oneyear to the next. Infant mortality rates are available formost developing countries for only one year since 1990,and the year differs because surveys are conducted atdifferent times. The data situation is even worse for lifeexpectancy, because it is often not measured directly.
Education data are also far from satisfactory. Themost commonly available indicator, the gross primary en-rollment rate, suffers from serious conceptual short-comings. The greatest is that school enrollment is onlya proxy for actual school attendance. Moreover, the grossprimary enrollment rate can rise if grade repetitions in-crease. The much-preferred net primary enrollment rate(showing the ratio of enrolled primary-school-age children

to all primary-school-age children) is available for onlyaround 50 developing countries for 1990–97—notenough to make reliable aggregations by region. A num-ber of ongoing survey initiatives, however, are improv-ing the quantity and quality of data on health andeducation.
VulnerabilityIn the dimensions of income and health, vulnerability isthe risk that a household or individual will experience anepisode of income or health poverty over time. But vul-nerability also means the probability of being exposed toa number of other risks (violence, crime, natural disas-ters, being pulled out of school).
Measuring vulnerability is especially difficult: since theconcept is dynamic, it cannot be measured merely by ob-serving households once. Only with household paneldata—that is, household surveys that follow the samehouseholds over several years—can the basic informationbe gathered to capture and quantify the volatility and vul-nerability that poor households say is so important. More-over, people’s movements in and out of poverty areinformative about vulnerability only after the fact. The chal-lenge is to find indicators of vulnerability that can iden-tify at-risk households and populations beforehand.
Many indicators of vulnerability have been proposedover the years, but there is now a growing consensusthat it is neither feasible nor desirable to capture vul-nerability in a single indicator. If the government providesan effective workfare program, for example, householdsmay do less than they otherwise would to diversify theirincome or build up their assets. Similarly, a householdthat is part of a reliable network of mutual support maysee less need for large buffer stocks of food or cattle. Soa vulnerability measure based solely on household assets—or on income and its sources—may not reflect the house-hold’s true exposure to risk (box 1.3).
Voicelessness and powerlessnessVoicelessness and powerlessness can be measured usinga combination of participatory methods (box 1.4), polls,and national surveys on qualitative variables such as theextent of civil and political liberties (box 1.5). However,measuring these dimensions of poverty in an accurate, ro-bust, and consistent way so that comparisons can bemade across countries and over time will require con-siderable additional efforts on both the methodologicaland data-gathering fronts.
Multidimensionality and measuring progressDefining poverty as multidimensional raises the ques-tion of how to measure overall poverty and how to com-pare achievements in the different dimensions. Onedimension might move in a different direction from an-other. Health could improve while income worsens. Oran individual might be “income poor” but not “healthpoor.” Or one country might show greater improvementin health than in vulnerability—while another shows theconverse.
This brings to the fore the relative value of the differ-ent dimensions: how much income are people willing togive up for, say, a unit of improvement in health or in voice?In other words, what weights can be assigned to the dif-ferent dimensions to allow comparisons across countries,households, or individuals and over time? There are no easyanswers.
One approach to addressing comparability is to definea multidimensional welfare function or a compositeindex. An alternative is to define as poor anybody whois poor in any one of the dimensions—without attempt-ing to estimate tradeoffs among the dimensions—oranybody who is poor in all dimensions, and to define theintensity of poverty accordingly (box 1.6). This report doesnot try to define a composite index or to measure trade-offs among dimensions. Instead, it focuses on depriva-tion in different dimensions and, in particular, on themultiple deprivations experienced by the income-poor.This is a necessary first step in developing a comprehensivemultidimensional framework.
How should indicators be selected to monitor progress?The international development goals are a good startingpoint. But in practice, these goals will have to be adapted(by lengthening or shortening the time span, for exam-ple) and modified (increasing the number of dimen-sions), depending on context. The specific goals willhave to emerge from a participatory process in which gov-ernments and civil society agree on priorities. This processis already under way in many countries, and multilateralorganizations are helping with resources and technical as-sistance (box 1.7).8
Investing in measurement and monitoringMeasurements of poverty thus must cover many dimen-sions. So far, the income and consumption dimension hasreceived most attention. Thanks to efforts over the past20 years by such international agencies as the United Na-tions, the World Bank, and the regional development
⁄
Box 1.3
Measuring vulnerability
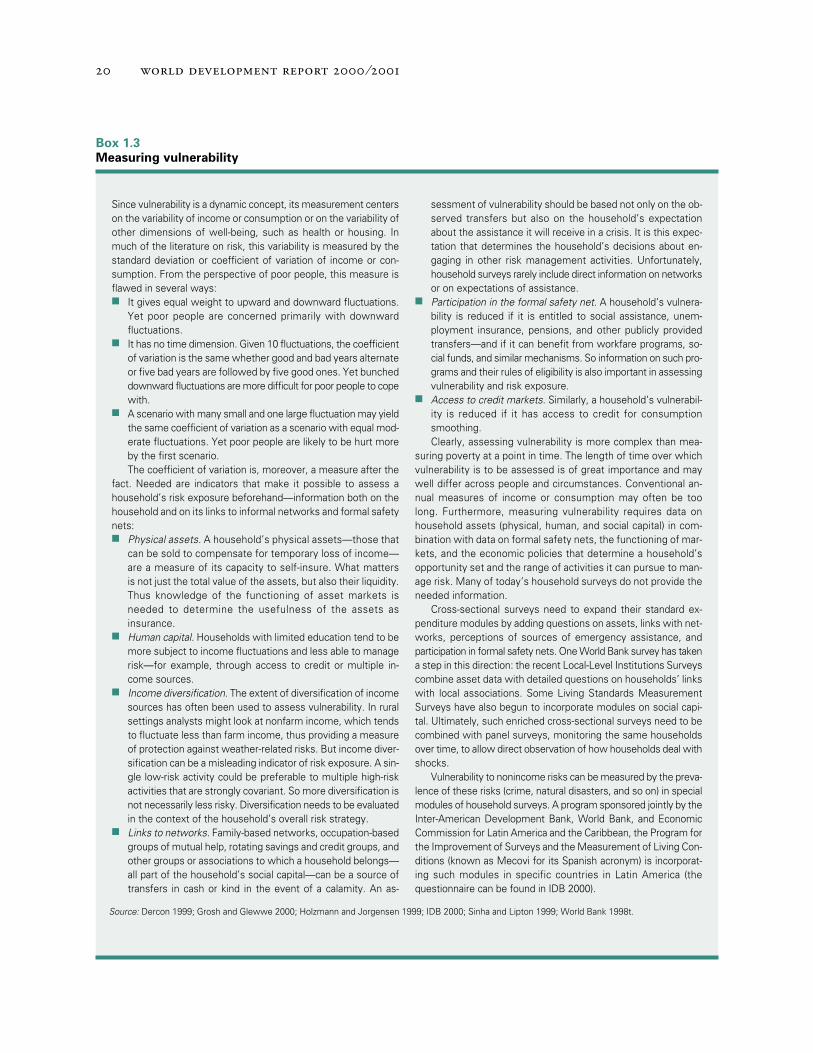
Since vulnerability is a dynamic concept, its measurement centerson the variability of income or consumption or on the variability ofother dimensions of well-being, such as health or housing. Inmuch of the literature on risk, this variability is measured by thestandard deviation or coefficient of variation of income or con-sumption. From the perspective of poor people, this measure isflawed in several ways: ■ It gives equal weight to upward and downward fluctuations.
Yet poor people are concerned primarily with downwardfluctuations.
■ It has no time dimension. Given 10 fluctuations, the coefficientof variation is the same whether good and bad years alternateor five bad years are followed by five good ones. Yet buncheddownward fluctuations are more difficult for poor people to copewith.
■ A scenario with many small and one large fluctuation may yieldthe same coefficient of variation as a scenario with equal mod-erate fluctuations. Yet poor people are likely to be hurt moreby the first scenario. The coefficient of variation is, moreover, a measure after the
fact. Needed are indicators that make it possible to assess ahousehold’s risk exposure beforehand—information both on thehousehold and on its links to informal networks and formal safetynets:■ Physical assets. A household’s physical assets—those that
can be sold to compensate for temporary loss of income—are a measure of its capacity to self-insure. What mattersis not just the total value of the assets, but also their liquidity.Thus knowledge of the functioning of asset markets isneeded to determine the usefulness of the assets asinsurance.
■ Human capital. Households with limited education tend to bemore subject to income fluctuations and less able to managerisk—for example, through access to credit or multiple in-come sources.
■ Income diversification. The extent of diversification of incomesources has often been used to assess vulnerability. In ruralsettings analysts might look at nonfarm income, which tendsto fluctuate less than farm income, thus providing a measureof protection against weather-related risks. But income diver-sification can be a misleading indicator of risk exposure. A sin-gle low-risk activity could be preferable to multiple high-riskactivities that are strongly covariant. So more diversification isnot necessarily less risky. Diversification needs to be evaluatedin the context of the household’s overall risk strategy.
■ Links to networks. Family-based networks, occupation-basedgroups of mutual help, rotating savings and credit groups, andother groups or associations to which a household belongs—all part of the household’s social capital—can be a source oftransfers in cash or kind in the event of a calamity. An as-
sessment of vulnerability should be based not only on the ob-served transfers but also on the household’s expectationabout the assistance it will receive in a crisis. It is this expec-tation that determines the household’s decisions about en-gaging in other risk management activities. Unfortunately,household surveys rarely include direct information on networksor on expectations of assistance.
■ Participation in the formal safety net. A household’s vulnera-bility is reduced if it is entitled to social assistance, unem-ployment insurance, pensions, and other publicly providedtransfers—and if it can benefit from workfare programs, so-cial funds, and similar mechanisms. So information on such pro-grams and their rules of eligibility is also important in assessingvulnerability and risk exposure.
■ Access to credit markets. Similarly, a household’s vulnerabil-ity is reduced if it has access to credit for consumptionsmoothing.Clearly, assessing vulnerability is more complex than mea-
suring poverty at a point in time. The length of time over whichvulnerability is to be assessed is of great importance and maywell differ across people and circumstances. Conventional an-nual measures of income or consumption may often be toolong. Furthermore, measuring vulnerability requires data onhousehold assets (physical, human, and social capital) in com-bination with data on formal safety nets, the functioning of mar-kets, and the economic policies that determine a household’sopportunity set and the range of activities it can pursue to man-age risk. Many of today’s household surveys do not provide theneeded information.
Cross-sectional surveys need to expand their standard ex-penditure modules by adding questions on assets, links with net-works, perceptions of sources of emergency assistance, andparticipation in formal safety nets. One World Bank survey has takena step in this direction: the recent Local-Level Institutions Surveyscombine asset data with detailed questions on households’ linkswith local associations. Some Living Standards MeasurementSurveys have also begun to incorporate modules on social capi-tal. Ultimately, such enriched cross-sectional surveys need to becombined with panel surveys, monitoring the same householdsover time, to allow direct observation of how households deal withshocks.
Vulnerability to nonincome risks can be measured by the preva-lence of these risks (crime, natural disasters, and so on) in specialmodules of household surveys. A program sponsored jointly by theInter-American Development Bank, World Bank, and EconomicCommission for Latin America and the Caribbean, the Program forthe Improvement of Surveys and the Measurement of Living Con-ditions (known as Mecovi for its Spanish acronym) is incorporat-ing such modules in specific countries in Latin America (thequestionnaire can be found in IDB 2000).
Source: Dercon 1999; Grosh and Glewwe 2000; Holzmann and Jorgensen 1999; IDB 2000; Sinha and Lipton 1999; World Bank 1998t.

banks, 85 percent of the developing world’s populationlives in countries with at least two household income orexpenditure surveys. These surveys need to be improvedgreatly and made more accessible to the public. Effortssuch as the Living Standards Measurement Surveys at theWorld Bank and Mecovi9 in Latin America (see box 1.3)
need to be supported. But the efforts need to go muchfarther than this, focusing on improving information oneducation and health indicators. The Demographic andHealth Surveys need to be continued and expanded. Asimportant are efforts to expand and improve the very smalldatabase on indicators of vulnerability and on voiceless-ness and powerlessness.
The evolution of poverty
What are the magnitudes and patterns of poverty in thedeveloping world? How has poverty evolved over thepast decade? The answers to these questions are impor-tant in framing the challenge of attacking poverty.
The rest of this chapter describes global trends in theincome (consumption), education, and health dimensionsof poverty and shows the large diversity of outcomes—across dimensions, regions, countries, communities,households, and individuals. The differences in perfor-mance reflect differences in growth, in the distributionof assets, in the quality and responsiveness of state insti-tutions, in the degree of inclusiveness in societies (lowersocial barriers for women, ethnic minorities, and the so-cially disadvantaged more generally), and in how coun-tries and people manage risks.
Highlighting the diversity in outcomes is importantfor at least two reasons. It allows the identification ofsuccesses and failures in poverty reduction and therebyenhances the understanding of what causes povertyand how best to reduce it. And it brings to the fore thefact that aggregate trends can hide significant differencesin poverty outcomes—for different ethnic groups, re-gions, and sectors within a country, for example. Aware-ness of these differences will help policymakers setpriorities, concentrating actions where they are mostneeded.
Global and regional patterns: income povertyand social indicatorsBetween 1987 and 1998 the share of the population indeveloping and transition economies living on less than$1 a day fell from 28 percent to 24 percent (table 1.1).This decline is below the rate needed to meet the inter-national development goal of reducing extreme incomepoverty by half by 2015 (see box 2 in the overview).
Because of population growth, the number of peoplein poverty hardly changed. But there are large regionalvariations in performance. East Asia and the Middle East
Box 1.4
Measuring voice and power using participatory
methods
In the Voices of the Poor study, in small group discussions, poorpeople discussed the range of institutions important in their dailylives and then identified the criteria that were important in rat-ing institutions. Once criteria were identified and agreed on,groups rated institutions on these criteria using pebbles, beans,or other local material. Characteristics included trust, participa-tion, accountability, ability to build unity, responsiveness, respect,fairness and caring, and listening and loving. Poor people definedthese criteria in clear and simple terms before scoring institutions.
Box 1.5
Measuring governance: participatory methods
and cross-country surveys
Can countrywide information on voice and participation beobtained systematically to assess their role in developmentand to compare countries? A recent study brought togethera database covering 178 countries to assess the wider issueof governance, with voice and accountability measured byindicators of civil liberties, political rights, the transparencyof the legal system, and the existence of independent media.
The data came from two types of sources: polls of expertson the country or region (including agencies specializing in riskrating, opinion surveys, and political analysis) and cross-countrysurveys of residents by international organizations and NGOs.Indicators from the two types of data tend to correlate strongly,increasing confidence in the results. The study found a strongpositive association between voice and accountability andfive other clusters of governance indicators and three devel-opment outcomes: per capita income, infant mortality, and adultliteracy (Kaufmann, Kraay, and Zoido-Lobaton 1999).
The study also highlighted major weaknesses in existingdatabases on voice, empowerment, and governance. Mar-gins of error in the results are wide. Significant investmentis needed in developing and undertaking surveys, with com-parable methods across countries, to collect data on this im-portant dimension of poverty and well-being. National surveyson voice and empowerment would complement participatoryassessments. In designing the surveys, care would have tobe taken to ensure that they are capable of capturing differ-ences by region, gender, ethnicity, and so on. Such differencesare important not just in material poverty but in voice and em-powerment as well.

⁄
and North Africa have reduced their numbers in poverty—East Asia dramatically so. But in all other regions the num-ber of people living on less than $1 a day has risen. InSouth Asia, for example, the number of poor people rose
over the decade, from 474 million to 522 million, eventhough the share of people in poverty fell from 45 per-cent to 40 percent. In Latin America and the Caribbeanthe number of poor people rose by about 20 percent.
Box 1.6
Multidimensionality: dealing with aggregation
There are several possible approaches to aggregating measuresof the different dimensions of poverty and well-being.
Welfare function. A welfare function approach includes variousdimensions of well-being and defines poor people as all individualsbelow a specified minimum level of total welfare (Tsui 1995, 1997;Bourguignon and Chakravarty 1998). The welfare function approachallows for tradeoffs, using individuals’ own choices for comparingsituations and for assessing how much improvement is needed inone dimension to maintain welfare if another dimension worsens.The difficulty is finding a suitable welfare function for comparisonsbetween nonmarket elements of individual welfare. While using amoney metric and total expenditure is appropriate for assessing howmany additional eggs or apples a person would have to consumeto accept less rice, it is less reliable for such important dimensionsof welfare as social exclusion and political voicelessness. Moreover,choosing appropriate “weights” to form a single aggregate of thesenonmarket elements of individual welfare from existing data has sofar proved to be an insurmountable challenge.
Composite index. An alternative to using weights estimatedfrom people’s observed choices is to simply impose weights, asa simplistic, special-case application of the welfare function ap-proach. There have been several well-known efforts, such as thephysical quality of life index (combining the literacy rate, the in-fant mortality rate, and life expectancy; Morris 1979) and thehuman development index (UNDP 1999a). While easy to use, theseindexes do not really solve the intractable weighting problem be-cause they assign arbitrary (usually equal) weights to each com-ponent (Ravallion 1997b).
Alternative aggregation rules. If the objective is to measurethe number of poor people, another possibility is to count as pooreverybody who is poor in any one of the dimensions (see all shaded
areas in figure). This method adds value because it goes beyondincome. But it can be criticized because it would imply, for ex-ample, that a person who has very high income but is uneducatedis poor. An alternative is to count as poor everybody who is poorin all dimensions (see dark shaded area in figure). In both casesthe complications of making comparisons remain when onewants to measure not only the extent but also the intensity ofpoverty of individuals with multiple deprivations or with depriva-tions in different dimensions.
The recent poverty reduction strategy paper for Uganda presentsa clear statement of the poverty reduction goals that the govern-ment has set. The goals focus on reducing absolute incomepoverty to 10 percent by 2017 and achieving universal primary en-rollment (along with higher primary completion rates and educa-tional achievement) by 2004–05. The government also set a seriesof other human development goals for 2004–05:■ Reducing the under-five mortality rate to no more than 103 per
1,000 live births.
■ Cutting HIV prevalence by 35 percent.■ Reducing the incidence of stunting to 28 percent.■ Reducing total fertility to 5.4 births per woman.
The poverty reduction strategy paper outlines the govern-ment’s approach to achieving these goals, with well-developed in-terventions in four broad areas: creating a framework for economicgrowth and transformation, ensuring good governance and security,directly increasing the ability of poor people to raise their incomes,and directly improving the quality of life of poor people.
Alternative aggregation rules to measurethe multiple dimensions of poverty
Health
Income
Income-poor
Health-poor
Income-and
health-poor
H
Y
Note: H is the threshold defining the health-poor, and Y that defining the income-poor.
Box 1.7
Uganda’s poverty reduction goals
Source: IDA 2000.

Two regions fared particularly badly. In Europe andCentral Asia the number in poverty soared from 1.1 mil-lion to 24 million. In Sub-Saharan Africa the number ofpoor people increased from an already high 217 millionto 291 million over the same period, leaving almost halfthe residents of that continent poor.
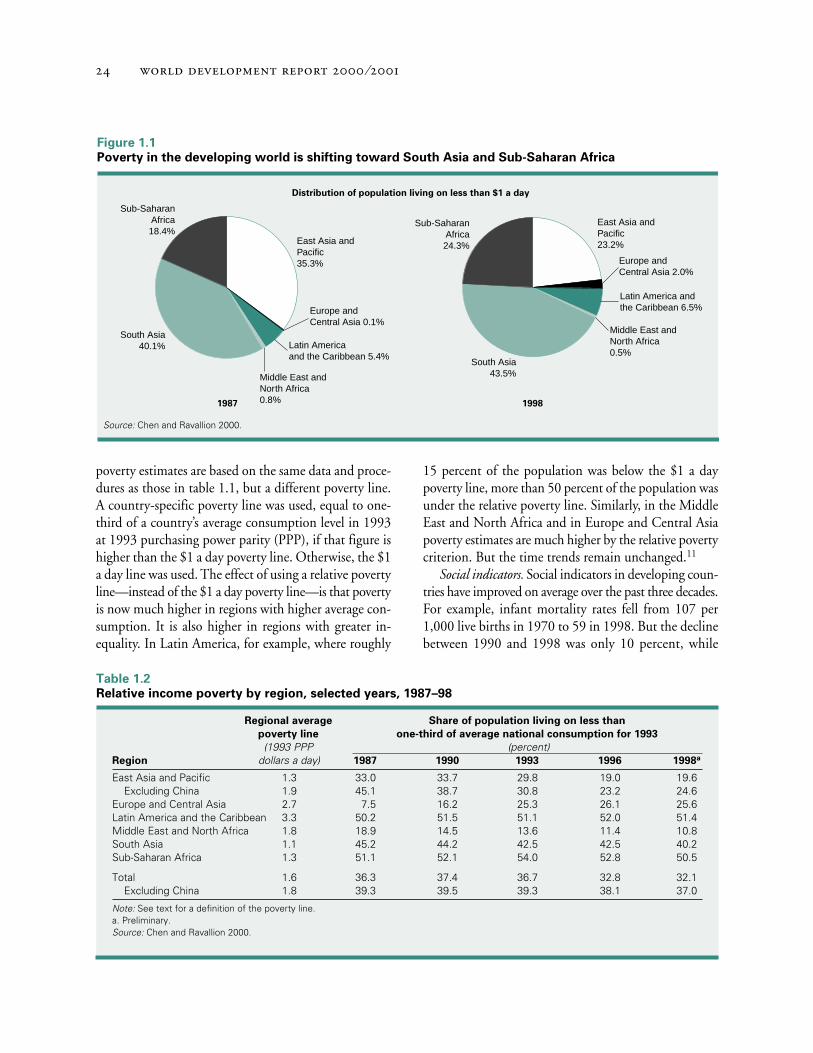
These variations in regional performance are leadingto a shift in the geographical distribution of poverty. In1998 South Asia and Sub-Saharan Africa accountedfor around 70 percent of the population living on lessthan $1 a day, up 10 percentage points from 1987 (fig-ure 1.1).
While these numbers provide a sense of broad trends,they should be treated with caution in light of the short-comings of the data mentioned above and the fact that
figures for 1998 are tentative because of the limited num-ber of surveys available (see box 1.2).
Relative poverty. The poverty estimates in table 1.1 arebased on a poverty line that reflects what it means to bepoor in the world’s poorest countries (see box 1.2). Thisdefinition judges poverty by standards common in SouthAsia and much of Sub-Saharan Africa, regardless of theregion for which poverty is being measured. An alterna-tive definition of poverty—expounded by the British so-ciologist Peter Townsend, among others—is a lack of theresources required to participate in activities and to enjoyliving standards that are customary or widely accepted inthe society in which poverty is being measured.10
Table 1.2 presents estimates of poverty based on a com-bination of absolute and relative poverty concepts. The
Table 1.1
Income poverty by region, selected years, 1987–98
Population
covered by
at least People living on less than $1 a day
one survey (millions)Region (percent) 1987 1990 1993 1996 1998a
East Asia and Pacific 90.8 417.5 452.4 431.9 265.1 278.3Excluding China 71.1 114.1 92.0 83.5 55.1 65.1
Europe and Central Asia 81.7 1.1 7.1 18.3 23.8 24.0Latin America and the Caribbean 88.0 63.7 73.8 70.8 76.0 78.2Middle East and North Africa 52.5 9.3 5.7 5.0 5.0 5.5South Asia 97.9 474.4 495.1 505.1 531.7 522.0Sub-Saharan Africa 72.9 217.2 242.3 273.3 289.0 290.9
Total 88.1 1,183.2 1,276.4 1,304.3 1,190.6 1,198.9Excluding China 84.2 879.8 915.9 955.9 980.5 985.7
Share of population living on less than $1 a day
(percent)Region 1987 1990 1993 1996 1998a
East Asia and Pacific 26.6 27.6 25.2 14.9 15.3Excluding China 23.9 18.5 15.9 10.0 11.3
Europe and Central Asia 0.2 1.6 4.0 5.1 5.1Latin America and the Caribbean 15.3 16.8 15.3 15.6 15.6Middle East and North Africa 4.3 2.4 1.9 1.8 1.9South Asia 44.9 44.0 42.4 42.3 40.0Sub-Saharan Africa 46.6 47.7 49.7 48.5 46.3
Total 28.3 29.0 28.1 24.5 24.0Excluding China 28.5 28.1 27.7 27.0 26.2
Note: The poverty line is $1.08 a day at 1993 PPP. Poverty estimates are based on income or consumption data from the countries in eachregion for which at least one survey was available during 1985–98. Where survey years do not coincide with the years in the table, theestimates were adjusted using the closest available survey and applying the consumption growth rate from national accounts. Using theassumption that the sample of countries covered by surveys is representative of the region as a whole, the number of poor people was thenestimated by region. This assumption is obviously less robust in the regions with the lowest survey coverage. For further details on data andmethodology see Chen and Ravallion (2000).a. Preliminary.Source: World Bank 2000s.
⁄
poverty estimates are based on the same data and proce-dures as those in table 1.1, but a different poverty line.A country-specific poverty line was used, equal to one-third of a country’s average consumption level in 1993at 1993 purchasing power parity (PPP), if that figure ishigher than the $1 a day poverty line. Otherwise, the $1a day line was used. The effect of using a relative povertyline—instead of the $1 a day poverty line—is that povertyis now much higher in regions with higher average con-sumption. It is also higher in regions with greater in-equality. In Latin America, for example, where roughly
15 percent of the population was below the $1 a daypoverty line, more than 50 percent of the population wasunder the relative poverty line. Similarly, in the MiddleEast and North Africa and in Europe and Central Asiapoverty estimates are much higher by the relative povertycriterion. But the time trends remain unchanged.11
Social indicators. Social indicators in developing coun-tries have improved on average over the past three decades.For example, infant mortality rates fell from 107 per1,000 live births in 1970 to 59 in 1998. But the declinebetween 1990 and 1998 was only 10 percent, while
Table 1.2
Relative income poverty by region, selected years, 1987–98
Regional average Share of population living on less than
poverty line one-third of average national consumption for 1993
(1993 PPP (percent)Region dollars a day) 1987 1990 1993 1996 1998a
East Asia and Pacific 1.3 33.0 33.7 29.8 19.0 19.6Excluding China 1.9 45.1 38.7 30.8 23.2 24.6
Europe and Central Asia 2.7 7.5 16.2 25.3 26.1 25.6Latin America and the Caribbean 3.3 50.2 51.5 51.1 52.0 51.4Middle East and North Africa 1.8 18.9 14.5 13.6 11.4 10.8South Asia 1.1 45.2 44.2 42.5 42.5 40.2Sub-Saharan Africa 1.3 51.1 52.1 54.0 52.8 50.5
Total 1.6 36.3 37.4 36.7 32.8 32.1Excluding China 1.8 39.3 39.5 39.3 38.1 37.0
Note: See text for a definition of the poverty line.a. Preliminary.Source: Chen and Ravallion 2000.
Figure 1.1
Poverty in the developing world is shifting toward South Asia and Sub-Saharan Africa
Distribution of population living on less than $1 a day
Source: Chen and Ravallion 2000.
Sub-SaharanAfrica18.4%
South Asia40.1%
Middle East andNorth Africa0.8%
Latin Americaand the Caribbean 5.4%
Europe andCentral Asia 0.1%
East Asia andPacific35.3%
Sub-SaharanAfrica24.3%
South Asia43.5%
Middle East andNorth Africa0.5%
Latin America andthe Caribbean 6.5%
Europe andCentral Asia 2.0%
East Asia andPacific23.2%
1987 1998
meeting the international development goal would haverequired 30 percent.
These aggregate figures mask wide regional disparities.Life expectancy in Sub-Saharan Africa in 1997 was stillonly 52 years—13 years less than the developing worldaverage—and 25 years—a full generation—less than theOECD average. One of the main causes is the still un-acceptably high infant mortality rate in Sub-SaharanAfrica, 90 per 1,000 live births. The rate is also veryhigh in South Asia (77). Those levels are a far cry fromthe OECD average of 6 per 1,000. The AIDS crisis hasaggravated the situation, leading to rising infant mortalityin several African countries. Between 1990 and 1997 theinfant mortality rate rose from 62 to 74 in Kenya and from52 to 69 in Zimbabwe. Maternal mortality also remainsexceptionally high in the region: of the 12 countries inthe world with rates exceeding 1,000 deaths per 100,000live births, 10 are in Sub-Saharan Africa.
Regional differences are equally obvious in educationindicators. South Asia improved its gross primary en-rollment rate from 77 percent to more than 100 percentin 1982–96. But Sub-Saharan Africa’s rate remained un-changed at 74 percent (between 1982 and 1993 it actu-ally declined). Other education indicators confirm theimportance of regional differences. Almost the entire de-cline in the illiteracy rate in the developing world has beenin East Asia. By contrast, the number of illiterate peopleincreased by 17 million in South Asia and by 3 millionin Sub-Saharan Africa.12 Sub-Saharan Africa also has thelowest net primary enrollment rate.
Variations in poverty across countriesDetailed studies using national income poverty lines andnational-level social indicators show equally large varia-tions in poverty performance across countries withineach region.
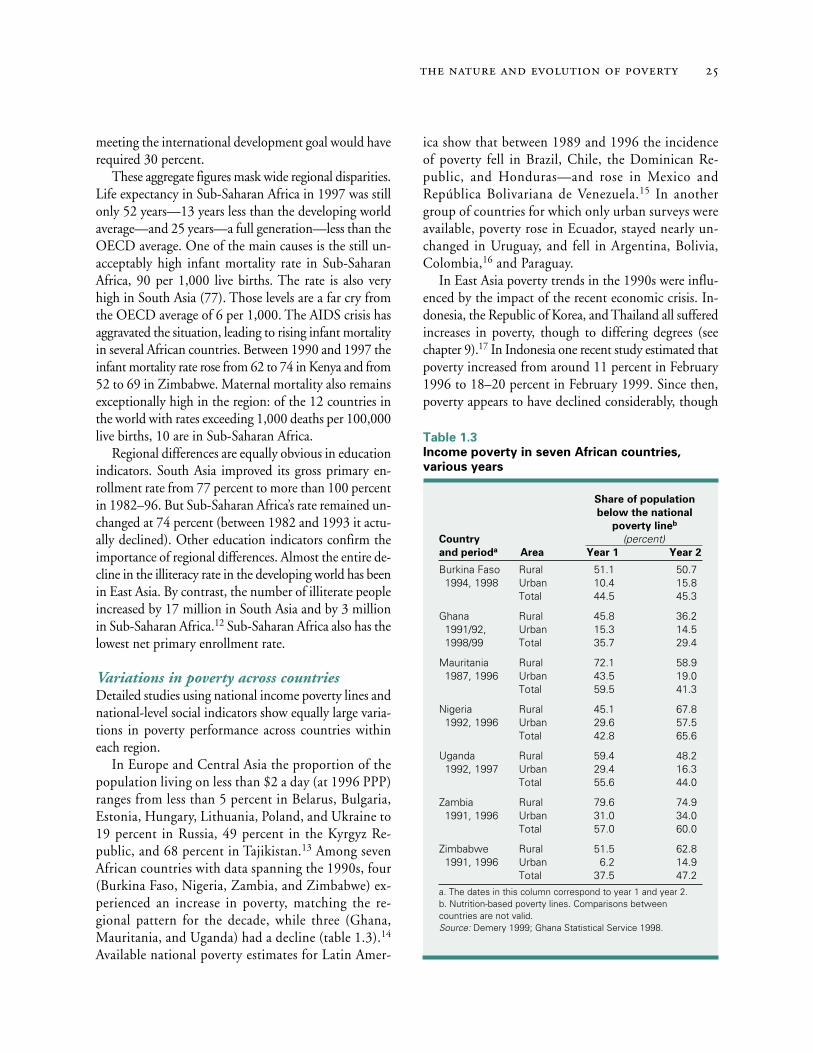
In Europe and Central Asia the proportion of thepopulation living on less than $2 a day (at 1996 PPP)ranges from less than 5 percent in Belarus, Bulgaria,Estonia, Hungary, Lithuania, Poland, and Ukraine to19 percent in Russia, 49 percent in the Kyrgyz Re-public, and 68 percent in Tajikistan.13 Among sevenAfrican countries with data spanning the 1990s, four(Burkina Faso, Nigeria, Zambia, and Zimbabwe) ex-perienced an increase in poverty, matching the re-gional pattern for the decade, while three (Ghana,Mauritania, and Uganda) had a decline (table 1.3).14
Available national poverty estimates for Latin Amer-
ica show that between 1989 and 1996 the incidenceof poverty fell in Brazil, Chile, the Dominican Re-public, and Honduras—and rose in Mexico andRepública Bolivariana de Venezuela.15 In anothergroup of countries for which only urban surveys wereavailable, poverty rose in Ecuador, stayed nearly un-changed in Uruguay, and fell in Argentina, Bolivia,Colombia,16 and Paraguay.
In East Asia poverty trends in the 1990s were influ-enced by the impact of the recent economic crisis. In-donesia, the Republic of Korea, and Thailand all sufferedincreases in poverty, though to differing degrees (seechapter 9).17 In Indonesia one recent study estimated thatpoverty increased from around 11 percent in February1996 to 18–20 percent in February 1999. Since then,poverty appears to have declined considerably, though
Table 1.3
Income poverty in seven African countries,
various years
Share of population
below the national
poverty lineb
Country (percent)and perioda Area Year 1 Year 2
Burkina Faso Rural 51.1 50.71994, 1998 Urban 10.4 15.8
Total 44.5 45.3
Ghana Rural 45.8 36.21991/92, Urban 15.3 14.51998/99 Total 35.7 29.4
Mauritania Rural 72.1 58.91987, 1996 Urban 43.5 19.0
Total 59.5 41.3
Nigeria Rural 45.1 67.81992, 1996 Urban 29.6 57.5
Total 42.8 65.6
Uganda Rural 59.4 48.21992, 1997 Urban 29.4 16.3
Total 55.6 44.0
Zambia Rural 79.6 74.91991, 1996 Urban 31.0 34.0
Total 57.0 60.0
Zimbabwe Rural 51.5 62.81991, 1996 Urban 6.2 14.9
Total 37.5 47.2a. The dates in this column correspond to year 1 and year 2. b. Nutrition-based poverty lines. Comparisons betweencountries are not valid.Source: Demery 1999; Ghana Statistical Service 1998.

⁄
it is still substantially higher than precrisis levels.18
Trends in China in 1996–98 are sensitive to the choiceof welfare measure. Income poverty measures based onthe $1 a day or national poverty line show continued de-cline. But a consumption-based poverty measure showsa stalling in poverty reduction between 1996 and 1998,suggesting that poor households, especially in rural areas,have been saving an increasingly large share of their in-comes.19 The most recent data for Vietnam show thatbetween 1993 and 1998 the incidence of poverty, basedon a national poverty line, fell from 58 percent to 37percent.20
Poverty reduction also varied in South Asia in the1990s. Bangladesh turned in a good performance despiteits worst floods in living memory, with GDP growth of4.5 percent in 1998–99, thanks to a bumper rice crop afterthe floods. The concerted relief efforts by the government,NGOs, and donors—and the ongoing food-for-workprograms—limited the loss of life and the impact of thefloods on poverty. Pakistan and Sri Lanka made little or
no progress in poverty reduction in the 1990s.21 ForIndia, there is an ongoing debate on the accuracy of thestatistics. It provides a telling example of how difficult itis to track poverty over time, even within countries(box 1.8).
Variations in poverty within countriesCountry aggregates of different dimensions of poverty pro-vide a useful overview of performance. But they hide asmuch as they reveal. There are distinct patterns of povertywithin countries, and different groups within a countrycan become better or worse off.
Poverty in different areas within a country can—anddoes—move in different directions. In Burkina Faso andZambia rural poverty fell and urban poverty rose, but theurban rise dominated and overall poverty rose (see table1.3).22 In Mexico, while overall poverty declined—though modestly—between 1989 and 1994, there werelarge variations across regions within the country.23 InChina rapid income growth has been accompanied by ris-
Box 1.8
Tracking poverty in India during the 1990s
Recent data from India’s National Sample Surveys (NSS) suggestthat the pace of poverty reduction slowed in the 1990s, particu-larly in rural areas. This occurred against a backdrop of strong eco-nomic growth (GDP growth of 6.1 percent a year during 1990–98),according to the national accounts (NAS). There are signs of ris-ing inequality nationally in the NSS data, due in large part to ris-ing average consumption in urban areas relative to rural areas,though with some signs of higher inequality in urban areas. How-ever, an important factor in the slow rate of poverty reduction wasslow growth in average consumption, as measured by the NSS.
Closer examination shows that NSS consumption is an increas-ingly smaller fraction of private consumption as estimated in the NAS.NSS consumption has declined relative to NAS consumption duringthe past three decades; the two were much closer in the 1950s and1960s (Mukherjee and Chatterjee 1974). If the average consumptionfigures from the NSS are replaced by the average consumption fig-ures from the NAS, and everybody’s consumption is adjusted pro-portionately, poverty would show a downward trend during the1990s (as found by Bhalla 2000).
But comparing NSS and NAS data is a complex matter, involv-ing differences in coverage, recall biases in the NSS, price imputa-tions (for example, for home-produced consumption and in-kindwages in the NSS and for nonmarketed output in the NAS), and sam-pling and nonsampling errors in both. Thus, without examining whythe differences between the two have widened, adjusting the NSSmean upward to equal the NAS mean would be an arguable proce-dure. For one thing, it is not clear why the average consumption datafrom the NSS would be wrong but not the inequality data, the as-
sumption made when everybody’s consumption is adjusted pro-portionately. For example, it cannot be ruled out a priori that non-response and nonsampling errors in measuring consumption maydiffer among income groups. Also, Visaria (2000) finds the differencesbetween the NSS and NAS to be considerably less if one week ratherthan one month is used in the NSS as the reference period for con-sumption. Srinivasan (2000) presents a detailed discussion of theseissues (Srinivasan and Bardhan 1974 present earlier discussions ofthese issues.)
There is also evidence that part of the observed trend in ruralpoverty in the earlier part of the 1990s may result from using in-adequate price deflators for rural areas. As a result, “it is likely thatthe decline in rural poverty rates has been understated in the of-ficial poverty counts. Indeed, we are led to suggest as a workinghypothesis that, between 1987–88 and 1993–94, there was no greatdifference in the rate of decline of urban and rural poverty, at leastaccording to the headcount measure” (Deaton and Tarozzi 1999,pp. 34–35).
It is plausible that the NSS-based poverty numbers are un-derestimating the rate of poverty reduction in India. The issues in-volved are important not only because of the Indian povertyfigures’ weight in global poverty trends, but also because similarproblems are likely to arise elsewhere. India has a stronger sta-tistical tradition than most poor countries. And it is not simply amatter of getting accurate estimates of poverty. Such surveys area key resource for identifying the characteristics of poor peopleand thus are a vital input for focusing policy. Research in this areais a high priority.

ing inequality between urban and rural areas and betweenprovinces.24
Poverty tends to be associated with the distance fromcities and the coast, as in China, Vietnam, and Latin Amer-ica.25 In China many of the poor reside in mountainouscounties and townships. In Peru two-thirds of ruralhouseholds in the poorest quintile are in the mountainregion, while fewer than a tenth are in the coastal region.26
In Thailand the incidence of poverty in the rural north-east was almost twice the national average in 1992, andalthough only a third of the population lives there, it ac-counted for 56 percent of all poor.
Differences in health and education betweenlow- and high-income householdsSocial indicators in many countries remain much worsefor the income-poor than for the income-nonpoor—often by huge margins. In Mali the difference in child mor-tality rates between the richest and poorest householdsis equal to the average gain in child mortality ratesrecorded over the past 30 years.27 In South Africa theunder-five mortality rate for the poorest 20 percent is twiceas high as the rate for the richest 20 percent, and inNortheast and Southeast Brazil, three times as high.
The picture is the same for malnutrition. A study of19 countries found that stunting (low height for age—anindicator of long-term malnutrition), wasting (low weightfor height—an indicator of short-term malnutrition),and being underweight (low weight for age) are higheramong poor people in almost all countries.28 But the dif-ferences between poor and nonpoor tend to be smaller incountries with high average rates of malnutrition.29
The incidence of many illnesses, especially commu-nicable diseases, is higher for poor people, while their ac-cess to health care is typically less. In India the prevalenceof tuberculosis is more than four times as high in the poor-est fifth of the population as in the richest, and the preva-lence of malaria more than three times as high.30 In 10developing countries between 1992 and 1997, only 41percent of poor people suffering from acute respiratoryinfections were treated in a health facility, comparedwith 59 percent of the nonpoor. In the same period only22 percent of births among the poorest 20 percent of peo-ple were attended by medically trained staff, comparedwith 76 percent among the richest 20 percent.31 Al-though HIV/AIDS initially affected the poor and the richalmost equally, recent evidence indicates that new infec-tions occur disproportionately among poor people.
Similar disparities show up in access to schoolingand in educational achievement. In some poor countriesmost children from the poorest households have noschooling at all. A study of Demographic and Health Sur-vey data found 12 countries in which more than half the15- to 19-year-olds in the poorest 40 percent of house-holds had zero years of schooling: Bangladesh, India, Mo-rocco, Pakistan, and eight countries in Sub-SaharanAfrica. In contrast, the median number of years com-pleted by 15- to 19-year-olds in the richest 20 percentof households was 10 in India and 8 in Morocco. In othercountries the gap in educational achievement was muchsmaller: one year in Kenya, two in Ghana and Tanzania,and three in Indonesia and Uganda.32 In Mexico aver-age schooling was less than 3 years for the poorest 20 per-cent in rural areas and 12 years for the richest 20 percentin urban areas.
Primary enrollment rates show similar gaps. The en-rollment rate for 6- to 14-year-olds is 52 percentagepoints lower for the poorest households than for therichest households in Senegal, 36 percentage points lowerin Zambia, and 19 percentage points lower in Ghana. Thegaps are also large in North Africa (63 percentage pointsin Morocco) and South Asia (49 percentage points inPakistan).33
Within-country differences in social indicators alsoexist between urban and rural areas, across regions, andacross socioeconomic classes. In China there has beena widening rural-urban gap in health status and healthcare use. While the rural population’s use of hospital ser-vices declined 10 percent between 1985 and 1993, theurban population’s increased by 13 percent.34 In Rus-sia the increase in mortality during the transition hasbeen concentrated among younger males, and stuntingof children, relatively high for an industrialized coun-try, has been most prevalent in rural areas and amongpoor people.35
Gender disparitiesOne of the key variations within a country is the differ-ent achievement of women and men. The allocation ofresources within households varies depending on the ageand gender of the household member. But estimating thenumber of poor men and women independently is dif-ficult, if not impossible, because consumption data arecollected at the household level.36 Even so, availablehealth and education data indicate that women are oftendisadvantaged.
⁄
A recent study of 41 countries shows that female dis-advantage, defined as the gap between male and femaleprimary enrollment rates, varies enormously. In Benin,Nepal, and Pakistan the male-female gap in the primaryenrollment rate is more than 20 percentage points, andin Morocco, 18. But in Brazil, Indonesia, Kenya, Mada-gascar, the Philippines, and Zambia the enrollment ratesof boys and girls are almost the same.37 The gender gapin education is often lower for the richest housholds andhighest for the poorest households. In India the gendergap in enrollment rates is 4.7 percentage points for chil-dren from the wealthiest 20 percent of households, com-pared with 11 percentage points for children from thepoorest 20 percent of households.38
Disparities by caste, ethnicity, and indigenous statusThere may also be groups that face particular social bar-riers. Disadvantaged in many developing and developedcountries and transition economies, ethnic minoritiesand racial groups often face higher poverty.39 The in-digenous populations have a much higher incidence of in-come poverty in a sample of Latin American countries forwhich data are available.40 Schooling attainments forthese disadvantaged groups are also lower than for othergroups. The indigenous groups in Guatemala have 1.8 yearsof schooling, and the nonindigenous 4.9 years.41 In Peruindigenous people were 40 percent more likely to be poorthan nonindigenous groups in 1994 and 50 percent morelikely in 1997.42 In rural Guatemala children of indige-nous mothers are more likely than those of nonindigenousmothers to be stunted.43 In the inner cities of the UnitedStates white married couples have an incidence of povertyof 5.3 percent, while black or Hispanic single-motherhouseholds have an incidence of more than 45 percent.44
Evidence for India shows that scheduled castes andscheduled tribes face a higher risk of poverty.45 Theseare among the structural poor who not only lack eco-nomic resources but whose poverty is strongly linkedto social identity, as determined mainly by caste.46
They also have worse social indicators. Among ruralscheduled caste women in India the literacy rate was19 percent in 1991, half that for the country, andamong scheduled caste men, 46 percent, comparedwith 64 percent for the country.47 When several dis-advantages are combined—being a woman from a so-cially excluded group in a backward region—thesituation is worse. In Uttar Pradesh, one of India’s
poorest states, only 8 percent of rural scheduled castewomen are literate, a third the rate for rural women inUttar Pradesh. But new research suggests that literacyrates of rural scheduled caste women are on the riseacross India. Although only 31 percent of rural sched-uled caste or scheduled tribe girls in the primary schoolage group were enrolled in school in 1986–87, 53 per-cent were by 1995–96.48
Volatility at the household levelStudies of income poverty changes for the same house-holds over time show significant movement in and outof poverty. While some groups are chronically below thepoverty line, other groups face a high risk of falling intopoverty some of the time. Studies for China, Ethiopia,Russia, and Zimbabwe find that the “always poor” groupis smaller than the “sometimes poor” group.49 However,these results should be treated with caution because ob-served changes reflect measurement errors as well as realchanges.50
One immediate question is whether some types ofhouseholds are more likely to suffer from chronic (ratherthan transitory) poverty. The answer differs from coun-try to country, but asset holdings often play a key role.In China a lack of physical capital is a determinant of bothchronic and transitory poverty, but household size andeducation of the head of household determine the like-lihood of chronic but not of transitory poverty.51
In the transition economies of Europe and Central Asiaeconomic mobility has increased, but chronic poverty isemerging as a key issue.52 Whether a household joins theranks of the new poor or the new rich depends verymuch on its characteristics, especially its links with thelabor market. The transition has increased the disad-vantage of “old poor” (pensioners, families with large num-bers of children, and single-parent families) and given riseto “new poor” (long-term unemployed, agricultural work-ers, young people in search of their first job, and refugeesdisplaced by civil conflict).53 In Poland the chronicallypoor constitute a distinct segment of the population.Larger households, those working on farms, and house-holds dependent on social welfare are most at risk of stay-ing poor.54 Russia has seen the emergence of new poorduring the transition. In the early 1990s new groups ofpoor formed as a result of the erosion of real wages andpensions and the impact of unemployment,55 and povertyis becoming longer in term and more resistant to economicrecovery.56

• • •
This chapter has shown that progress in incomepoverty reduction and human development varies widelyacross regions, countries, and areas within countries. Ithas also shown the existence of significant gaps in per-formance by gender, ethnicity, race, and social status.
Much of the difference in performance across regionsand countries can be attributed to differences in economicgrowth (chapter 3). The growth collapses in many coun-tries in Africa and the former Soviet Union had adevastating impact on poverty. The economywide crisesand natural disasters in East Asia, Latin America, Sub-Saharan Africa, and Europe and Central Asia also led toimportant setbacks in poverty reduction (chapter 9). Bycontrast, the spectacular growth performance in Chinaresulted in a sharp drop in income poverty. In the rest ofEast Asia, despite the financial crisis, steady growth ratesalso translated into significantly lower poverty over the1990s.
But the initial inequalities and the pattern of growthalso account for the differences in performance inpoverty reduction in its multiple dimensions as some ge-ographic areas and social groups are left behind. Insome cases initial differences include unequal access toassets, markets, and infrastructure and an uneven dis-tribution of skills (chapters 3, 4, and 5). The differencesin health and education among and within countries,
for example, also reflect the extent to which state in-stitutions are responsive and accountable to poor peo-ple (chapter 6). In other cases social barriers linkedwith gender, ethnicity, race, and social status help per-petuate income poverty and low levels of health and ed-ucation among the socially disadvantaged (chapter 7).Policy biases against labor-intensive sectors such as agri-culture and light manufacturing at the national (chap-ter 4) or international (chapter 10) level and skill-biasedtechnological change (chapter 4) can result in lower re-ductions in income poverty at similar growth rates.This chapter has also noted that there can be largevolatility in incomes of households. This brings to thefore the importance of understanding the sources of riskthat households face and the mechanisms best suited tomanaging those risks (chapters 8 and 9).
Finally, this chapter has argued that the experience ofpoverty goes beyond material deprivation and low levelsof health and education. The inability to influence thedecisions that affect one’s life, ill treatment by state in-stitutions, and the impediments created by social barri-ers and norms are also dimensions of ill-being. Anotheris vulnerability to adverse shocks, natural disasters, dis-ease, and personal violence. This broader conception ofpoverty leads to a deeper understanding of its causes anda broader range of actions for attacking it. These areoutlined in chapter 2 and developed in more detail in sub-sequent chapters.