mol/(l.phm )
TRANSCRIPT

Simple titration proceduresto determine H2CO3" alkalinityand short-chain fatty acids inaqueous solutions containing
known concentration "ammonium, phosphsulphide weak acid/bases
o1
•2• 3 -• 4 -• 5 -•6•7
LOG SPECIES DIAGRAMPK-P.
BUFFER INDEX DIAGRAM mol/(l.pH)
0 1 2 3 4 5 6 7 8 9 10 11 12 13 14
RE Moosbrugger • MC Wentzel • GA Ekama • GvR Marais

SIMPLE TITRATION PROCEDURES TODETERMINE H2CO3
+ALKALINITY AND SHORT-CHAIN FATTY ACIDSIN AQUEOUS SOLUTIONS CONTAINING KNOWN CONCENTRATIONS OF
AMMONIUM, PHOSPHATE AND SULPHIDE WEAK ACID/BASES
by
R E Moosbrugger, M C Wentzel, G A Ekama and GvR Marais
Water Research GroupDepartment of Civil Engineering
University of Cape TownRondebosch 7700, Republic of South Africa
Prepared for the
WATER RESEARCH COMMISSIONP O Box 824, Pretoria 0001
Republic of South Africa
WRC Report No. TT 57/92UCT Research Report W 74
December 1992

11
Obtainable from:
Water Research CommissionP O Box 824Pretoria0001Republic of South Africa
ISBN 1 874858 54 3
This publication arises from a research project entitled:
"Pelletization in upflow anaerobic sludge bed (UASB) systems"
(WRC Project No. K5/249)
NOTICES
• The views expressed in this manual are those of the authors and do notnecessarily constitute endorsement or recommendation by the Water ResearchCommission.
• The contents of this manual are subject to change without notice.
• All efforts have been made to ensure the accuracy of the programs and thecontents of this manual. Should users find any errors the Water ResearchCommission will greatly appreciate being informed.
• The above notwithstanding, the Water Research Commission and the authorscan assume no responsibility for any errors in the programs or the consequencesof such errors.
IBM is a registered trademark of International Business Machines Corporation.
TURBO PASCAL is a trademark of Borland International.
DISCLAIMER
While it is believed that the programs are based on the best available knowledgeand that considerable effort has been expended in eliminating errors, users arestrongly warned that in the application of the programs the results obtained are thesole responsibility of the user.

Ill
FOREWORD
Anaerobic digestion technology is finding increasing application world-wide. In
1988 the Water Research Commission set up a contract with the University of Cape
Town to conduct research on one aspect of anaerobic digestion, namely upflow
anaerobic sludge bed (UASB) systems. One of the objectives set for this contract
was development of strategies for control and operation of UASB systems. From an
extensive experimental investigation, control of the minimum pH in the sludge bed
emerged as of crucial importance. For pH control, monitoring of alkalinity and
short-chain fatty acid concentrations is essential. However, the numerous
difficulties with existing methods for measurement of these parameters precluded
their widespread incorporation in control and operation strategies, in particular the
lack of (expensive) sophisticated equipment at most full-scale installations in South
Africa. Considerable research effort by the University of Cape Town was directed
towards resolving this problem.
With this manual, simple elegant titration methods are presented to determine
H2CO3*alkalinity and short-chain fatty acids. These titration methods have
decided advantages over existing methods in (1) attainable accuracy; (2) testing
time required; and (3) simplicity of testing procedure. The methods should find
wide application for routine monitoring of anaerobic digestion systems.
P E Odendaal
Executive Director
Water Research Commission

IV
EXECUTIVE SUMMARY
Successful operation of anaerobic systems depends on, amongst others, maintenanceof a near neutral pH in the reactor liquid. The pH established in an anaerobicsystem is a result of the interaction between the weak acid/bases present. In thedesired operating pH range (6,6 < pH < 7,4), the main weak acid/base bufferingagainst pH change is the carbonate [characterized by H2CO3*alkalinity and pH, or,total species concentration (CT) and pHj and the main weak acid/bases causing pHdecline are the short-chain fatty acids [characterized by total species concentration(AT) and pH]. For pH control in anaerobic systems, monitoring these weakacid/bases is essential. However, the numerous difficulties with existing methods formeasurement of these weak acid/bases preclude their widespread use: For directmeasurement of total species concentrations (CT and AT), there is a lack of thenecessary expensive sophisticated equipment at most full-scale installations in SouthAfrica; for the existing indirect titration techniques, the methods are cumbersomeand provide only approximations of the parameters of interest.
To overcome these problems, with this manual two simple titration procedures arepresented: A 4 pH point titration for determining the carbonate weak acid/baseand a 5 pH point titration for determining both the carbonate and short-chain fattyacid (SCFA) weak acid/bases in aqueous solutions. Besides the carbonate andSCFA weak acid/bases, the most common additional weak acid/bases in anaerobicdigestion are phosphate, ammonium and sulphide. These can be accounted for inthe titration procedures if their total species concentrations are known. Where theseare not available, guidance is given on their influence on the accuracy of the results.
The titration methods require only an acid titration over the middle range of pH(initial pH to pH 6,7; 5,9; 5,2 for 4 pH point titration and to additional pH 4,3 for5 pH point titration). If the initial pH is below 6,7, strong base addition is requiredto reach pH 6,7 before the strong acid titration can be commenced; however, therequirement is only to increase the pH to 6,7, i.e. there is no need to standardize thestrong base. These features of the titration methods provide decided advantagesover existing methods in testing time required and simplicity of testing procedure,and overcome criticisms levelled at previous titration methods, of difficulties inadequate pH probe calibration due to large pH ranges and precipitation.
Algorithms for calculating the carbonate CT and H2CO3*alkaIinity from the 4 pHpoint titration data, or the carbonate H2CO3*alkalinity and short-chain fatty acidAT from the 5 pH point titration data, have been encoded into two computerprograms, TITRA4 and TITRA5 respectively, which are included with the manual.Besides quantifying the carbonate or carbonate plus SCFA, the computer programsallow a check on the pH probe by providing an estimate of a systematic pH errorwhere this may be present, due to poor calibration, residual liquid junction effect orany other influences on the glass electrode. The systematic pH error is taken intoaccount automatically by the computer programs in the calculations. This increasesthe accuracy of data derived from the titration procedures.
The titration procedures presented with this manual should find wide use for routinemonitoring of anaerobic digestion systems, and for a range of other applications.

ACKNOWLEDGEMENTS
The writers wish to express their gratitude to the following persons for theircontribution to the research reported here:
• Assoc. Prof. Richard Loewenthal, for advice and comment on the procedures.
• Mr Taliep Lakay - Technical Assistant, for his invaluable help in running theexperimental units and the laboratory.
• Mrs Heather Bain - Clerical Assistant for so cheerfully typing and retypingpapers and reports.
Thanks also are due to the members of the Steering Committee who guided theresearch work during the contract period:
• Dr J E McGlashan - Water Research Commission(Acting Chairman, 1988)
• Dr W H J Hattingh - Water Research Commission(Chairman, 1989)
• Dr H M Saayman - Water Research Commission(Chairman, 1990; Member 1991)
• Dr S A Mitchell - Water Research Commission(Chairman, 1991)
• Mr G Offringa - Water Research Commission(Member, 1989-1991)
• Mr H A Nicholls - Johannesburg City Health Department(Member, 1988)
• Mr A R Pitman - Johannesburg City Engineer's Department(Member, 1989-1991)
• Dr L H Lotter - Johannesburg City Health Department(Member, 1990-1991)
• Dr W R Ross - DWT,CSIR (1988); Ross CC (1989-1991)(Member, 1988-1991)
• Mr H A de Villiers - DWT.CSIR(Member, 1989-1991)
• Ms H Louw - Water Research Commission(Acting Committee Secretary, 1988)
• Mr P W Weideman - Water Research Commission(Committee Secretary, 1988-1991)
The writers also would like to thank the Water Research Commission and theFoundation for Research Development for financial support of the research.

VI
TABLE OF CONTENTS
Page No.
NOTICES/DISCLAIMER (ii)
FOREWORD (iii)
EXECUTIVE SUMMARY (iv)
ACKNOWLEDGEMENTS (v)
TABLE OF CONTENTS (vi)
LIST OF SYMBOLS (viii)
CHAPTER 1 ; INTRODUCTION 1. 1
CHAPTER 2 : ALKALINITY CONCEPTS AND DEFINITIONS 2. 1
INTRODUCTION 2. 1CARBONATE WEAK ACID/BASE ONLY IN SOLUTION 2. 2
Alkalinity definition 2. 2System and subsystem alkalinities 2. 3Buffer index 2. 4Alkalinity and the buffer index diagram 2. 5
MIXTURES OF THE CARBONATE AND OTHER WEAK ACID/BASES 2. 8Alkalinity definition 2. 8System and subsystem alkalinities 2. 9Buffer index 2.10Alkalinity and the buffer index diagram for weak acid/base mixtures 2.13
CHAPTER 3 : 4 pH POINT TITRATION PROCEDURE 3. 1
OBJECTIVE 3. 1BACKGROUND 3. 1PRINCIPLE 3. 1METHOD 3. 1
Apparatus 3. 1Chemicals 3. 2Ancillary measurements 3. 2Sample preparation 3. 4Titration procedure 3. 5
CALCULATION OF RESULTS 3. 7Input data for computer program 3. 7Output data from computer program 3. 8
CHAPTER 4 : 5 pH POINT TITRATION PROCEDURE 4. 1
OBJECTIVE 4. 1BACKGROUND 4. 1PRINCIPLE 4. 1METHOD 4. 1
Apparatus 4. 1Chemicals 4. 2Ancillary measurements 4. 2

Vll
Sample preparation 4. 4Titration procedure 4. 6
CALCULATION OF RESULTS 4. 8Input data for computer program 4. 8Output data from computer program 4. 9
CHAPTER 5: THE COMPUTER PROGRAMS 5. 1
INTRODUCTION 5. 1SYSTEM REQUIREMENTS 5. 1SUPPLIED DISK 5. 2BACK-UP COPIES 5. 2FILES ON THE DISTRIBUTION DISK 5. 3SETTING UP ON A HARD DISK SYSTEM 5. 3STARTING PROGRAM EXECUTION 5. 4
Floppy disk system 5. 4Hard disk system 5. 5
RUNNING THE PROGRAMS 5. 5Data input by user 5. 6Program output 5. 7
PROGRAM LIMITATIONS 5. 9
CHAPTER 6: EXAMPLES 6. 1
INTRODUCTION 6. 14 pH POINT TITRATION 6. 1
Titration 6. 1Program execution 6. 2
5 pH POINT TITRATION 6. 4Titration 6. 4Program execution 6. 5
REFERENCES R. 1
APPENDIX A: STANDARDIZATION OF STRONG ACID A. 1
INTRODUCTION A. 1PREPARATION OF STRONG ACID A. 1GRAN TITRATION OF CARBONATE SOLUTION A. 2APPLICATION OF FIRST GRAN FUNCTION A. 2CALCULATION OF NORMALITY OF STRONG ACID A. 3

Vll l
LIST OF SYMBOLS
AT Total short-chain fatty acid (represented by acetic acid) speciesconcentration (mg/t as HAc)= [HAc] + [ A c ]
C T Total carbonate species concentration (mg// as CaCOs)= [H2CO3*] + [HCOj] + [COj-]
Ca Normality of strong acid (mol//)
Cb Normality of strong base (mol/£)
DOS Disk operating system
Fi x First Gran function value
= l t f p H x (Vs + Vx)
HAc Acetic acid
M Molarity (mol/^)
m Initial H2CO3*alkalinity concentration of sample
N Normality; concentration of H+ or OH"
NT Inorganic nitrogen total species concentration (mgN/Q= [NHJ] + [NH3]
P T Inorganic phosphorus total species concentration (mgP/£)= [H3PO4] + [H2PO4-] + fHPOJ"] + [POJ-]
PC Personal computer
pHx pH reading for First Gran Function, in range 3,9 to 3,4.
pH0 Initial pH of sample
pHi...pH4 pH readings in titration procedures
SC Specific conductivity (mS/m)
SCFA Short-chain fatty acids (also called volatile fatty acids, VFA)
ST Sulphide total species concentration (mgS/^)
= [H2S] + [HS-] ([S2-] negligible at pH < 12)
s Seconds
TDS Total dissolved solids (mg//)

IX
TITRA4
TITRA5
Vs
Vx
Vxi...VX4
Vxe
Computer program for the 4 pH point titration
Computer program for the 5 pH point titration
Initial sample volume (ml)
Volume of strong acid (or strong acid + base) required to titrate topHx (m<)
Volume of strong acid (or strong acid + base) required to titrate toHH (O
Volume of strong acid required to titrate to H2CO3* reference speciesequivalence point pH (mi)
Buffer index [mol/(/-ApH)]
Buffer index of weak acid/base X [mol/(/-ApH)]
Buffer index of carbonate weak acid/base [mol/(£- ApH)]
Buffer index of water [mol/(/- ApH)]

CHAPTER 1
INTRODUCTION
In anaerobic fermentation a number of different microbial species contribute to thebreakdown of soluble organic compounds to carbon dioxide and methane (Mosey andFernandes, 1989; Sam-Soon et at, 1987). The main groups of bacterial species andthe reactions they mediate are:
• acidogens: convert influent COD to acetic (HAc), propionic (HPr) and butyric(HBr) acids and to CO2 and H2;
• acetogens: convert HPr and HBr to HAc, CO2 and H2;• hydrogenotrophic methanogens: convert H2 and CO2 to CH4; and• acetoclastic methanogens: convert HAc to CH4 and CO2.
Each of these groups has a specific pH region for optimal growth; for acidogens apH n 6, for acetogens, hydrogenotrophic and acetoclastic methanogens a pH ~ 7(Gujer and Zehnder, 1983). The relative rates of growth of these groups changewith pH. Under normal operating conditions in anaerobic digestion (see below),Mosey and Fernandes (1989) report the following average doubling times: acidogens- 30 min; acetogens - 1,4 d; hydrogenotrophic methanogens - 6 h; and acetoclasticmethanogens - 2,6 d. To ensure optimal breakdown one condition that must besatisfied is to provide optimal pH conditions for the slowest growing organismgroup. From Mosey and Fernandes1 work, the acetoclastic methanogens are therate-limiting group; their growth rate is at its maximum at pH ~ 7,0 but fallssharply at pH < 6,6. Consequently, it is essential to maintain the pH > 6,6.
In anaerobic treatment systems, decline in pH would be due principally to anincrease in short-chain fatty acids (SCFA). Increase in SCFA can be induced by anumber of factors:
• Complete or partial phase separation of the acidogenic and methanogenic phaseswould result in an accumulation of SCFA in the acidogenic phase, and a declineof SCFA in the subsequent methanogenic phase: For example, in a plug flow orsemi plug flow reactor, such as the upflow anaerobic sludge bed (UASB) reactor,along the axis of the reactor there is partial phase separation; this gives rise to

1.2
an increase in SCFA from the influent entry point to a maximum at some pointup the reactor sludge bed, thereafter a decrease in SCFA to near zero at the topof the sludge bed (Sam-Soon et ai, 1987;1989).
• The hydrogen partial pressure (PH2) also has a crucial effect on fermentation.For example, glucose is fermented first to pyruvic acid, via the Embden-Meyer-hof pathway, and thereafter the pathways depend on the pH2 conditions: Underlow pH2 conditions pyruvic acid is converted to HAc only, whereas under highpH2 conditions HAc and the intermediate HPr are formed. Also with a high pH2
in the reactor, the conversion of HPr to HAc by the acetogenic organisms isinhibited. These give rise to an increase in HPr and consequently to an overallincrease in SCFA (Sam-Soon et ai, 1989;1990).
• Toxins or inhibitory substances in the influent may act on the methanogenicphase only, causing an accumulation of SCFA.
Thus, in anaerobic treatment systems under "unbalanced" or transient processoperation, SCFA may accumulate and constitute a major cause for pH change. Themagnitude of pH change will depend on the magnitude of increase in SCFAconcentration and the pH buffering.
By pH buffering is meant the "ability" of the solution to resist change in pH onaddition of H+ or OH" (in any form, i.e. strong acid or base, weak acid/base). Allweak acid/bases present in the solution and the water itself contribute in a greateror lesser degree to pH buffering. To quantify the weak acid/bases in solution andtheir contribution to pH buffering, the total species concentration of each weakacid/base and pH are required (Loewenthal and Marais, 1976). Weak acid/basesmost commonly found in anaerobic fermentation are the carbonate, ammonium,phosphate, sulphide and SCFA (principally HAc and HPr, Pohland and Martin,1969). Of these, the total species concentration of the ammonium, phosphate andsulphide weak acid/bases can be measured by conventional wet chemical techniqueswithout undue difficulty (Standard Methods, 1989). With regard to the carbonateand SCFA weak acid/bases:
• For determination of carbonate total species concentration (CT), inorganic carbonanalyzers are available. However, with this instrument CT is very likely to be inerror due to CO2 loss on sampling anaerobic digester liquid.

1.3
• For determination of SCFA total species concentration (AT), distillation/tit ra-tion, colorimetric and chromatographic methods are available. These methodsare time consuming and involve considerable analytical skill and/or expensiveequipment not usually available on full-scale anaerobic installations in SouthAfrica.
The practical difficulties in measuring CT have led to the development of asubstitute parameter, H2CO3*alkalinity; if measurements of HjCC^alkalinity andpH are available, CT can be determined (Loewenthal and Marais, 1976; Loewenthalet al, 1989, Chapter 2):
• The H2CO3*alkalimty has the merit that CO2 loss does not affect its value(provided that carbonate precipitation does not take place). For determinationof H2CO3*alkalinity in solutions containing only the carbonate weak acid/base ormixtures of weak acid/bases, the Gran and Extended Gran methods,respectively, (Loewenthal et al., 1989) are available. Both Gran methods arerelatively complex and tedious and the Extended Gran method requiresindependent accurate determination of AT, not a simple task. For routinemonitoring, the Gran and the Extended Gran methods will not find readyapplication.
• For determination of H2CO3*alkalinity/CT or AT, or H2CO3*alkalinity/CT andAT, simplified titration methods are available. However, these methods areeither too cumbersome, or provide only approximations of the parameters ofinterest.
From the above, a need exists for a simple method to measure H2CO3*alkaIinity/CT
and AT for routine monitoring and control of anaerobic systems.
With the increased understanding of mixed weak acid/base chemistry (Loewenthalet ait 1989;1991), a study of the basic theory indicated that, by using an alternativeapproach, it should be possible to evaluate these parameters by a simple titrationprocedure. The development of this approach and the titration procedures havebeen detailed by Moosbrugger et al. (1991;1992;1993a;b;c;d). In this manual,methods for the titration procedures are set out, to determine:
• H2CO3*alkalinity/CT in an aqueous solution that may contain ammonium,
1.4
phosphate and sulphide weak acid/bases of known concentration - the 4 pH pointtitration method.
• H2CO3*alkalinity/CT and AT in an aqueous solution that may containammonium, phosphate and sulphide weak acid/bases of known concentrations -the 5 pH point titration method.
The calculation of the above parameters from the data obtained in the titrations is alaborious and tedious task. To facilitate this calculation, algorithms of thecalculation procedures for the 4 and 5 pH point titration methods have beendeveloped and are encoded in computer programs which may be found on the 5j"floppy disk that accompanies this manual. The floppy disk contains listed (TurboPascal Version 4.0) and compiled versions of IBM PC compatible computerprograms for the 4 and 5 pH point titration methods:
Listed Compiled
Titra4.pas Titra4.exe
Titra5.pas Titra5.exe
The data from the titrations are inserted in the appropriate computer program, andthe results for H2CC>3*alkalinity and AT are computed. Details on running thecomputer programs are supplied in the manual.

CHAPTER 2
ALKALINITY CONCEPTS AND DEFINITIONS
INTRODUCTION
In Chapter 1 it was stated that to quantify a weak acid/base in solution, the totalspecies concentration and pH are required. For the carbonate weak acid/base,experimentally the carbonate total species concentration (CT) can be measured bymeans of an inorganic carbon analyzer, an instrument not usually available atfull-scale anaerobic plants in South Africa. However, even where this instrument isavailable, very likely the measured Cj will be in error: In solution the carbonateweak acid/base consists of four species viz. CO2 dissolved; carbonic acid, H2CO3;bicarbonate, HCO3; and carbonate CO§-. The CO2 dissolved and H2CO3 alwaysexist in a fixed proportion and, accordingly, are dealt with as a combined species,H2CO3* (Stumm and Morgan, 1970), i.e.
[H2CO3*] = [CO2 dissolved] + [H2CO3] (2.1)
The ratio CO2 (dissolved) : H2CO3 is fixed and equal to 99,76 : 0,24 at 25" C and isindependent of pH and ionic strength. The dissolved CO2 tends to equilibrium withthe partial pressure of CO2 (gas) outside the liquid. This gives rise to CO2
exchange at the liquid/gas interface, resulting in loss or gain of CO2 dissolved in thesolution. Loss of CO 2 from solution is particularly evident in sampling anaerobicdigester liquid: In the digester the partial pressure of dissolved CO 2 is much higherthan that of CO2 in the atmosphere outside the digester. When a sample isremoved from the digester, on exposure to the atmosphere loss of CO2 takes place,that is, CT is reduced in the sample. Due to this loss of CO2 in sample preparation,it is not possible to measure the CT of the digester liquid accurately using aninorganic carbon analyzer. To avoid the difficulties in determination of CT due tolack of equipment and CO2 loss, an alternative approach to quantifying thecarbonate subsystem total species concentration was developed via pH and theconcept of proton accepting capacity or "alkalinity" (see Loewenthal et ai,
1986;1989 for a more detailed discussion).
In application, a number of different interpretations have been placed on the
concept of alkalinity, for example, "Phenolphthalein alkalinity" and "Total

2.2
alkalinity" (Standard Methods, 1989); "bicarbonate alkalinity" (McCarty, 1974);"true bicarbonate" (Jenkins et a/., 1983), etc. This has led to considerable confusionand misapplication of the alkalinity concept.
In this Chapter, the intention is to define unambiguously the interpretation ofalkalinity used by the authors, in particular what is meant by the H2CO3*alkalinitywhich is determined using the titration procedures. This will enable the reader torelate the authors' use of alkalinity to the concepts with which the reader may befamiliar.
To define the authors' interpretation of alkalinity, the situation where the carbonateweak acid/base only in solution is considered first, and then the concepts areextended to mixtures of weak acid/bases.
CARBONATE WEAK ACID/BASE ONLY IN SOLUTION
Alkalinity definitionIf any one of the carbonate weak acid/base species, H2CO3*, HCOj or COJ" species(called reference species) is added to pure water the solution is called an H2CO3*,HCOj or CO§" equivalent solution respectively. The respective pHs established arecalled the H2CO3*, HCOj or CO$~ equivalence points; these equivalence points serveas reference plls for the respective solutions. The H2CO3*, HCOj and COjj~equivalence points are established by the respective concentrations of referencespecies [H2CO3*], [HCO3] and [COJ~] added to pure water. The respectiveequivalence points are not fixed but change with the mass of reference speciesadded, temperature and ionic strength. When a strong base is added to one of theequivalent solutions, the pH increases above the respective equivalence point. Themass of strong base added generates a proton (H+) accepting capacity in the solutionrelative to the respective equivalence point. This capacity can be measured in atitration as the molar mass of H+ that needs to be added to titrate back to theequivalence point using a standard strong acid. If a strong acid is added to one ofthe equivalent solutions, the pH will decrease below the respective equivalence pointgiving rise to a proton donating capacity relative to the respective equivalence pointand this can be measured in a titration as the molar mass of OH" that needs to beadded to titrate back to the respective equivalence point using a strong base. Note,the proton accepting or donating capacity generated with respect to the equivalencepoint is equal to the mass of strong base or strong acid originally added to the

2.3
reference species solution and is independent of the mass of reference species present.Conventionally, the proton accepting capacity relative to the equivalence point(generated by addition of strong base) is taken as positive. On this basis, theproton donating capacity relative to the same equivalence point (generated byaddition of strong acid) is in effect a negative proton accepting capacity.
Historically the proton accepting capacity between the solution pH and thereference species equivalence point has been called alkalinity and the protondonating capacity the acidity. The double nomenclature is unnecessary andcreates a measure of confusion because for the same equivalence point, theacidity is equal to the alkalinity but of opposite sign. Because the termalkalinity has acquired an almost universal usage in carbonate weak acid/basechemistry, Loewenthal et al. (1991) suggested that the term alkalinity beretained and continue to define proton accepting capacity when positive; protondonating capacity is then a negative alkalinity, thereby making the term acidityredundant.
The proton accepting capacity between the solution pH and the H2CO3*, HCOj andCOj" equivalence points give the r^CC^alkalinity, HCOj alkalinity, and COJ"alkalinity respectively. From a practical point of view, the H2CO3*alkalinity hasbeen found the most useful (Loewenthal and Marais, 1976): The H2CO3*alkalinityis not affected by gain or loss of CO2 (because CO2 is the reference species) with theresult that it can be measured even if there is loss of CO 2 between sampling andmeasurement. For this reason the in situ H2CO3*alkalinity and sampleH2CO3*alkalinity are identical. Accordingly, H2CO3*alkalinity has been selected asthe parameter for use in the titration procedures presented with this manual.
System and subsystem alkalinities
Following Loewenthal et al. (1989;1991) an aqueous solution containing only thecarbonate weak acid/base constitutes the carbonate system. The carbonate systemis made up of two subsystems, the carbonate subsystem and the water subsystem.The carbonate system and subsystem alkalinities for the H2CO3* reference speciesare related as follows:
H2CO3*alkalinity = j[HCO3-] + 2[CO3"]J + {[OH"] - [H + ] | (2.2)= Alk H2CO3* + Alk H2O (2.3)
where:H2CO3*alkalinity = carbonate system alkalinity with H2CO3* as reference speciesAlk H2CO3* =carbonate subsystem alkalinity = [HCOj] + 2[COJ-] (2.4)Alk H2O = water subsystem alkalinity = [OH"] - [H+] (2.5)

2.4
This formulation for H2CO3*alkalinity applies irrespective of the presence of otherweak acid/bases in the solution.
Buffer index
The carbonate system and subsystem alkalinities can be illustrated via the conceptof buffer index. Consider addition of H2CO3* reference species to pure water, togive the H2CO3* equivalent solution with associated pH called the H2CO3*equivalence point. Incremental addition of strong base to this equivalent solutionincreases the pH above the H2CO3* equivalence point, and the molar mass of strongbase added equals the H2CO3*alkalinity. Plotting the cumulative masses of strongbase (Cb) added versus pH, a titration curve is obtained; the slope of this curve(dCb/dpH) at any pH defines the buffer index (Van Slijke, 1922):
0 =dCb/dpH (2.6a)
where:Cb =mass of strong base added per litre respectively (mol/^)0 = buffer index [mol/(/- ApH)]
Note: since the solution is titrated with a strong base, the total speciesconcentration of the weak acid/base remains constant.
Addition of strong acid to the H2CO3* equivalence solution has the reverse effect onpH to addition of strong base. 0 can be written also in terms of the mass of strongacid added (Ca):
0 =-dCa/dpH (2.6b)
Thus, the buffer index is a measure of the mass of strong acid or base that must beadded to effect a change in pH, or in other words, the ability of the solution at anypH to resist change in pH on addition of acid or base.
From Loewenthal and Marais (1976), 0 at any pH for the carbonate system and
subsystems can be formulated as follows:
Carbonate subsystem:
For the carbonate weak acid/base subsystem its buffer index, 0Cy can be formulated

2.5
in terms of CT, (H*) and K^ as follows (Loewenthal and Marais, 1976):
0C = - dCa/dpH = 2,303 [CT K; (H*)] / [K;+(H+)]2 (2.7)
where:CT = carbonate total species concentration(H+) = proton activity at the pH of the sample
K^ = apparent dissociation constant (see Loewenthal et a/., 1989).
For the diprotic carbonate weak acid/base with dissociation constants pK^t andP^a2 (P^a = ~ l°&io ^a)> since t n e t w 0 dissociation constants differ by 4 pH unitsor more, the buffer index in the pH region around each pK^ value can be describedsufficiently accurately by Eq (2.7), (Loewenthal and Marais, 1976).
Water subsystem:For the water subsystem, the buffer index is given by
/?w =2,303 {(H+) + K;/(H+)} (2-8)
whereK^ = apparent ion product constant for water subsystem (see Loewenthal et al.t
1989;1991)
System:
For an aqueous solution containing the carbonate weak acid/base only, the bufferindex of the system, /?, at any pH is given by the sum of the buffer indices of thecarbonate and the water weak acid/base subsystems:
0 = & + /?» (2.9)
Alkalinity and the buffer index diagramSince the slope of the titration curve at any pH defines the buffer index /?, the areaunder a plot of buffer index versus pH (the buffer index diagram) between two pHsdefines the mass of strong acid (or base) that must be added to the solution to movefrom the one pH to the other, i.e. equals the alkalinity between the two pHs. If oneof the pHs is, for example, the H2CO3* equivalence point, then the area under the

2.6
buffer index diagram between any pH and the H2CO3* equivalence point quantifiesthe H2CO3*alkalinity at that pH.
The buffer index diagrams for the carbonate and water subsystems have beenconstructed using Eqs (2.7) and (2.8) and are given in Figs 2.1a and 2.1brespectively. For H2CO3*alkalinity as an example, this parameter can be illustratedin the buffer index-pH diagrams: As noted earlier, the H2CO3*alkalinity can bewritten as the sum of the alkalinity contributions by the carbonate and the watersubsystems (Loewenthal et al., 1991), i.e.
H2CO3*alkalinity = Alk H2CO3* + Alk H2O (2.10)
In terms of the pH - buffer index diagrams, Alk H2CO3* is the area under thecarbonate buffer index curve (Fig 2.1a) (identically the carbonate proton acceptingcapacity contribution) between the solution pH and the H2CC>3*equivalence point(pH « 4,0); Alk H2O is the area under the water buffer index curve (Fig 2.1b)(identically the water proton accepting contribution) between the solution pH andthe H2CO3* equivalence point; and H2CO3*alkalinity is the sum of the two areas.
In a strong acid titration to measure H2CO3*alkalinity, on addition of H* theoriginal solution pH will decrease to say pHK and the molar mass of H* added equalsthe area under the carbonate -f water buffer index curves between the originalsolution pH and pHx; the H2CC>3*alkalinity also decreases by this area and is nowequal to the area under the carbonate + water buffer index curves between pHx andthe H2CO3* equivalence point. As more strong acid is added, so the pH willdecrease further and at the point where the pH equals the H2CO3* equivalencepoint, the H2CO3*alkalinity will equal zero - the molar mass of H* added nowequals the area under the carbonate + water buffer index curves between theoriginal solution pH and the H2CO3* equivalence point, i.e. the H2CO3*alkaliruty ofthe original solution. Thus, by titrating from the original solution pH to theH2CO3* equivalence point we can equate the molar mass of H* (or similarly OH")added to the H2CC>3*alkalinity. However, the problem in such a titration is thatthe H2CO3* equivalence point must be identified. Practically this is possible onlyapproximately because C^ is not known before commencing the test; theequivalence point (end point in the titration) is selected empirically and thedetermination has validity only because the H2CO3* equivalence point (pH z 4,0)lies in a region of low buffer index (see Figs 2.1a and 2.1b). To overcome the

2.7
• 1 ^
-2 -
-3 .
-5 .
Nv t-OG SPECIES OIAGRAM\ Cr {>*„,
\ \ 1
X
\
BUFFER INDEX
DIAGRAM
3 1 2 3 4 8
flfnnp
6 7 8PH
A
A9 10
An-
HCOa"
mol/(l.pH) ]
11 12 13 U
Fig 2.1a: Log [species] -pH diagram for the carbonate weak acid/base system inaqueous solution and the buffer index diagram for the carbonatesubsystem. Note that pH as used in the term [mol/ApH)] refers to unitchange in pH.
BUFFER INDEX
DIAGRAM mol/[l.pH|
0 1 2 3 4 B 6 7 8 9 10 11 12 13 M
PH
Fig 2.1b: Log [species]-pH and buffer index diagrams for the water subsystem.Note that pH as used in the term [mol/?.pH)] refers to a unit change inpH.

2.8
problem of H2CO3* equivalence point identification and provide a more accurateestimate for H2CO3*alkalinity, Gran (1952) developed a titration procedure wherebythe H2CO3*alkalinity can be determined without knowledge of the H2CO3*equivalence point. However, the Gran method is relatively complex and tedious andis unlikely to find ready application for routine monitoring. In this manual analternative to the Gran method is presented which also allows the H2CO3*alkalinityto be determined without titrating to the H2CO3* equivalence point: Referring tothe buffer index curves for the carbonate (Fig 2.1a) and water (Fig 2.1b)subsystems, addition of a molar mass of H* (or OH-) to the solution causes theH2CO3*alkalinity to decrease (increase) by an equivalent amount and also the pH todecrease (increase). The magnitude of the decreases (increases) in H2CO3*alkalinity(equal to the area under the carbonate and water buffer index curves between thetwo pHs) and in pH can be used to quantify the H2CO3*alkalinity. That is, bymeasuring the change in H2CO3*alkalinity between the two pH values (equivalentto the molar mass of H+ added to move from the one pH to the other), theH2CO3*alkalinity of the sample can be determined. The theory is quite complexbut in application the calculations can be readily incorporated in a computerprogram. Knowing the initial pH and the change in H2CO3*alkalinity between anytwo pH values (measured in the titration as the molar mass of H* added from onepH to the other), the H2CO3*alkalinity can be calculated immediately. Theseconcepts have been used to develop the titration procedures presented here (seeMoosbrugger et a/., 1991;1993a;b;c;d).
MIXTURES OF THE CARBONATE AND OTHER WEAK ACID/BASES
In mixtures of weak acid/base systems, e.g. anaerobic digester liquid, titrating tothe H2CO3* equivalence point and equating the mass of H* added to the mass ofH2CO3*alkalinity virtually always will give an incorrect result. This arises from thepresence of other weak acid/base subsystems, i.e. SCFA, phosphate, sulphide andammonium. Depending on the starting pH of the titration, these weak acid/baseswill influence, in a greater or lesser degree, the mass of H+ required to titrate to theH2CO3* equivalence point. This necessitates that the concept of alkalinity beextended to mixed weak acid/base systems.
Alkalinity definitionLoewenthal et al. (1989) extended the concept of alkalinity to mixtures of weakacid/bases that include the carbonate subsystem. They defined an alkalinity for the

2.9
solution (system) as follows: One reference species is selected for each of the weakacid/bases in solution. Addition of these reference species to pure water gives asolution reference state with associated solution reference state pH (an equivalencepoint for the mixture). Addition of strong base (or acid) to the solution referencestate causes the pH to increase above (decrease below) the solution reference statepH and imparts an alkalinity (negative alkalinity) to the solution. The alkalinityfor the solution is the proton accepting capacity between the solution and thesolution reference state and can be measured in a titration as the mass of H* (orOH") that now must be added to move from the solution pH to the solutionreference state pH. As an example, for a mixture of the carbonate, phosphate andammonium weak acid/bases, the species H2CO3*, H3PO4 and NHJ respectively canbe selected as reference species and addition of these species to pure water definesthe solution reference state for this mixture by some pH, i.e. the equivalent point forthe solution. Addition of strong base to the solution reference state causes the pHto increase and imparts an alkalinity (proton accepting capacity) to the solutioncalled the H2CO3VH3PO4/NHJ alkalinity (Loewenthal et a/., 1989;1991). It can bemeasured in a titration as the mass of H+ that must be added to return to thesolution reference state (solution equivalence point pH). The problem is that inattempting to determine the solution alkalinity it is necessary to know the solutionequivalence point. With mixtures of weak acid/bases of unknown concentration theequivalence point invariably is not known. To resolve this problem, therelationships between the system and subsystem alkalinities need to be set out.
System and subsystem alkaliniticsAnalogous to the carbonate weak acid/base only in water, system and subsystemalkalinities for mixtures of weak acid/bases can be defined (Loewenthal et al.t 1991)as follows:
nSystem alkalinity = S Alkj + Alk H2O (2.11)
j=l
where:Alkj = subsystem alkalinity for the j t h weak acid/base relative to its selected
reference species in a mixture of n weak acid/bases.
Taking the carbonate, phosphate and ammonium weak acid/base mixture as anexample:

2.10
H2CO3*/H3PO4/NH; alkalinity = Alk H2CO3* + Alk H3PO4 + Alk NHJ
+ AlkH2O (2.12)
= {2[COJ-] + [HCO3-]} + {3[PO3-]
+ 2[HPO|-] + [H2PO4~]} +j[NH 3]}
{}Now, in Eq (2.3) we have defined H2CO3*alkalinity = Alk H2CO3* + Alk H2O;accordingly:
H2CO3*alkalinity = H2CO3*/H3PO4/NHJ alkalinity - Alk H3PO4 - Alk NHJ
(2-13)
Thus, by subtracting the alkalinity contributions due to (in this example) thephosphate and ammonium weak acid/base subsystems from the solution alkalinity,the H2CO3*alkalinity can be isolated. The alkalinity contributions for each of thenon-carbonate weak acid/bases can be determined if their total speciesconcentrations are known (Moosbrugger et al., 1993b). However, the problemremains of quantifying the solution alkalinity via titration, a difficult task since thereference solution state pH cannot be identified.
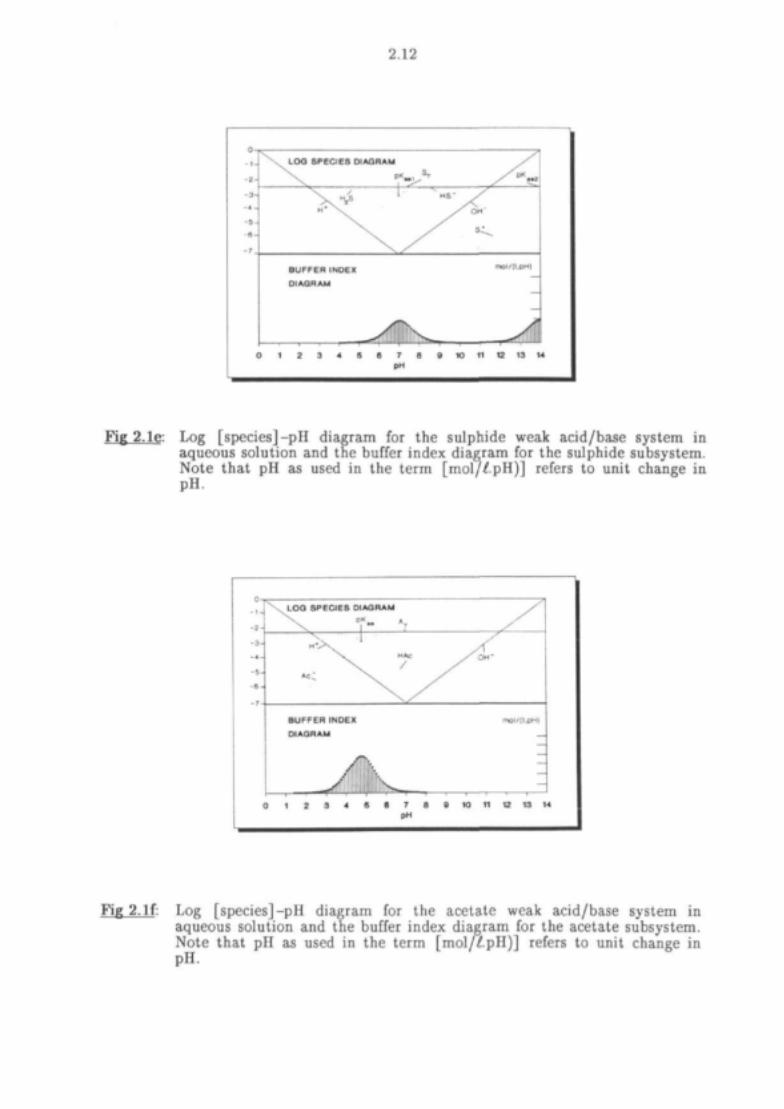
Buffer indexAnalogous to the carbonate weak acid/base only in solution, buffer index curves canbe constructed for any weak acid/base; for examples see Figs 2.1a to 2.If.
For an aqueous solution containing more than one weak acid/base the buffer indexof the system, /?, at any pH is given by the sum of the buffer indices of all the weakacid/base subsystems and the water subsystem:
P = /?al + &2 + /?a3 + • - + Ar (2-13)
where /?aJ, /?a2, /?a3 refer to the buffer indices for the weak acid/base subsystems 1, 2and 3 respectively.
This is illustrated in the pH - buffer index diagrams (Fig 2.1); the buffer index ofthe solution at any pH is given by the sum of the buffer indices for each weakacid/base system present in the solution.

2.11
0 -
- 1 -
- 2 -
- 3 -
- 4 -
-5-
- 0 -
\ L O G SPECIES DIAGRAM
H \
BUFFER INDEX
DIAGRAM
0 1 2 3 4 6 8
N H Q
y
7 8
P«
D K«n
y
JIIIe to
y^y
NH4"
mol/(l,pH)
11 12 13 14
Fig 2.1c: Log [species] -pH diagram for the ammonium weak acid/base system inaqueous solution and the buffer index diagram for the ammoniumsubsystem. Note that pH as used in the term [mol/^.pH)] refers to unitchange in pH.
0 - i
- 8 -
- 3 -
- 4 -
-5-
- B -
\ . LOO SPECIES DIAGRAM
H,PO, \
BUFFER INDEX
DIAGRAM
OK.
HPOj"
\
OH"
y#%&
p ^ -
-
6 6 7 8 9
PH
10 1112 13
Fig 2.Id: Log [species]-pH diagram for the phosphate weak acid/base system inaqueous solution and the buffer index diagram for the phosphatesubsystem. Note that pH as used in the term [mol/£pH)] refers to unitchange in pH.
2.12
BUFFER INDEX
DIAGRAM
moi/(i.pHj
10 11 12 13 M
Fig 2.1e: Log [species] -pH diagram for the sulphide weak acid/base system inaqueous solution and the buffer index diagram for the sulphide subsystem.Note that pH as used in the term [mol//.pH)] refers to unit change inpH.
- 2 -
- 3 -
- 4 -
-5 -
- 6 -
\ ^ L O a SPECIES DIAGRAM\ ^ 0 K
BUFFER INDEXDIAGRAM
.ML
3 1 2 3 * 5
HAc
/
\ /
6 7 8pH
y
x
mol/(l.pH)
-
0 10 11 12 13 14
Fig 2. If: Log [species]-pH diagram for the acetate weak acid/base system inaqueous solution and the buffer index diagram for the acetate subsystem.Note that pH as used in the term [mol/£pH)] refers to unit change inpH.

2.13
Alkalinity and the buffer index diagram for weak acid/base mixtures
With the carbonate weak acid/base only in solution, it was stated that in a titrationbetween two pH points the molar mass of H+ (or OH") added equals the change inH2CC>3*alkalinity and that this change and the two pH values can be used tocalculate the H2CO3*alkalinity. With mixtures of weak acid/bases in solution, intitrating from the first pH to the second pH, the mass of H+ (or OH") ions thatmust be added to the solution equals the area under the solution buffer index curve(sum of areas under all weak acid/base buffer index curves) between the two pHs.From Fig 2.1 it is evident that the non-carbonate weak acid/bases can make asignificant contribution to this area. It is incorrect therefore to equate the mass ofH* (or OH") ions added in the titration to the change in H2CO3*alkalinity becausethe H2CO3*alkalinity is defined to include only the areas contributed by thecarbonate weak acid/base and the water subsystems (Eq 2.3). Rather, addition of amolar mass of strong acid causes the solution alkalinity (e.g. H2CO3*/H3PO4/NHJalkalinity for a mixture of the carbonate, phosphate and ammonium weakacid/bases) to decrease by an equivalent amount (equal to the sum of the areasunder the buffer index curves between the two pHs for all the weak acid/bases inthe solution). If the total species concentrations of each of the non-carbonate weakacid/bases are known, then the contribution of these weak acid/bases to the solutionalkalinity decrease can be subtracted, and the decrease in H2CO3*alkalinitydetermined [similar to Eq (2.13)]; this decrease in H2CO3*alkalinity can be usedagain to quantify the H2CO3*alkalinity. This approach forms the basis for thetitration procedures presented here for determination of H2CO3*alkalinity in amixture of weak acid/bases provided the total species concentration of all thenon-carbonate weak acid/bases are known - the 4 pH point titration (for details seeMoosbrugger et a/., 1993b; 1993c). Using a similar approach, titration procedureshave been developed to determine H2CO3*alkalinity and SCFA total speciesconcentration in a mixture that includes ammonium, phosphate and sulphide weakacid/bases of known concentrations - the 5 pH point titration (for details seeMoosbrugger et al.t 1993b).

CHAPTER 3
4 pH POINT TITRATION PROCEDURE
OBJECTIVE
The testing procedure for the 4 pH point titration method is set out fordetermination of the H2CO3*alkaIinity and the total carbonate speciesconcentration, CT) in aqueous solutions containing zero or known concentrations offree and saline ammonia, inorganic phosphate and sulphides. The method alsoprovides an estimate of any systematic pH error due to inadequate calibration,residual liquid junction effect, or other causes giving rise to a consistent pH error.
BACKGROUND
The theory for this method is set out in detail by Moosbrugger et al(1991;1993b;1993c).
PRINCIPLE
The sample is titrated from its initial pH to 3 further pH points. Knowing theconcentrations of inorganic phosphate, free and saline ammonia and sulphides, theconcentrations of H2CO3*alkalinity and CT are derived from the theory on whichthe method is based. The measured data are entered in a PC program (see attacheddisk and Chapters 5 and 6) to facilitate the necessary calculations.
METHOD
ApparatusThe following apparatus is required:
• titration burette (10 m£) allowing dosing increments of 0,02 m/of titrant• pH meter allowing readings to the second decimal place• pH probe, preferably of the combined glass electrode type• a magnetic stirrer and stirrer bar (length ~ 25 mm)
• thermometer accurate to ± 0,5 °C

3.2
• filter stand and ordinary filter paper, e.g. Schleicher und Schuell 505• measuring pipettes (A grade) from 5 to 50 ml• 100 ml Erlenmeyer flask• specific conductivity meter and probe (if available)• mass scale accurate to ± 1 mg• stop watch.
Chemicals
The following chemicals are required:
• hydrochloric acid• sodium hydroxide• distilled water• anhydrous sodium carbonate• pH buffer solutions (pH = 4,00 and pH = 7,00).
The hydrochloric acid requires accurate standardization, see Appendix AStandardization of strong acid. With the sample volumes (for anaerobic digestersamples) suggested in the testing procedure below, standardization of the strong acidsolution of hydrochloric acid to about 0,08 N is recommended, using high puritysodium carbonate. The strong base solution of sodium hydroxide (if required),should be made up to approximately the same normality as the hydrochloric acid,e.g. 0,08 to 0,1 N; standardization of the strong base is not necessary.
The pH probe needs to be calibrated using two pH buffer solutions bracketing thepH titration range of the 4 pH point titration (excluding the initial pH). It isrecommended to use the following two National Bureau of Standards (NBS) buffersolutions: (1) 0,05 M KH phthalate buffer (pH = 4,00 at 25 °C); and (2) 0,0275 Mdisodium hydrogen phosphate and 0,025 M potassium dihydrogen phosphate (pH7,00 at 25 °C).
Ancillary measurementsAll ancillary measurements are made on the filtered undiluted samples.
Ammonium/ammonia total species concentrationTo enhance the accuracy of the H2CO3*alkalinity and CT estimates the influence ofthe ammonium weak acid/base subsystem on the 4 pH point titration can be

3.3
minimized by taking into account its total species concentration (Nj) in thealgorithm employed to calculate the H2CO3*alkalinity and CT. The NT can bemeasured according to Standard Methods (1989) and is measured on the undilutedsample. If no measurement is available an approximate estimate of N^, or NT =zero, is entered into the computer program. An assessment of error in measurementor neglect of this subsystem on the estimates of H2CO3*alkalinity and CT ispresented by Moosbrugger et al (I991;1993c); neglect of NT does not have asignificant influence on the estimates of H2CO3*alkalinity and Cx- If noammonium/ammonia is present in the sample, NT = zero is entered into thecomputer program.
Phosphate total species concentrationAnalogous to the ammonium weak acid/base subsystem the accuracy of theH2CO3*alkalinity and CT estimates can be enhanced by taking into account thetotal species concentration of the phosphate weak acid/base subsystem (PT)- ThePT can be measured according to Standard Methods (1989), and is measured on theundiluted sample. If no measurement is available an approximate estimate of PT,or, PT = zero is entered into the computer program. An assessment of error inmeasurement or neglect of this subsystem on the estimates of H2CO3*alkalinity andCx is presented by Moosbrugger et al. (1991;1993c); neglect of PT has a significantinfluence on the estimates of H2CO3*alkalinity and CT- If no phosphate is presentin the sample, PT = zero is entered into the computer program.
Sulphide total species concentrationAnalogous to the ammonium and phosphate weak acid/base subsystems, theaccuracy of the H2CO3*alkalinity and CT estimates can be enhanced by taking intoaccount the total species concentration of the sulphide weak acid/base subsystem(Sj). The ST can be measured according to Standard Methods (1989) and ismeasured on the undiluted sample. If no measurement is available, an approximateestimate of ST or ST = zero is entered in the computer program. In most situations,the concentrations of sulphides will be minor compared to the carbonate subsystem(Moosbrugger et ai, 1991;1993c) and its neglect in estimation of H2CO3*alkalinityand CT will give rise to negligible error. If no sulphides are present in the sample,ST = zero is entered into the computer program.

3.4
Total dissolved solids (TDS) or specific conductivity (SC) of undiluted sampleTo calculate the apparent dissociation constants of the different weak acid/bases(carbonate, free and saline ammonia, inorganic phosphate and sulphide) in thecomputer program the total dissolved solids (TDS), or alternatively the specificconductivity (SC), of the undiluted sample must be entered and hence needs to bemeasured. Accurate measurement of one of these parameters requires additionalexperimental effort which may not be justified - the algorithm developed todetermine CT and H2CO3*alkalinity acts in a compensative fashion to make theestimates of CT and H2CO3*alkalinity relatively insensitive to TDS or SC. Henceapproximation of TDS or SC is adequate in most cases. Whether measurement ofTDS or SC for each test is necessary will depend on the accuracy desired for thedetermination of CT and H2CO3*alkalinity.
Sample preparationThe undiluted sample must be representative of the liquid to be tested. Usually asufficiently large liquid volume is available for testing purpose. Filter the sampleprior to the titration to separate the solid from the liquid phase and expel CO 2 fromthe sample (this has the important effect of raising the pH of the undiluted sample,a matter of particular importance in the event that the pH of the undiluted sampleis below 6,7). The ancillary measurements are done on the filtered undiluted sample.From the filtered undiluted sample a volume needs to be selected for titration; achoice has to be made with regard to:
• Sample size (m£) undiluted.• Sample size (m£) diluted.
Sample size (undiluted)The choice of undiluted sample volume is determined by the dilution required andthe diluted sample volume [see section Sample size (diluted) below]. Dilution of thesample is necessary for two reasons: (1) to achieve a total carbonate speciesconcentration, CT, below about 500 mg/l as CaCO3 to avoid undue CO2 loss duringtitration; and (2) to reduce the temperature of the diluted sample to about 20 to25 " C. Dilutions to meet these requirements are recommended for optimalaccuracy. Experience has shown that for TDS up to 15 000 mg//, TDS usually isnot a criterion in dilution (for analysis see Chapter 4). The dilution ratio is kept aslow as possible to avoid multiplication effects of titration errors:H2CC>3*alkalinity/CT determined by titration are for the diluted sample; the

3.5
respective values for the undiluted sample are obtained by multiplying the values ofthe diluted sample with the dilution ratio. Hence, any titration error in the dilutedsample will be multiplied by the dilution ratio leading to loss of accuracy andprecision.
Sample size (diluted)The diluted sample size depends on the physical properties of the pH probe and thetitration vessel. In developing the 4 pH point titration method, the pHs weremeasured using a combined glass electrode (Radiometer Copenhagen GK2401C).The basic physical requirement to be satisfied is that the tip and porous pin (liquidjunction) are immersed in the sample below the liquid surface. With the 100 mlErlenmeyer flask as titration vessel, for the Radiometer probe the tip and porous pinare well immersed using a diluted sample volume of 50 ml. With titration vesselsgreater than 100 m^ greater diluted sample volumes are required. UsingErlenmeyer flasks as titration vessels, in general, it should be noted that the surface(open to atmosphere) to volume ratio of the diluted sample should be small tominimize CO2 loss; stirring time should be short and the stirring rate gentle in orderto minimize CO2 loss, yet adequate to achieve homogeneous mixing conditions.From practical experience these conditions appear to be satisfied with 50 ml ofdiluted sample in a 100 ml Erlenmeyer flask using a magnetic stirrer bar of 25 mmlength rotating at approximately 60 rpm. Dilution of the sample is effected bypipetting a volume of undiluted sample, say 10 ml, into the flask and making up thevolume to 50 ml by adding distilled water, in this case 40 ml.
Titration procedureThe 4 pH point titration involves the following step by step procedure:
(1) Draw sample and filter using ordinary filter paper, e.g. Schleicher and Schuell
505. On the filtered sample, measure TDS (or SC), PT, NT and ST.
(2) Pipette 50 m^ of filtered sample into a 100 ml Erlenmeyer flask. If dilution isrequired pipette a smaller amount of filtered sample, say 10 m£, into the flaskand make up the volume to 50 ml by adding distilled water, in this case40 ml. The requirement for dilution is that CT is below about 500 mg/l asCaCO3.

3.6
(3) Insert thermometer and pH probe, stir gently (± 60 rpm with magnetic stirrerbar of 25 mm) for 15 seconds (s), take temperature reading, removethermometer and stop stirring.
(4) Wait a further 45 s and record initial pH (pH0) reading (this gives the probe atotal stabilization period of 60 s at pH0).
(5) Switch on stirrer and titrate sample from pH0 to pHi (6,7 ± 0,1). Whenhas been reached, stir for about 30 s, then switch off stirrer, record volume oftitrant added from pHo to pHi and take pHi reading about 30 s aftertermination of stirring. The volume of titrant added to titrate from pHo to
is designated Vxl.
(6) Repeat step (5) to titrate from pHi to pH2 (5,9 ± 0,1), from pH2 to pH3 (5,2 ±0,1). The volumes of titrant recorded at each pH point (Vx2, Vx3) are thecumulative volumes, i.e. the volume added from the initial pH point (pHo) toreach the respective lower pH points.
Note: If the initial pH (pHo) of the diluted sample is below 6,7, then pHo isrecorded; strong base is added to raise pH0 to pHj = 6,7 ± 0,1. The volume ofstrong base added is Vxi when entered into the computer program. Acid titrationcommences from pHj. The cumulative volumes for the strong acid titration, VX2and VX3, are the sum of strong base and acid volumes added to reach pH2 and PH3from the initial pH point,
If pH0 of the diluted sample is 6,7 ± 0,1 then pH0 equals pHt and Vxi = 0 (Vxi isset to zero when entered into the computer program). The cumulative volumes forthe strong acid titration VX2 and VX3 are the strong acid volumes added to reach
and pH3 from the starting pH point, pH0 =
Depending on the initial pH of the diluted sample, two different types of titration
data tables will be obtained which can be summarized as follows:
(1) Data table for titration with strong acid only (if initial diluted sample pH
> 6,7):

3.7
0 : initial diluted sample pH (pH0) > 6,7Vxi : pH, (6,70 ± 0,1) (Vxl = 0 if pH0 = 6,7)
V,3 : PH2 (5,90 ± 0,1)Vx3 = pH3 (5,20 ± 0,1)
Note that VX2 and Vx3 are the cumulative volumes of strong acid added.
(2) Data table for titration with strong acid after addition of a strong base toraise the initial pH to pHi (if initial diluted sample pH < 6,7 ± 0,1):
V* :0 : initial diluted sample pH (pH0) < 6,7Vxi : pHi (6,7 ± 0,1 after adding Vxi ml of strong base)Vx2 : pH2 (5,90 ± 0,1)Vx3 : pH3 (5,20 ± 0,1)
Note that VX2 and Vx3 are the sum of the volume of strong base and thecumulative volume of strong acid added.
Ideally, the pH values should be located within a ± 0,1 limit of the values givenabove (easily attainable even with little experience). In some cases the pH valuespHi, pH2 and pH3 might be outside the above mentioned limit of ± 0,1 pH units, saydue to "over enthusiastic" addition of titrant. However, from experience if thesample is being "over titrated" accidentally it is not necessary to repeat thetitration provided the pH value is located within 0,2 pH units from the appropriatevalue. If the sample is being "under titrated", step (5) of the step by stepprocedure may be repeated to obtain pHi, pH2 or pH3 within the acceptable limit of± 0,1 pH* units from the appropriate pH value.
CALCULATION OF RESULTS
Input data for computer program
H2CO3*alkalinity and CT are calculated using the personal computer programTITRA4 (see floppy disk and Chapter 5). The input data required from thetitration for the computer program are as follows:

3.8
pHo - initial pH of diluted samplepHi - pH after addition of VXI
pH2 - pH after addition of VX2pH3 - pH after addition of VX3Vxi (m/) - Volume of strong acid or base added from pH0 toV*2 (m^) ~ Cumulative volume of strong acid (and strong base, if any) added
from pHo to pH2Vx3 (ml) - Cumulative volume of strong acid (and strong base, if any) added
from pHo to PH3Normality of strong acid titrant (mol//)Sample size (undiluted) (m£)Sample size (diluted) (m£)Temperature (°C)
TDS (mg/£) - Total dissolved solids, or,SC ( mS/m) - Specific conductivityNT (mg/^ as N) - Total species cone, of free and saline ammoniaPT (mg// as P) - Total species cone, of inorganic phosphateST (mg/£ as S) - Total species cone, of sulphides
Note that either TDS or SC need to be entered in the program; if TDS is enteredSC is calculated internally, and, similarly, TDS is calculated if SC is entered. Theparameters TDS (or SC), NT, PT and ST are measurements on the undiluted sample.
Output data from computer programThe computer program supplies the following data:
• H2CO3*alkalinity of undiluted sample (mg/l as CaCO3)• Total carbonate species concentration (CT) of undiluted sample (mg/^as CaCOg)• Estimate of systematic pH error
Note:(1) The systematic pH error may be due to poor pH probe calibration, residual
liquid junction or any other effects on the pH electrode. The systematic pHerror is taken into account automatically by the program in calculatingH2CO3*alkalinity and CT.

3.9
(2) The correction for systematic pH error is subject to the condition that thecarbonate weak acid/base dominates [i.e. CT > 2-(NT + PT + ST)] in thesample.
(3) The maximum correction for systematic pH errors made by the program is setto ± 0,2 pH units. From practical experience an average systematic pH errorof about - 0,05 pH units will be encountered with the diluted sample. Itwould appear therefore that with systematic pH errors of > ± 0,2 indicated bythe computer program, the pH probe needs to be recalibrated and the testrepeated.
(4) The H2CO3*alkalinity and CT are the concentrations present in the undilutedsample. The H2CO3*alkalinity of the undiluted sample is identical to that ofthe in situ solution. However, Of of the undiluted sample and in situ solutionmay differ due to CO 2 loss between sampling and testing. If CT of the in situsolution is required, this is found from the in situ pH, in situ temperature, insitu TDS and the undiluted sample H2CO3*alkalinity measured with the 4 pHpoint titration method, see Loewenthal et al. (1989). Usually in situ CT is ofno practical importance and therefore this calculation is not included in thecomputer programs.
CHAPTER 4
5 pH POINT TITRATION PROCEDURE
OBJECTIVE
The testing procedure for the 5 pH point titration method is set out fordetermination of the H2CO3*alkalinity (via the total carbonate speciesconcentration, Cj, and initial sample pH) and SCFA in aqueous solutions alsocontaining zero or known concentrations of the ammonium, phosphate and sulphideweak acid/bases, e.g. anaerobic digester liquid. The method also provides anestimate of any systematic pH error due to inadequate calibration, residual liquidjunction effect, or other causes giving rise to a consistent pH error. It wasdeveloped for application in monitoring anaerobic fermentation systems.
BACKGROUND
The theory of the method is set out in detail by Moosbrugger et al. (1991;1993d).
PRINCIPLE
The sample is titrated from its initial pH to 4 further pH points. Knowing theconcentrations of inorganic nitrogen, phosphate and sulphides, the concentrations ofSCFA and H2CO3*alkalinity can be derived from the theory on which the method isbased. The measured data are entered in a PC program to facilitate the necessarycalculations (see attached disk and Chapters 5 and 6).
METHOD
ApparatusThe following apparatus is required:• titration burette (10 vat) allowing dosing increments of 0,02 ml of titrant• pH meter allowing readings to the second decimal place
• pH probe, preferably of the combined glass electrode type• a magnetic stirrer and stirrer bar (length ~ 25 mm)
• thermometer accurate to ± 0,5 'C

4.2
• filter stand and ordinary filter paper, e.g. Schleicher und Schuell 505• measuring pipettes (A grade) from 5 to 50 ml• 100 ml Erlenmeyer flask
• specific conductivity meter and probe (if available)• mass scale accurate to ± 1 mg• stop watch.
ChemicalsThe following chemicals are required:• hydrochloric acid• sodium hydroxide• distilled water• anhydrous sodium carbonate• pH buffer solutions (pH = 4,00 and pH = 7,00).
The hydrochloric acid requires accurate standardization, see Appendix AStandardization of strong acid. With the sample volumes (for anaerobic digestersamples) suggested in the testing procedure below, standardization of the strong acidsolution of hydrochloric acid to about 0,08 N is recommended, using high puritysodium carbonate. The strong base solution of sodium hydroxide (if required),should be made up to approximately the same normality as the hydrochloric acid,e.g. 0,08 to 0,1 N; standardization of the strong base is not necessary.
The pH probe needs to be calibrated using two pH buffer solutions bracketing thepH titration range of the 5 pH point titration (excluding the initial pH). It isrecommended to use the following two National Bureau of Standards (NBS) buffersolutions: (1) 0,05 M KH phthalate buffer (pH = 4,00 at 25 °C), and (2) 0,0275 Mdisodium hydrogen phosphate and 0,025 M potassium dihydrogen phosphate (pH7,00 at 25 °C).
Ancillary measurementsAll ancillary measurements are made on the filtered undiluted samples.
Inorganic nitrogen total species concentrationTo enhance the accuracy of the H2CO3*alkalinity and SCFA estimates, the influenceof the ammonium weak acid/base subsystem on the 5 pH point titration can beminimized by taking into account its total species concentration (NT) in the

4.3
algorithm employed to calculate the H2CO3*alkalinity and SCFA. The NT can bemeasured according to Standard Methods (1989), and is measured on the undilutedsample. If no measurement is available an approximate estimate of NT, or NT =zero, is entered into the computer program. An assessment of error in measurementor neglect of this subsystem on the estimates of H2CO3*alkalinity and SCFA, ispresented by Moosbrugger et al (I991;1993b); neglect of NT does not have asignificant influence on the estimates of H2CC>3*alkalinity and SCFA. If theammonium weak acid/base is not present in the sample, NT = zero is entered intothe computer program.
Inorganic phosphate total species concentration
Analogous to the ammonium weak acid/base subsystem, the accuracy of theH2CO3*alkalinity and SCFA estimates can be enhanced by taking into account thetotal species concentration of the phosphate weak acid/base subsystem (P-r)- ThePT can be measured according to Standard Methods (1989), and is measured on theundiluted sample. If no measurement is available an approximate estimate of P j ,or, PT = zero is entered into the computer program. An assessment of error inmeasurement or neglect of this subsystem on the estimates of H2CO3*alkalinity andSCFA, is presented by Moosbrugger et al (1991;1993d); neglect of PT has asignificant influence on the estimates of H2CO3*alkalinity and SCFA. If thephosphate weak acid/base is not present in the sample, P j = zero is entered intothe computer program.
Sulphide total species concentration
Analogous to the ammonium and phosphate weak acid/base subsystems, theaccuracy of the H2CO3*alkalinity and CT estimates can be enhanced by taking intoaccount the total species concentration of the sulphide weak acid/base subsystem(ST). The ST can be measured according to Standard Methods (1989) and ismeasured on the undiluted sample. If no measurement is available, an approximateestimate of ST or ST = zero is entered in the computer program. In most situations,the concentrations of sulphides will be minor compared to the carbonate subsystem(Moosbrugger et al., 1991;1993a) and its neglect in estimation of H2CO3*alkalinityand CT will give rise to negligible error. If no sulphides are present in the sample,Sj = zero is entered into the computer program.
Total dissolved solids (TDS) or specific conductivity (SC) of undiluted sample
To calculate the apparent dissociation constants of the different weak acid/bases

4.4
(carbonate, SCFA, free and saline ammonia, inorganic phosphate and sulphide) inthe computer program, the total dissolved solids (TDS) or alternatively the specificconductivity (SC) of the undiluted sample must be entered and hence needs to bemeasured. Accurate measurement of one of these parameters requires additionalexperimental effort which may not be justified - the algorithm developed todetermine the SCFA and H2CO3*alkalinity acts in a compensative fashion to makethe estimates of SCFA and H2CO3*alkalinity relatively insensitive to TDS or SC.Hence, approximation of TDS or SC is adequate in most cases. Accordinglymeasurement of TDS or SC may not prove necessary for each filtered sample, butmay be done only daily or weekly depending on the expected variations of theoperating conditions of the reactor. Whether measurement of TDS or SC for eachtest is necessary will depend on the accuracy desired for the determination of SCFAand H2CO3*alkalinity.
To illustrate the effect of errors in TDS on the calculation of H2CO3*alkalinity andSCFA, consider the following hypothetical example: Take a typical set of titrationdata for an anaerobic reactor liquid sample: Vs (diluted) = 50 m ,̂ Vs (undiluted) =10 ml, SCFA = 300 mg/l as HAc, H2CO3*alkalinity = 1740 mg/l as CaCO3, TDS= 3340 (mg/fl, temperature = 21 *C (after dilution) and NT = PT = ST = 0 mg/l;SCFA and H2CO3*alkalinity values are calculated using various hypothetical valuesfor TDS ranging from 1 000 to 7 000 mg/l. (in the undiluted sample). The resultsfor these calculations are shown plotted in Fig 4.1. The plot indicates that SCFAand H2CO3*alkalinity determined with the 5 pH point titration method are notsensitive to changes in TDS (or SC).
Sample preparation
The undiluted sample has to be representative of the liquid to be tested. Usually asufficiently large liquid volume is available for testing purpose. Filter the sampleprior to the titration to separate the solid from the liquid phase and expel CO 2 fromthe sample (this has the important effect of raising the pH of the undiluted sample,a matter of particular importance in the event that the pH of the undiluted sampleis below 6,7). The ancillary measurements are done on the filtered undiluted sample.
From the filtered undiluted sample a volume needs to be selected for titration; achoice has to be made with regard to:• Sample size (m£) undiluted
• Sample size (m/) diluted.

4.5
400
200
100
0
HAc (mg/l) H2CO3-ALK (g/l • • CaCOS)
H2CO3-ALK 1
H - «CFA 1
--
- " 1 1 • 1 . "1 ' ' * ' *— •
-
TDS OF UNDILUTED SAMPLE
. . \ . . .
1 1 2 3 4 6 6
3.6
3
2-5
2
1.6
1
0.6
r
TDS (g/l)
Fig 4.1.: Influence of changes in the total dissolved solids concentration (TDS) onthe determination of SCFA and H2CO3*alkalinity with the aid of the 5pH point titration method: SCFA and H2CC>3*alkalinity values for asample containing 300 mg/l of HAc and 1 740 mg/£ as CaCO3 ofH2CO3*alkaIinity are calculated with hypothetical TDS concentrationsranging from 1 000 to 7 000 mg/L
Sample size (undiluted)
The choice of undiluted sample volume is determined by the dilution ratio requiredand the diluted sample volume [see section Sample size (diluted) below]. Dilution ofthe sample is necessary for two reasons: (1) to achieve a total carbonate speciesconcentration, CT, below about 500 mg/l as CaCC>3 to avoid undue CO2 loss duringtitration; and (2) to reduce the temperature of the diluted sample to about 20 to25 " C. Dilutions to meet these requirements are recommended for optimalaccuracy.
For anaerobic reactor liquids, generally the above conditions will be satisfied using adilution ratio of 1:4 (1 in 5 or 5 times dilution). Normally a diluted sample volumeof 50 m^is adequate (see below); this implies an undiluted sample volume of 10 ml
which is made up to 50 ml by addition of distilled water. The dilution ratio is keptas low as possible to avoid multiplication effects of titration errors:H2CO3*alkalinity/CT and SCFA determined by titration are for the diluted sample;

4.6
the respective values for the undiluted sample are obtained by multiplying thevalues of the diluted sample with the dilution ratio. Hence, any titration error inthe diluted sample will be multiplied by the dilution ratio leading to loss ofaccuracy and precision.
Sample size (diluted)
The diluted sample size depends on the physical properties of the pH probe and thetitration vessel. In developing the 5 pH point titration method, the pHs weremeasured using a combined glass electrode (Radiometer Copenhagen GK2401C).The basic physical requirement to be satisfied is that the tip and porous pin (liquidjunction) are immersed in the sample below the liquid surface. With the 100 mlErlenmeyer flask as titration vessel, for the Radiometer probe the tip and porous pinare well immersed using a diluted sample volume of 50 ml. With titration vesselsgreater than 100 ml, greater diluted sample volumes are required. UsingErlenmeyer flasks as titration vessels, in general, it should be noted that the surface(open to atmosphere) to volume ratio of the diluted sample should be small tominimize CO2 loss; stirring time should be short and the stirring rate gentle in orderto minimize CO2 loss, yet adequate to achieve homogeneous mixing conditions.From practical experience these conditions appear to be satisfied with 50 ml ofdiluted sample in a 100 ml Erlenmeyer flask using a magnetic stirrer bar of 25 mmlength rotating at approximately 60 rpm.
Titration procedure
The 5 pH point titration involves the following step by step procedure:
(1) Draw sample and filter using ordinary filter paper, e.g. Scheicher and Schuell505. On the filtered sample, measure TDS (or SC), PT, NT and ST.
(2) Pipette 10 ml of the filtered sample and 40 ml distilled water into a 100 ml
Erlenmeyer flask to give a dilution ratio of 1:4 (1 in 5 or 5 times dilution).The requirement for dilution is to have CT diluted to smaller than about 500mg/l as CaCO3. (With the dilution ratio of 1:4 this condition usually will besatisfied for anaerobic digester liquids. If subsequently from the analysis it isfound that CT > 500 mg/l as CaCC>3 then the test needs to be repeated at ahigher dilution ratio, estimated from the initial test results).
(3) Insert thermometer and pH probe, stir gently for 15 seconds (s), take

4.7
temperature reading, remove thermometer and stop stirring.
(4) Wait a further 45 s and record initial pH (pH0) reading (this gives the probe atotal stabilization period of 60 s at pH0).
(5) Switch on stirrer and titrate sample from pH0 to pHi ( 6,7 ± 0,1), When pHjhas been reached, stir for about 30 s, then switch off stirrer, record volume oftitrant added from pH0 to pHi and take pHi reading about 30 s aftertermination of stirring. The volume of titrant added to titrate from pH0 topHi is designated Vxi-
(6) Repeat step (5) to titrate from pH[ to pHj (5,9 ± 0,1), from pH2 to pH3 (5,2 ±0,1) and from pHa to pH4 (4,3 ± 0,1). The volumes of titrant recorded ateach pH point (VX2, VX3, VX4) are the cumulative volumes, i.e the volumeadded from the initial pH point (pHo) to reach the respective lower pH points.
Note: If the initial pH (pH0) of the diluted sample is below 6,7 then pH0 isrecorded; strong base is added to raise pHo to pHj = 6,7 ± 0,1. The volume ofstrong base added is Vxi when entered in the computer program. Acid titrationcommences from pHj. The cumulative volumes for the strong acid titration, VX2,VX3 and VX4 are the sum of strong base and acid volumes added to reach pH2,and pH4 from the initial pH point,
If pH0 of the diluted sample is 6,7 ± 0,1 then pHo equals pHt and Vx l = 0 (Vxl isset to zero when entered into the computer program). The cumulative volumes forthe strong acid titration VX2, VX3 and VX4 are the cumulative strong acid volumesadded to reach pH2, pH3 and pH4 from the starting pH point, pHo =
Depending on the initial pH of the diluted sample, two different types of titrationdata tables will be obtained which can be summarized as follows:
(1) Data table for titration with strong acid only (if initial diluted sample pH >
6,7):
Vx : pHx
0 : initial diluted sample pH (pH0) > 6,7Vxi : pH, (6,70 ± 0,1) (Vxl = 0 if pH0 = 6,7)

4.8
Vx2 :Vx3 :
Vx4 :
pH2
pH3
pH4
(5,(5,(4,
90 ±20 ±30 ±
000
-1)
,1)
,1)
Note that Vx2, VX3 and VX4 are the cumulative volumes of strong acid added.
(2) Data table for titration with strong acid after addition of a strong base toraise the initial pH to pHi (if initial diluted sample pH < 6,7 ± 0,1):
Vx
0VV,V
xl
x3
initial diluted sample pH (pH0) < 6,7pHi (6,7 ± 0,1 after adding Vxl ml of strong base)pH2 (5,90 ± 0,1)pH3 (5,20 ± 0,1)pH4 (4,30 * 0,1)
Note that Vx2, Vx3 and VX4 are the sum of the volume of strong base and thecumulative volume of strong acid added.
Ideally the pH values should be located within a ± 0,1 limit of the values givenabove (easily attainable even with little experience). In some cases the pH valuespHi, pH2, pHs and pH4 might be outside the above mentioned limit of ± 0,1 pHunits, say due to "over enthusiastic" addition of titrant. However, from experienceif the sample is being "over titrated" accidentally it is not necessary to repeat thetitration provided the pH value is located within 0,2 pH units from the appropriatevalue. If the sample is being "under titrated", step (5) of the step by stepprocedure may be repeated to obtain pHi, pH2, pH3 or pH4 within the acceptablelimit of ± 0,1 pH units from the appropriate its ideal pH value.
CALCULATION OF RESULTS
Input data for computer programThe H2CO3*alkalinity and SCFA of the undiluted sample are calculated from theancillary data obtained on the undiluted sample and the titration data obtained onthe diluted sample; the personal computer program TITRA5 is used for thecalculations (see floppy disk and Chapter 5). The input data required from thetitration for the computer program are as follows:

4.9
pH0- initial pH of diluted sample- pH after addition of Vxi- pH after addition of Vx2
pH3- pH after addition of Vx3
PH4- pH after addition of Vx4
Vxi (m^) - volume of strong acid or base added from pHo to pHjVx2 (m£) - Cumulative volume of strong acid (and strong base, if any) added
from pHo to pH2VX3 (m£) - Cumulative volume of strong acid (and strong base, if any) added
from pH0 to PH3VX4 (m£) - Cumulative volume of strong acid (and strong base, if any) added
from pHo to pH4
Normality of strong acid titrant (mol/^)Sample size (undiluted) (mt)
Sample size (diluted) (m^)Temperature (°C)TDS (mg//) - Total dissolved solids, or,SC ( mS/m) - Specific conductivityNT (mg/l as N) - Total species cone, of free and saline ammoniaPT (mg/t as P) - Total species cone, of inorganic phosphateST (mg/£ as S) - Total species cone of sulphides
Note that either TDS or SC needs to be entered in the program: if TDS is enteredSC is calculated internally and similarly, TDS is calculated if SC is entered. Theparameters TDS (or SC), NT, PT and Sx are measurements on the undiluted sample.
Output data from computer programThe computer program supplies the following data:
• H2CO3*alkalinity of undiluted sample (mg/£ as CaCO3)• SCFA of undiluted sample (mg/l as acetic acid)• Estimate of systematic pH error
Note:
(1) The systematic pH error may be due to poor pH probe calibration, residualliquid junction or any other effects on the pH electrode. The systematic pHerror is taken into account automatically by the program in calculatingH2CO3*alkalinity and SCFA.

4.10
(2) The correction for systematic pH error is subject to the condition that thecarbonate weak acid/base dominates in the sample, i.e. SCFA (mg/l as aceticacid) needs to be smaller than about 0,5-CT (mg/^ as CaCO3). This conditionis tested internally by the program. If the condition is not met no correctionfor systematic pH error is made by the program and a message is displayed inthe output data table that no correction has been made; the resulting loss inaccuracy in the remaining output data will however remain within acceptablelimits for the purpose of monitoring of anaerobic digesters. (This situationwill develop only when the digester is showing signs of failure, in which eventaccurate estimates of SCFA and H2CO3*alkalinity no longer is essential).
(3) The maximum correction for systematic pH errors made by the program is setto ± 0,2 pH units. If the systematic pH error is greater than ± 0,2 pH unitsthis is displayed on the screen with the recommendation that the probe shouldbe recalibrated. From practical experience (with samples from anaerobicdigesters) an average systematic pH error of about - 0,05 pH units will beencountered. It would appear therefore that with systematic pH errors of >± 0,2 indicated by the computer program, the pH probe most likely is in errorand needs to be recalibrated, and the test repeated.
(4) The H2CO3*alkalinity and SCFA are the concentrations present in theundiluted sample, i.e. the concentrations in the reactor. The concentration ofCT in the undiluted sample, however, is not equal to the concentration in thereactor due to CO 2 loss between sampling and testing. If CT in the reactor isrequired, this is found from the reactor in situ pH, temperature, TDS (or SC)of the reactor liquid and the undiluted H2CO3*alkalinity determined with the5 pH point titration method, see Loewenthal et al. (1989). Usually in situ CT
is of no practical importance and therefore this calculation is not included inthe computer programs.

CHAPTER 5
THE COMPUTER PROGRAMS
INTRODUCTION
The experimental procedures for the 4 and 5 pH point titrations are set out inChapters 3 and 4 respectively. Equations for calculating H2CO3*alkalinity orH2CO3*alkalinity and short-chain fatty acid total species concentration (AT) usingthe data obtained from the 4 and 5 pH point titration methods respectively havebeen set out in detail by Moosbrugger et al. (1993b;1993c;1993d). Manually,calculations using these equations are laborious and tedious. To facilitatecalculation and make the titration procedures more readily usable, algorithms of thecalculation procedures for the 4 and 5 pH point titrations have been developed andare encoded in two computer programs, TITRA4 and TITRA5 respectively. Fromthe data obtained in the 4 pH point titration, TITRA4 calculates H2CO3*alkalinityand carbonate total species concentration (CT). From the data in the 5pH pointtitration, TITRA5 calculates H2CO3*alkalinity and short-chain fatty acid totalspecies concentration (AT). Both programs allow a check on the pH probe byproviding an estimate of a systematic pH error where this may be present, due topoor calibration, residual liquid junction effect or any other influences on the glasselectrode. The systematic pH error is taken into account automatically by thecomputer programs in the calculations. Also, both programs take into account theammonium, phosphate and sulphide weak acid/bases where these may be presentprovided their total species concentrations are known. These considerations increasethe accuracy of the parameters calculated from the titration data.
In this Chapter, details of the programs are supplied.
SYSTEM REQUIREMENTS
The programs will run on all IBM PC, XT, AT, 386, 486 or true compatiblemachines using DOS 3.3 or higher. At least 256K of RAM are required, a conditionmet by most computers. Numeric co-processors are not required. The programs donot require a graphics adapter, and will run with CGA, EGA, VGA, ATT, PC 3270or Hercules graphics adapters.

5.2
SUPPLIED DISK
A 5{ inch floppy disk will be found on the inside of the back cover of the manual.This distribution disk is formatted for a standard 5{ inch 360K disk drive.
IMPORTANT NOTE II
No attempt should be made to run the programs directly fromthe distribution disk. Users are advised, for their ownprotection, to make a back—up copy of the distribution diskand to store the original. Instructions on how to make aback—up disk follow in the section below.
BACK-UP COPIES
The distribution disk is formatted for a standard 5{ inch 360K disk drive, and canbe read by an IBM PC or compatible. The following procedure can be used to makea back-up copy of the distribution disk:
• Find a new (or unused) floppy disk.
• Boot up your computer.
• At the system prompt type diskcopy A: B: and press <Enter>. The messageInsert source diskette into drive A: will be displayed on the screen. Remove anydisk from drive A and replace it with the distribution disk.
• If your system has two floppy disk drives, the screen will say Insert destinationdiskette into drive B: . In that case remove any disk from drive B, replacing itwith the blank disk. If your system has only one floppy drive then you will beswapping disks in drive A. Remember that the distribution disk is the sourcedisk and the blank disk is the destination disk.
• Now press <Enter>. The computer will start reading from the source disk indrive A.
• If you have a two-drive system the computer will then write to the destinationdisk in drive B and continue reading from drive A and writing to drive B untilcopying is complete. If you have a one-drive system you will be asked to
5.3
alternatively put the destination disk and the source disk in drive A untilcopying is finished.
FILES ON THE DISTRIBUTION DISK
The distribution disk contains the following four files:
TITRA4.PASTITRA4.EXETITRA5.PASTITRA5.EXE
The files TITRA4.EXE and TITRA5.EXE are the two executable programs forthe 4 and 5 pH point titration methods respectively.
The files TITRA4.PAS and TITRA5.PAS are the listed versions of the abovetwo computer programs; the programs are written using Borland's Turbo PascalVersion 4.0 and can be listed with the Borland compiler/editor. Also, alterations tothe programs can be made using this compiler/editor. [Should the user make anyalterations, the authors request that details of these alterations be forwarded to themfor possible incorporation in future versions of the programs].
SETTING UP ON A HARD DISK SYSTEM
The most convenient method for running the programs is on a hard disk system. Toset up the programs to run from a hard disk, the procedure outlined below isfollowed:
• Assuming that the hard disk is designated as drive C, type the followingcommands (pressing <Enter> at the end of each line):
c:cd c:\mkdir titrate
If the hard disk is not designated as drive C, replace C by the relevantdesignation code.

5.4
• Place the distribution disk in the disk drive (usually drive A).
• Change to the subdirectory TITRATE by entering the command
cd c:\titrate
• At the DOS prompt on the screen (C:> or C:\TITRATE>) type the followinginstructions (pressing <ENTER> at the end of each line):
copy aititra4.execopy a:titra5.exe
STARTING PROGRAM EXECUTION
Floppy disk system:• Boot up the computer from a DOS disk in drive A:
• Remove the DOS disk from drive A: and replace with the back-up copy of thedistribution disk.
• To initiate the execution of the program for the 4 pH point titration, at theDOS prompt A:> the user must type
titra4.exe
and then press the carriage return key.
• To initiate the execution of the program for the 5 pH point titration, at theDOS prompt A:> the user must type
titra5.exe
and then press the carriage return key.
• The program will be loaded into memory from disk and start execution.

5.5
Hard disk system:• Boot up the system from the hard disk.
• If not done previously, follow instructions in the above section SETTING UPON A HARD DISK SYSTEM.
• Change to the subdirectory TITRATE by entering the command
cd c:\titrate
• To initiate the execution of the program for the 4 P& point titration, at theDOS prompt C:> or C:\TITRATE> the user must type
titra4.exe
and then press the carriage return key.
• To initiate the execution of the program for the 5 pH point titration, at theDOS prompt C:> or C:\TITRATE> the user must type
titra5.exe
and then press the carriage return key.
• The program will be loaded into memory from disk and start execution.
RUNNING THE PROGRAMS
Taking the 5 pH point titration program TITRA5 as an example, execution of theprogram is initiated following the procedures above. The title page shown in Table5.1 will appear on the screen.
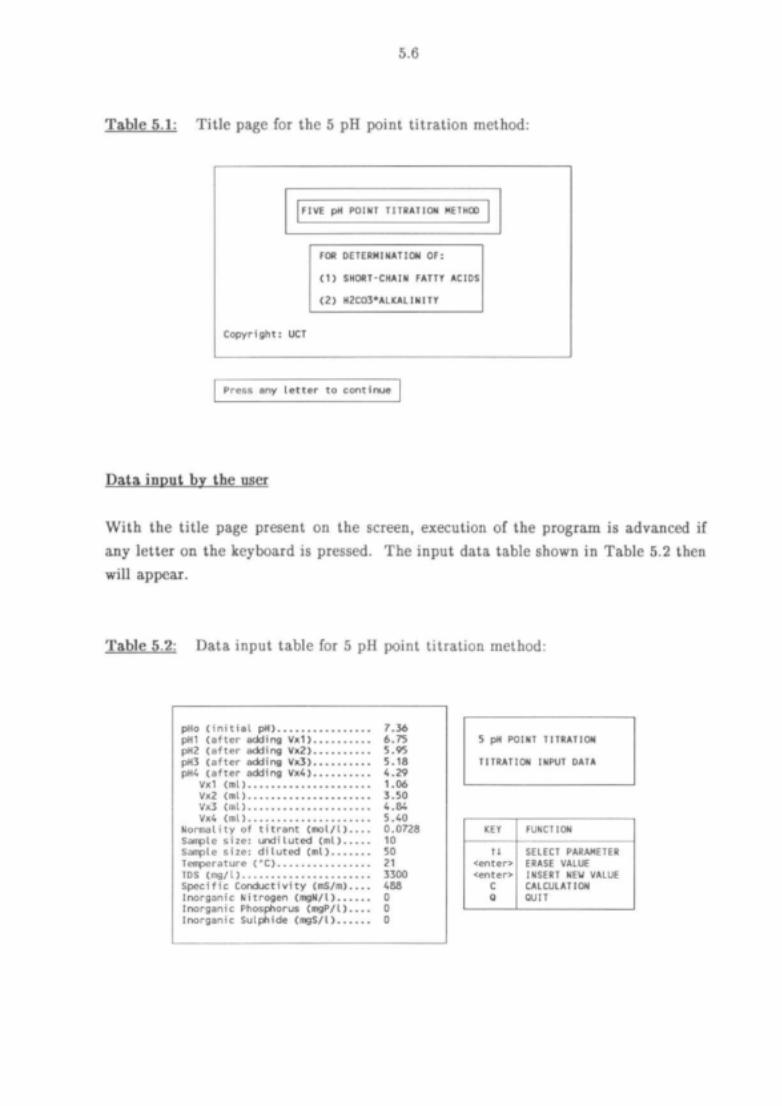
5.6
Table 5.1: Title page for the 5 pH point titration method:
Copyright:
FIVE pH
FOR
(1)
(2)
UCT
POINT TITRATION
DETERMINATION OF:
SHORT-CHAIN FATTY
H2CO3*ALKALINITY
METHOD
ACIDS
Press any letter to continue
Data input by the user
With the title page present on the screen, execution of the program is advanced ifany letter on the keyboard is pressed. The input data table shown in Table 5.2 thenwill appear.
Table 5.2: Data input table for 5 pH point titration method:
pHo (initial pH) 7.36pHI (after adding VxD 6.75pH2 (after adding Vx2) 5.95pH3 (after adding Vx3) 5.1BpH4 (after adding Vx4) 4.29
Vx1 (ml) 1.06Vx2 (ml) 3.50Vx3 (ml) 4.84Vx4 (ml) 5.40
Normality of titrant (mol/l) 0.0728Sample size: undiluted (ml) 10Sample size: diluted (ml) 50Temperature (°C) 21TDS (mg/l) 3300Specific Conductivity (mS/m) 488Inorganic Nitrogen (mgN/l) 0Inorganic Phosphorus (mgP/l) 0Inorganic Sulphide (mgS/L) 0
5 pH POINT TITRATION
TITRATION INPUT DATA
KEY
Ti<enter><enter>
CQ
FUNCTION
SELECT PARAMETERERASE VALUEINSERT NEU VALUECALCULATIONQUIT

5.7
The data input table contains default values for the different input parameters; thefirst parameter and default value (pH0) will be highlighted. In order to change thedefault value (for the highlighted parameter) the user must press the carriage returnkey to erase the existing value, type in the new value, and press the carriage returnkey again. If the default or the entered value is acceptable the following or previousparameter is selected with the arrow keys: i or T respectively. Note that eitherTDS or SC need to be entered in the program; if TDS is entered SC is calculatedinternally, and vice versa. To invoke the calculation part of the program type theletter C. After termination of the calculations the output data table (table ofresults) will appear on the screen.
Program output
Three different output tables will be obtained: If the systematic pH error is smallerthan 0,2 the output table shown in Table 5.3 will appear. If the systematic pHerror is greater than 0,2 the output table shown in Table 5.4 will appear. If theshort-chain fatty acid concentration (AT) > 2-carbonate species concentration (CT)the output table shown in Table 5.5 will appear.
The option keys (Y/N) or (Q) displayed near the bottom of the output table, enablethe user to either repeat the calculations for a different set of input values or quitthe program respectively.
Table 5.3: Output data table for 5 pH point titration program with a systematicpH error smaller than 0,2:
OUTPUT DATA
H2C03*aLkalinity (undiluted sample)(mg/L as CaCO3)
1863.9
Short-chain fatty acids (undiluted sample)(mg/L as acetic acid)
195.9
Systematic pH error -0.03
Do you wish to do a further calculation ?
Do you wish to quit the program ?
Y/N
0

5.8
Table 5.4: Output data table for 5 pH point titration program with a systematicpH error greater than 0,2.
OUTPUT DATA
H2C03*alkalinity (undiluted sample)(mg/L as CaCO3)
1759.4
Short-chain fatty acids (undiluted sample)(mg/L as acetic acid)
846.1
The titration data indicate a systematicpH error > 0.2; Check pH probe calibration
Do you wish to do a further calculation ?
Do you wish to quit the program ?
Y/N
Table 5.5: Output data table for 5 pH point titration program with AT > 2-Cx-
OUTPUT DATA
H2CO3*alkalinity (undiluted sample)(mg/l as CaCO3)
1760.9
Short-chain fatty acids (undiluted sample)(mg/l as acetic acid)
1680.6
Correction for systematic pH erroris not possible for this titration 0.
Do you wish to do a further calculation ?
Do you wish to quit the program ?
Y/N

5.9
PROGRAM LIMITATIONS
The two computer programs have the following limitations:
• For TITRA4, the correction for systematic pH error is subject to the conditionthat the carbonate weak acid/base dominates [i.e. Cx > 2*(NT + PT + ST)].
• For TITRA5, the correction for systematic pH error is subject to the conditionthat the carbonate weak acid/base dominates in the sample, i.e. SCFA (mg/£ asacetic acid) needs to be smaller than about 0,5-CT(mg/£ as CaCOa). Thiscondition is tested internally by the program. If the condition is not met nocorrection for systematic pH error is made by the program and a message isdisplayed in the output data table that no correction has been made (see Table5.5); the resulting loss in accuracy in the remaining output data will howeverremain within acceptable limits for the purpose of monitoring of anaerobicdigesters. (This situation will develop only when the digester is showing signs offailure, in which event accurate estimates of SCFA and H2CO3*alkalinity nolonger are essential).
• For TITRA4 and TITRA5, the maximum correction for systematic pH errors isset to ± 0,2 pH units. If the systematic pH error is greater than ± 0,2 pH unitsthis is displayed on the screen with the recommendation that the probe should berecalibrated (see Table 5.4). From practical experience (with samples fromanaerobic digesters) an average systematic pH error of about - 0,05 pH units willbe encountered. It would appear therefore that with systematic pH errors of> ± 0,2 indicated by the computer program, the pH probe most likely is in errorand needs to be recalibrated, and the test repeated.
• For TITRA4 and TITRA5, the H2CO3*alkalinity and SCFA respectively are theconcentrations present in the undiluted sample, i.e. the concentrations in thereactor. In TITRA4, the concentration of Cx in the undiluted sample, however,is not equal to the concentration in the reactor due to CO2 loss between samplingand testing. If Cf in the reactor is required, this is found from the reactor in
situ pH, temperature, TDS (or SC) of the reactor liquid and the undilutedH2CO3*alkalinity determined with the 4 or 5 pH point titration methods, seeLoewenthal et al. (1989). Usually, the reactor Cx is of no practical importanceand therefore this calculation is not included in the computer programs.

CHAPTER 6
EXAMPLES
INTRODUCTION
In this Chapter operation of the computer programs TITRA4 and TITRA5 willbe demonstrated for a 4 and 5 pH point titration respectively.
4 pH POINT TITRATION
The following example demonstrates the data input and output of TITRA4 for a4 pH point titration of a pure aqueous bicarbonate solution.
TitrationA solution of hydrochloric acid was made up and standardized by following theprocedures set out in Appendix A; the standardization gave normality of the acid as0,0728N. (This hydrochloric acid was used for both the 4 and 5 pH pointtitrations). A stock solution of sodium bicarbonate was made by adding 0,84ganhydrous NaHCO3 to distilled water to give a final volume of It (H2CO3*alkalinity= CT = 500 mg/l as CaCO3). (At this stage in the procedure the solution shouldbe filtered, but this was not necessary since the NaHCO3 dissolved completely).The TDS of the solution can be calculated theoretically, to give TDS of theundiluted sample of 840 mg/£ Since the stock solution was pure, the total speciesconcentrations of the ammonium, phosphate and sulphide (NT, P^ and S?respectively) weak acid/bases in the undiluted sample were zero. A 10 ml sample ofthe stock solution was made up to 50 m^ with distilled water, a 5 times dilution.The 4 pH point titration procedure set out in Chapter 3 was followed usingstandardized 0,0728N hydrochloric acid, and temperature, pH0, pHb pH2, pH3, Vxi,Vx2 and Vx3 recorded.
Data obtained from the titration are set out overleaf.

6.2
Undiluted sample
TDS (ing/*) 840NT (total species cone, of free and saline ammonia, mg/* as N) 0PT (total species cone, of inorganic phosphate, mg/1 as P) 0ST (total species cone, of sulphides, mg/£ as S) 0
Dilution
Sample size (undiluted) (m^) 10Sample size (diluted) (m£) 50
Diluted sample
Temperature (°C) 21p H 0 • •
pHinitial pH of diluted sample) 8,00pH after addition of Vxi) 6,73pH after addition of Vx2l 5,93pH after addition of VX3) 5,15
0,401,00
Normality of strong acid (mo\/l) 0,0728
Program executionExecution of the computer program T1TRA4 was initiated and data entered intothe data input table following the procedures in Chapter 5, to give the screen inTable 6.1. Calculation was initiated (pressing C) and the program output screen inTable 6.2 obtained. Comparing the output from the program (H2CO3*alkalinity =498,2; CT = 507,1 both mg/£ as CaCO3) with the known input values (H2CO3*alkalinity = C? = 500 mg/£ as CaCOa) good correlation was obtained. Also, theestimate for the systematic pH error (-0,02) was within acceptable limits (seeChapter 3).

6.3
Table 6.1: TITRA4 input data screen for 4 pH point titration of pure NaHCC>3solution (H2CO3*alkalinity = CT = 500 mg/£ as CaCO3).
pHo (initial pH) 8.00pH! (after adding VxD 6.73pH2 (after adding Vx2) 5.93pH3 (after adding Vx3) 5.15
Vxi (ml) 0.40Vx2 (ml) 1.00Vx3 (ml) 1.30
Normality of titrant (mol/l) 0.0728Sample size (undiluted) (ml) 10Sample size (diluted) (ml) 50Temperature (*C) 21TDS (mg/l) 840Specific Conductivity (mS/m) 122Inorganic Nitrogen (mgN/l) 0Inorganic Phosphorus (mgP/l) 0Inorganic Sulphide (mgS/L) 0
4 pH POINT TITRATION
TITRATION INPUT DATA
KEY
Ti<enter><enter>
C
a
FUNCTION
SELECT PARAMETERERASE VALUEINSERT NEU VALUECALCULATIONQUIT
Table 6.2: TITRA4 output data screen for 4 pH point titration of pure NaHCC>3solution (H2CO3*alkalinity = CT = 500 mg//as CaCO3).
TABLE OF RESULTS
H2CO3*alkalinity (undiluted sample)(mg/l as CaCO3)
498.2
Total carbonate species (undiluted sample)(mg/l as CaC03)
507.1
Estimate of systematic pH error -0.02
Do you wish to do a further calculation ?
Do you wish to quit the program ?
Y/N
0
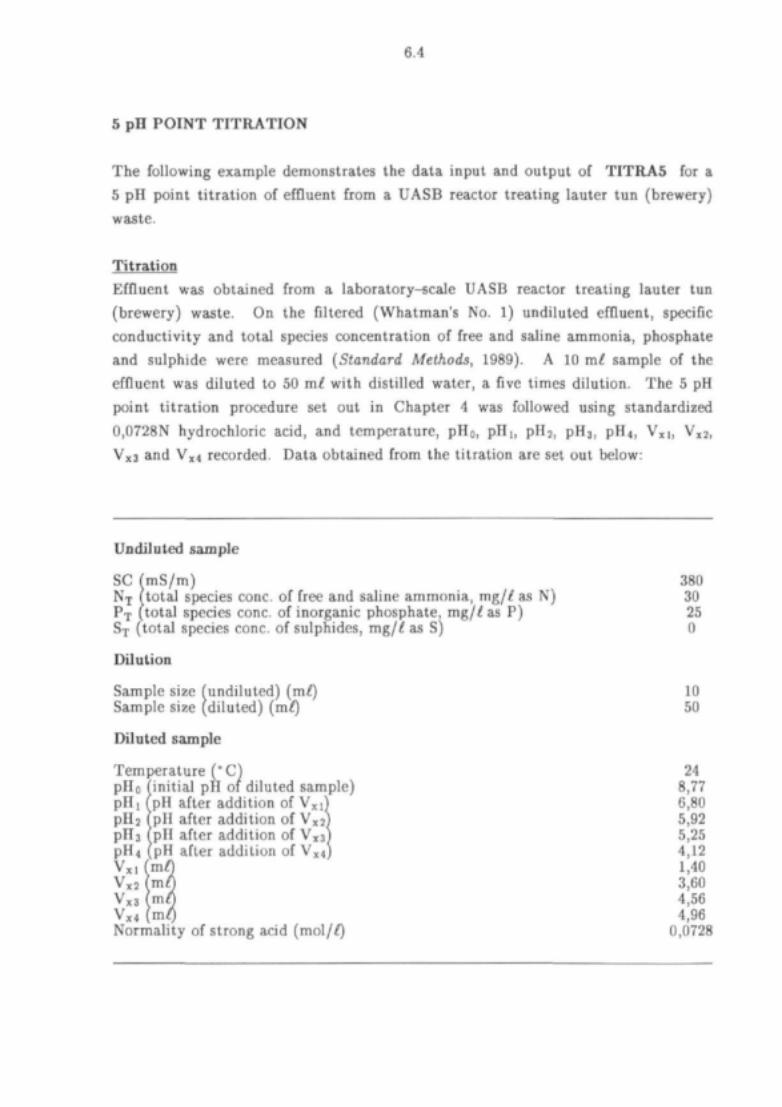
6.4
5 pH POINT TITRATION
The following example demonstrates the data input and output of TITRA5 for a
5 pH point titration of effluent from a UASB reactor treating lauter tun (brewery)
waste.
Titration
Effluent was obtained from a laboratory-scale UASB reactor treating lauter tun
(brewery) waste. On the filtered (Whatman's No. 1) undiluted effluent, specific
conductivity and total species concentration of free and saline ammonia, phosphate
and sulphide were measured (Standard Methods, 1989). A 10 m^ sample of the
effluent was diluted to 50 m^ with distilled water, a five times dilution. The 5 pH
point titration procedure set out in Chapter 4 was followed using standardized
0,0728N hydrochloric acid, and temperature, pH0> pHi, pH2, pH3, pH^ Vxi, Vx2,
VK3 and VX4 recorded. Data obtained from the titration are set out below:
Undiluted sample
SC fmS/m) 380NT (total species cone, of free and saline ammonia, mg/^ as N) 30PT (total species cone, of inorganic phosphate, mg/^ as P) 25Sj (total species cone, of sulphides, mg/t as S) 0
Dilution
Sample size (undiluted) (ml) 10Sample size (diluted) (ml) 50
Diluted sample
Temperature (°C) 24pH,
pH2pH3pH4VxlVx2v x 3V x 4
initial pH of diluted sample) 8,77pH after addition of Vxl) 6,80pH after addition of Vx2J 5,92pH after addition of Vx3l 5,25pH after addition of VX4) 4,12ml) 1,40mtj 3,60m£\ 4,56mi) 4,96
Normality of strong acid (mo\/l) 0,0728

6.5
Program executionExecution of the computer program TITRA5 was initiated and data entered intothe data input table following the procedures in Chapter 5, to give the screen inTable 6.3. Calculation was initiated and the output screen in Table 6.4 wasobtained.
Table 6.3: TITRA5 input data screen for 5 pH point titration of effluent from aUASB reactor treating lauter tun (brewery) waste.
pHo (initial pH) 8.77pHI (after adding VxD 6.80pH2 (after adding Vx2) 5.92pH3 (after adding Vx3> 5.25pH4 (after adding Vx4) 4.12
Vxi (ml) 1.40Vx2 (ml) 3.60Vx3 (ml) 4.56Vx4 (ml) 4.96
Normality of titrant (mol/l) 0.0728Sample size: undiluted (ml) 10Sample size: diluted (ml) 50Temperature C O 24TDS (mg/l) 2574Specific Conductivity (mS/m) 380Inorganic Nitrogen (mgN/l) 30Inorganic Phosphorus (mgP/l) 25Inorganic Sulphide (mgS/l) 0
5 pH POINT TITRATION
TITRATION INPUT DATA
KEY
li<enter><enter>
C0
FUNCTION
SELECT PARAMETERERASE VALUEINSERT NEW VALUECALCULATIONQUIT
Table 6.4: TITRA5 output data screen for 5 pH point titration of effluent from aUASB reactor treating lauter tun (brewery) waste.
OUTPUT DATA
H2CO3*alkalinity (undiluted sample)(mg/l as CaCO3)
1741.3
Short-chain fatty acids (undiluted sample)(mg/l as acetic acid)
5.7
Systematic pH error -0.02
Do you wish to do a further calculation ?
Do you wish to quit the program ?
Y/N

REFERENCES
Gran G (1952) Determination of the equivalence point in potentiometrictitrations. The Analyst, 77, 661.
Gujer W and Zehnder A J B (1983) Conversion processes in anaerobic digestion.Water Sci.Technol., 15, 127-167.
Jenkins S R, Morgan J M and Sawyer C L (1983) Measuring anaerobic sludgedigestion and growth by a simple alkalimetric titration. JWPCF, 55,448-453.
Loewenthal R E and Marais GvR (1976) Carbonate Chemistry of Aquatic Systems -Theory and Application. Ann Arbor Science Publishers Inc., Michigan.
Loewenthal R E, Wiechers H N S and Marais GvR (1986) Softening andStabilization of Municipal Waters. Water Research Commission, P O Box824, Pretoria 0001, South Africa.
Loewenthal R E, Ekama G A and Marais GvR (1989) Mixed weak acid/basesystems. Part I: Mixture characterization. Water SAt 15(1), 3-24.
Loewenthal R E, Wentzel M C, Ekama G A and Marais GvR (1991) Mixed weakacid/base systems. Part II: Dosing estimation, aqueous phase. Water SAy17(2), 107-122.
McCarty P L (1974) Anaerobic Processes. International Association of WaterPollution Research, Birmingham, England. September 18, 1974.
Moosbrugger R E, Wentzel M C, Loewenthal R E, Ekama G A and Marais GvR(1991) Weak acid/bases and pH control in UASB reactors. Research ReportW70, Dept. Civil Eng, Univ. of Cape Town, Rondebosch 7700, South Africa.
Moosbrugger R E, Sam-Soon P A L N S, Wentzel M C, Ekama G A, LoewenthalR E and Marais GvR (1992) Final report to the Water Research Commissionon the contract "Pelletization in upflow anaerobic sludge bed (UASB)systems". Research Report W75, Dept. Civil Eng., Univ. of Cape Town,Rondebosch 7700, South Africa.
Moosbrugger R E, Wentzel M C, Ekama G A and Marais GvR (1993a) Weakacid/bases and pH control in anaerobic systems - A review. Water SA, 19(1),1-10.
Moosbrugger R E, Wentzel M C, Ekama G A and Marais GvR (1993b) Alkalinitymeasurement: Part 1 - A 4 pH point titration method to determine thecarbonate weak acid/base in an aqueous carbonate solution. Water SA, 19(1),11-22.
Moosbrugger R E, Wentzel M C, Ekama G A and Marais GvR (1993c) Alkalinitymeasurement: Part 2 - A 4 pH point titration method to determine thecarbonate weak acid/base in an aqueous solutions containing other weakacid/bases of known concentrations. Water SA, 19(1), 23-28.

R.2
Moosbrugger R E, Wentzel M C, Loewenthal R E, Ekama G A and Marais GvR(1993d) Alkalinity measurement: Part 3 - A 5 pH point titration method todetermine the carbonate and SCFA weak acid/bases in aqueous solutioncontaining also known concentrations of other weak acid/bases. Water SAy19(1), 29^0.
Mosey F E and Fernandes X A (1989) Patterns of hydrogen in biogas from theanaerobic digestion of milk-sugars. Water Sci.TechnoL, 21, 187-196,Brighton.
Pohland F G and Martin J C (1969) Discussion on paper by Andrews J F,"Dynamic model of the anaerobic digestion process". Proc.of Am.Soc.of CityEng.y Sanitary Engineering Division.
Sam-Soon P A L N S, Loewenthal R E, Dold P L and Marais GvR (1987)Hypothesis for pelletization in the upflow anaerobic sludge bed reactor.Water SA, 13(2), 69-80.
Sam-Soon P A L N S, Loewenthal R E, Wentzel M C and Marais GvR (1989)Pelletization in the upflow anaerobic sludge bed (UASB) reactor. ResearchReport W72, Dept. Civil Eng, Univ. of Cape Town, Rondebosch 7700, SouthAfrica.
Sam-Soon P A L N S, Loewenthal R E, Wentzel M C and Marais GvR (19901Growth of biopellets on glucose in upflow anaerobic sludge bed (UASB)systems. Water SA, 16(3), 151-164.
Standard Methods (1989) Standard Methods for the Examination of Water andWastewater. Prepared and published jointly by the American Public HealthAssociation, American Water Works Association and Water Pollution ControlFederation, Washington DC.
Stumm W and Morgan J T (1970) Aquatic Chemistry. Wiley - Interscience, NewYork.
Van Slijke D D (1922) On measurement of buffer values. J.Biol.Chem.} 52,525-590.

APPENDIX A
STANDARDIZATION OF STRONG ACID
INTRODUCTION
To obtain accurate results from the 4 and 5 pH point titration methods it is of greatimportance to determine the normality (concentration of H+ ions) of the strong acidtitrant accurately. The standardization method is based on the theory forH2CO3*alkalinity in an aqueous carbonate solution. The principle of the method isto titrate a solution of known H2CO3*alkalinity to the H2CO3*alkalinity equivalencepoint (i.e. the point of zero H2CO3*alkalinity) using the strong acid to bestandardized. From the volume of strong acid required to titrate to theH2CO3*equivalence point, the normality of the strong acid is determined (seebelow). Using this method one encounters the problem of identifying theH2CO3*alkalinity equivalence point.
Because of the difficulties in identifying the H2CO3*equivalence point the methodby Gran (1952) is used which does not require endpoint identification. The theoryof Gran's method, more specifically the First Gran Function, is discussed in detailby Loewenthal et al (1986;1989) and will not be dealt with here; we will deal onlywith the practical application of the First Gran Function, i.e. calculation of thevolume of strong acid added to titrate to the H2CO3*equivalence point.
The standardization of the strong acid involves the following steps: preparation ofstrong acid; Gran titration of carbonate solution; application of the First GranFunction; and calculation of normality of strong acid.
PREPARATION OF STRONG ACID
In preparing the strong acid the volume of undiluted sample and the alkalinity ofthe undiluted sample must be kept in mind. Both these factors influence the massof strong acid required to titrate the sample from the initial pH to PH3 (in the 4 pHpoint titration) or to PH4 (in the 5 pH point titration): If the normality is too high,small quantities of strong acid addition will cause large changes in pH and randomerrors in strong acid addition will become increasingly significant. If the normality

A.2
is too low, large quantities of strong acid are required to effect pH changes makingthe titration tedious and mixing of the sample more uncertain. For the purpose oftitrating 10 ml of an undiluted sample from a typical anaerobic digester which hasbeen diluted to 50 ml, a 0,08 N strong acid is recommended; to approximate thisvalue one may dilute 35 ml of 33 percent hydrochloric acid to 5 I with CO2 freedistilled water. For other samples, the most suitable concentration will have to befound by trial and error. The strong acid solution is standardized using the Granmethod, as set out below.
GRAN TITRATION OF CARBONATE SOLUTION
To standardise the strong acid, a carbonate solution of known H2CO3*alkalinity ismade up from CO2 free distilled water and high purity anhydrous Na2CO3: add5,300 g Na2CO3 to 5 I of CO2 free distilled water. A sample of 50 ml of thissolution is taken and a Gran titration performed, as follows: Titrate the sample withthe made-up strong acid to a pH of about 3,9 and record pH and the volume oftitrant added. Titrate the sample to the final pH of about 3,4 in 4 to 5 titrationsteps, recording the cumulative volumes of titrant and pH after each step to give atable of titration data, e.g.
13,3213,3413,3713,4013,44
3,903,803,703,603,50
Applying the First Gran Function to this set of data allows calculation of thevolume of strong acid required to titrate to the H2CO3*equivalence point.
APPLICATION OF FIRST GRAN FUNCTION
Calculate the First Gran Function value, Fix, for each of the (Vx; pHx) pairs, from:
F11 = -10 " p H x (Vs + Vx) (A.I)
where

A.3
Fix = First Gran Function value
pHx = pH reading in pH region 3,9 to 3,4
Vx = volume of strong acid required to titrate to pH
Vs = initial sample volume (m£).
For the example, this gives the following (Fjx; Vx) pairs:
13,3213,34
13,37
13,40
13,44
-0-0
-0
-0
-0
,0080,0100
,0126
,0159
,0201
Plot - Fix versus Vx; a straight line should be obtained. Draw the best straight line
through the data. The interception of the line with the Vx axis, Vxe , (i-e. F j x =
zero) gives the volume of strong acid required to titrate to the H2CO3*equivalence
point, i.e. to the point where the H2CO3*alkalinity equals zero. Alternative to the
graphical approach Vxe can be determined by applying a linear regression to the
data set (F l x ; Vx); from the linear equation Vxe is calculated for F l x = 0. Linear
regression programs are readily available on many calculators and PC software; for
the example presented here this approach was selected and Vx e was found to be
13,24 ml Knowing the volume of strong acid that is required to titrate the
carbonate solution of known H2CO3*alkalinity to the H2CO3* equivalence point
(Vxe), the normality of strong acid can be calculated.
CALCULATION OF NORMALITY OF STRONG ACID
To calculate the normality of the strong acid note that the mass of
H2CO3*alkalinity added to the sample as Na2CO3 equals the mass of strong acid
required to titrate to the H2CO3*equivalence point:
Ca • VK e= m • Vs (A.2)
where:
Ca = normality of strong acid (mol/^)
Vxe =volume of strong acid to titrate to H2CO3*equivalence point (ml)
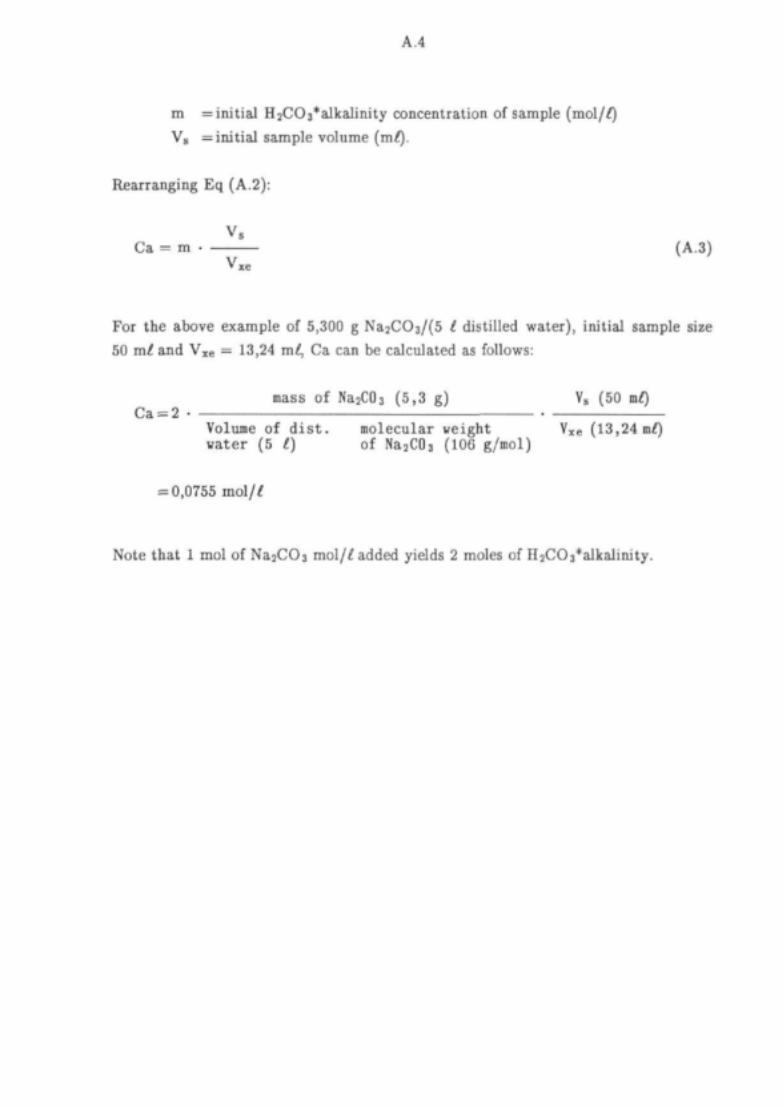
A.4
m =initial H2CO3*alkalinity concentration of sample
Vs = initial sample volume (m/).
Rearranging Eq (A.2):
V s
Ca = m - (A.3)V
For the above example of 5,300 g Na2COs/(5 I distilled water), initial sample size
50 ml and Vxe = 13,24 ml, Ca can be calculated as follows:
mass of Na2C03 (5,3 g) VS (50 mt)Ca = 2
Volume of d i s t . molecular weight Vxe (13,24water (5 I) of Na2C03 (106 g/mol)
= 0,0755 mol/ /
Note that 1 mol of Na2CO3 moX/l added yields 2 moles of H2CO3*alkalinity.