molecular bond engineering and feature learning for the
TRANSCRIPT

Molecular Bond Engineering and Feature
Learning for the Design of Hybrid
Organic-Inorganic Perovskites Solar Cells with
Strong Non-Covalent Halogen-Cation
Interactions
Johannes L. Teunissen∗,†,‡ and Fabiana Da Pieve†
†Royal Belgian Institute for Space Aeronomy, Av Circulaire 3, 1180 Brussels, Belgium.
‡Univ. Lille, CNRS UMR 8520 - IEMN - Institute of Electronics, Microelectronics and
Nanotechnology, F-59000 Lille, France
E-mail: [email protected]
Abstract
Hybrid organic-inorganic perovskites are exceedingly interesting candidates for new
solar energy technologies, for both ground-based and space applications. However, their
large-scale production is hampered by the lack of long-term stability, mostly associated
to ion migration. The specific role of non-covalent bonds in contributing to the stability
remains elusive, and in certain cases controversial. Here, we perform an investigation
on a large perovskite chemical space via a combination of first-principles calculations
for the bond strengths and the recently developed Sure Independent Screening and
Sparsifying Operator (SISSO) algorithm. The latter is used to formulate mathemati-
cal descriptors that, by highlighting the importance of specific non-covalent molecular
1
arX
iv:2
111.
0208
1v1
[co
nd-m
at.m
trl-
sci]
3 N
ov 2
021
bonds, can guide the design of perovskites with suppressed ion migration. The re-
sults unveil the distinct nature of different non-covalent interactions, with remarkable
differences compared to previous arguments and interpretations in the literature on
the basis of smaller chemical spaces. In particular, we clarify the origin of the higher
stability offered by FA compared to MA, which shows to be different from previous
arguments in the literature, the reasons of the improved stability given by the halogen
F, and explain the exceptional case of overall stronger bonds for Guanidiunium. The
found descriptors reveal the criteria that, within the stability boundaries given by the
Goldschmidt factor, give an all-in-one picture of non-covalent interactions which pro-
vide the more stable configurations, also including interactions other than H-bonds.
Such descriptors are more informative than previously used quantities and can be used
as universal input to better inform new machine learning studies.
Introduction
Hybrid Organic-Inorganic Perovskites (HOIPs)-based solar cells are emerging as a new op-
portunity for a paradigm shift in solar cell technology for both Earth-based1 and space ap-
plications.2–4 On Earth, the increasing demand for clean energy resources, rapidly evolving
high power conversion efficiency (PCE)5,6 of HOIPs and the relatively low-cost fabrication7
make them potential candidates for a step-change approach to harvest solar energy. For
space missions, HOIPs qualify as the best candidates for extremely lightweight,3 flexible and
radiation resistant solar panels.8–12 Either for missions in the Earth’s vicinity or deep Space,
these systems show potential for reducing the weight at launch, for broad absorption that
matches the operating conditions at both Earth and Martian orbit and for fabrication via 3D
printing techniques, considered as necessary for on-mission manufacturing.3,13 For stays on
the Moon or Mars, these systems offer the potential for autonomous roll-out of solar arrays
for extra-terrestrial surface deployments.
HOIPs comprise a negatively charged lead-halide inorganic skeleton, with a composition
2

of ABX3, where B is a metal cation (Sn2+ or Pb2+), X is a halide anion (I-, Br-, and/or
Cl-) and A is a monovalent positively charged organic cation, such as methylammonium
(MA=CH3NH3X+ where X=I, Br, Cl) or formamidinium (FA=CH(NH2)2+).
The organic cation plays a fundamental role for the stability of the structure. Perovskite
materials have excellent optical and electrical properties for outstanding performance in
solar cell applications, such as strong light absorption,14,15 steep optical absorption edge,16
band gap tuning,17 high charge carrier mobility,18–20 possible polaron-protected transport
properties21–23 (although debated24), low exciton binding energy25,26 and long charge carrier
diffusion lengths and carrier lifetimes.20,27,28
The recent steep increase in PCE of perovskite solar cells makes them the fastest-
advancing solar technology. Nevertheless, despite the many advantages, the progress in
large scale applications and production of HOIPs is hampered by instability issues. Indeed,
HOIPs suffer from structural instabilities induced by air, moisture,29 UV light,30–32 heat,
causing the perovskite solar cells to have a particularly low lifetime. Intrinsic instability
causing unavoidable decomposition with time has also been reported.31 The instability is
mainly caused by a relatively weak cohesion between the organic cation and the inorganic
octahedra, and predominantly by the low energy barriers for the migration of halide anions
and organic cations, with halide migration being the most prevalent.33–37 Nevertheless, the
(short-term) performance of HOIPs-based solar cells is considerably defect tolerant. Density
Functional Theory (DFT) calculations based on hybrid functionals with spin orbit coupling
have shown that the majority of the defects induce only shallow defect states near the band
edges,38,39 and that although iodine interstitials create deep levels in the gap of MAPbI3,40,41
these only leave short-living hole traps.34,42 Still, there remain unwanted effects in carrier
dynamics, I-V hysteresis and in the chemical degradation of the very HOIP and at the in-
terfaces with the charge transport layers. Ion migration has also been reported to greatly
accelerates charge carrier losses43 and, in large scale, also to cause phase segregation.44
A tremendous experimental effort has been devoted to overcome the above shortcomings
3
of HOIPs, though intrinsic improvements (mostly by changing the stoichiometry) or extrinsic
improvements (such as encapsulation) that reduce exposure to degradation factors. For
example, intrinsic improvements consist in changing the amount of or mixing different organic
cations, such as through insertion of excess or combined MA/FA,45–47 introducing small
amounts of larger organic molecules,48 inserting guanidinium,47,49 or changing the amount
of iodine50 and or mixing different halides,51 via mixed-cation systems (for example by
including inorganic cations such as rubidium or caesium),52 through doping for lattice strain
relaxation-induced suppression of halides vacancies,53 multi-vacancy defects passivation,54
through lower-dimensional HOIPs or additional layers,,55 and chemical bond modulation
tuning the bond strength of the additives.56,57
Halogen migration can be mitigated by increasing the binding strength with the organic
cations.50,58,59 The organic cation binds strongly with the halogen anions via hydrogen bond-
ing, and when the cation has double bonds, also via π · · · anion binding.60 Several papers
have shown that in MAPbI3 only the N −H· · ·I hydrogen bonds are important,61–63 al-
though recently it was advocated62 that non-covalent interactions other than N−H· · ·I,
such as C−H· · ·I and N/C· · ·I are also of importance. Nonetheless, neither computational
nor experimental methods can easily deconvolute the individual contributions to the ener-
getics of the bonds, as a continuous merge between the hydrogen bond with van der Waals
interactions and ionic and covalent bonds,64 and despite the tremendous efforts, the unique
properties of metal halides perovskites remain elusive.
In this work, we combine a first-principles analysis of bonds based on the Quantum-
Theory-of-Atoms-In-Molecules (QTAIM)65 with a feature learning analysis through the Sure
Independence Screening and Sparsifying Operator (SISSO) algorithm66 on a large chemical
space, to untangle the contribution from different bond types and investigate the features
that dominate in the relationship between the structural composition of the HOIPs and
the X-cation binding strengths. The findings provide new insights into the role of different
non-covalent interactions, with considerably different interpretations to previous arguments
4

in the literature on the basis of some few specific cases, and can be used to guide the design
of more stable cells by carefully tuning chemical and compositional/structural properties for
ion migration suppression.
Theory and Computational details
QTAIM and DFT Calculations
In order to find the binding strengths, we combine the ”Atoms in Molecules” theory65 and
the empirically established relationship between the properties of the BCPs.35,67 Within
this theory, a bonding interaction is defined by a maximum electron density path (bond
path) connecting two interacting atoms. Critical points (CPs) are points where the gradient
of the electron density, ∇ρ becomes zero. Bond critical points (BCPs) are those type of
critical points where the density increases in one direction while it decreases in the plane
perpendicular to that direction. Thus, a BCP is a saddle point in the charge density along the
bond path. The existence of BCP between the acceptor atom and the donating hydrogen, as
well as the charge density properties at this point, defined the major criteria of the existence
of an H-bond. These BCPs are often found close to the midpoints of two atoms that have a
bonding interaction, either covalent or non-covalent. The estimation of the bonding strength
starts from the Abramov’s formula68 for the local kinetic energy density, G, given as:
G =3
10(3π2)
23ρ
53 +
1
72|∇ρ|−1 +
1
6∇2ρ (1)
where ρ is the electron density. G correlates linearly with the bonding strength.67 At the
BCPs, the second term vanished since the gradient is zero. The presence of a BCP indicates
there is a charge accumulation between the two bonded nuclei.69 The larger the density at
the BCP, the stronger the interaction. Negative gradients indicate covalent bonds while
non-covalent interactions show small but positive gradients.69
5

Mata et al.67 fitted the bond strengths vs. G and found a relationship with the bond
strengths E as: E = 0.429G with a high correlation of R2 = 0.990. The absolute values
obtained for the bond strengths do depend on the level of theory70 but the interest of this
work lies predominantly in the trends, hence, only relative differences matter. There exist
some criticism concerning the bond critical points,71 as some cases exists where there is a
bonding interaction without a BCP being present, most notably 1,2-ethanediol,72 but these
cases seem to occur seldom and in our study we did not find any absence of BCPs for
cation-halogen bonding interactions so we reasonably expect our trends to hold.
For all the non-covalent interactions analyzed in this study between an organic cation
and a halogen, there is a clear and strong power law correlation between the bond lengths
and the density at the bond critical point. For an analysis of the density and gradients at
the BCPs, see Supporting Information Section 4.
As our starting set of perovskite structures, we take the dataset as prepared and pro-
vided by Kim et al.73 of 1346 hybrid organic-inorganic perovskites. From this dataset we
only select those 548 that have a perovskite structure i.e. roughly a cubic arrangement of
the metal atoms with the halogens surrounding these metals connected via corner sharing
octahedrals and the organic cation in the cavity thus created. Finally, per chemical com-
position, we only take the most stable one, i.e. the one with the lowest atomization energy
(the energy required to separate the molecular structure into individual atoms) resulting in
a final set of 190 HOIPs. For some chemical compositions the perovskite structure is not
the most stable structure. However, in this paper we are primarily interested in the binding
strength under the condition that the structure is perovskite. When the structure is non-
perovskite, the binding characteristics are completely different, and we cannot compare the
binding strengths between different chemical compositions. For example for many hydrox-
ylammonium or hydrazinium compounds, (like Hydroxylammonium Germanium Fluoride)
the most stable structure is not a perovskite. Although for a certain chemical composition,
the perovskite structure might not be the most stable, it might still provide relevant in-
6
sight in how to design structurally stable perovskites. Moreover, in real applications one
often uses a mixture of different organic cations, (for example MAxFA(1−x)PbI3) and for the
mixed compound the perovskite structure might well be stable.74
For each of the 190 HOIPs, the BCPs between the organic cation and the halogen are
determined. In every perovskite structure there are three symmetrically unique halogen
positions. Each inorganic cavity, which shape is approximately cubic (most generally a
paralellepiped), has 12 halogens close to the midpoints of the cube edges and thus located
approximately in the [002], [020] and [200] planes of the cavity. Each organic cation located
in the approximately cubic cavity, can bind maximally to 12 halogens, of which there are 3
sets of 4 halogens that belong to the same unique crystallographic position. We are mainly
interested in those of the three halogens that has the lowest cation binding energy, since the
weakest bound halogen will be most prone to halogen migration. In this paper we will call
the total bond strength between a single organic cation and its neighboring halogens Etotal.
This bond strength is the sum of the contribution from the 3 unique halogen positions. The
bond strength of the halogen with the lowest cation binding energy is called EminX .
The HOIP dataset as prepared by Kim et al. uses 3 metals (Ge, Sn, Pb), 4 halogens
(F, Cl, Br, I) and 16 organic cations giving 192 (3× 4× 16) unique chemical compositions.
For each composition multiple crystallographic structural conformations are present. In
total 1346 structures were obtained using a minima-hopping method75 followed by a DFT-
PAW structure optimization including van der Waals dispersion interactions via the vdW-
DF2 functional,76 using VASP.77 This dataset is open-source and can also be found on the
NoMaD database.78 The crystallographic information format (cif) files of the dataset where
read using the pymatgen library.79
For the systems with a perovskite structure, we calculated the continuous symmetry
measures for cubicity80 of the metal atoms and found that for most of the HOIPs the metals
are arranged in an approximately cubic shape. The HOIPs with the highest deviations from
cubic cells contained propylammonium or butylammonium cations (see Electronic Supple-
7

mentary Information). For two chemical compositions, no perovskite structures are present
in the dataset, being ammonium lead fluoride and hydroxylammonium tin bromide. Hence,
in this paper we study 190 instead of 192 structures. All the electron densities were obtained
with Quantum ESPRESSO 6.381 using the HSE06 functional82 and norm-conserving scalar
relativistic pseudopotentials.82 The kinetic energy cutoff of the wavefunction was set at 80
Ryd and the cutoff of the charge density to 320 Ryd. The HSE06 functional is regularly
used for HOIPs and is known to give good electronic and structural results although band
gaps are slightly overestimated.35,73,83 A 5× 5× 5 Monkhorst-Pack grid was used, centered
on the Γ point. The electron densities were evaluated at a 400 × 400 × 400 grid and the
critical points were obtained using the Critic2 program.84 The bond strengths presented in
this work are based on the structures with the lowest atomization energies. However, HOIPs
are particularly known to undergo subtle phase transitions. At lower temperatures some
symmetry breaking occurs changing the structure from cubic to tetragonal to orthorombic.
However, the cation-halogen interactions are not expected to be significantly different, as
they are not for MA, one of the most mobile cations.85 Due to the corresponding differences
in crystal packing, the orientation and bond lengths of the organic cation with the halogens
will change. Nevertheless, the nature of the bonds and the ability of the organic cation to
bind with the halogen anions will stay the same, and the observed trends stay the same as
long as the structure is a perovskite (For a comparison of all 548 perovskite structures see
Supporting Information Section 2). Also Varadwaj et al.62 found that the binding charac-
teristics stay the same for different cation orientations although Lee et al.63 found that the
energy difference between two different orientations of the MA cation in MAPbI3 might be
45 meV. Since we found that the total bond strength for MAPbI3 is 413 meV, this means
that the binding strength might change by around 10% depending on the cation orientation.
Taking this all in consideration, we believe that the results presented in this paper show
valuable trends in the binding characteristics of different perovskite structures that can be
extrapolated to other crystal packings, for example those of mixed cation or mixed halogen
8

HOIPs.
Sure Independence Screening and Sparsifying Operator (SISSO)
algorithm
Following the calculation of all Etotal and EminX , we try to establish a connection between
the bond strengths and the chemical structure via symbolic regression. Symbolic regression
tries to find a mathematical expression of the input features that best fits the data. Here we
try to find an expression of structural features that best predicts the cation-halogen binding
strengths. The particular algorithm used is called SISSO which is based on a compressed
sensing technique (vide infra).66,86–88 It starts from a set of single-valued elementary features,
called Φ0. It then recursively applies some unary and binary mathematical operations to
create new feature spaces called Φi with i being the number of times the mathematical
operations are applied. It then iteratively applies the Sure Independence Screening (SIS)
and the Sparsifying Operator (SO) until the desired dimension is reached. SIS selects a
subspace of Φi that has the highest correlation with the target property (in our case the
binding strengths) and SO selects the best descriptor from the union of all the subspaces
selected by all the previous SIS steps.66
In our case, we used SISSO to extract the most important structural features that dic-
tate the cation-X binding strengths, thus elucidating what kind of structural composition
is optimal for HOIPs with suppressed X-migration. The included unary operations are
(�2,√�,�−1, |�|) and the included binary operators are (+,−, ∗, /). We also set a maxi-
mum to the descriptor complexity thus limiting the number of mathematical operations. This
prevents the loss of scientific interpretability as the higher complexity descriptors become
too convoluted and from a certain point higher complexity features do not give significantly
better results and can be seen as a measure to prevent over-fitting. Setting the maximum
complexity can be seen as a measure to prevent over-fitting.
We decided to only include features that can be derived directly from the given structure.
9

No features (such as bond lengths or band gaps) are included that would require the knowl-
edge of the specific perovskite structure. This enables direct evaluation of the descriptors,
as is also possible for the Goldschmidt tolerance factor. The included features are the effec-
tive crystal radii of the metal, halogen and organic cation89 as well as the electronegativity
and polarizability of the metal and halogen atoms. The latter two features have shown to
be useful in multiple studies combining HOIPs and predictive techniques.88,90 Differently
from previous studies and in order to easily encode the nature of the organic cations, here
some additional bond counts were included: the number of C-H, N-H and O-H bonds as
well as the number of π bonds. Hydroxylammonium is the only cation in the dataset that
contains an O-H bond. There are 4 organic cations that contain π bonds: Formamidinium,
Acetamidinium, Guanidinium and Imidazolium with respectively 2, 3, 3 and 5 π-bonds. Ev-
idently, there is a correlation between the electronegativity, χ, and the polarizability, α, of
the halogens and metal, however the SISSO algorithm does not suffer from highly correlated
features.66
Results and Discussion
Connecting stability of HOIPs with composition and structure
In this section we will assess the non-covalent binding interactions between the organic cation
and the halogen atoms in a single unit cell consisting of one (approximate) cube formed by
the metal atoms, plus the 12 halogens along the edges of the cube and the single organic
cation inside the cube. As stated before, we consider the total binding strength of all cation-
X interactions called Etotal and the binding strength corresponding with the halogen that
has the weakest interaction with the cation called EminX . Since there are three different
halogens, EminX ≤ Etotal/3.
The distribution of all the Etotal values obtained for all the 190 HOIPs is presented in
Figure 1. The type of halogen atom most clearly affects Etotal. With fluorine, Etotal is about
10

Ge Sn Pbmetal
500
1000
1500
2000
2500
3000
E tot
al(m
eV)
halogenFClBrI
Figure 1: A boxplot showing the distribution of the Etotal values grouped by metal andhalogen. The boxes show the quartiles of the dataset while the whiskers are extended to 1.5times the interquartile range (IQR).
twice as high as for heavier halogens. This trend is not only found in HOIPs91 but is typically
for any D−H· · ·X−M interaction where D is either C, N, or O.92 The high electronegativity
of fluorine causes the X−M bonds to be of considerably polar character leaving a strong
negatively electrostatic potential around the atom, causing strong hydrogen bonds, generally
called metal-assisted hydrogen bonds.93 Changing the metal has only a minor influence, in
agreement with previous studies.94 Etotal seems to be only slightly higher for Germanium.
Since the electronegativity of the metals is very similar, it is most likely attributed to the
smaller covalent radius of germanium (Ge:122pm, Sn:140pm, Pb:146pm)95 causing slightly
shorter and stronger bonds.
To compare the effect of the organic cation, we look at the fractional deviations of the
individual EminX values with respect to the average of all the EminX values per halogen and
metal. The fractional deviation f is defined as f(EminX) = EminX−EXMminXEXMminX
, where EXM
minX is the
average of all the EminX values having halogen X and metal M . The results are presented
in Figure 2.
It is remarkable that methylammonium, by far the most used in HOIPs, has the lowest
EminX values, i.e., the weakest halogen-cation bond strengths, which well explains the degra-
dation of MAPbI3 to PbI2 under UV light even without moisture or oxygen present.96 The
observed trend can roughly be attributed to the size or the number of hydrogen atoms in the
11

Figure 2: A barplot showing the fractional deviations from the mean of the EminX values.The boxes show the standard deviation within the 3 points per metal. The cations areordered by the mean of bars for Cl, Br and I. The cation structures are shown without theirhydrogen atoms.
cation. In Svane et al.64 who studied 4 organic cations in formate perovskites, they found
strong H-bonds in guanidinium and hydrazinium and weak ones in dimethylammonium and
azetidinium. This agrees with the trend found here except for the hydrazinium cation, that
has a remarkable low EminX value.
Svane et al.64 also studied the HOIPs MAPbX3 and FAPbX3 with X=Cl, Br and I. Re-
markably, they found for FA slightly lower total electrostatic energies and hydrogen bonding
energies than for MA. We also find slightly lower hydrogen bonding energies for FA, but
our results also further suggests that the Etotal values for FA are slightly higher than for
MA because of π · · ·X interactions (See supporting information section 1). Interestingly,
FA has the 3 but lowest Etotal, while it is ranked the 6 but lowest for EminX . This means
that, despite FA has comparable total energy interaction as MA, it more evenly binds to the
three different halogens, while MA leaves some halogens only weakly coupled. The relatively
higher ranking in EminX vs. Etotal is observed for all four cations having π-bonds.
In Table 1 the 5 structure with the minimum and maximum Etotal and EminX are given.
Since the cation halogen bond strength decrease with decreasing electronegativity of the
halogen is it logical that all minimum structures contain iodine while all maximum structures
contain fluorine. Guanidinium is the only cation that has both, a high Etotal and a high
12

Table 1: Table giving the 5 structures with the lowest and the 5 with the highest cation-halogen bond strengths. Note that some structures appear in both columns: 7=18, 8=19and 10=20. All values are in meV. The ‘M’ and ‘X’ columns give the type of metal andhalogen respectively.
# M X cation Etotal # M X cation EminX
1 Sn I Hydrazinium 374 11 Pb I Methylammonium 922 Ge I Ammonium 380 12 Sn I Methylammonium 933 Pb I Hydrazinium 387 13 Pb I Hydroxylammonium 954 Pb I Ammonium 396 14 Ge I Hydroxylammonium 1035 Sn I Ammonium 403 15 Ge I Methylammonium 104
6 Ge F Hydroxylammonium 2549 16 Ge F Propylammonium 7697 Ge F Guanidinium 2712 17 Pb F Tetramethylammonium 7968 Sn F Guanidinium 2777 18 Ge F Guanidinium 8159 Pb F Acetamidinium 2804 19 Sn F Guanidinium 879
10 Pb F Guanidinium 2925 20 Pb F Guanidinium 931
EminX . Although Hydrazinium and Ammonium have the lowest Etotal, Methylammonium
and Hydroxylammonium have the weakest coupling to a halogen atom. Hydroxylammonium
has the most noticable result since it binds very strongly to one halogen via an O−H· · ·X−M
bond, while it leaves other halogens only weakly bound.
(a) 11 (b) 14 (c) 20(d) 21
Figure 3: 4 HOIP structures with the BCPs to only one type of halogen shown as little blackdots, connected by dashed lines. The atoms are colored as Pb-black, I-purple, Ge-dark(steel)blue, F-blue, O-red, N-blue, C-brown and H-white.
Noticeable binding characteristics are found in specific structures. We discuss at first
some structures with either very small or high EminX . Next, we show the structures having
the highest and lowest Etotal followed by a discussion of the structures that have the weakest
and strongest individual bonds. By looking at these structures we can analyze the very
nature of the bonds that contribute to EminX and what is the influence of the orientation of
13

the cation.
In Figure 3 only the BCPs that contribute to EminX are shown. Structure 11 (Methy-
lammonium Lead Iodide), has the lowest EminX value of only 92 meV. The weakest bound
halogens are oriented approximately in the plane perpendicular to the C-N bond. Since nei-
ther the methyl, nor the amine group is oriented towards these halogens, the bond lengths
are larger and the binding weaker. In total the C−H· · ·I bonds account for more than 50%
of EminX illustrating the importance of these bonds in HOIPs (and MAPbI3 in particular)
as previously partially advocated by Varadwaj et al.62,85 Another interesting structure with
a very low EminX of only 103 meV is 14 (Hydroxylammonium Germanium Iodide). The
weakest bound halogens in 14 are only bound with two long hydrogen bonds of 2.9 and 3.4
A(together 86% of EminX) and a long chalcogen bond of 4.2 A(O· · ·F ).
Structure 20 (Guanidinium Lead Fluoride) has the highest EminX with two hydrogen
bonds in the plane of the molecule that account together for 65% of EminX and the other 35%
is caused by π-anion interactions thus adding a significant part of to EminX . Additionally, the
structure of Imidazolium Tin Fluoride (21) is given in Figure 3 because it has the halogens
with the strongest interactions to the cation. The total binding energy to these halogen
atoms in the whole dataset are 1290 meV, of which the two H-bonds account for 79% and
the rest are π-anion interactions.
(a) 1 (b) 10(c) 11 (d) 22
Figure 4: 4 HOIP structures with the BCPs shown as little black dots, connected by dashedlines. The atoms are colored as Pb-black, I-purple, Ge-dark(steel) blue, F-blue, O-red, N-blue, C-brown and H-white.
The structures with the lowest and highest Etotal, 1 and 10, (Hydrazinium Tin Iodide
and Guanidinium Lead Fluoride), are shown in Figure 4. 1 has 10 BCPs while 10 has
14

15. It is surprising that Etotal for hydrazinium is even lower than for ammonium. This is
most likely caused by the more favorable cation position in the ammonium structure where
there are 3 strong non-bifurcated H-bonds while the fourth hydrogen of ammonium has a
trifurcated H-bond, i.e., a single hydrogen participating in 3 H-bonds. This orientation is
possible because ammonium can align its threefold rotational axis with the <111> direction
of the cube. In structure 10, 65% of Etotal is caused by the strong H-bonds in the plane of
the guanidinium molecule. Due to high symmetrically arrangement, guanidinium binds very
evenly to all three types of halogens and thus EminX / 3Etotal. This provide a quantitative
explanation of the exceptional binding properties of guanidinium in HOIPs. The combination
of the strong H-bonds and the bonds not being free to rotate due to π-conjugation causes
guanidinium to stay strongly bound at elevated temperatures as well.64 Additionally note
that guanidinium has a three-fold rotational axis aligned with the <111> direction of the
cube so it binds similarly with all three halogens.
In Figure 4, also the structures with the weakest and strongest bond present in the
dataset are depicted, as 11 and 22 respectively (Methylammonium Lead Iodide and Hy-
droxylammonium Lead Fluoride). The weakest BCP is present in MAPbI3 with only 7.7
meV. This bond also corresponds with the BCP that has the lowest ρ0 and ∇2ρ values of
0.00128 and 0.0037 respectively. This bond can be characterised as a carbon-halogen bond
C· · · I, a very weak so-called tetrel bond, only reported for MAPbBr3 in one previous work.85
The strongest bond in 22 is an O-H· · ·F bond. From the whole dataset, this bond also is the
shortest and has the highest density at its BCP (and second but highest density gradient).
Note that this bond causes a large tilting angle in the perovskite. Large tilting angles often
cause structural instability and non-photoactive phases.97,98 Hence, to prevent large tilting
angles, it is best for the cation to bind all the halogens strongly but evenly.
In summary, we can conclude that having a strong cation halogen bond does not mean
having a high EminX as in hydroxylammonium, and that methylammonium has a low EminX
due to the difficulty to couple to all three halogens while Guadinium binds very effectively.
15

SISSO Results
To increase our understanding of how the chemical composition, and in particular the cation
structure influences the binding in HOIPs, we formulate here new mathematical descriptors
composed from elementary topological features, that best correlate with EminX . To this
end we apply the symbolic regression technique called SISSO, which designs mathematical
descriptors by applying simple mathematical operators to the user-provided input values,
i.e., the elementary ”raw” features. For the halogen and the metal the included elementary
features are their polarizability α, vdW radius r and electronegativity χ. The structure
of the cation is encoded via its effective radius and relevant bond counts: the number of
C-H, N-H, O-H and π bonds. (A table of all features for all the structures can be found in
the Electronic Supplementary Information.) Note that to obtain this elementary features,
no knowledge of the structures is required and evaluation of the descriptors should be as
straightforward as evaluating the Goldschmidt tolerance factor. The cation radii are only an
approximation since most of the cations are not even close to being spherical. Nevertheless,
they have been shown to be effective quantities within applications of predictive techniques
on HOIPs.87,89,99
Since we already know that the type of halogen plays an important role, we ran SISSO in
two ways: in the first case we apply SISSO on the whole dataset, named single-task. In the
second case, we apply the multi-task learning capability of SISSO where the dataset is split
into a subset for each halogen. Next, SISSO tries to find global descriptors while for each set
different coefficients are optimized. So, for a multi-set multi-dimensional SISSO run, EminX
for a given HOIP X is: EminX(X ) = c0i +∑Ndim
j=1 cjidj(X ) where c0i is an intercept of the ith
task and cji is the coefficients of the ith task of the jth dimension and dj is the descriptor of
the jth dimension, thus being identical for amongst all tasks.
To allow for scientific interpretability we apply a maximum to the descriptor complexity.
This cutoff is effectively a hyperparameter to be chosen freely by the user. In Figure 5 the
errors as a function of dimension and complexity cutoff are shown for single and multi-task
16
1 2 3dimension
35
40
45
50
55
60
65
Mea
n Ab
solu
te E
rror (
meV
)
ST | maxcomplex=1ST | maxcomplex=2ST | maxcomplex=3MT | maxcomplex=1MT | maxcomplex=2MT | maxcomplex=3
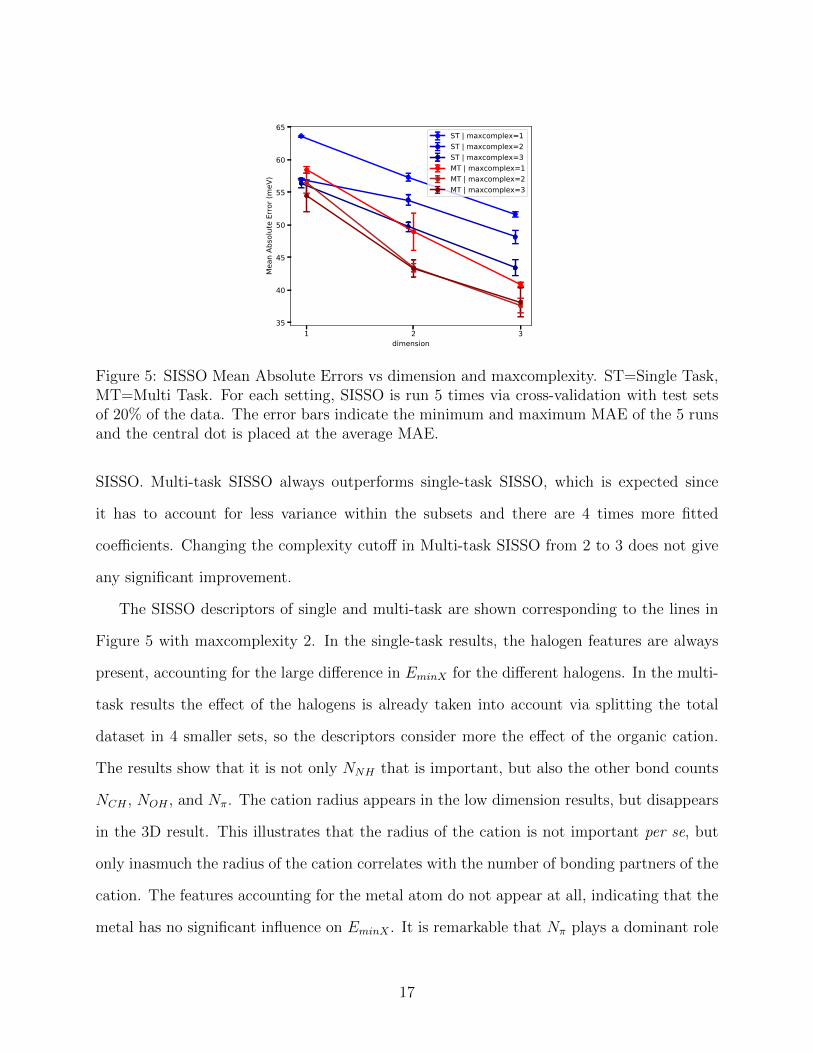
Figure 5: SISSO Mean Absolute Errors vs dimension and maxcomplexity. ST=Single Task,MT=Multi Task. For each setting, SISSO is run 5 times via cross-validation with test setsof 20% of the data. The error bars indicate the minimum and maximum MAE of the 5 runsand the central dot is placed at the average MAE.
SISSO. Multi-task SISSO always outperforms single-task SISSO, which is expected since
it has to account for less variance within the subsets and there are 4 times more fitted
coefficients. Changing the complexity cutoff in Multi-task SISSO from 2 to 3 does not give
any significant improvement.
The SISSO descriptors of single and multi-task are shown corresponding to the lines in
Figure 5 with maxcomplexity 2. In the single-task results, the halogen features are always
present, accounting for the large difference in EminX for the different halogens. In the multi-
task results the effect of the halogens is already taken into account via splitting the total
dataset in 4 smaller sets, so the descriptors consider more the effect of the organic cation.
The results show that it is not only NNH that is important, but also the other bond counts
NCH , NOH , and Nπ. The cation radius appears in the low dimension results, but disappears
in the 3D result. This illustrates that the radius of the cation is not important per se, but
only inasmuch the radius of the cation correlates with the number of bonding partners of the
cation. The features accounting for the metal atom do not appear at all, indicating that the
metal has no significant influence on EminX . It is remarkable that Nπ plays a dominant role
17

Table 2: Table showing the descriptors as found by SISSO setting the maximum complexityat 2. ST=single-task, MT=multi-task. The descriptor coefficients are not shown but givenin Supporting Information Section 3.
dim task descriptors
1DST rcation
r2X
MT Nπ + |NCH −NNH |
2DST rcation
r2X, NNH∗Nπ
αX
MT NCH + NOH + Nπ , (NNH + NOH)2
3DST NOH+Nπ
rX, NNH+NOH
αX,
N2CH
r2X
MT NCH + NOH + Nπ , NNH + 2NOH , NCH ∗ |NNH −Nπ|
in the SISSO descriptors for EminX as it is included in the multi-task 1D descriptor. These
results further illustrate the importance of weak interactions for EminX .
In the 3D multi-task descriptor a factor 2 appears. This can occur when SISSO uses
the ”+” operator twice with the same feature. Here, NNH + NOH + NOH simply reduces
to NNH + 2NOH . It is a generally occurring phenomenon that SISSO descriptors are found
that try to balance the importance of two elementary features by constructing ”weights”
and NNH + 2NOH includes to elementary features NNH and NOH with weights 1 and 2
respectively. In this case it is a logical consequence of the O−H· · ·X bonds being stronger
than the N−H· · ·X bonds.
Still a significant part of the variance in EminX stays unexplained by the SISSO results,
showing that other factors than those of the included topological features play a role. This
is not a surprise, since the input features do not take into account the crystal packing. The
packing factor is important since some cations can orient themselves more optimally than
others to form strong non-covalent interactions to each halogen. As an example, the smallest
cation, ammonium, can form a strong interaction with each of the tree types of halogens,
explaining why its EminX is higher than those of methylammonium and hydrazinium. Nev-
ertheless, (given that the baseline MAE is 130 meV), it is remarkable that around 70%
18

of the variance can be explained using only these basic features, providing already great
understanding in factors determining EminX .
Last, we compare our results for the prediction of halides perovskite stability with the
Goldschmidt Tolerance factor, commonly used to predict if a material will be stable in the
perovskite conformation and given by:99
t =rcation + rX√2(rM + rX)
(2)
Although improved stability factors have been designed,100 the general trend still applies
that for a perovskite structure to be stable t has to be approximately between 0.85 and
1.12.101,102 Our results show that roughly EminX and Etotal increase with larger cations, while
the Goldschmidt factor puts a limit at how large these cations can be and a balanced solution
has to be chosen. So, although our results show that HOIPs will become more structurally
stable w.r.t. halogen migration when the cation binds more strongly to the halogens, the
perovskite structure itself might become unstable when larger cations are used. For example,
Guanidinium Germanium Iodide has t = 1.2, thus lying outside the stability window, while
Guanidinium Lead Iodide, having a larger metal, is stable (t = 1.03). Nevertheless, also
small additions of other cations might improve the perovskite stability while keeping the
Goldschmidt factor within the acceptable range. When t is too high, the tilting angles of
the MX6 octahedrons increase leading to non-photoactive phases. For example, at room
temperature FAPbI3 exist in a non-photoactive phase while when FA is mixed with MA or
Cs, the photoactive phase becomes stable.74,101
For what concerns the most common cations (MA and FA), our results generalize a
previous study35 where only the MA and FA cations were compared, showing higher binding
strengths for the FA cation. Indeed, our findings generalize the higher Etotal of FA than
MA to any type of halogen or metal, but by looking at EminX instead of only looking at
Etotal, our work makes an even stronger case to use FA instead of MA, since MA binds some
19
halogens particularly weakly.
Azetidinium
Guanidinium
Imidazolium
Acetamidinium
Tetramethylammonium
Formamidinium
Methylammonium
Trimethylammonium
Ethylammonium
Dimethylammonium
Isopropylammonium
Propylammonium
Butylammonium
HydraziniumAmmonium
Hydroxylammonium
cation
0
10
20
30
tiltin
g an
gle
(deg
rees
)
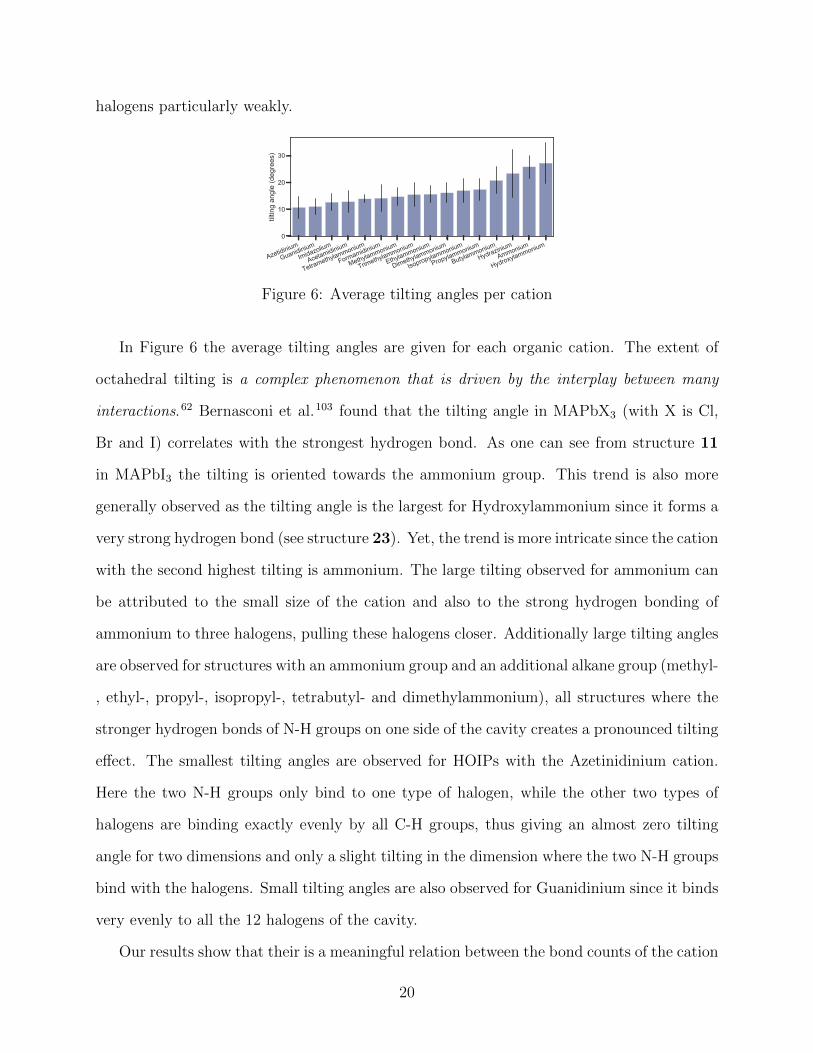
Figure 6: Average tilting angles per cation
In Figure 6 the average tilting angles are given for each organic cation. The extent of
octahedral tilting is a complex phenomenon that is driven by the interplay between many
interactions.62 Bernasconi et al.103 found that the tilting angle in MAPbX3 (with X is Cl,
Br and I) correlates with the strongest hydrogen bond. As one can see from structure 11
in MAPbI3 the tilting is oriented towards the ammonium group. This trend is also more
generally observed as the tilting angle is the largest for Hydroxylammonium since it forms a
very strong hydrogen bond (see structure 23). Yet, the trend is more intricate since the cation
with the second highest tilting is ammonium. The large tilting observed for ammonium can
be attributed to the small size of the cation and also to the strong hydrogen bonding of
ammonium to three halogens, pulling these halogens closer. Additionally large tilting angles
are observed for structures with an ammonium group and an additional alkane group (methyl-
, ethyl-, propyl-, isopropyl-, tetrabutyl- and dimethylammonium), all structures where the
stronger hydrogen bonds of N-H groups on one side of the cavity creates a pronounced tilting
effect. The smallest tilting angles are observed for HOIPs with the Azetinidinium cation.
Here the two N-H groups only bind to one type of halogen, while the other two types of
halogens are binding exactly evenly by all C-H groups, thus giving an almost zero tilting
angle for two dimensions and only a slight tilting in the dimension where the two N-H groups
bind with the halogens. Small tilting angles are also observed for Guanidinium since it binds
very evenly to all the 12 halogens of the cavity.
Our results show that their is a meaningful relation between the bond counts of the cation
20

and the HOIP stability. While former Machine Learning models are only based on effective
radii and electronegativity values,87,104,105 from our results it can be induced that inclusion
of the bond counts, especially when combined like in the SISSO descriptors, express useful
quantities. For organic cations, these bond counts give far more information than only the
effective radii since the presence of π bonds or O-H bonds is crucial information not captured
in only an effective radius. Specific bond counts affect the non-covalent interactions, which
dictate tilting angles, that then have an influence on carrier mobility and band gaps.
Conclusions
HOIPs represent a potential game-changer technology to harvest solar energy. Still, the
intrinsic instability and degradation due to external factors of such systems prevent large
scale production. The present study has identified the key aspects that contribute to the
stabilization of halide ions in HOIPs, the major species that undergoes migration in absence
and under the effect of different external factors, creating instability and degradation.
Our work has revealed the fundamental bond and composition properties that most
affect the halogen-cation interactions in hybrid perovskites in a large chemical space. This
allows us to give a rationale of previous results, based on smaller spaces and to highlight
previous misconceptions and overlooked aspects. In particular, we unveil the reasons of an
improved stability given by the halogen F, the origin of the higher stability offered by FA
compared to MA, which shows to be different from previous explanations in the literature,
and the reason behind the exceptional case of overall stronger bonds for guanidinium. A
clear inverse power law between bond lengths and density at the BCPs is also found. Our
results highlight the importance of the cation-halide interactions and the urge to differentiate
between different halide positions. We have corroborated in a quantitative and first-principles
manner the importance of non-covalent interactions other than N−H· · ·I, such as C−H· · ·I
andN/C· · ·I for MAPbI3, advocated in a previous work,62 confirming that the neglect of such
21

interactions in the majority of studies may lead to potentially wrong criteria for the design
of new HOIPs. We did this not only for MA, but for a whole array of 16 different organic
cations. Additionally in some cations such as FA, also π· · ·X are found. We show that these
weak interactions have a significant role to bind the halogen atoms, and thus are expected to
be important to prevent halogen migration. Therefore, the in-depth understanding of weak
non-covalent interactions is fundamental in the molecular design of new more stable HOIPs.
Moreover, as the most prevalent cation MA even has the lowest EminX , there is ample room
for cation substitution to increase the cation halogen coupling.
We found new mathematical, physically meaningful descriptors that identify the factors
that dominate the coupling between the halogens and cations. We showed that the factors in
order of importance are the type of halogen, the presence of π· · ·X bonding and the number
of hydrogen bond donors including C−H. Bonds other than H-bonds have been overlooked
in previous studies, like the considerable importance of π-bonds in binding to the weakest
halogen bonds. We show that bond counts are more meaningful than only the effective
radii as used in the prevalent Goldschmidt tolerance factor. Moreover, the found descriptors
unveil the importance of π-interactions for strong cation-halide interactions. Based on this
work, we suggest HOIP stabilization by inclusion of larger cations, preferably those having
π-bonds. Guanidinium proves to be the most effective cation due to multiple N−H hydrogen
bond donors, a large π-conjugated system and its efficient packing due to alignment with
the <111> direction, thus binding evenly with all halogens.
Our work focuses on enhanced stability via a robust design approach for strengthening
molecular bonds, and offers an alternative route to the different approaches previously used
for HOIPs. We believe that our work will motivate the investigation of new hybrid perovskite
materials with strong and balanced non-covalent interactions. The new descriptors can be
used to train machine learning algorithms for even larger chemical spaces, to drive the
design of HOIPs with chemical bonding enhancement and immobilization of the potentially
migrating ions. As our study focuses on shaping atomic-scale properties within one unit cell,
22

it potentially offers the possibility to design large size single crystals that do not segregate
and do not form grains.
Acknowledgement
This work has received funding from the Research Executive Agency under the EU’s Horizon
2020 Research and Innovation program ESC2RAD (grant ID 776410). We are grateful to
PRACE for granting us access to the computational resources of the Joliot-Curie SKL at
CEA (France) (PRACE Project: 2019215186) and we thank the Space POLE HPC for
providing the resources for the SISSO calculations.
Supporting Information Available
The Supporting Information document shows a plot of fractional mean deviations from Etotal
instead of EminX . Also a boxplot and barplot for the total set of 548 perovkite structured
HOIPs in the dataset is presented. Additionally the SISSO intercepts and coefficients are
given. Finally a section about the correlations between bond lengths and the bond critical
points is presented.
Two additional files are available. The first one is a comma-separated file listing all the
548 HOIPs adhering to a perovskite structure with their continuous symmetry measures for
cubicity, Etotal, EminX and Eatomozation values. The second file is a SISSO input file listing
all the input features.
See DOI: 00.0000/00000000.
References
(1) Jeon, N. J.; Noh, J. H.; Yang, W. S.; Kim, Y. C.; Ryu, S.; Seo, J.; Seok, S. I. Nature
2015, 517, 476–480.
23

(2) Brown, C. R.; Eperon, G. E.; Whiteside, V. R.; Sellers, I. R. ACS Appl. Energy Mater.
2019, 2, 814–821.
(3) Cardinaletti, I.; Vangerven, T.; Nagels, S.; Cornelissen, R.; Schreurs, D.; Hruby, J.;
Vodnik, J.; Devisscher, D.; Kesters, J.; D’Haen, J. et al. Sol. Energy Mater Sol. 2018,
182, 121–127.
(4) Yang, J.; Bao, Q.; Shen, L.; Ding, L. Nano Energy 2020, 76, 105019.
(5) Best Research-Cell Efficiency Chart. www.nrel.gov/pv/cell-efficiency.html,
2021; Accessed: January 2021.
(6) Green, M. A.; Hishikawa, Y.; Warta, W.; Dunlop, E. D.; Levi, D. H.; Hohl-Ebinger, J.;
Ho-Baillie, A. W. Prog. Photovolt. 2017, 25, 668–676.
(7) Snaith, H. J. J. Phys. Chem. Lett. 2013, 4, 3623–3630.
(8) Kaltenbrunner, M.; Adam, G.; G lowacki, E. D.; Drack, M.; Schwodiauer, R.;
Leonat, L.; Apaydin, D. H.; Groiss, H.; Scharber, M. C.; White, M. S. et al. Na-
ture Materials 2015, 14, 1032–1039.
(9) Burschka, J.; Pellet, N.; Moon, S.-J.; Humphry-Baker, R.; Gao, P.; Nazeerud-
din, M. K.; Gratzel, M. Nature 2013, 499, 316–319.
(10) Lang, F.; Nickel, N. H.; Bundesmann, J.; Seidel, S.; Denker, A.; Albrecht, S.;
Brus, V. V.; Rappich, J.; Rech, B.; Landi, G. et al. Adv. Mater. 2016, 28, 8726–
8731.
(11) Miyazawa, Y.; Ikegami, M.; Miyasaka, T.; Ohshima, T.; Imaizumi, M.; Hirose, K.
Evaluation of radiation tolerance of perovskite solar cell for use in space. 2015 IEEE
42nd Photovoltaic Specialist Conference (PVSC). 2015; pp 1–4.
(12) Miyazawa, Y.; Ikegami, M.; Chen, H.-W.; Ohshima, T.; Imaizumi, M.; Hirose, K.;
Miyasaka, T. iScience 2018, 2, 148–155.
24

(13) Huang, J.; Kelzenberg, M. D.; Espinet-Gonzalez, P.; Mann, C.; Walker, D.; Naqavi, A.;
Vaidya, N.; Warmann, E.; Atwater, H. A. Effects of Electron and Proton Radiation on
Perovskite Solar Cells for Space Solar Power Application. 2017 IEEE 44th Photovoltaic
Specialist Conference (PVSC). 2017; pp 1248–1252.
(14) Kojima, A.; Teshima, K.; Shirai, Y.; Miyasaka, T. J. Am. Chem. Soc. 2009, 131,
6050–6051.
(15) Yue, L.; Yan, B.; Attridge, M.; Wang, Z. Solar Energy 2016, 124, 143–152.
(16) De Wolf, S.; Holovsky, J.; Moon, S.-J.; Loper, P.; Niesen, B.; Ledinsky, M.; Haug, F.-J.;
Yum, J.-H.; Ballif, C. J. Phys. Chem. Lett. 2014, 5, 1035–1039.
(17) McMeekin, D. P.; Sadoughi, G.; Rehman, W.; Eperon, G. E.; Saliba, M.;
Horantner, M. T.; Haghighirad, A.; Sakai, N.; Korte, L.; Rech, B. et al. Science
2016, 351, 151–155.
(18) Saba, M.; Quochi, F.; Mura, A.; Bongiovanni, G. Acc. Chem. Res. 2016, 49, 166–173.
(19) Motta, C.; El-Mellouhi, F.; Sanvito, S. Sci. Rep. 2015, 5, 12746.
(20) Wehrenfennig, C.; Eperon, G. E.; Johnston, M. B.; Snaith, H. J.; Herz, L. M. Adv.
Mater. 2014, 26, 1584–1589.
(21) Zheng, F.; Wang, L.-w. Energy Environ. Sci. 2019, 12, 1219–1230.
(22) Frost, J. M.; Whalley, L. D.; Walsh, A. ACS Energy Lett. 2017, 2, 2647–2652.
(23) Ambrosio, F.; Wiktor, J.; De Angelis, F.; Pasquarello, A. Energy Environ. Sci. 2018,
11, 101–105.
(24) Schlipf, M.; Ponce, S.; Giustino, F. Phys. Rev. Lett. 2018, 121, 086402.
(25) Miyata, A.; Mitioglu, A.; Plochocka, P.; Portugall, O.; Wang, J. T.-W.; Stranks, S. D.;
Snaith, H. J.; Nicholas, R. J. Nat. Physics 2015, 11, 582–587.
25
(26) Srimath Kandada, A. R.; Petrozza, A. Acc. Chem. Res. 2016, 49, 536–544.
(27) Ponseca, C. S.; Savenije, T. J.; Abdellah, M.; Zheng, K.; Yartsev, A.; Pascher, T.;
Harlang, T.; Chabera, P.; Pullerits, T.; Stepanov, A. et al. J. Am. Chem. Soc. 2014,
136, 5189–5192.
(28) Stranks, S. D.; Eperon, G. E.; Grancini, G.; Menelaou, C.; Alcocer, M. J. P.; Lei-
jtens, T.; Herz, L. M.; Petrozza, A.; Snaith, H. J. Science 2013, 342, 341–344.
(29) Boyd, C. C.; Cheacharoen, R.; Leijtens, T.; McGehee, M. D. Chem. Rev. 2019, 119,
3418–3451.
(30) Berry, J.; Buonassisi, T.; Egger, D. A.; Hodes, G.; Kronik, L.; Loo, Y.-L.;
Lubomirsky, I.; Marder, S. R.; Mastai, Y.; Miller, J. S. et al. Adv. Mater. 2015,
27, 5102–5112.
(31) Zhang, Y.-Y.; Chen, S.; Xu, P.; Xiang, H.; Gong, X.-G.; Walsh, A.; Wei, S.-H. Chin.
Phys. Lett. 2018, 35, 036104.
(32) Akbulatov, A. F.; Frolova, L. A.; Dremova, N. N.; Zhidkov, I.; Martynenko, V. M.;
Tsarev, S. A.; Luchkin, S. Y.; Kurmaev, E. Z.; Aldoshin, S. M.; Stevenson, K. J. et al.
J. Phys. Chem. Lett. 2020, 11, 333–339.
(33) Eames, C.; Frost, J. M.; Barnes, P. R. F.; O’Regan, B. C.; Walsh, A.; Islam, M. S.
Nat. Commun. 2015, 6, 7497.
(34) Meggiolaro, D.; Motti, S. G.; Mosconi, E.; Barker, A. J.; Ball, J.; Andrea Ric-
cardo Perini, C.; Deschler, F.; Petrozza, A.; De Angelis, F. Energy Environ. Sci.
2018, 11, 702–713.
(35) Oranskaia, A.; Schwingenschlogl, U. Adv. Energy Mater. 2019, 9, 1901411.
(36) Futscher, M. H.; Lee, J. M.; McGovern, L.; Muscarella, L. A.; Wang, T.; Haider, M. I.;
Fakharuddin, A.; Schmidt-Mende, L.; Ehrler, B. Mater. Horiz. 2019, 6, 1497–1503.
26

(37) Khan, R.; Ighodalo, K. O.; Xiao, Z. Soft-Matter Thin Film Solar Cells ; AIP Publish-
ing, Melville, New York, 2020; Chapter 3.
(38) Adinolfi, V.; Yuan, M.; Comin, R.; Thibau, E. S.; Shi, D.; Saidaminov, M. I.; Kan-
janaboos, P.; Kopilovic, D.; Hoogland, S.; Lu, Z.-H. et al. Adv. Mater. 2016, 28,
3406–3410.
(39) Yin, W.-J.; Shi, T.; Yan, Y. Adv. Mater. 2014, 26, 4653–4658.
(40) Du, M.-H. J. Phys. Chem. Lett. 2015, 6, 1461–1466.
(41) Meggiolaro, D.; De Angelis, F. ACS Energy Lett. 2018, 3, 2206–2222.
(42) Wolf, M. J.; Ghosh, D.; Kullgren, J.; Pazoki, M. In Characterization Techniques for
Perovskite Solar Cell Materials ; Pazoki, M., Hagfeldt, A., Edvinsson, T., Eds.; Micro
and Nano Technologies; Elsevier, 2020; pp 217–236.
(43) Tong, C.-J.; Li, L.; Liu, L.-M.; Prezhdo, O. V. J. Am. Chem. Soc. 2020, 142, 3060–
3068.
(44) Lang, F.; Shargaieva, O.; Brus, V. V.; Neitzert, H. C.; Rappich, J.; Nickel, N. H. Adv.
Mater. 2018, 30, 1702905.
(45) Yang, M.; Zhang, T.; Schulz, P.; Li, Z.; Li, G.; Kim, D. H.; Guo, N.; Berry, J. J.;
Zhu, K.; Zhao, Y. Nat. Commun. 2016, 7, 12305.
(46) Yi, C.; Luo, J.; Meloni, S.; Boziki, A.; Ashari-Astani, N.; Gratzel, C.; Zakeerud-
din, S. M.; Rothlisberger, U.; Gratzel, M. Energy Environ. Sci. 2016, 9, 656–662.
(47) Ferdani, D. W.; Pering, S. R.; Ghosh, D.; Kubiak, P.; Walker, A. B.; Lewis, S. E.;
Johnson, A. L.; Baker, P. J.; Islam, M. S.; Cameron, P. J. Energy Environ. Sci. 2019,
12, 2264–2272.
27
(48) Wang, F.; Geng, W.; Zhou, Y.; Fang, H.-H.; Tong, C.-J.; Loi, M. A.; Liu, L.-M.;
Zhao, N. Adv. Mater. 2016, 28, 9986–9992.
(49) De Marco, N.; Zhou, H.; Chen, Q.; Sun, P.; Liu, Z.; Meng, L.; Yao, E.-P.; Liu, Y.;
Schiffer, A.; Yang, Y. Nano Lett. 2016, 16, 1009–1016.
(50) Yang, W. S.; Park, B.-W.; Jung, E. H.; Jeon, N. J.; Kim, Y. C.; Lee, D. U.; Shin, S. S.;
Seo, J.; Kim, E. K.; Noh, J. H. et al. Science 2017, 356, 1376–1379.
(51) Noh, J. H.; Im, S. H.; Heo, J. H.; Mandal, T. N.; Seok, S. I. Nano Lett. 2013, 13,
1764–1769.
(52) Saliba, M.; Matsui, T.; Seo, J.-Y.; Domanski, K.; Correa-Baena, J.-P.; Nazeerud-
din, M. K.; Zakeeruddin, S. M.; Tress, W.; Abate, A.; Hagfeldt, A. et al. Energy
Environ. Sci. 2016, 9, 1989–1997.
(53) Saidaminov, M. I.; Kim, J.; Jain, A.; Quintero-Bermudez, R.; Tan, H.; Long, G.;
Tan, F.; Johnston, A.; Zhao, Y.; Voznyy, O. et al. Nature Energy 2018, 3, 648–654.
(54) Zheng, X.; Chen, B.; Dai, J.; Fang, Y.; Bai, Y.; Lin, Y.; Wei, H.; Zeng, X.; Huang, J.
Nature Energy 2017, 2, 17102.
(55) Li, F.; Liu, M. J. Mater. Chem. A 2017, 5, 15447–15459.
(56) Li, N.; Tao, S.; Chen, Y.; Niu, X.; Onwudinanti, C. K.; Hu, C.; Qiu, Z.; Xu, Z.;
Zheng, G.; Wang, L. et al. Nature Energy 2019, 4, 408–415.
(57) Holekevi Chandrappa, M. L.; Zhu, Z.; Fenning, D. P.; Ong, S. P. Chem. Mater. 2021,
33, 4672–4678.
(58) Zhang, T.; Meng, X.; Bai, Y.; Xiao, S.; Hu, C.; Yang, Y.; Chen, H.; Yang, S. J. Mater.
Chem. A 2017, 5, 1103–1111.
28

(59) Oranskaia, A.; Yin, J.; Bakr, O. M.; Bredas, J.-L.; Mohammed, O. F. J. Phys. Chem.
Lett. 2018, 9, 5474–5480.
(60) Schottel, B. L.; Chifotides, H. T.; Dunbar, K. R. Chem. Soc. Rev. 2008, 37, 68–83.
(61) Lee, J.-H.; Bristowe, N. C.; Bristowe, P. D.; Cheetham, A. K. Chem. Commun. 2015,
51, 6434–6437.
(62) Varadwaj, P. R.; Varadwaj, A.; Marques, H. M.; Yamashita, K. Sci. Rep. 2019, 9, 50.
(63) Lee, J. H.; Lee, J.-H.; Kong, E.-H.; Jang, H. M. Sci. Rep. 2016, 6, 21687.
(64) Svane, K. L.; Forse, A. C.; Grey, C. P.; Kieslich, G.; Cheetham, A. K.; Walsh, A.;
Butler, K. T. J. Phys. Chem. Lett. 2017, 8, 6154–6159.
(65) Bader, R.; Bader, R. Atoms in Molecules: A Quantum Theory ; International series of
monographs on chemistry; Clarendon Press, 1990.
(66) Ouyang, R.; Curtarolo, S.; Ahmetcik, E.; Scheffler, M.; Ghiringhelli, L. M. Phys. Rev.
Materials 2018, 2, 083802.
(67) Mata, I.; Alkorta, I.; Espinosa, E.; Molins, E. Chem. Phys. Lett. 2011, 507, 185 – 189.
(68) Abramov, Y. A. Acta Crystallogr. A 1997, 53, 264–272.
(69) Kumar, P. S. V.; Raghavendra, V.; Subramanian, V. J. Chem. Sci. 2016, 128, 1527–
1536.
(70) Bankiewicz, B.; Matczak, P.; Palusiak, M. J. Phys. Chem. A 2012, 116, 452–459.
(71) Shahbazian, S. Chem. Eur. J. 2018, 24, 5401–5405.
(72) Lane, J. R.; Contreras-Garcıa, J.; Piquemal, J.-P.; Miller, B. J.; Kjaergaard, H. G. J.
Chem. Theory Comput. 2013, 9, 3263–3266.
(73) Kim, C.; Huan, T. D.; Krishnan, S.; Ramprasad, R. Scientific Data 2017, 4, 170057.
29
(74) Ava, T.; Mamun, A.; Marsillac, S.; Namkoong, G. Appl. Sci. 2019, 9, 188.
(75) Goedecker, S. J. Chem. Phys. 2004, 120, 9911–9917.
(76) Lee, K.; Murray, E. D.; Kong, L.; Lundqvist, B. I.; Langreth, D. C. Phys. Rev. B
2010, 82, 081101.
(77) Kresse, G.; Furthmuller, J. Phys. Rev. B 1996, 54, 11169–11186.
(78) Draxl, C.; Scheffler, M. MRS Bulletin 2018, 43, 676–682.
(79) Ong, S. P.; Richards, W. D.; Jain, A.; Hautier, G.; Kocher, M.; Cholia, S.; Gunter, D.;
Chevrier, V. L.; Persson, K. A.; Ceder, G. Comput. Mat. Sci. 2013, 68, 314–319.
(80) Pinsky, M.; Avnir, D. Inorg. Chem. 1998, 37, 5575–5582.
(81) Giannozzi, P.; Andreussi, O.; Brumme, T.; Bunau, O.; Nardelli, M. B.; Calandra, M.;
Car, R.; Cavazzoni, C.; Ceresoli, D.; Cococcioni, M. et al. J. Phys. Condens. Matter.
2017, 29, 465901.
(82) Hamann, D. R. Phys. Rev. B 2013, 88, 085117.
(83) Yu, C.-J. J. Phys. Energy 2019, 1, 022001.
(84) de-la Roza, A. O.; Johnson, E. R.; Luana, V. Comput. Phys. Comm. 2014, 185, 1007
– 1018.
(85) Varadwaj, A.; Varadwaj, P. R.; Marques, H. M.; Yamashita, K. Mater. Today Chem.
2018, 9, 1–16.
(86) Ouyang, R.; Ahmetcik, E.; Carbogno, C.; Scheffler, M.; Ghiringhelli, L. M. J. Phys.
Mater. 2019, 2, 024002.
(87) Kieslich, G.; Sun, S.; Cheetham, A. K. Chem. Sci. 2015, 6, 3430–3433.
30

(88) Xie, S. R.; Kotlarz, P.; Hennig, R. G.; Nino, J. C. Comput. Mat. Sci. 2020, 180,
109690.
(89) Kieslich, G.; Sun, S.; Cheetham, A. K. Chem. Sci. 2014, 5, 4712–4715.
(90) Lu, S.; Zhou, Q.; Ouyang, Y.; Guo, Y.; Li, Q.; Wang, J. Nat. Commun. 2018, 9, 3405.
(91) El-Mellouhi, F.; Marzouk, A.; Bentria, E. T.; Rashkeev, S. N.; Kais, S.; Alharbi, F. H.
Chem. Sus. Chem. 2016, 9, 2648–2655.
(92) Brammer, L.; Bruton, E. A.; Sherwood, P. Crystal Growth & Design 2001, 1, 277–290.
(93) Kovacs, A.; Varga, Z. Coord. Chem. Rev 2006, 250, 710–727, 17th Main Group Chem-
istry.
(94) Korbel, S.; Marques, M. A. L.; Botti, S. J. Mater. Chem. A 2018, 6, 6463–6475.
(95) Greenwood, N.; Earnshaw, A. Chemistry of the Elements (Second Edition), second
edition ed.; Butterworth-Heinemann: Oxford, 1997; pp 367–405.
(96) Lee, S.-W.; Kim, S.; Bae, S.; Cho, K.; Chung, T.; Mundt, L. E.; Lee, S.; Park, S.;
Park, H.; Schubert, M. C. et al. Sci. Rep. 2016, 6, 38150.
(97) Wang, M.; Vasudevan, V.; Lin, S.; Jasieniak, J.; Russo, S. P.; Birbilis, N.; Med-
hekar, N. V. J. Mater. Chem. A 2020, 8, 17765–17779.
(98) El-Mellouhi, F.; Marzouk, A.; Bentria, E. T.; Rashkeev, S. N.; Kais, S.; Alharbi, F. H.
Chem. Sus. Chem. 2016, 9, 2648–2655.
(99) Goldschmidt, V. M. Ber. Dtsch. Chem. Ges. 1927, 60, 1263–1296.
(100) Bartel, C. J.; Sutton, C.; Goldsmith, B. R.; Ouyang, R.; Musgrave, C. B.; Ghir-
inghelli, L. M.; Scheffler, M. Science Advances 2019, 5 .
(101) Burger, S.; Ehrenreich, M. G.; Kieslich, G. J. Mater. Chem. A 2018, 6, 21785–21793.
31

(102) Li, C.; Lu, X.; Ding, W.; Feng, L.; Gao, Y.; Guo, Z. Acta Crystallogr. B 2008, 64,
702–707.
(103) Bernasconi, A.; Page, K.; Dai, Z.; Tan, L. Z.; Rappe, A. M.; Malavasi, L. J. Phys.
Chem. C 2018, 122, 28265–28272.
(104) Wu, T.; Wang, J. Nano Energy 2019, 66, 104070.
(105) Pilania, G.; Balachandran, P. V.; Kim, C.; Lookman, T. Frontiers in Materials 2016,
3, 19.
32

TOC Graphic
33

Supporting Information for Publication for "Molecular Bond Engineering and
Feature Learning for the Design of Hybrid Organic-Inorganic Perovskites Solar
Cells with Strong Non-Covalent Halogen-Cation Interactions"
Johannes L. Teunissen1, 2, a) and Fabiana Da Pieve1
1)Royal Belgian Institute for Space Aeronomy, Av Circulaire 3, 1180 Brussels,
Belgium2)Univ. Lille, CNRS UMR 8520 - IEMN - Institute of Electronics,
Microelectronics and Nanotechnology, F-59000 Lille, France
(Dated: 4 November 2021)
a)Electronic mail: [email protected]
S1
arX
iv:2
111.
0208
1v1
[co
nd-m
at.m
trl-
sci]
3 N
ov 2
021

S1. PLOT OF FRACTIONAL MEAN DEVIATIONS FROM Etotal INSTEAD OF EminX
Ammonium
Hydrazinium
Methylammonium
Formamidinium
Hydroxylammonium
Dimethylammonium
Imidazolium
EthylammoniumAzetidinium
Trimethylammonium
Acetamidinium
Guanidinium
Isopropylammonium
Propylammonium
Tetramethylammonium
Butylammonium
cation
0.5
0.0
0.5
f(Eto
tal) F
ClBrI
FIG. S1: A barplot showing the fractional deviations from the mean of the Etotal values. The boxes
show the standard deviation within the 3 points per metal. The cations are ordered by the mean of
bars for Cl, Br and I
S2

S2. BOXPLOT AND BARPLOT FOR TOTAL SET OF PEROVKITE STRUCTURED
HOIPS
Ge Sn Pbmetal
500
1000
1500
2000
2500
3000E t
otal
(meV
)halogen
FClBrI
FIG. S2: A boxplot showing the distribution of the Etotal values grouped by metal and halogen.
The boxes show the quartiles of the dataset while the whiskers are extended to 1.5 times the
interquartile range (IQR).
Methylammonium
HydraziniumAmmonium
Hydroxylammonium
Dimethylammonium
Formamidinium
EthylammoniumAzetidinium
Imidazolium
Acetamidinium
Isopropylammonium
Propylammonium
Trimethylammonium
Tetramethylammonium
Butylammonium
Guanidinium
cation
0.50
0.25
0.00
0.25
0.50
f(Em
inX) F
ClBrI
FIG. S3: A barplot showing the fractional deviations from the mean of the EminX values. The
boxes show the standard deviation within the 3 points per metal. The cations are ordered by the
mean of bars for Cl, Br and I
S3

S3. SISSO INCEPTS AND COEFFICIENTS
When the units are right, the product of the coefficients with the descriptor should yield the
same unit as the target property, here an energy value in meV. In order to obtain the right units,
implicitly every coefficients has the same unit as the target property multiplied by the inverse
of the descriptor unit. For example, for the descriptor rcationr2X
the unit is Å−1
and the unit of the
corresponding coefficient will be meV · (Å−1)−1 = meV Å
TABLE S1
descriptor coefficients
dimension type task intercept 1st 2nd 3rd
1D
ST -10.83775855 319.9727192
MT
F 388.8449501 31.40147593
Cl 201.731012 15.29598431
Br 169.2543037 12.25954921
I 123.5074933 9.572764922
2D
ST -15.32977489 320.2275489 44.64510666
MT
F 133.2169537 45.49644431 16.48683707
Cl 72.46005121 24.79553435 6.465460895
Br 59.21246324 21.10295285 5.30557354
I 32.32262889 17.45283407 4.031622733
3D
ST 85.81368442 58.70445839 355.0621774 5.719060367
MT
F -152.4998827 76.19853998 131.4068389 -12.37686022
Cl -42.50024164 34.82282038 52.5412850 -3.190133102
Br -50.71065481 28.48207304 44.04192996 -1.073078228
I -47.58416835 22.38645474 32.65747739 -0.0311616557
S4

S4. CORRELATIONS BETWEEN BOND LENGTHS AND BOND CRITICAL POINTS
2.25 2.50 2.75 3.00 3.25 3.50 3.75 4.00Bond length (Angstrom)
0.000
0.005
0.010
0.015
0.020
0.025
0.030Br---CBr---NBr---OBr---H-CBr---H-NBr---H-O
2.0 3.0 4.0
0.0100
FClBrI
FIG. S4: Two scatter plots of the densities at the BCPs vs the bond lengths. The inset shows all
values, colored by the type of halogen. The main plot shows only the values corresponding to
Bromine, colored by the bond type. (Hence the green points in the inset are the same points as all
the points in the main plot.) The axes of the inset belong to the same properties as the main plot,
but the axis scales are logarithmic.
In Figure S4 the densities at the BCPs are plotted vs. the corresponding bond lengths. The main
plot only reports the results for the chosen case of bromine, for sake of clarity, as the breaking down
of this data per halogen to the different type of bonds (shown in the inset) follows a very similar
patterns for each halogen.
For the main plot, from left to right, there are first the short and high density Br· · ·H-O bonds
followed by the onset of the Br· · ·H-N and Br· · ·H-C bonds following the expected trend that
weaker bonds are longer. The two Br· · ·H-O bonds found at bond lengths higher than 3.5 Åare
bifurcations of the strong bonds at small bond lengths. This is a pattern that is more generally
found in HOIPs were hydrogen atoms form one strong H-bond and also participate in some much
weaker bonds.1,2
Although the majority of the bonds are H-bonds, there are 6 cations that form bonds with-
out hydrogen, namely the previously mentioned four cations with π bonds and hydrazinium and
S5

hydroxylammonium; the latter two have a lone pair of nitrogen and two lone pairs of oxygen re-
spectively. All these bonds are shown in Y-shaped symbols in Figure S4. These bonds can be seen
as chalcogen, pnictogen or π-anion binding.3
As can be seen in the inset plot of Figure S4, only some bonds with fluorine have densities
at the BCP that transcend outside the density range for weak interactions, thus illustrating their
strong bonding. Generally, the H-bonds in HOIPs have a strong electrostatic(ionic) component
due to the strong δ− on Fluorine and the negative charge of the cation2, making these exemplary
for charge-assisted H-bonds (CAHB) of the strongest type with the H-bond acceptor negatively
charged and the H-bond donor positively charged, i.e., CAHB(+,-).4
In the inset, the density vs. bond length is reported in the doubly log-scale. It shows that the
bond lengths increase via the trend F�Cl<Br<I. Brammer et al.5 found the same trend except that
they did not find a distinction between chlorine and bromine. This distinction is clearly distin-
guishable here, although being smaller than F�Cl and Br<I. The results follow a straight line in
the log-log plot, implying a strong inverse power law relation. We performed a linear regression
on these plots for the N-H· · ·X bonds for fluorine and iodine, the two halogens at the opposite ends
for bond lengths, giving the following equations:
ρN−H···XBCP,Fluorine = 0.36 ·BL−4.1
ρN−H···XBCP,Iodine = 2.72 ·BL−5.2
(1)
where BL is the bond length in Angstroms. The coefficients of determination, R2 where 0.985
and 0.980 for Fluorine and Iodine respectively. The larger prefactor in Iodine clearly illustrates
the generally larger bond lengths in Iodine, while the larger power in Iodine, indicates that the
density goes down faster when the bond lengths increase. Surprisingly, Gibbs et al. could not find
a physical interpretation for this observed power law.6
All the gradients of the density at the BCPs are positive, indicating that all considered bonds are
non-covalent and that electrostatic forces dominate.2,7 All the observed density values are between
0.00128 and 0.067 fully covering the values normally reported for weak interactions between 0.002
and 0.034. The density gradients are between 0.004 and 0.171 also covering the whole range of
reported gradient values reported for weak values, i.e., between 0.024 and 0.139.7 We found some
BCPs with densities and gradients that are even lower than the normally reported range for weak
interactions; these BCPs are very weak hydrogen bonding interactions with iodide and bromine at
distances around and larger than 4 Å.
S6
REFERENCES
1K. L. Svane, A. C. Forse, C. P. Grey, G. Kieslich, A. K. Cheetham, A. Walsh, and K. T. Butler,
“How Strong Is the Hydrogen Bond in Hybrid Perovskites?” J. Phys. Chem. Lett. 8, 6154–6159
(2017).2A. Varadwaj, P. R. Varadwaj, H. M. Marques, and K. Yamashita, “Halogen in Materials Design:
Revealing the Nature of Hydrogen Bonding and Other Non-Covalent Interactions in the Polymor-
phic Transformations of Methylammonium Lead Tribromide Perovskite,” Mater. Today Chem. 9,
1–16 (2018).3B. L. Schottel, H. T. Chifotides, and K. R. Dunbar, “Anion-Π Interactions,” Chem. Soc. Rev. 37,
68–83 (2008).4B. Bankiewicz, P. Matczak, and M. Palusiak, “Electron Density Characteristics in Bond Critical
Point (QTAIM) Versus Interaction Energy Components (SAPT): The Case of Charge-Assisted
Hydrogen Bonding,” J. Phys. Chem. A 116, 452–459 (2012).5L. Brammer, E. A. Bruton, and P. Sherwood, “Understanding the Behavior of Halogens as Hy-
drogen Bond Acceptors,” Crystal Growth & Design 1, 277–290 (2001).6G. V. Gibbs, F. C. Hill, M. B. Boisen, and R. T. Downs, “Power Law Relationships between
Bond Length, Bond Strength and Electron Density Distributions,” Phys. Chem. Miner. 25, 585–
590 (1998).7P. S. V. Kumar, V. Raghavendra, and V. Subramanian, “Bader’s Theory of Atoms in Molecules
(AIM) and Its Applications to Chemical Bonding,” J. Chem. Sci. 128, 1527–1536 (2016).
S7