mohammad rafiq khan and syed muhammad abdullah … · production of biodiesel in pakistan was...
TRANSCRIPT

IJISET - International Journal of Innovative Science, Engineering & Technology, Vol. 1 Issue 10, December 2014.
www.ijiset.com
ISSN 2348 – 7968
819
Production of Biodiesel in Pakistan
Mohammad Rafiq Khan and Syed Muhammad Abdullah Hassan Gardezi
Center of Policy and Environment, Lahore School of Economics, Lahore, Pakistan
ABSTRACT
The article presents the results of a study undertaken on economic viability of production of
biodiesel and its acceptability in Pakistan. The secondary data regarding the possibility of
production of biodiesel in Pakistan was collected by consultation of literature in different
libraries such as D.H.A Library, LUMS Library, and the Libraries and Teaching Resource
Centers of Lahore School of Economics. Secondary data was also collected from the material
published by concerned establishments and by visiting various websites on Internet. The data
gathered from different sources were processed to design alternative projects that were
subsequently appraised to determine their Benefit to Cost (B/C) Ratio , Net Present Value (NPV)
and Pay Back period (PBP). All the alternatives turned out to be technically sound and
economically viable as B/C all evaluations was more than one, NPV was positive and PBP was
relatively small.
INTRODUCTION
Biofuels are fuels that are produced from biomass and include ethanol, biodiesel, methanol, etc.
These are source of ‘fuel’ for several industries in solid, liquid or gaseous forms. The main
attraction in use of biofuel is that it is ‘environment friendly’ and ‘cost effectiveness. For
instance, by using bio fuels we reduce Carbon emissions (smoke, CO, CO2, etc.) emissions which
are harmful for the environment. They do not add carbon to the atmosphere to increase its
concentration beyond the permitted level.
Research on biodiesel is being conducted extensively both in the world since Rudolf Diesel
designed his prototype diesel engine nearly a century ago. He ran it on peanut oil and envisioned
that diesel engines would operate on a variety of vegetable oils. When petroleum-based diesel

820
fuel hit the markets, it was cheap, reasonably efficient, and readily available, and therefore
quickly became the diesel fuel of choice. In the mid 1970s, fuel shortages enhanced interest in
diversifying the fuel resources, and thus prompted action in development of biodiesel as an
alternative to petroleum diesel. At present, the biodiesel use is growing rapidly with additional
production capacity available to quickly accommodate further growth. USA is an important
example where producers use mostly soy oil and recycled cooking oils. The research for new
resources is also simultaneously in progress and in constant review. A few pieces of work are
quoted below.
Schumacher and Howell [1] (1994) examined the effect of biodiesel and biodiesel blends on the
life of the injection pump and related fuel system components. They concluded that the use of
biodiesel should be considered to prevent premature failure of injection pump components.
Schumacher, et al [2] (1996) provided an overview of the need for a systematic and sustained
approach to conduct biodiesel research. The main variables the writer focused upon were
biodiesel, biodiesel blends, diesel, and material compatibility. Schumacher [3] (1997) collected
the qualitative and quantitative biodiesel fueling performance and operational data from urban
mass transit buses and also collected other than that engine exhaust emission data to provide
input into a comprehensive report on alternative fuels. Schumacher and Gerpen [4] (1998)
reviewed the real world data collected during the years 1991 – 1995 concerning the fueling of
diesel powered vehicles with 100% biodiesel and blends of biodiesel with diesel to identify the
recurring issues arising from research that must be resolved before biodiesel could be
commercialized on a large scale. Schumacher et al,[5] (1999) evaluated the use of the SVO
additive to enhance the cold weather functionality of biodiesel. They concluded that adding the
SVO product appeared to increase the centistokes value of the biodiesel blends tested. Fangrui, et
al [6](1999) reviewed the status of biodiesel and described how biodiesel had become more
attractive than before, and how the cost of production was playing a negative role in the
commercialization of bio diesel. Ericsson and Nilsson [7](2004) collected key data related to the
Swedish biofuel import and analyzed it from the view of Swedish demand and supply in the
Baltic countries as well as supply from Germany or the Netherlands. The authors concluded that
the Swedish imports of biofuel illustrated a situation that based on a set of different driving
forces working in parallel between Sweden and the exporting countries. Similar studies were

821
conducted by Domac and Richards,Segon [8] (2005) and Kampman, and Croezen [9](2005) on
biomass utilization, bio energy technologies, their market share and research interests varying
between different countries. Meyer and Thompson [10] (2007) stated that biofuels already held a
prominent position in 2007 farm bill debate. The analysis sought contributed to literature in wo
ways. It provided perspective on the degree of biofuels dependence on the tax credit and tariffs,
and described the impact of discontinuing biofuel subsidies and ethanol import tariff on
commodity markets, government costs, and farm income.
Pakistan, due to biodiesal being environment friendly and its likelihood of production from the
biomass of the solid waste of different origins, has also joined this hunt for biofuels and as it
seems more appropriate to produce biodiesel locally instead of importing it from abroad. As the
world oil prices are constantly rising, introducing biodiesel in Pakistan would definitely add
value to the Pakistan economy. Thus the aim of the work reported here was to look into whether
it is technically and economically possible to produce biodiesel in Pakistan and substitute it as an
alternative fuel under the import substitution policy. The objectives of work were as follows:
1. Computation of import statistics of Biofuels.
2. Identification of scale of production.
3. Planning and designing of a plant for production of biodiesel in Lahore (Pakistan)
4. Evaluation to judge the project’s technical soundness and economic viabilility
MATERIALS AND METHODS
There are primarily three types of biofuel: biogas, biomass and biodiesel. Here the choice of
enquiry was biodiesel that is a clean burning alternative fuel, produced from domestically grown,
renewable resources. It has no sulfur like impurities in it. However, fossil diesel can be added to
it to make a blend of biodiesel. Biodiesel process applied to produce biodiesel on industrial level
is called ‘Transestrification’ because biodiesel is manufactured by reacting vegetable oils with
methanol, or ethanol.

822
Biodiesel is methyl (ethyl) ester derived from esterification of vegetable oils. The process of
transesterification is illustrated with the chemical equation as under:
To produce it, it methanol ( or ethanol) is added to vegetable oil in ratio 1:9 together with a
small amount of basic or acidic catalyst and the mix is processed in a reactor (BIOSTRIM-Fig 1)
Manufacturing of biodiesel requires 3 ingredients: feedstock (including) all vegetable oils, new
or used, and animal fats, methanol and NaOH (Caustic soda) or KOH (Caustic potash). As used
cooking oil or animal fat is the cheapest feedstock source, it is used as raw material. In most
cases, a restaurant will be happy to simply provide their used oil, since they would otherwise
have to pay to dispose it off. . However, there is a hierarchy of preference for used vegetable oil
a under:.
1. Only vegetables (fries, tempura, etc.)
2. Fish
3. Chicken
4. Beef
5. Tallow
The production line is shown with the help of the flow sheet diagram of the process and sub-
processes outlined in the form of notes.
823
Biodiesel Product
Water
Water
Acid
Free Fatty Acids
Glycerol Methanol Water
Storage
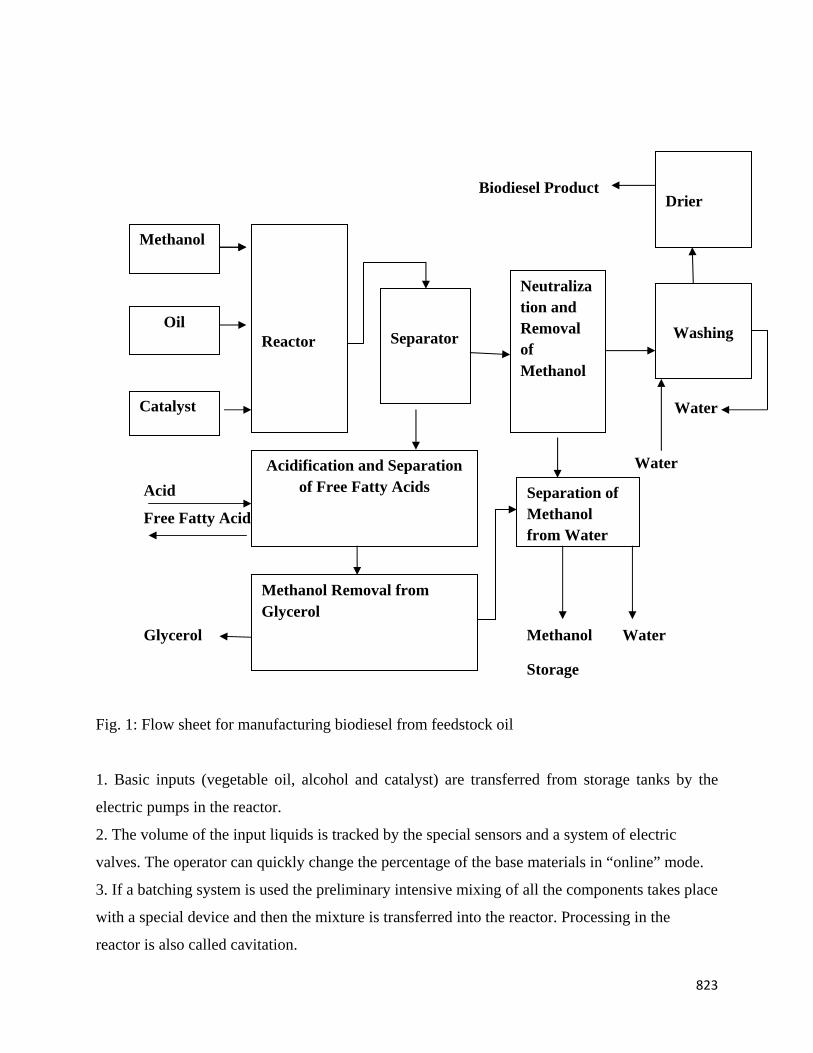
Fig. 1: Flow sheet for manufacturing biodiesel from feedstock oil
1. Basic inputs (vegetable oil, alcohol and catalyst) are transferred from storage tanks by the
electric pumps in the reactor.
2. The volume of the input liquids is tracked by the special sensors and a system of electric
valves. The operator can quickly change the percentage of the base materials in “online” mode.
3. If a batching system is used the preliminary intensive mixing of all the components takes place
with a special device and then the mixture is transferred into the reactor. Processing in the
reactor is also called cavitation.
Methanol
Catalyst
Acidification and Separation of Free Fatty Acids
Oil
Separator
Reactor
Methanol Removal from Glycerol
Washing
Neutralization and Removal of Methanol
Separation of Methanol from Water
Drier

824
4. After cavitation processing, the mixture is put into a separation column through a special
stabilizer preventing mixing of the newly input mixture with the layers which have already been
separated.
5. Separated biodiesel fuel goes up the column and is tracked by a sensor.
6. Separated glycerin goes down the column and is also tracked by a sensor.
7. The ready biodiesel fuel and glycerin discharge is carried out through electric valves operated
by sensors which track both the quality and volume of the product.
The output products of such reaction are biodiesel and technical glycerol. Both products are
highly in demand in today’s biofuel market. Furthermore, glycerol can be used for heating
boilers due to its excellent high-energy value and also finds an extensive use in medicine.
The characteristics of biodiesel to be produced are computed in Table 1:
Table 1: Characteristics of biodiesel to be produced
Parameter ASTM EN 14214D-6751
sample of biodiesel From Biostrim
Methyl ester content - >96,5 97 Density (at 15°С) - 860-900 885 Viscosity (at 40°С) 1,9-6,0 3,5-5,0 4,67 Flashpoint, °С > >130 >120 130 Sulfur, mg/kg <0,05 (%) <10 9 Cetane number >47 >51 51 Sulfated ash, % (m/m)
<0,02 <0,02 0,0078
Water , % <0,05 <0,05 absent Cu-Corros. <No.3 Class 1 passed Acid value, mgКОН/g - <0,2 0,25 Methanol, % (m/m - <0,8 0,7 Monoglyceride, % (m/m
- <0,2 0,2
Diglyceride, % (m/m) - <0,2 0,2 Triglyceride, % (m/m)
<0,02 <0,02 0,05
Free glycerinl, % (m/m)
<0.24 <0,25 0,25
Total glycerol content, % (m/m)
- <120 61
Iodine number <0,001% <10 6,2 Phosphor, mg/kg - <5,0 5,0 Group I metals (Na,K) - <5,0 0,8 Group II metals (Ca, Mg
- 0,3 0,014
Collection of Data
As there was no establishment producing biodiesel in or near Lahore, the work was totally based
on secondary data. There are a number of concerns who are exporting used cooking oils even the
one for manufacture of biodiesel which can be contacted through Alibaba.com through Internet.

825
One of these suppliers claims to be capable of supplying 20,000 tons per day for export
anywhere in the world at the cost of $250 to 300 per metric ton. Due to the used cooking oil
being illegal for reuse, it is either thrown in the drains by the frying business or reused violating
the law of land, it can be directly collected even free of cost from frying businesses. As here
projection is at the scale 1000 kg per hour (24 metric tons per day), much more than the required
raw material is available in Pakistan to safely install biodiesel industry in Pakistan. Worst come
worst it can be supplied at this scale just by one supplier of Pakistan capable of supplying
20,000used cooking oil for biodiesel per day at the cost of $ 250 to 300 per metric ton
(http://www.alibaba.com/product-detail/Used-cooking-oil-for-Biodiesel_157484137.html). Here,
of course, the project has been based on free pf cost collected oil from the frying businesses.
Processing of the Data
The collected data was processed after designing the project at an industrial scale and subsequent
cost analysis was carried out by the application of discounted cash flow techniques followed by
Asian Development Bank (2001 and 2003,). The methodology of cost analysis is given below.
Interpretation of Results
The results obtained in the form of Benefit to Cost Ratio (BSR), Net Present Value (NPV) and
Payback Period was interpreted on the basis of the criteria of acceptability of the projects under
appraisal. If BCR is more than 1, NPV is positive and PBP is small, the project is accepted.
Otherwise, it is rejected provided it is not a priority project falling in the category of a social
obligation.
COST ANALYSIS
The project analysis was based on the project assumption given below (ADB, 2001 and 2003)
Project life: 10 years
Base year: 2008
Financial Year: July 1 to June 30
Discount rate: 10%
Different cost components responsible for adding value to both expenditure and return steams
are outlined below.
Initial Fixed Investment
It included cost of land, building, machinery, equipment etc.
826
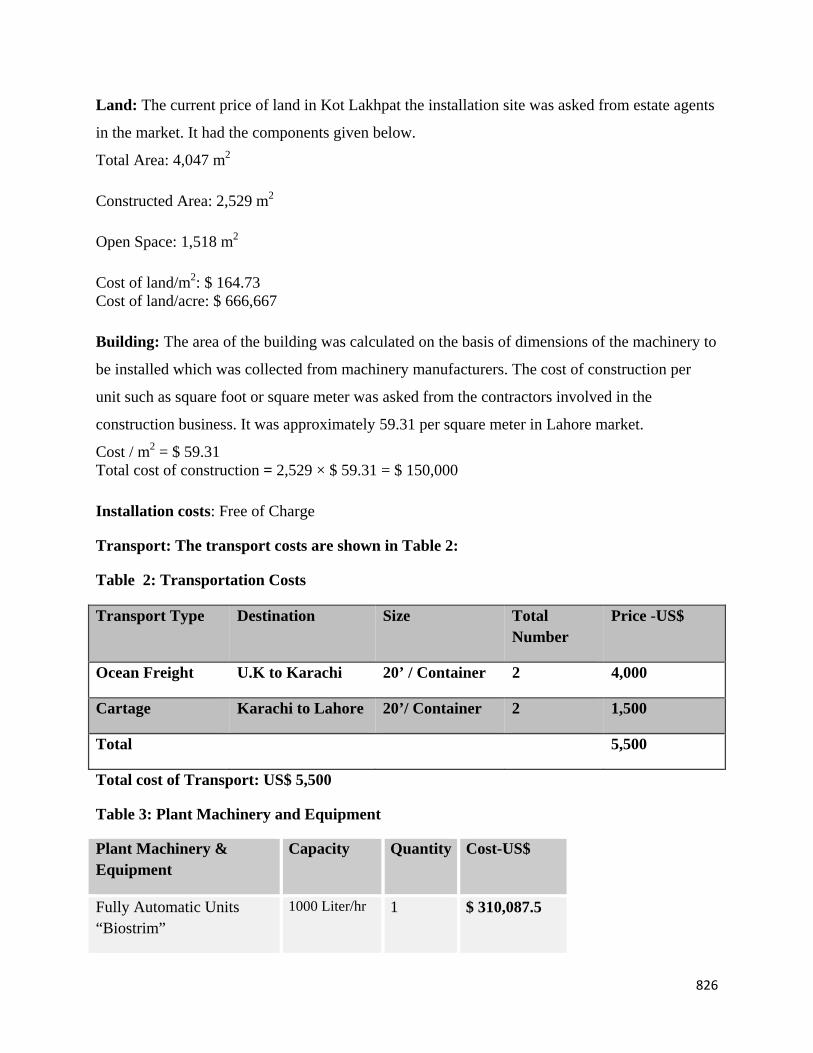
Land: The current price of land in Kot Lakhpat the installation site was asked from estate agents
in the market. It had the components given below.
Total Area: 4,047 m2
Constructed Area: 2,529 m2
Open Space: 1,518 m2
Cost of land/m2: $ 164.73 Cost of land/acre: $ 666,667
Building: The area of the building was calculated on the basis of dimensions of the machinery to
be installed which was collected from machinery manufacturers. The cost of construction per
unit such as square foot or square meter was asked from the contractors involved in the
construction business. It was approximately 59.31 per square meter in Lahore market.
Cost / m2 = $ 59.31 Total cost of construction = 2,529 × $ 59.31 = $ 150,000
Installation costs: Free of Charge
Transport: The transport costs are shown in Table 2:
Table 2: Transportation Costs
Transport Type Destination Size Total Number
Price -US$
Ocean Freight U.K to Karachi 20’ / Container 2 4,000
Cartage Karachi to Lahore 20’/ Container 2 1,500
Total 5,500
Total cost of Transport: US$ 5,500
Table 3: Plant Machinery and Equipment
Plant Machinery & Equipment
Capacity Quantity Cost-US$
Fully Automatic Units “Biostrim”
1000 Liter/hr 1 $ 310,087.5
827
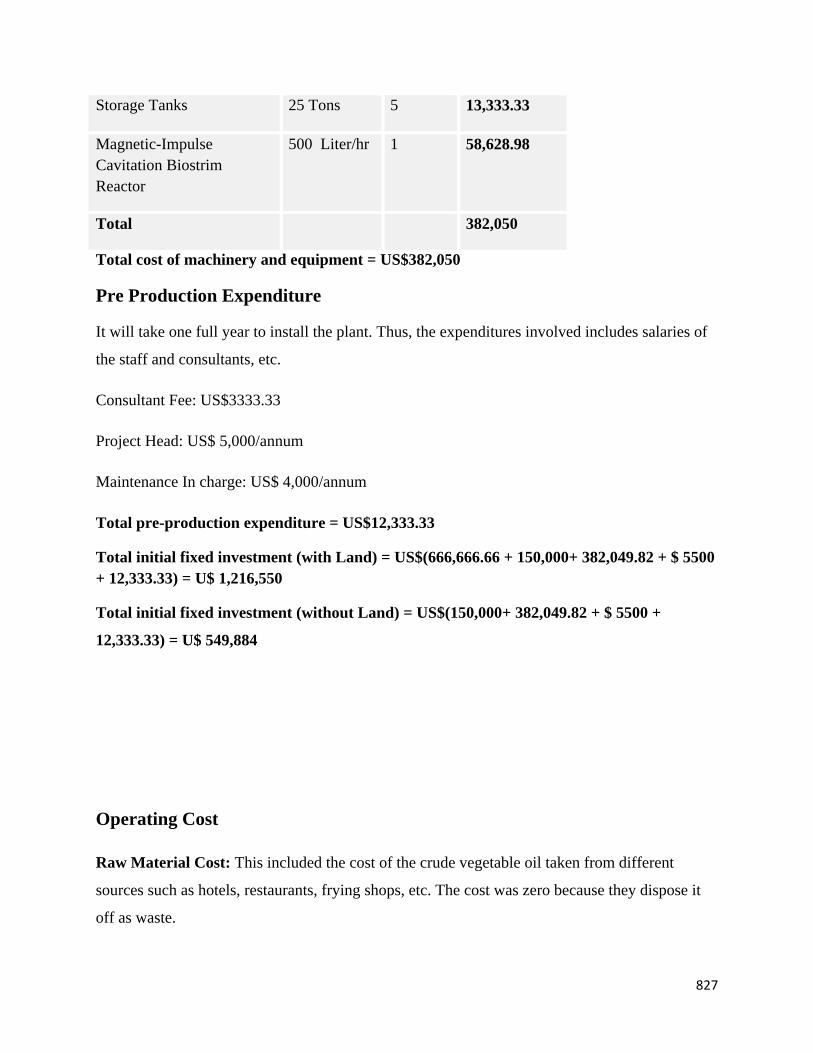
Storage Tanks 25 Tons 5 13,333.33
Magnetic-Impulse Cavitation Biostrim Reactor
500 Liter/hr 1 58,628.98
Total 382,050
Total cost of machinery and equipment = US$382,050
Pre Production Expenditure
It will take one full year to install the plant. Thus, the expenditures involved includes salaries of
the staff and consultants, etc.
Consultant Fee: US$3333.33
Project Head: US$ 5,000/annum
Maintenance In charge: US$ 4,000/annum
Total pre-production expenditure = US$12,333.33
Total initial fixed investment (with Land) = US$(666,666.66 + 150,000+ 382,049.82 + $ 5500 + 12,333.33) = U$ 1,216,550
Total initial fixed investment (without Land) = US$(150,000+ 382,049.82 + $ 5500 +
12,333.33) = U$ 549,884
Operating Cost
Raw Material Cost: This included the cost of the crude vegetable oil taken from different
sources such as hotels, restaurants, frying shops, etc. The cost was zero because they dispose it
off as waste.
828
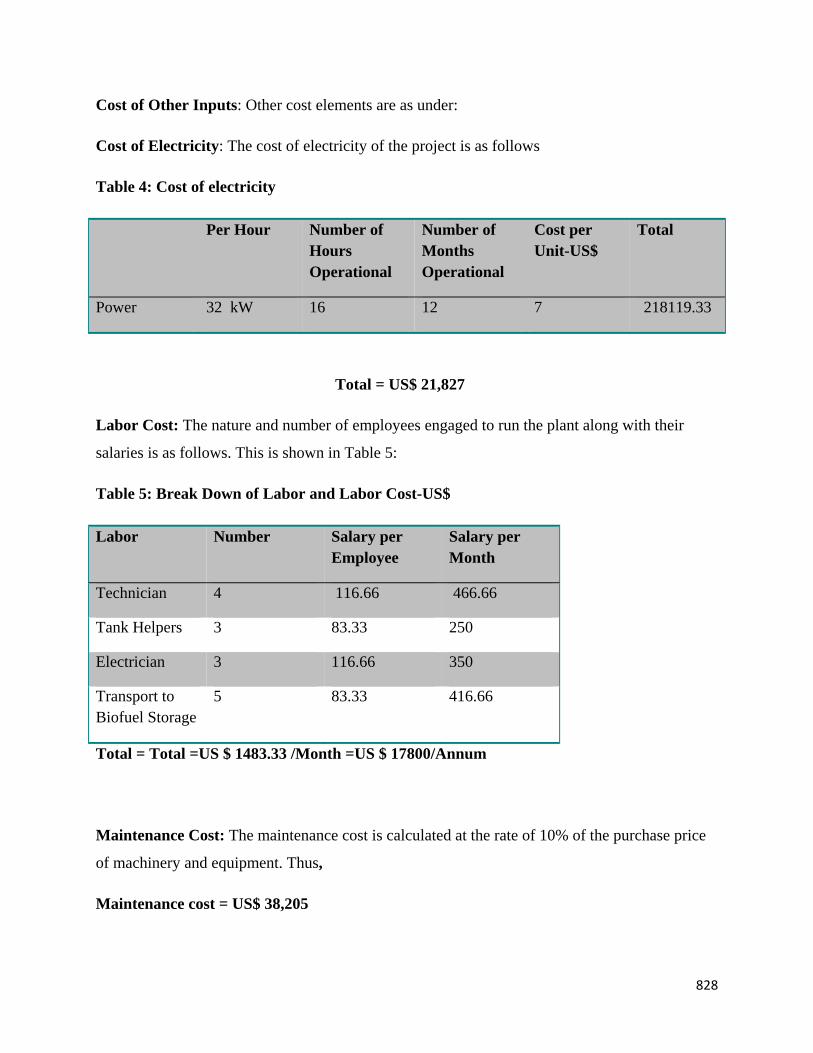
Cost of Other Inputs: Other cost elements are as under:
Cost of Electricity: The cost of electricity of the project is as follows
Table 4: Cost of electricity
Per Hour Number of Hours Operational
Number of Months Operational
Cost per Unit-US$
Total
Power 32 kW 16 12 7 218119.33
Total = US$ 21,827
Labor Cost: The nature and number of employees engaged to run the plant along with their
salaries is as follows. This is shown in Table 5:
Table 5: Break Down of Labor and Labor Cost-US$
Labor Number Salary per Employee
Salary per Month
Technician 4 116.66 466.66
Tank Helpers 3 83.33 250
Electrician 3 116.66 350
Transport to Biofuel Storage
5 83.33 416.66
Total = Total =US $ 1483.33 /Month =US $ 17800/Annum
Maintenance Cost: The maintenance cost is calculated at the rate of 10% of the purchase price
of machinery and equipment. Thus,
Maintenance cost = US$ 38,205

829
Depreciation: Both plant and machinery was depreciated on straight line basis at the rate of 10%
of the purchase price.
Depreciation Cost = US$ 38,205
US$ Total operating cost/Annum = US$ (17,800+38,205+ 38,205 + 21,802.66) = US$ 116012.66
Expenditures in the Base Year
Initial Fixed Investment = US$ 1,216,550
Operating cost in base year = Nil
Total Expenditure/ Cash outlay = US$ 1,216,550
Expenditures in Future Years
Apart from the initial investment, no other capital expenditure is assumed over the project life
under consideration. The operating cost in the base year (2008-2009) is nil. However, it is
subject to alter with changes in labor costs, operating capacity, etc. the optimal plant capacity is
said to be 80% of its plant capacity and does not intend to increase in near future. After every
three years, it is predicted that the salaries of labor are subject to an increase of 15% every year.
Also there is a 10% increase in cost of utilities per annum.
The operating cost is calculated as below:
Years Calculation (Dollars)
Operating cost = Cost of [(Labor) + (Maintenance & depreciation)+(Utilities and Chemicals)
Operating Cost

830
Table 6: Operating cost over 10 years
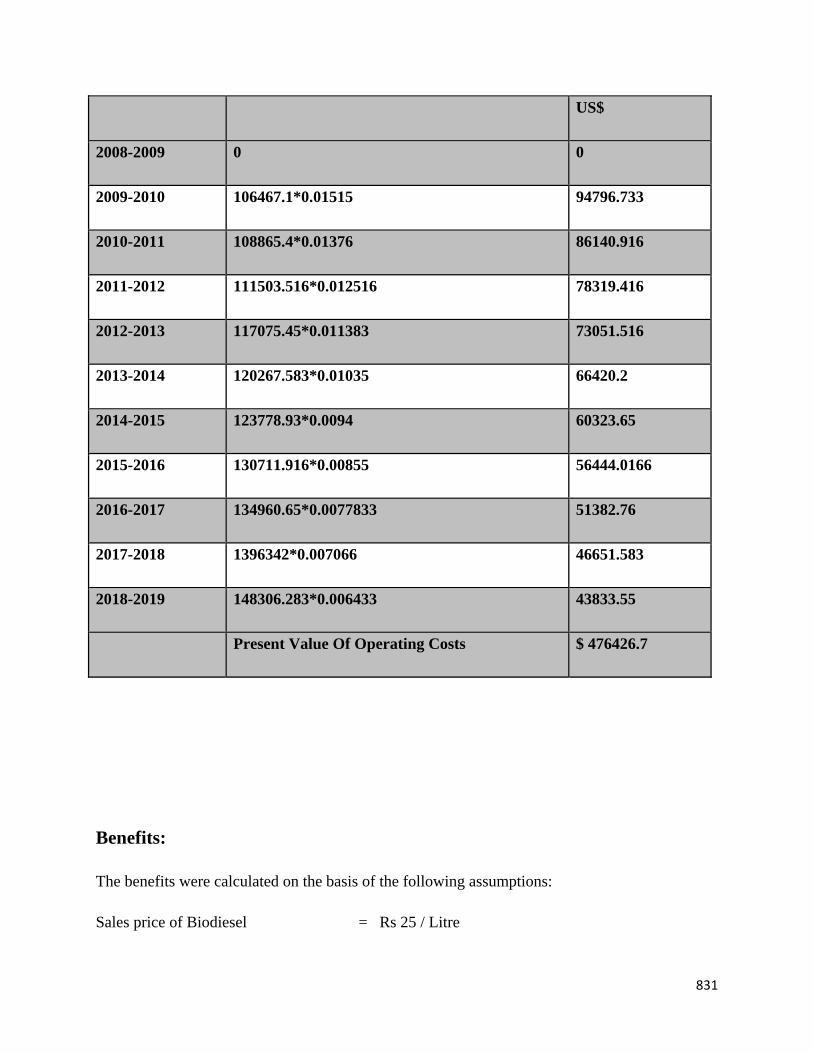
Table 6: Total Operating Costs Discounted at 10% to the base year
Years Calculation Operating Cost –
2008-2009 0 0
2009-2010 17800+ 64684.16+ 23982.9 106467.1
2010-2011 17800+ 64684.16+26381.23 108865.4
2011-2012 17800+ 64684.16+29019.35 111503.51
2012-2013 20470+ 64684.16+31921.283 117075.45
2013-2014 20470+ 64684.16+ 35113.416 120267.583
2014-2015 20470+ 64684.16+ 38624.76 123778.93
2015-2016 23540.5 + 64684.16+ 42487.25 130711.91
2016-2017 23540.5 + 64684.16+ 46735.983 134960.65
2017-2018 23540.5 + 64684.16+ 51409.583 139634.25
2018-2019 27071.56 + 64684.16+ 56550.55 148306.283
831
US$
2008-2009 0 0
2009-2010 106467.1*0.01515 94796.733
2010-2011 108865.4*0.01376 86140.916
2011-2012 111503.516*0.012516 78319.416
2012-2013 117075.45*0.011383 73051.516
2013-2014 120267.583*0.01035 66420.2
2014-2015 123778.93*0.0094 60323.65
2015-2016 130711.916*0.00855 56444.0166
2016-2017 134960.65*0.0077833 51382.76
2017-2018 1396342*0.007066 46651.583
2018-2019 148306.283*0.006433 43833.55
Present Value Of Operating Costs $ 476426.7
Benefits:
The benefits were calculated on the basis of the following assumptions:
Sales price of Biodiesel = Rs 25 / Litre
832
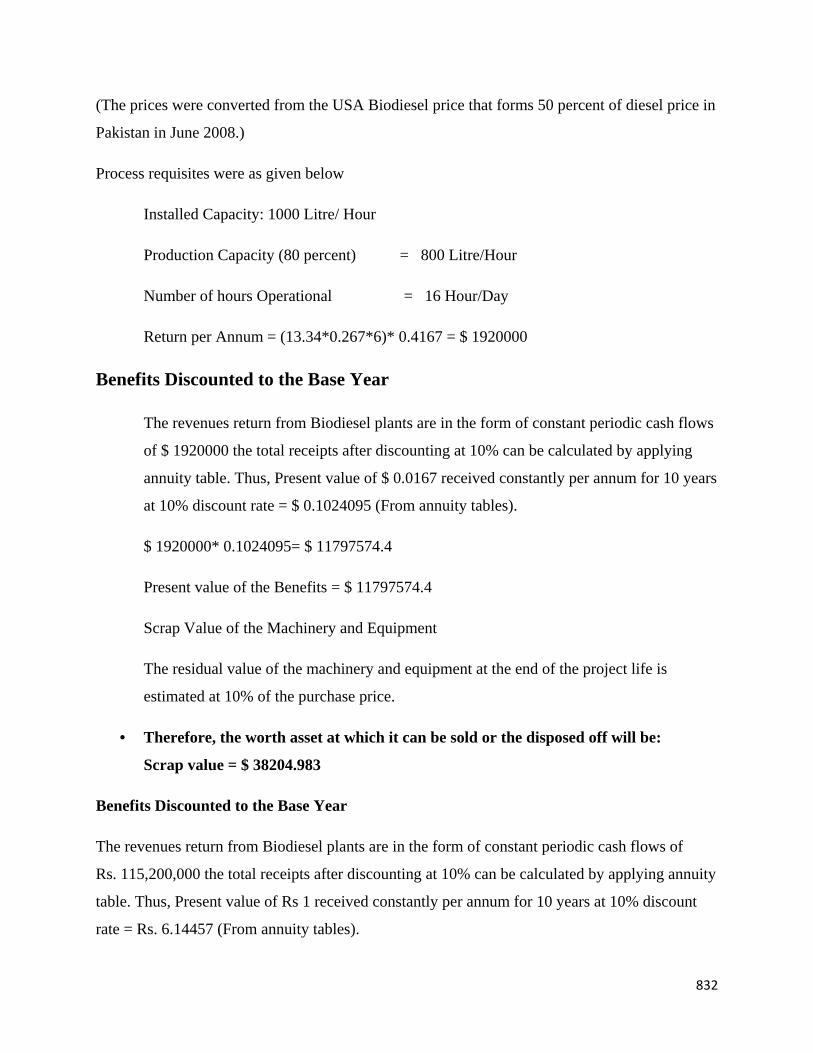
(The prices were converted from the USA Biodiesel price that forms 50 percent of diesel price in
Pakistan in June 2008.)
Process requisites were as given below
Installed Capacity: 1000 Litre/ Hour
Production Capacity (80 percent) = 800 Litre/Hour
Number of hours Operational = 16 Hour/Day
Return per Annum = (13.34*0.267*6)* 0.4167 = $ 1920000
Benefits Discounted to the Base Year
The revenues return from Biodiesel plants are in the form of constant periodic cash flows
of $ 1920000 the total receipts after discounting at 10% can be calculated by applying
annuity table. Thus, Present value of $ 0.0167 received constantly per annum for 10 years
at 10% discount rate = $ 0.1024095 (From annuity tables).
$ 1920000* 0.1024095= $ 11797574.4
Present value of the Benefits = $ 11797574.4
Scrap Value of the Machinery and Equipment
The residual value of the machinery and equipment at the end of the project life is
estimated at 10% of the purchase price.
• Therefore, the worth asset at which it can be sold or the disposed off will be:
Scrap value = $ 38204.983
Benefits Discounted to the Base Year
The revenues return from Biodiesel plants are in the form of constant periodic cash flows of
Rs. 115,200,000 the total receipts after discounting at 10% can be calculated by applying annuity
table. Thus, Present value of Rs 1 received constantly per annum for 10 years at 10% discount
rate = Rs. 6.14457 (From annuity tables).
833
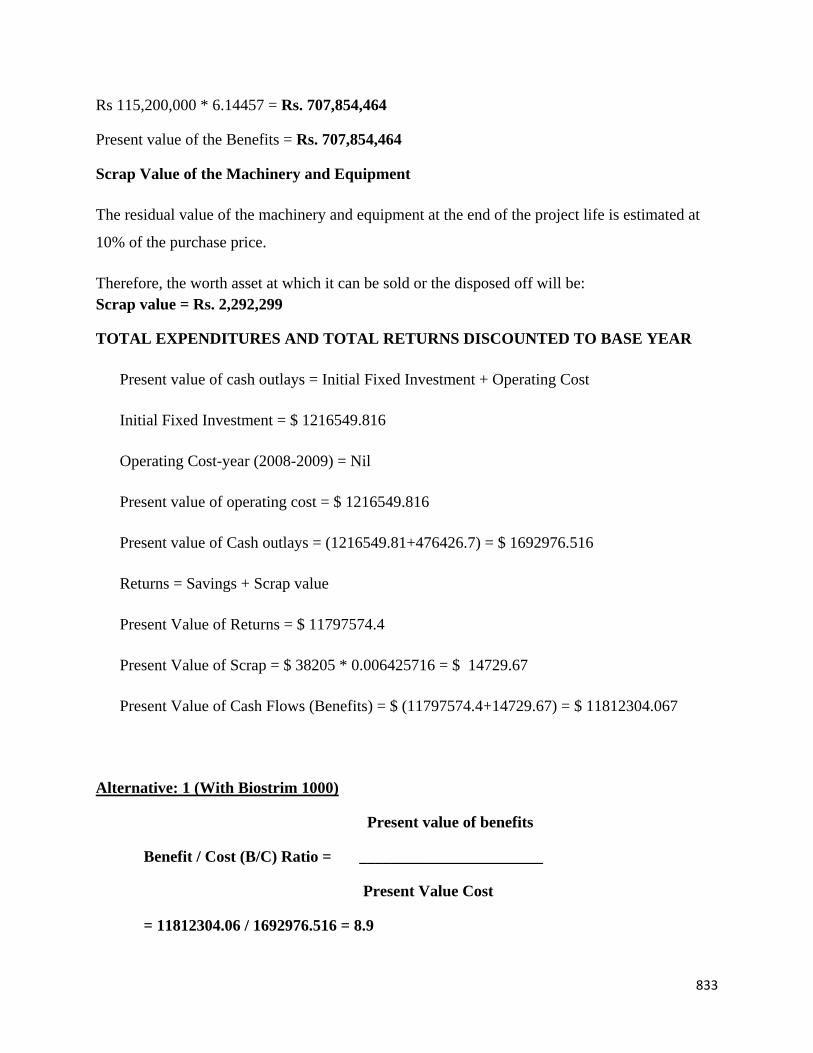
Rs 115,200,000 * 6.14457 = Rs. 707,854,464
Present value of the Benefits = Rs. 707,854,464
Scrap Value of the Machinery and Equipment
The residual value of the machinery and equipment at the end of the project life is estimated at
10% of the purchase price.
Therefore, the worth asset at which it can be sold or the disposed off will be: Scrap value = Rs. 2,292,299
TOTAL EXPENDITURES AND TOTAL RETURNS DISCOUNTED TO BASE YEAR
Present value of cash outlays = Initial Fixed Investment + Operating Cost
Initial Fixed Investment = $ 1216549.816
Operating Cost-year (2008-2009) = Nil
Present value of operating cost = $ 1216549.816
Present value of Cash outlays = (1216549.81+476426.7) = $ 1692976.516
Returns = Savings + Scrap value
Present Value of Returns = $ 11797574.4
Present Value of Scrap = $ 38205 * 0.006425716 = $ 14729.67
Present Value of Cash Flows (Benefits) = $ (11797574.4+14729.67) = $ 11812304.067
Alternative: 1 (With Biostrim 1000)
Present value of benefits
Benefit / Cost (B/C) Ratio = _______________________
Present Value Cost
= 11812304.06 / 1692976.516 = 8.9
834
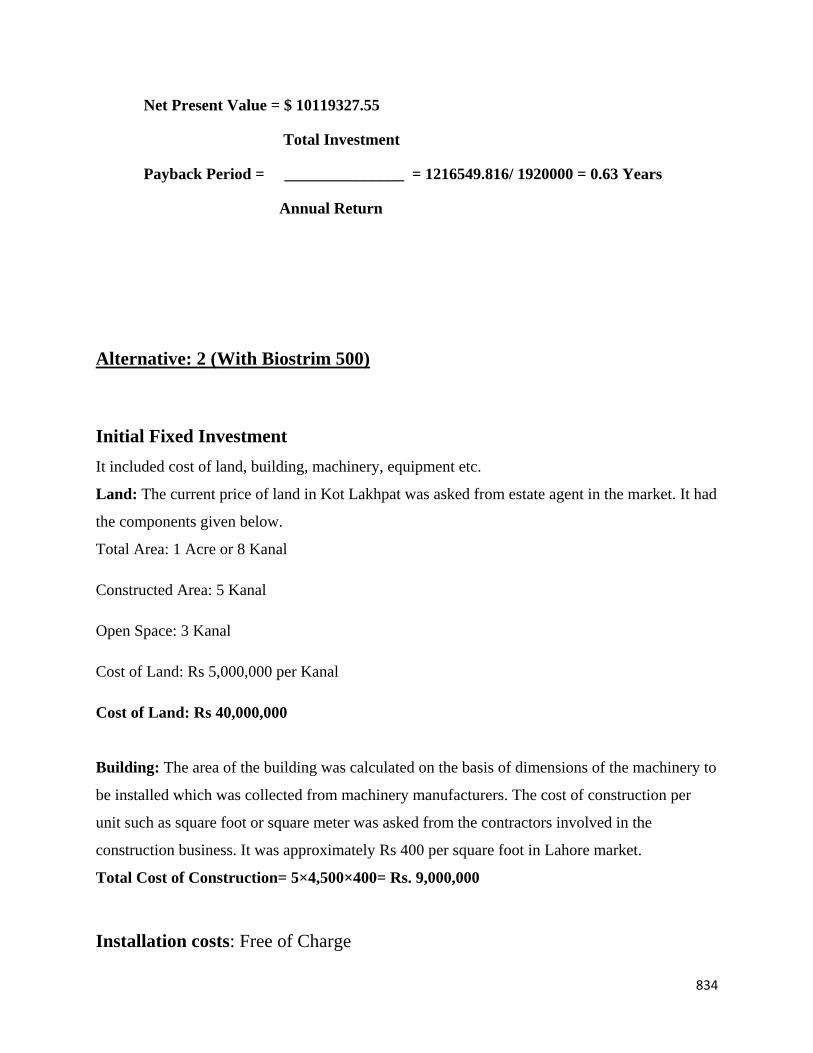
Net Present Value = $ 10119327.55
Total Investment
Payback Period = _______________ = 1216549.816/ 1920000 = 0.63 Years
Annual Return
Alternative: 2 (With Biostrim 500)
Initial Fixed Investment
It included cost of land, building, machinery, equipment etc.
Land: The current price of land in Kot Lakhpat was asked from estate agent in the market. It had
the components given below.
Total Area: 1 Acre or 8 Kanal
Constructed Area: 5 Kanal
Open Space: 3 Kanal
Cost of Land: Rs 5,000,000 per Kanal
Cost of Land: Rs 40,000,000
Building: The area of the building was calculated on the basis of dimensions of the machinery to
be installed which was collected from machinery manufacturers. The cost of construction per
unit such as square foot or square meter was asked from the contractors involved in the
construction business. It was approximately Rs 400 per square foot in Lahore market.
Total Cost of Construction= 5×4,500×400= Rs. 9,000,000
Installation costs: Free of Charge

835
Transport:
Table 8: Transportation Costs
Transport Type Destination Size Total Number
Price
Ocean Freight U.K to Karachi 20’ / Container 2 Rs. 240,000
Cartage Karachi to Lahore 20’/ Container 2 Rs. 90,000
Total Rs. 330,000
Total cost of Transport: Rs. 330,000
Table 9: Plant Machinery and Equipment
Plant Machinery & Equipment
Capacity Quantity Cost
Fully Automatic Units “Biostrim”
500 Liter/hr 1 Rs.12,512,127
Storage Tanks 25 Tons 5 Rs. 800,000
Magnetic-Impulse Cavitation Biostrim Reactor
500 Liter/hr 1 Rs. 3,517,739
Total Rs.16,829,866
Total cost of machinery and equipment = Rs. 16,829,866
Pre Production Expenditure:
It will take one full year to install the plant. Thus, the expenditures involved includes salaries of
the staff and consultants, etc.
Consultant Fee: Rs.200, 000/annum
Project Head: Rs.300, 000/annum
Maintenance In charge: Rs.240, 000/annum
836
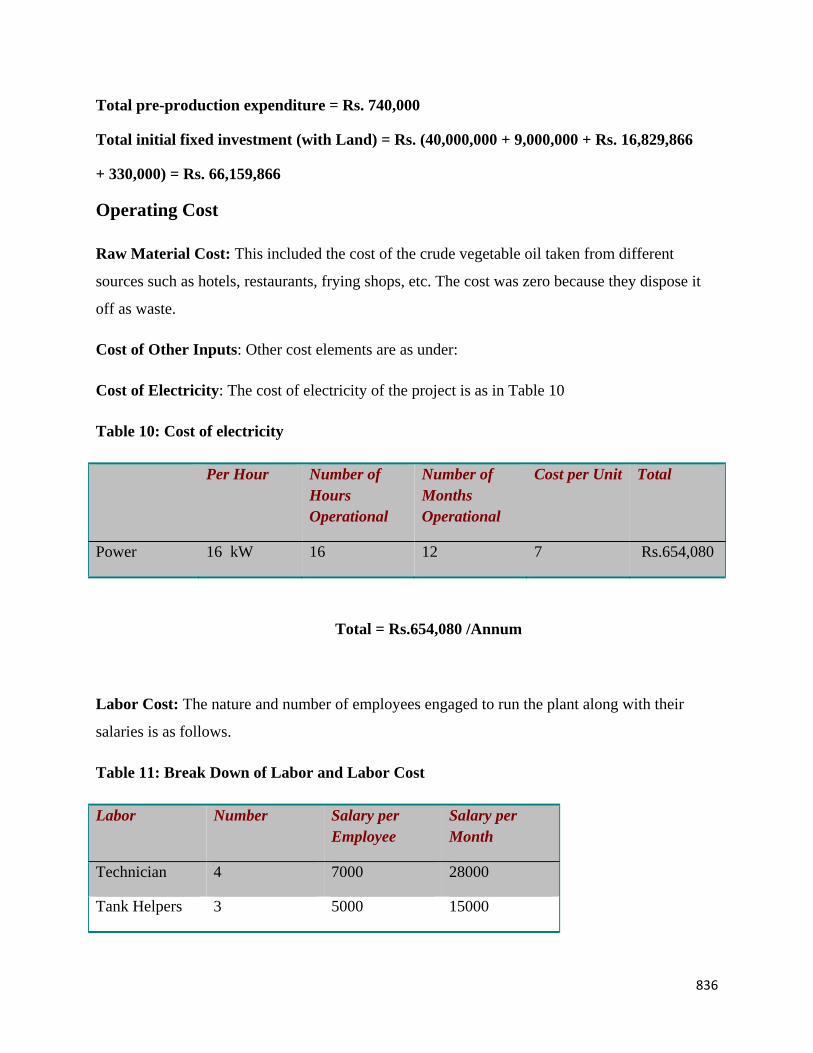
Total pre-production expenditure = Rs. 740,000
Total initial fixed investment (with Land) = Rs. (40,000,000 + 9,000,000 + Rs. 16,829,866
+ 330,000) = Rs. 66,159,866
Operating Cost
Raw Material Cost: This included the cost of the crude vegetable oil taken from different
sources such as hotels, restaurants, frying shops, etc. The cost was zero because they dispose it
off as waste.
Cost of Other Inputs: Other cost elements are as under:
Cost of Electricity: The cost of electricity of the project is as in Table 10
Table 10: Cost of electricity
Per Hour Number of Hours Operational
Number of Months Operational
Cost per Unit Total
Power 16 kW 16 12 7 Rs.654,080
Total = Rs.654,080 /Annum
Labor Cost: The nature and number of employees engaged to run the plant along with their
salaries is as follows.
Table 11: Break Down of Labor and Labor Cost
Labor Number Salary per Employee
Salary per Month
Technician 4 7000 28000
Tank Helpers 3 5000 15000
837
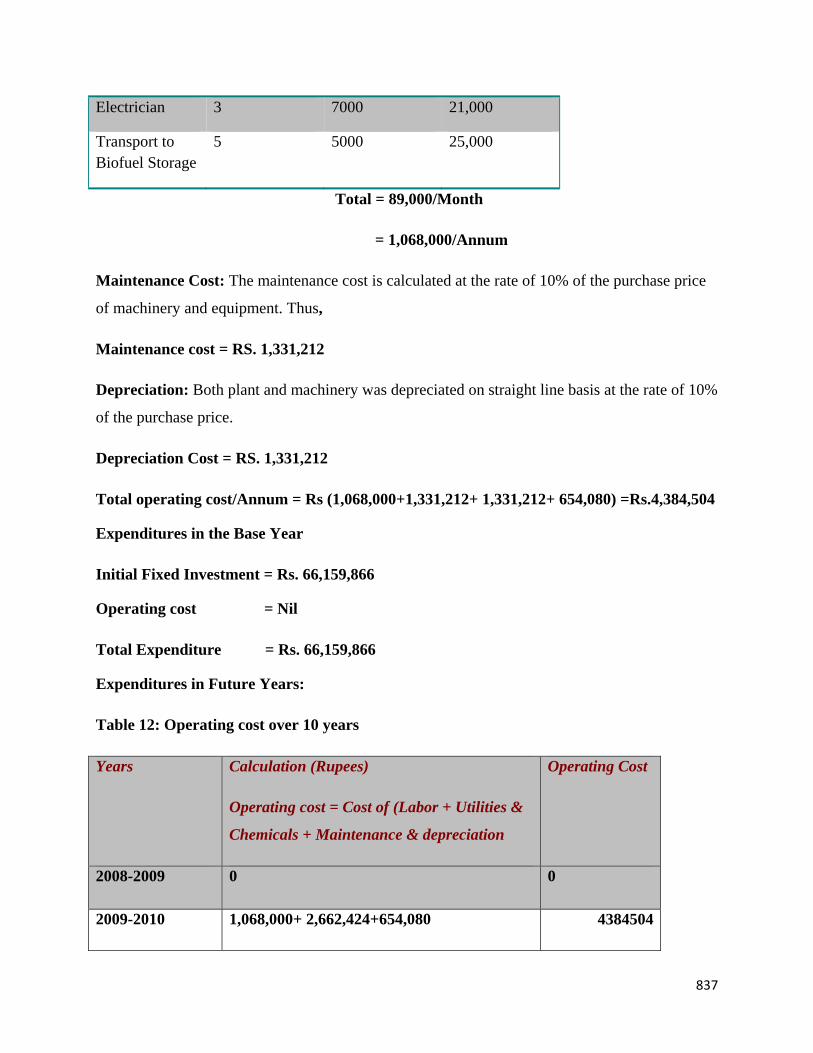
Electrician 3 7000 21,000
Transport to Biofuel Storage
5 5000 25,000
Total = 89,000/Month
= 1,068,000/Annum
Maintenance Cost: The maintenance cost is calculated at the rate of 10% of the purchase price
of machinery and equipment. Thus,
Maintenance cost = RS. 1,331,212
Depreciation: Both plant and machinery was depreciated on straight line basis at the rate of 10%
of the purchase price.
Depreciation Cost = RS. 1,331,212
Total operating cost/Annum = Rs (1,068,000+1,331,212+ 1,331,212+ 654,080) =Rs.4,384,504
Expenditures in the Base Year
Initial Fixed Investment = Rs. 66,159,866
Operating cost = Nil
Total Expenditure = Rs. 66,159,866
Expenditures in Future Years:
Table 12: Operating cost over 10 years
Years Calculation (Rupees)
Operating cost = Cost of (Labor + Utilities &
Chemicals + Maintenance & depreciation
Operating Cost
2008-2009 0 0
2009-2010 1,068,000+ 2,662,424+654,080 4384504

838
2010-2011 1,068,000+ 2,662,424+719,488 4449912
2011-2012 1,068,000+ 2,662,424+791,437 4521861
2012-2013 1,228,200+ 2,662,424+870,581 4761205
2013-2014 1,228,200+ 2,662,424+957,639 4848263
2014-2015 1,228,200+ 2,662,424+ 1,053,403 4944027
2015-2016 1,412,430 + 2,662,424+ 1,158,743 5233597
2016-2017 1,412,430 + 2,662,424+ 1,274,617 5349471
2017-2018 1,412,430 + 2,662,424+1,402,079 5476933
2018-2019 1,624,294 + 2,662,424+1,542,287 5829005
839
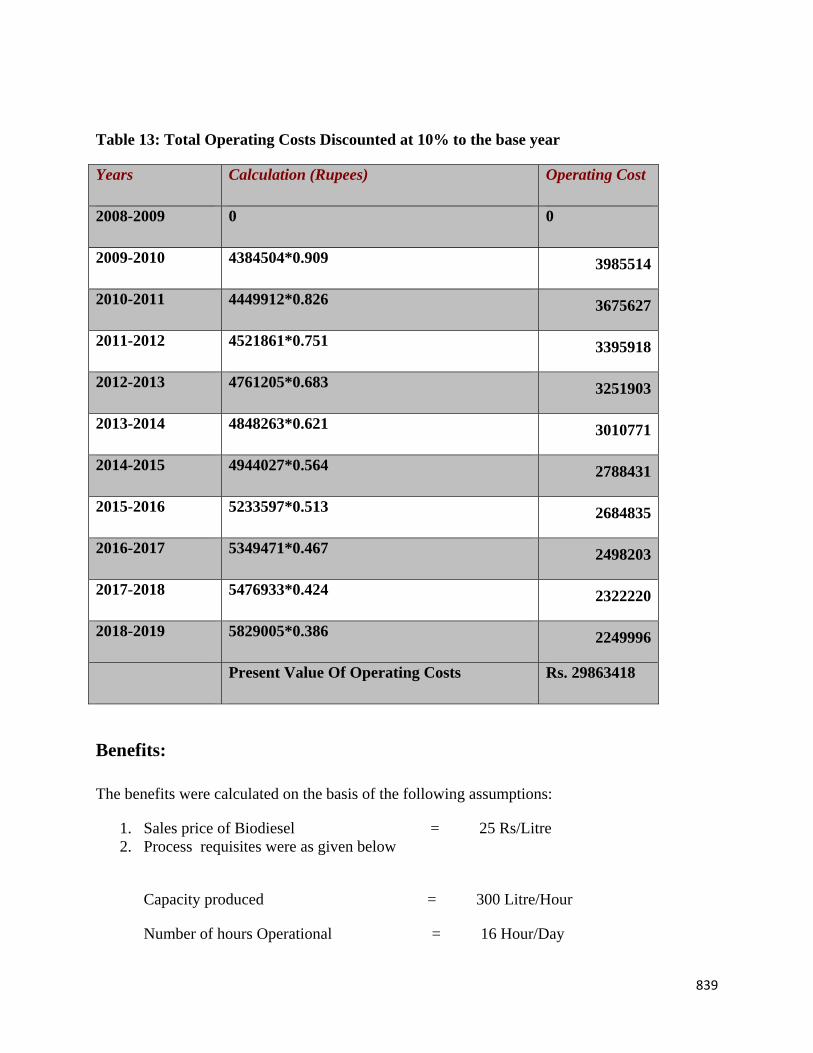
Table 13: Total Operating Costs Discounted at 10% to the base year
Years Calculation (Rupees) Operating Cost
2008-2009 0 0
2009-2010 4384504*0.909 3985514
2010-2011 4449912*0.826 3675627
2011-2012 4521861*0.751 3395918
2012-2013 4761205*0.683 3251903
2013-2014 4848263*0.621 3010771
2014-2015 4944027*0.564 2788431
2015-2016 5233597*0.513 2684835
2016-2017 5349471*0.467 2498203
2017-2018 5476933*0.424 2322220
2018-2019 5829005*0.386 2249996
Present Value Of Operating Costs Rs. 29863418
Benefits:
The benefits were calculated on the basis of the following assumptions:
1. Sales price of Biodiesel = 25 Rs/Litre 2. Process requisites were as given below
Capacity produced = 300 Litre/Hour
Number of hours Operational = 16 Hour/Day

840
Return per Annum = (300*16*360)* 25 = Rs 43,200,000
Benefits Discounted to the Base Year
The revenues return from Biodiesel plants are in the form of constant periodic cash flows of
Rs. 201,600,000 the total receipts after discounting at 10% can be calculated by applying annuity
table. Thus, Present value of Rs 1 received constantly per annum for 10 years at 10% discount
rate = Rs. 6.14457 (From annuity tables).
Rs 43,200,000 * 6.14457 = Rs. 265,445,424
Present value of the Benefits = Rs. 265,445,424
Scrap Value of the Machinery and Equipment
The residual value of the machinery and equipment at the end of the project life is estimated at
10% of the purchase price.
Therefore, the worth asset at which it can be sold or the disposed off will be:
Scrap value = Rs. 16,829,87
TOTAL EXPENDITURES AND TOTAL RETURNS DISCOUNTED TO BASE YEAR
Present value of cash outlays = Initial Fixed Investment + Operating Cost
Initial Fixed Investment = Rs. 66,159,866
Operating Cost-year (2008-2009) = Nil
Present value of operating costs = Rs. 29,863,418
Present value of Cash outlays = (66,159,866 + 29,863,418) = Rs. 96,023,284
Returns = Savings + Scrap value
Present Value of Returns = Rs. 265,445,424
Present Value of Scrap = Rs. 16, 829, 87 * 0.385543 = Rs. 648,864
Present Value of Cash Flows (Benefits) = Rs. (265,445,424+648,864) = Rs. 266,094,288

841
Present Value of Benefits
Benefit / Cost (B/C) Ratio = _______________________
Present Value Cost
=Rs. 266,094,288 / 96,023,284
= 2.77
Net Present Value = Rs. 170,071,004
Total Investment
Payback Period = _______________
Annual Return
=Rs. 66,159,866 / Rs 266,094,288
= 0.24 Years
The above principles were applied to decide the status of different alternatives appraised here to judge their technical soundness and economic viability.
Alternative 1: The BCR in alternative 1 is 6.97; the NPV is $10,119,328 and payback period 0.63 years. Thus, the benefit cost ratio is more than 1, NPV also shows a positive value. Payback period of this alternative qualify the appraisal criteria. Thus, this alternative is feasible.
Chapter 5
RESULTS
842
As all the work is based upon secondary data collected through internet no descriptive research
was involved. Thus, the results are reported only quantitatively. The results obtained on the basis
of cost analysis are reported below. These are preceded by the criteria on the basis on which the
project’s technical soundness and economic viability/ acceptability were decided.
Benefit to Cost Ratio is one of the important criteria for grading a project as non-profitable,
profitable or socially acceptable. The decision rule is that if it is more than 1, the project is
profitable and thus acceptable. If it is less than one, it is non- profitable and thus not acceptable if
it does not fall in the category of social obligations.
For Net Present Value or NPV of the Project the decision rule is that the project is acceptable if
NPV is positive. If it is negative, then project is rejected provided it does not fall in the category
of social obligations. Usually, the projects meant to produce products for sale for competing in
the market are straight away rejected if the NPV is negative. Of course, these may be considered
for acceptance if their social cost is high and that is in terms of general social benefits such as
cleanliness of environment, response to a community need if no other appropriate source is
available, creation of employment opportunities, etc.
Payback method suggests the shorter the time period the quicker the recovery of the investment
in a project. It indicates how long does it take for the returns of a project to cover its initial costs.
A long payback period is not very desirable.
The above principles were applied to decide the status of different alternatives appraised
here to judge their technical soundness and economic viability.
Alternative 1: The BCR in alternative 1 is 6.97; the NPV is $10,119,328
with a payback period 0.63 years. Thus, the benefit cost ratio is more than 1, NPV also shows a
positive value. Payback period of this alternative qualify the appraisal criteria. Thus, this
alternative is feasible.

843
Alternative 2: The BCR in alternative 1 is 2.77, the NPV is $2834517 with a payback period of
0.24 years. Here again, the benefit cost ratio is more than 1, NPV also shows a positive value and
the PBP of this alternative is less than even of the first alternative. Thus, this alternative is
feasible as well.
Chapter 6
DISCUSSION:

844
The purpose of the work reported in this thesis was to find out whether it was feasible to produce
Biodiesel power from crude and used vegetable oil and other waste oil resources. To this end we
did not come across any study on this aspect, particularly in Pakistan. Thus, we had to start from
the first principles to work out our project framework. In our discussion, we are in a position to
compare different alternatives, but we can’t compare any of our results with those of any of our
predecessors.
The criteria parameters of all alternatives are compared in Table 9.
Table 14: Comparison of alternatives
BCR NPV Payback period
Alternative 1 6.97 Rs. 607,159,653 0.63
Alternative 2 2.77 170,071,004 0.24
Comparing Alternative 1 and 2
The main difference between the two alternatives is simply the different scale of production of
Biodiesel. The only difference it creates is in the initial investment cost, as the price of the units
is different. The NPV with Biostrim 1000 turned out to be Rs. 607,159,653 where as the NPV
with Biostrim 500 turned out to be Rs. 170,071,004. This shows clearly that, Biostrim 1000
provide the investment with a better opportunity to prosper in future.
The BCR of Biostrim 500 is 2.77 which is greater than one and is feasible enough to be accepted
but the BCR with Biostrim 1000 is higher than this, i.e. 6.97. This shows that although producing
with Biostrim 500 has a good enough BCR to start production, but with Biostrim 1000 FI has
more benefits than costs too and the difference as compared to Biostrim 500 is just of 4.2.
845
The payback period of Biostrim 1000 turns out to be 0.63 years. And the payback period of
Biostrim 500 is 0.24 years. Even though the payback period of Biostrim 500 is less, in both cases
the costs are recovered within a year. Thus, the difference between the two is not a major factor
in the decision process.
Hence, by every mean of calculation, production by Biostrim 1000 is a way better option than
production through Biostrim 500. Of course, it is the market size that seems to be the major
determinant of the choice between the two options. The principle of economy of scale works
only if the market size is sufficiently receptive for the products.
Pakistan's net oil imports are forecasted to rise substantially in coming years as demand growth
outpaces increases in production. The demand for refined petroleum products also exceeds
domestic oil refining capacity; so nearly half of Pakistani oil imports are refined products.
Pakistan’s largest port is located at Karachi, which serves as the principal entry point for oil
imports. PSO leads Pakistan's fuel distribution market, with its main storage facilities located at
Port Mohammed Bin Qasim. Thus , biodiesel; produced by the process described in this thesis
can play an important role as an import substitution product to save significant foreign exchange
being spent on oil import.
Most diesel cars and machines built after 1995 are able to drive on 100% biodiesel. However, it
is best to check with the vehicle manufacturer. Thus, the applicability of bio diesel almost
immediately is highly probable. The current Price of Diesel is approximately Rs.66. While the
selling price of Bio diesel will be Rs.25. which is less than half of the sales price of diesel. Thus,
the demand of such a cheap fuel would positively increase. Bio diesel is by far the best

846
alternative to other fuels currently in use. It is cheap, reliable and does not need any change of
equipment.
The major benefit associated with the substitution of fossil fuels with biodiesel is that it will
liberate far less gaseous pollutants in the air and thus the quality of air in Pakistan will improve
as the motor vehicles are major polluting agents all over the globe.
Last but not the least it sounds appropriate tom to give some suggestions to extend the project.
After going through the enquiry, we feel that the piece of work reported here can be extended on
the following lines;
Social benefit-cost analysis may be carried out to compare social benefits of use of
biodiesel with the use of fuels currently in use. If social benefits are determined, there is
the likelihood that Socio-economic Benefit to Cost Ratio may turn out to be many fold of
BCR reported here. Carrying out such a work will create attraction in substitution of
currently used imported fuels by biodiesel.
A champagne may be lodged to enhance research in the field of import substitution
appraisal. Promising products that can substitute imported stuff in Pakistan may be
scheduled for techno-economic enquiry to decide how these can be produced and how
much foreign exchange these can save after substitution.
CONCLUSIVE REMARKS AND RECOMMENDATIONS

847
The results of the study are very favorable to the aspect that the production of Bio diesel should
start in Pakistan. It can either be with the less production (Biostrim 500) or with (Biostrim 1000)
for large scale production. This project is a good investment for any investor as well as it is a
beneficial idea for the Government of Pakistan to carry out.
There is one crucial aspect related to the launch of the product and that is that the product should
be marketed in such a way that it gives the image of a “Cheaper Alternatives in Pakistan”.
This research covers the financial aspects of producing Biodiesel in Pakistan. However
production of Biodiesel has a lot of socio-economic benefits. How many? is the question to be
answered. The research work on different facets of the project to answer this question has been
left for our successors.
This study has turned out to be a success in terms of achieving positive results for the desired
query, due to which this gap in the market can be catered so that financial benefits may be gained
by the entrepreneur and economic benefits may be transferred to the nation.
BIBLIOGRAPHY
[1] Howell, and Weber (1996). Biodiesel Research - 1996 and Beyond Madzura (1997). Lessons
learned while fueling with bio diesel Gerpen (1998). Biofuels under development Fischer
848
(1999). Lubricating qualities of biodiesel and bio diesel blends Milford and Hanna (2003).
Biodiesel production: a review
ACKNOWLEDGEMENT
All praises are for Allah Almighty, the most merciful and the most beneficent, who is the Owner
and the Creator of everything in the universe. It is with His grace that I have been able to
undertake and carry out the research work reported in this thesis. I pay full honor to Allah’s
Prophet Muhammad (PBUH) who is an infinite torch of guidance and light of knowledge for
whole mankind and teaches us higher ideas in life.
I pay my sincere gratitude to Dr. Mohammad Rafiq Khan, Senior Research Fellow at Center of
Research, Lahore School of Economics for his dynamic supervision, keen interest, valuable
suggestions, in-exhaustible inspiration, cooperation, and enthusiastic guidance throughout my
research work.
I would also like to thank Mr. Bola Carew, Director BioFluid Tech Ltd.
, for the valuable information and insight without which this research would have not been
completed.
I express a deep sense of appreciation and thanks to my family and friends for having faith in me
and helping me in every possible way to complete my research project without any hindrance.
(Muhammad Abdullah Gardezi)