mohammad akteruzzaman advisor: dr. shuvra das modeling and simulation of hydraulic power steering...
Post on 21-Dec-2015
219 views
TRANSCRIPT

MOHAMMAD AKTERUZZAMAN
Advisor: DR. SHUVRA DAS
MODELING and SIMULATION OF HYDRAULIC POWER STEERING SYSTEM WITH MATLAB

MODELING and SIMULATION OF HYDRAULIC POWER STEERING SYSTEM
MODELING OF the MECHANICAL and HYDRAULIC COMPONENTS of a POWER STEERING SYSTEM.
SIMULATION OF THE MODEL BY MATLAB.
Model REPRESENTS THE DYNAMIC RESPONSES OF THE power Steering System AND is CAPABLE OF ESTIMATING the effect of parameters on system response.
Model is used to study the effect of various system parameters on system response.

PRIOR WORK
Discussion of Reference Model : Ali Keyhani : He presents the identification of the
dynamic model for a power steering system constructed using a rotary valve based on Mathematical (ODE).
Jose J. Granda : Analyze a multi energy non linear system using a bond graph model.
Joel E. Birching : He describes a method of applying the orifice equation to a steering valve along with the procedure for experimentally determining the flow Co-efficient for this equation.

Prior Work
AMESim (Object oriented software) :This case
study gives us a good understanding of how
AMESim can be used to construct parameterize
and analyze complex hydro-mechanical
dynamic model like power steering system.
N.Riva, E.Suraci (ADAMS based work) : A methology has developed to simulate the vehicle dynamics through Adams Car and Matlab co-simulation.

Prior Work
We took Ali Keyhani’s dynamic power steering
model consisting of ordinary differential
equations for Mechanical and Hydraulic system.
Some of the design Parameters are difficult to
obtain. Ali Keyhani used experimental data &
least square approach to determine these
parameters.


ACTUAL POWER STEERING SYSTEM :

SCHEMATIC DIAGRAM OF HYDRO-POWERSTEERING SYSTEM

ALI KEYHANI MODEL : Mechanical subsystem

ALI KEYHANI MODEL : Mechanical subsystem
The equations for the steering column, pinion and rack can be written :
Equation 1 :
Equation 2 :

ALI KEYHANI MODEL : Mechanical subsystem
Where Td=Torque generated by the driver,Theta1=rotational displacement for the steering column,K2=tire stiffnessB2=Viscous damping coefficientB1=friction constant of the upper-steering column
X=displacement of the rackm= mass of pinionAp= Piston areaK1=torsion bar stiffness
J1=Inertia constant of the upper steering column

ALI KEYHANI MODEL : Mechanical subsystem
The following assumptions were made :-the pressure forces on the spool are
neglected.-the stiffness of the steering column is
infinite.-the inertia of the lower steering column
(valve spool and pinion) is lumped into the rack mass.

ALI KEYHANI MODEL hydraulic subsystem

ALI KEYHANI MODEL hydraulic subsystemBy applying the orifice equations to the rotary valve metering orifices and mass conservation
equations to the entire hydraulic subsystem the following equation are obtained : Equation 1 :
Equation 2 :
Equation 3 :

ALI KEYHANI MODEL hydraulic subsystem
Where Ps and Po =supply and return pressure of the pump.
Pl and Pr = cylinder pressure on the left and right side.Q = supply flow rate of the pumpA1 and A2 are the metering orifice areaRho = density of the fluidBeta=bulk modulus of fluidL=length of the cylinderCd= discharge co-efficient

ALI KEYHANI MODEL hydraulic subsystem
The following assumption were made :-there is no pressure drop on the fluid transmission lines
between the pump and the valve and the cylinder.-the wave dynamics on the fluid transmission lines are
neglected-the bulk modulus of the fluid is considered constant-the inertance of the fluid is neglected-there is no leakage at the piston-cylinder interface-the return pressure dynamics are negligible

ALI KEYHANI’S PARAMETER TABLE from experimental

ALI KEYHANI’S PARAMETER TABLE from experimental

Information lacking in ALI KEYHANI’s Work
-Missing relationship for variation of A(theta), Torque and Flow rate Q.
-His established parameters do not say from which type of vehicle they were obtained.

How We got the value of A(theta)

Value of Q Q=1.5 GPM (gallon per minute) for
reasonable minimum with the quicker steering ratios for pavement cars.
Q=2.5 GPM for dirt .(reference : power steering Tech,
www.woodwardsteering.com)
□ Q=.0002 m3/s
(reference : H.Chai. Electromechanical Motion Devices, Upper addle River, NJ:Prentice Hall PTR,1998)

Value of Torque
Td=0-8 N-m is not enough to excite the lower steering column modes.
(reference : Ali Keyhani)Td=0-2 N-m is required at the
handwheel during normal driving ranges.
Td=15 N-m in extreme cases.(reference : H.Chai. Electromechanical Motion Devices, Upper
addle River, NJ:Prentice Hall PTR,1998)
Model
Using the equations and input data a MATLAB based program was written
Model parameters were adjusted to obtain the results reported by Ali Keyhani

ResultsComparison from Ali-keyani model
0 0.2 0.4 0.6 0.8 1 1.2 1.4 1.6 1.8 20
1
2
3
4
5
6
7
8x 10
6
time
right
cyl
inde
r pr
essu
re in
N/m
2
right cylinder pressure Vs time

ResultsComparison from Ali-keyani model
0 0.2 0.4 0.6 0.8 1 1.2 1.4 1.6 1.8 2-0.5
0
0.5
1
1.5
2
2.5
3x 10
-3
time
disp
lace
men
t in
met
er
displacement Vs time

ResultsComparism from ali-keyani model
0 0.2 0.4 0.6 0.8 1 1.2 1.4 1.6 1.8 20
1
2
3
4
5
6
7
8x 10
6
time
pum
p pr
essu
re in
N/m
2
pump pressure Vs time

Resultsfrom different study (Tom Wong)
0 1 2 3 4 5 60
1
2
3
4
5
6
7
8x 10
6
valve rotation
assi
t pr
essu
re
assit pressure Vs rotation

Results from different study
Include the other results that I had suggested. (driver torque Vs. assist torques, also in previous pages copy fig from reference)

Response graph :Effect on theta(radians) Torque Td=2, 9, 15 N-m
0 0.2 0.4 0.6 0.8 1 1.2 1.4 1.6 1.8 20
0.01
0.02
0.03
0.04
0.05
0.06
0.07
0.08
0.09
0.1
time
thet
a in
rad
ians
theta Vs time
0 0.2 0.4 0.6 0.8 1 1.2 1.4 1.6 1.8 20
0.005
0.01
0.015
0.02
0.025
time
thet
a in
rad
ians
theta Vs time
0 0.2 0.4 0.6 0.8 1 1.2 1.4 1.6 1.8 20
0.01
0.02
0.03
0.04
0.05
0.06
0.07
0.08
0.09
0.1
time
thet
a in
rad
ians
theta Vs time

Response graph :Effect on cylinder pressure Torque Td=2, 9, 15 N-m
0 0.2 0.4 0.6 0.8 1 1.2 1.4 1.6 1.8 2-0.5
0
0.5
1
1.5
2
2.5
3
3.5x 10
6
time
right
cyl
inde
r pr
essu
re in
N/m
2
right cylinder pressure Vs time
0 0.2 0.4 0.6 0.8 1 1.2 1.4 1.6 1.8 2-1
0
1
2
3
4
5x 10
4
time
right
cyl
inde
r pr
essu
re in
N/m
2
right cylinder pressure Vs time
0 0.2 0.4 0.6 0.8 1 1.2 1.4 1.6 1.8 20
1
2
3
4
5
6
7
8x 10
6
time
right
cyl
inde
r pr
essu
re in
N/m
2
right cylinder pressure Vs time

Response graph :Effect on rack Assist pressure vs. rotation angle (theta)Torque Td=2, 9, 15 N-m
0 1 2 3 4 5 6-0.5
0
0.5
1
1.5
2
2.5
3
3.5x 10
6
valve rotation
assi
t pr
essu
re
assit pressure Vs rotation
0 0.5 1 1.5-1
0
1
2
3
4
5x 10
4
valve rotation
assi
t pr
essu
re
assit pressure Vs rotation
0 1 2 3 4 5 60
1
2
3
4
5
6
7
8x 10
6
valve rotation
assi
t pr
essu
re
assit pressure Vs rotation

Response graph :Effect on pump pressureTorque Td=2, 9, 15 N-m
0 0.2 0.4 0.6 0.8 1 1.2 1.4 1.6 1.8 20
0.5
1
1.5
2
2.5
3
3.5x 10
6
time
pum
p pr
essu
re in
N/m
2
pump pressure Vs time
0 0.5 1 1.5 20
1
2
3
4
5
6x 10
6
time
pum
p pr
essu
re in
N/m
2
pump pressure Vs time0 0.2 0.4 0.6 0.8 1 1.2 1.4 1.6 1.8 2
0
2
4
6
8
10
12x 10
4
time
pum
p pr
essu
re in
N/m
2
pump pressure Vs time

Response graph :Effect on assist pressure w.r.t rotation on degreePump flow rate, Q=0.00014,0.00016,0.00024 m3/S.

Response graph :Effect on Pump pressurePump flow rate, Q=0.00014,0.00016,0.00024 m3/S.

Response graph :Effect on displacement (X)Pump flow rate, Q=0.00014,0.00016,0.00024 m3/S.

Response graph :Effect on cylinder pressurePump flow rate, Q=0.00014,0.00016,0.00024 m3/S.

Response graph :Effect on thetaPump flow rate, Q=0.00014,0.00016,0.00024 m3/S.

Response graph :Effect on Assist pressure on rotation angle (degree)J1=.0000322, .0000598 N-m-s2/rad

Response graph :Effect on pump pressure J1=.0000322, .0000598 N-m-s2/rad

Response graph :Effect on rack displacement (X) in meterJ1=.0000322, .0000598 N-m-s2/rad

Response graph :Effect on right cylinder pressure( N/m2)J1=.0000322, .0000598 N-m-s2/rad

Response graph :Effect on Rotation( radians)J1=.0000322, .0000598 N-m-s2/rad

Response graph : Effect assist pressure( N/m2) on rotation angle ( degree)When m=4.76, 8.84 Kg
0 1 2 3 4 5 60
1
2
3
4
5
6
7
8x 10
6
valve rotation
assi
t pr
essu
re
assit pressure Vs rotation
0 1 2 3 4 5 60
1
2
3
4
5
6
7
8x 10
6
valve rotation
assi
t pr
essu
re
assit pressure Vs rotation

Response graph : Effect pump pressure( N/m2) When m=4.76, 8.84 Kg
0 0.2 0.4 0.6 0.8 1 1.2 1.4 1.6 1.8 20
1
2
3
4
5
6
7
8x 10
6
time
pum
p pr
essu
re in
N/m
2
pump pressure Vs time
0 0.2 0.4 0.6 0.8 1 1.2 1.4 1.6 1.8 20
1
2
3
4
5
6
7
8x 10
6
time
pum
p pr
essu
re in
N/m
2
pump pressure Vs time

Response graph : Effect displacement(X) When m=4.76, 8.84 Kg
0 0.2 0.4 0.6 0.8 1 1.2 1.4 1.6 1.8 2-0.5
0
0.5
1
1.5
2
2.5
3x 10
-3
time
disp
lace
men
t in
met
er
displacement Vs time
0 0.2 0.4 0.6 0.8 1 1.2 1.4 1.6 1.8 2-0.5
0
0.5
1
1.5
2
2.5
3x 10
-3
time
disp
lace
men
t in
met
er
displacement Vs time

Response graph : Effect on cylinder pressure
When m=4.76, 8.84 Kg
0 0.2 0.4 0.6 0.8 1 1.2 1.4 1.6 1.8 20
1
2
3
4
5
6
7
8x 10
6
time
right
cyl
inde
r pr
essu
re in
N/m
2
right cylinder pressure Vs time
0 0.2 0.4 0.6 0.8 1 1.2 1.4 1.6 1.8 20
1
2
3
4
5
6
7
8x 10
6
time
right
cyl
inde
r pr
essu
re in
N/m
2
right cylinder pressure Vs time

Response graph : Effect on assist pressure
with rotation when K1=27.651,31.33N-m/rad
0 1 2 3 4 5 60
2
4
6
8
10
12x 10
6
valve rotation
assi
t pr
essu
re
assit pressure Vs rotation
0 1 2 3 4 5 60
1
2
3
4
5
6
7
8
9
10x 10
6
valve rotation
assi
t pr
essu
re
assit pressure Vs rotation

Response graph : Effect on pump pressure
When K1=27.651,31.33N-m/rad
0 0.2 0.4 0.6 0.8 1 1.2 1.4 1.6 1.8 20
2
4
6
8
10
12x 10
6
time
pum
p pr
essu
re in
N/m
2
pump pressure Vs time
0 0.2 0.4 0.6 0.8 1 1.2 1.4 1.6 1.8 20
1
2
3
4
5
6
7
8
9
10x 10
6
time
pum
p pr
essu
re in
N/m
2
pump pressure Vs time

Response graph : Effect on rack displacement
When K1=27.651,31.33N-m/rad
0 0.2 0.4 0.6 0.8 1 1.2 1.4 1.6 1.8 2-1
0
1
2
3
4
5x 10
-3
time
disp
lace
men
t in
met
er
displacement Vs time
0 0.2 0.4 0.6 0.8 1 1.2 1.4 1.6 1.8 2-0.5
0
0.5
1
1.5
2
2.5
3
3.5x 10
-3
time
dis
pla
cem
ent
in m
ete
r
displacement Vs time
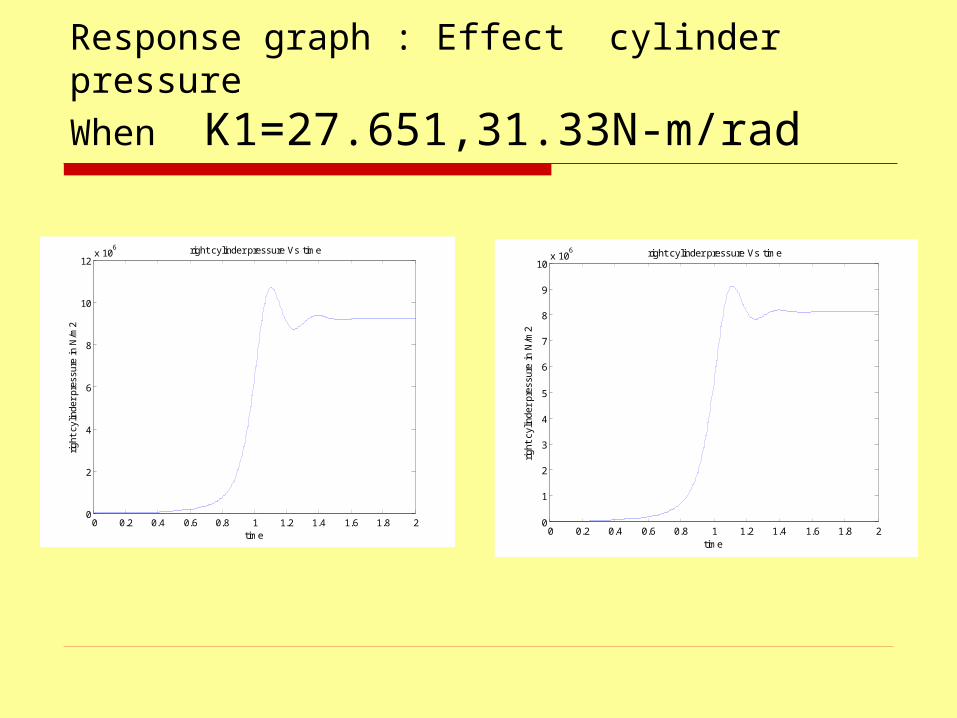
Response graph : Effect cylinder pressure
When K1=27.651,31.33N-m/rad
0 0.2 0.4 0.6 0.8 1 1.2 1.4 1.6 1.8 20
2
4
6
8
10
12x 10
6
time
right
cyl
inde
r pr
essu
re in
N/m
2
right cylinder pressure Vs time
0 0.2 0.4 0.6 0.8 1 1.2 1.4 1.6 1.8 20
1
2
3
4
5
6
7
8
9
10x 10
6
time
right
cyl
inde
r pr
essu
re in
N/m
2
right cylinder pressure Vs time

Response graph : Effect on theta
When K1=27.651,31.33N-m/rad
0 0.2 0.4 0.6 0.8 1 1.2 1.4 1.6 1.8 20
0.01
0.02
0.03
0.04
0.05
0.06
0.07
0.08
0.09
0.1
time
thet
a in
rad
ians
theta Vs time
0 0.2 0.4 0.6 0.8 1 1.2 1.4 1.6 1.8 20
0.01
0.02
0.03
0.04
0.05
0.06
0.07
0.08
0.09
0.1
time
thet
a in
rad
ians
theta Vs time

Summery and conclusion A model has been developed for the Hydraulic
Power steering system Several realistic assumptions were used in
model development. The model uses driver torque and pump flow
rate as inputs. The rotation of the torsion bar, the
displacement of the rack, and the pressures in the cylinder are outputs from model.

Summery and conclusion The model was used to develop response
curves similar to published work The model was used to simulate the effect of
driver torque on the system response. As the torque increases.....
The model was also used to simulate the effect of pump flow rate on the system response. As the flow rate increases....

Our Model descriptionWe got five equation from Ali-keyhani model
of hydraulic power power steering system : Equation 1 : Which is second order equation.For Matlab programing we can break the
second order differential equation by two first order equation which is below :
Let, y(1)=theta, y(2)=theta’ , so we can writeY(1)’=y(2) y(2)’=1/J1(Td-B1 * y(2)+K1(y(1)-y(3)/r))Where y(3) = X ( comes from equation 3)

Our Model description
Similarly for equation 2 also second order equation can write by two first order differential equation,
If y(3)=X, y(4)=X’ So, y(3)’=y(4)Y(4)’=1/m(K1/r(y(1)-y(3)/r)+P.Ap-
B2.y(4)+K2.y(3))

Our Model description
For hydraulic equation 3,4 and 5,If we let y(5)=Ps
y(6)=Pry(7)=Pl
Then y(5)’=Beta/Vs(Q-A1*Cd*Sqrt 2*(y(5)-
y(6))/d-A2*Cd*Sqrt 2*(y(5)-y(7))/d)

Our Model description
y(6)’=Beta/(Ap(L/2-y(3)))(A1 Cd Sqrt 2*(y(5)-y(6))/d-A2*Cd*Sqrt 2*(y(5)-Po)/d)+Ap*y(4))
y(7)’=Beta/(Ap(L/2+y(3)))(A2*Cd*Sqrt 2*(y(5)-y(7))/d-A2*Cd*Sqrt 2*(y(7)-Po)/d)+Ap*y(4))

Our Model description
So, our equation is seven and variable is seven, see below
Variables arey(1)=theta, y(2)=theta’,y(3)=X,y(4)=X’ ,
y(5)=Ps ,y(6)=Pr,y(7)=Pl Equations are1. Y(1)’=y(2) 2. y(2)’=1/J1(Td-B1 * y(2)+K1(y(1)-y(3)/r))

Model description3. y(3)’=y(4)4. Y(4)’=1/m(K1/r(y(1)-y(3)/r)+P*Ap-
B2*y(4)+K2*y(3))5. y(5)’=Beta/Vs(Q-A1 Cd Sqrt 2*(y(5)-y(6))/d-
A2*Cd*Sqrt 2*(y(5)-y(7))/d)6. y(6)’=Beta/(Ap(L/2-y(3)))(A1*Cd*Sqrt
2*(y(5)-y(6))/d-A2 Cd Sqrt 2*(y(5)-Po)/d)+Ap*y(4))
7. y(7)’=Beta/(Ap(L/2+y(3)))(A2 Cd Sqrt 2*(y(5)-y(7))/d-A2 Cd Sqrt 2*(y(7)-Po)/d)+Ap*y(4))

Showing program and Simulation in Matlabfunction F=odefile(t,y)% theta=y(1),theta'=y(2),X=y(3),X'=y(4),Ps=y(5),Pr=y(6),Pl=y(7)Ap=12.6*0.0001;Td=15;B1=.1083*1200;B2=2679;J1=.000046;m=7.5;K1=1.8434*20;K2=160721*17;r=.008;%Q=0.0002;Q=.00027; d=825; Vs=8.19*0.000001; beta=5515*100000; L=.15; Po=0.0;Cd=0.6;E1=(1/J1)*Td;E2=(1/J1)*B1;E3=(1/J1)*K1;E4=(K1/J1)/r;G1=(1/m)*(K1/r);G2=(1/m)*(K1/r/r);G3=(1/m)*Ap;G4=(1/m)*B2;G5=(1/m)*K2;H1=(beta/Vs)*Q;H2=(beta/Vs)*Cd;S1=(beta/Ap);y(1)y(3)

Showing program and Simulation in Matabif y(1) <= -6*3.14159/180 r13 = 0.0; r23 = 20*0.000001;end if y(1) >= 6*3.14159/180 r13 = 20*0.000001; r23 = 0.0; endif -6*3.14159/180 <= y(1) <= 0.0 r13 = 0.0001909*y(1)+20*0.000001; r23 =20*0.000001; endif 6*3.14159/180 > y(1) > 0.0 r13 = 20*0.000001; r23 = -0.0001909*y(1)+20*0.000001;endr13r23F(1)=y(2);F(2)=E1-E2*y(2)-E3*y(1)+E4*y(3);F(3)=y(4);F(4)=G1*y(1)-G2*y(3)+G3*(y(7)-y(6))-G4*y(4)-G5*y(3);F(5)=H1-H2*r13*sqrt(2*(y(5)-y(6))/d)-H2*r23*sqrt(2*(y(5)-y(7))/d);F(6)=(S1/(L/2-y(3)))*(r13*Cd*sqrt(2*(y(5)-y(6))/d)-r23*Cd*sqrt(2*(y(5)-Po)/d)+Ap*y(4));F(7)=(S1/(L/2+y(3)))*(r23*Cd*sqrt(2*(y(5)-y(7))/d)-r13*Cd*sqrt(2*(y(7)-Po)/d)-Ap*y(4));F=[F(1);F(2);F(3);F(4);F(5);F(6);F(7)];

Showing program and Simulation in Matabclear;y0=[0;0;0;0;0;0;0];tspan=linspace(0,2,5000);options=odeset('reltol',1e-6,'abstol',1e-8,'outputfcn','odeplot');[t y]=ode23tb('odefile13',tspan,y0,options);figure(1);plot(t,y(:,1),'r');%axis([0 2 -0.2 1.2]);xlabel('time');ylabel('theta in radians');title('theta Vs time');hold onfigure(2);plot(t,y(:,6),'b');%axis([0 2 -10 8000000]);xlabel('time');ylabel('right cylinder pressure in N/m2');title(' right cylinder pressure Vs time');hold onfigure(3);plot(t,(-1*y(:,3)),'g');%axis();xlabel('time');ylabel('displacement in meter');title('displacement Vs time');hold on

Showing program and Simulation in Matabfigure(4);plot(t,y(:,5),'b');%axis([0 2 -10 8000000]);xlabel('time');ylabel('pump pressure in N/m2');title(' pump pressure Vs time');hold onfigure(5);plot(((180/3.14159)*y(:,1)),y(:,6),'g');%axis([0 2 0 8000000]);xlabel('valve rotation');ylabel('assit pressure');title('assit pressure Vs rotation');hold off

References :
Dr.Christan Ebner, ‘ Steer-by-wire’ BMW
technik, May-00, seite-1
Paul Yih, ‘Toward Steer by wire’ Dynamic
Design lab, November 30, 2001
Tom Wong, ‘ Hydraulic power system design
and optimization simulation’ SAE technical
paper series, 2001-01-0479

References :
1. Ali Keyhani ‘ Identification of Power steering system Dynamic Models’ ,Mchatronics Journal, February 1998
2. Granda J.J. ‘ Computer Aided Simulation of a Hydraulic Power Steering System with Mechanical Feedback’
3. Joel E. Birching ‘ Two Dimensional Modeling of a Rotary Power steering valve’ International Congress and Exposition, Detroit, March 1-4, 1999
4. AMESim ‘ Power steering system studied’ Technical Bulletin n 107

References Sanket Amberkar, Mark Kushion,’
Diagnostic Development for an Wlectric Power steering system’, SAE 2000 World Congress, Detroit , Michigan,March 6-9,2000.
Paper No. 993079, An ASAE Meeting Presentation,’Adaptivecontrol of Electric Steering system fro wheel-type Agricultural Tractors’ by D.Wu, Q.Zhang.

references

references

Response graph :Effect on rack displacement (X) mTorque Td=2, 9, 15 N-m
0 0.2 0.4 0.6 0.8 1 1.2 1.4 1.6 1.8 2-2
0
2
4
6
8
10
12x 10
-4
time
disp
lace
men
t in
met
er
displacement Vs time
0 0.2 0.4 0.6 0.8 1 1.2 1.4 1.6 1.8 2-3.5
-3
-2.5
-2
-1.5
-1
-0.5
0x 10
-5
time
disp
lace
men
t in
met
er
displacement Vs time
0 0.2 0.4 0.6 0.8 1 1.2 1.4 1.6 1.8 2-0.5
0
0.5
1
1.5
2
2.5
3x 10
-3
time
disp
lace
men
t in
met
er
displacement Vs time