module quality assurance: risk mitigation and safeguarding ... · iso 2859 sample rule qc standard...
TRANSCRIPT

SPI 2016 Quick Talk
13 September 2016
Module Quality Assurance: Risk Mitigation and Safeguarding Project Value
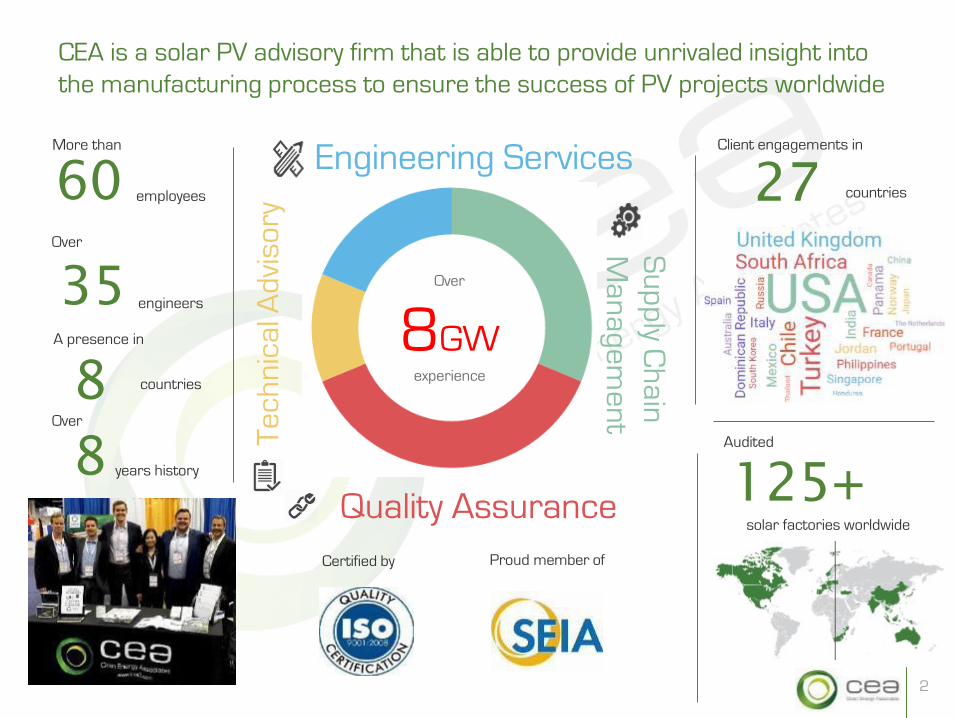
countries 27 Client engagements in
125+ solar factories worldwide
Audited
employees
Tech
nica
l Adv
isor
y S
upply Chain
Managem
ent
60
Over
More than Engineering Services
Quality Assurance Certified by Proud member of
Over
8GW experience
A presence in
8 Over
countries
8 years history
35 engineers
2
CEA is a solar PV advisory firm that is able to provide unrivaled insight into the manufacturing process to ensure the success of PV projects worldwide

Design
Phase 1 Pre-production Quality Control
Phase 4 – Downstream Support
! Defining QA standards and requirements
! Contract/project set-up
! Examination at job site (thermal imaging tests)
! Third-party lab tests
! Factory audits ! Production
monitoring
Construction
Phase 2 Production monitoring
Module Inverters Racking Other BOS
Factory Level System Level
Commissioning
Module Inverters Racking Other BOS
Phase 3 Post-production Quality Control
Module Inverters Racking Other BOS
! System Design & Equipment Specs
! Solar Output Analysis
! Project & Construction Management
! RFP deconstruct and LCOE analysis
! System commissioning support
! Technical Troubleshooting
Independent Engineers (IE)
Technical Advisors in the past have overemphasized downstream quality without looking as closely on the product in more detail
Other third-party test labs
3

• IEC standards by design offer only a very basic level of assurance
• Most experts agree that IEC standards are only good for 10 years in the field
• Even extended testing only proves the manufacturer’s ability to produce a small number (20 pcs) of good modules
• Bill of Materials compliance during production is not assured
• Stability of production processes is not assured
• Long duration (25-30 years) • Limited terms • Many exclusions • Not comprehensive • Diagnostics costs not covered • Lost revenue not covered • Replacement costs not covered • Lengthy claim process • Replacement retrofits are
technically challenging
Warranties Certifications
Module Bankability is resting on two problematic pillars: warranties and certifications.
4

CEA’s Quality Assurance Program (CQAP) prevents risk and ensures that downstream project stakeholders maximize the output of their system
Supplier’s certification
Product and factory certification liaising TUV, SGS,
UL, CE, etc. assessment centers
Bill of Materials (BOM) inspection data review
Input material monitoring
Production process control; monitoring of equipment
calibration, stringing, lay-out, lamination, curing and
framing
Production environmental control; monitoring of inventory storage and
manufacturing workshop
ISO 2859 Sample rule
QC standard
AQL rule
Product Inspection
Visual inspection
Functional test
IV test
EL test
Proper Packing
Container type
Container number
Seal number
Shipment plan
Content Listing
Packing list
Inspection certificate
Pre-Production Production Monitoring
Pre-Shipment Container Loading
5
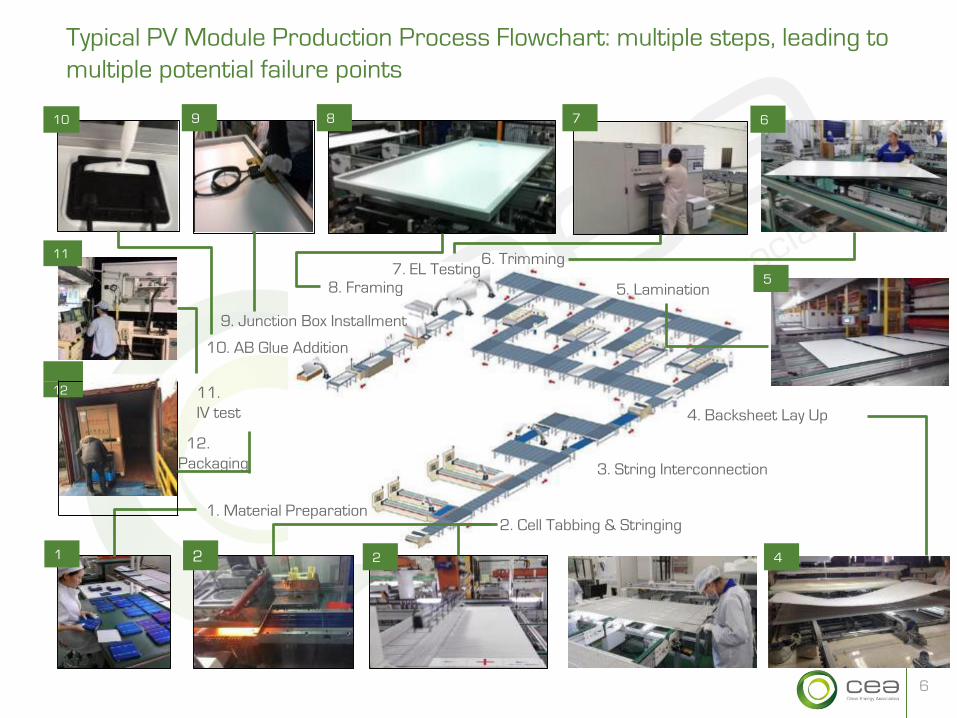
Typical PV Module Production Process Flowchart: multiple steps, leading to multiple potential failure points
1. Material Preparation
4. Backsheet Lay Up
3. String Interconnection
2. Cell Tabbing & Stringing
5. Lamination
6. Trimming 7. EL Testing
8. Framing
9. Junction Box Installment
10. AB Glue Addition
1 2 2 4
5
7 8 9 10
11
6
1 2 11. IV test
12. Packaging
6

CQAP has been performed in various facilities of Tier 1 manufacturers and the distribution of defect rates has showed surprising results.
0.0%
2.0%
4.0%
6.0%
8.0%
10.0%
12.0%
14.0%
16.0%
18.0%
2012 2013 2013 2014 2014 2015 2015 2016 2016 2017 2017
Def
ect
rate
s
2013 – 2016 YTD
Defect data from QA performed on over 100 projects totaling many GWs of modules
15 MW
30 MW
75 MW
100 MW
YTD TTTT
Project size
7

CEA has analyzed 4 case study QA projects and the insights gained can show the value of performing quality work on future projects
8
1. Projects demonstrate highly variable defect rates
2. Defect distribution varies greatly with project, location and in time
3. FMECA risk analysis (IEC 60812) similarly shows great risk variability
4. Even a 1% excess yield loss, can lead to substantial financial loss
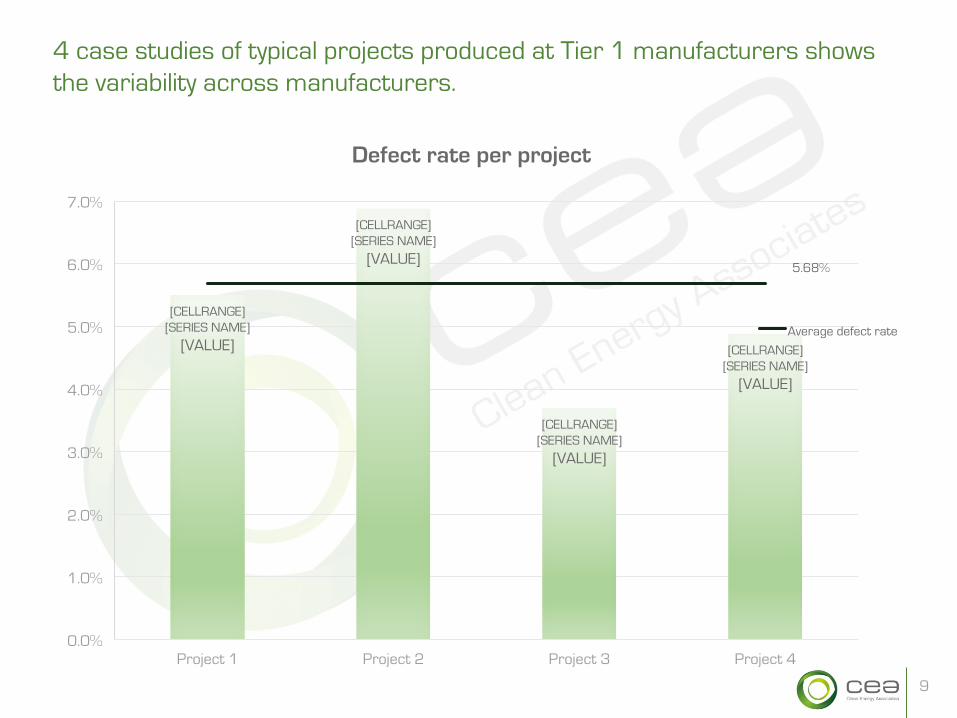
4 case studies of typical projects produced at Tier 1 manufacturers shows the variability across manufacturers.
[CELLRANGE] [SERIES NAME]
[VALUE]
[CELLRANGE] [SERIES NAME]
[VALUE]
[CELLRANGE] [SERIES NAME]
[VALUE]
[CELLRANGE] [SERIES NAME]
[VALUE]
5.68%
0.0%
1.0%
2.0%
3.0%
4.0%
5.0%
6.0%
7.0%
Project 1 Project 2 Project 3 Project 4
Average defect rate
Defect rate per project
9
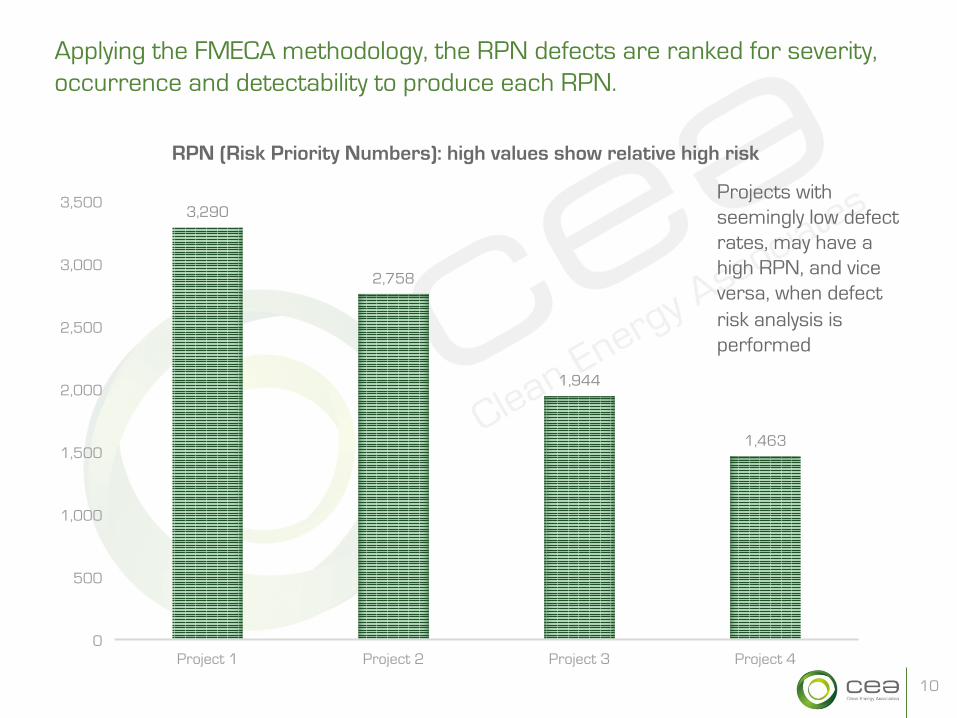
Applying the FMECA methodology, the RPN defects are ranked for severity, occurrence and detectability to produce each RPN.
3,290
2,758
1,944
1,463
0
500
1,000
1,500
2,000
2,500
3,000
3,500
Project 1 Project 2 Project 3 Project 4
RPN (Risk Priority Numbers): high values show relative high risk
10
Projects with seemingly low defect rates, may have a high RPN, and vice versa, when defect risk analysis is performed

Scattered defect distribution show that even on the same production lines as module assembly processes are not stable
CELL 17%
BACKSHEET 13%
OTHER 1%
EL 69%
PRO JECT 1
CELL 36%
CELL STRING 6% GLASS
10%
BACKSHEET 7%
FRAME 29%
JUNCTION BOX 5%
OTHER 3%
EL 4%
PRO JECT 2
CELL 16%
CELL STRING 51%
GLASS 6%
FRAME 8%
OTHER 11%
EL 8%
PRO JECT 3
CELL 28%
CELL STRING 37%
GLASS 6%
BACKSHEET 6%
FRAME 13%
EL 10%
PRO JECT 4
11
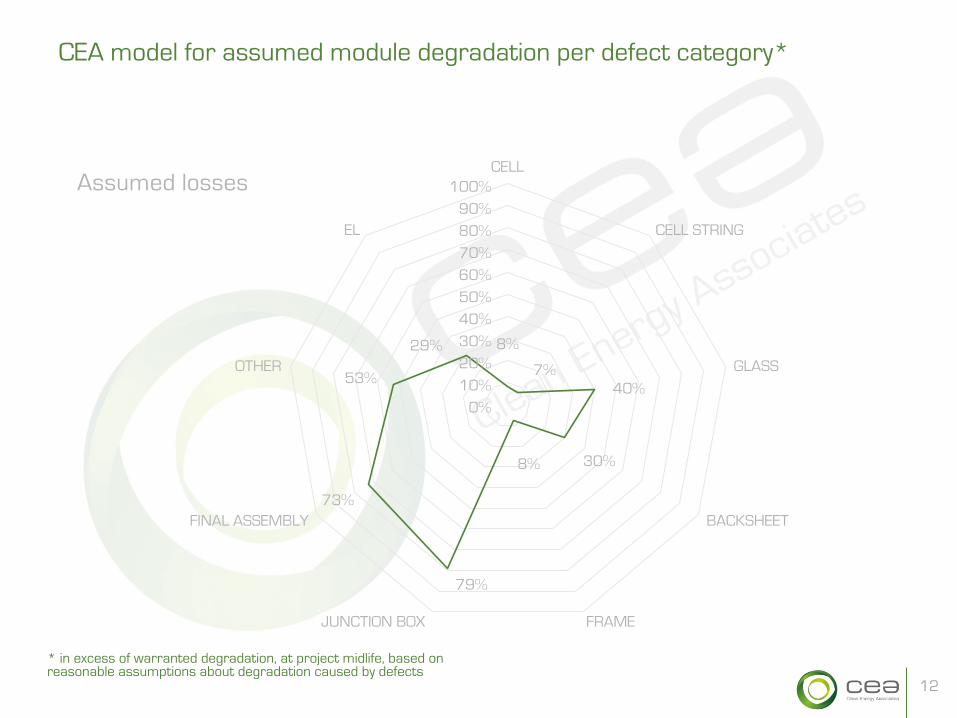
CEA model for assumed module degradation per defect category*
12
8%
7% 40%
30% 8%
79%
73%
53%
29%
CELL
CELL STRING
GLASS
BACKSHEET
FRAME JUNCTION BOX
FINAL ASSEMBLY
OTHER
EL
0% 10% 20% 30% 40% 50% 60% 70% 80% 90%
100% Assumed losses
* in excess of warranted degradation, at project midlife, based on reasonable assumptions about degradation caused by defects

Correlation of defect rates to average power loss derived from 4 project case studies. This loss will be mitigated if Quality Assurance is performed. Average defect rate
5.68%
Average avoided power loss due to defects
(calculated according to degradation model)*
1.10%
0.0%
1.0%
2.0%
3.0%
4.0%
5.0%
6.0%
4 projects average values
13
* in excess of warranted degradation, at project midlife, based on reasonable assumptions about degradation caused by defects
QA Virtuous Effect: The presence of a 3rd party performing Quality Assurance leads to a “virtuous effect”. Overall quality improves. The absence of a 3rd party oversight, inevitably leads to higher defect rates ,and subsequently to higher calculated power losses by a factor.

Example of calculated NPVs for 2 projects, produced with and without Quality Assurance program, using three scenarios
14
$14.6 M
$12.5 M $11.5 M
$10.4 M
$25.4 M
$23.0 M $21.8 M
$20.6 M
$ M
$5 M
$10 M
$15 M
$20 M
$25 M
$30 M
Projects with Quality Assurance (no excess loss)
Good scenario Medium scenario Bad scenario
Project A Project B
Sizes: 100 MW DC Project A, fixed tilt PPA $80 MWH EPC cost: $95m Project B, tracker PPA $60 MWH EPC cost: $107m
Projects without Quality Assurance
A B Lending rate 6.00% 6.00% Equity 50.00% 50.00% Loan tenor 10 10 O&M $1,000,000 $1,000,000 Land $500,000 $500,000 Inflation 2.50% 2.50% Tax rate 30.00% 30.00% PPA rate escalation 2.00% 2.00% Degradation of modules 0.65% 0.65% Energy yield per year MWh/MW 2,200 1,400 PPA in $/MWh 60 80 Pdc in MW 100 100 Discount rate 5.00% 5.00% EPC cost $/Wdc 1.05 0.95 Interconnection cost $1,805,000 $1,805,000
Bad scenario: manufacturer shows a big drop in quality w/o QA program (4 x 1% defect loss, or 4% in excess of warranty in project midlife) Medium scenario: manufacturer shows a medium drop in quality w/o QA program (3 x 1% defect loss, or 3% in excess of warranty in project midlife) Good scenario: manufacturer shows a small drop in quality w/o QA program (2 x 1% defect loss, or 2% in excess of warranty in project midlife)
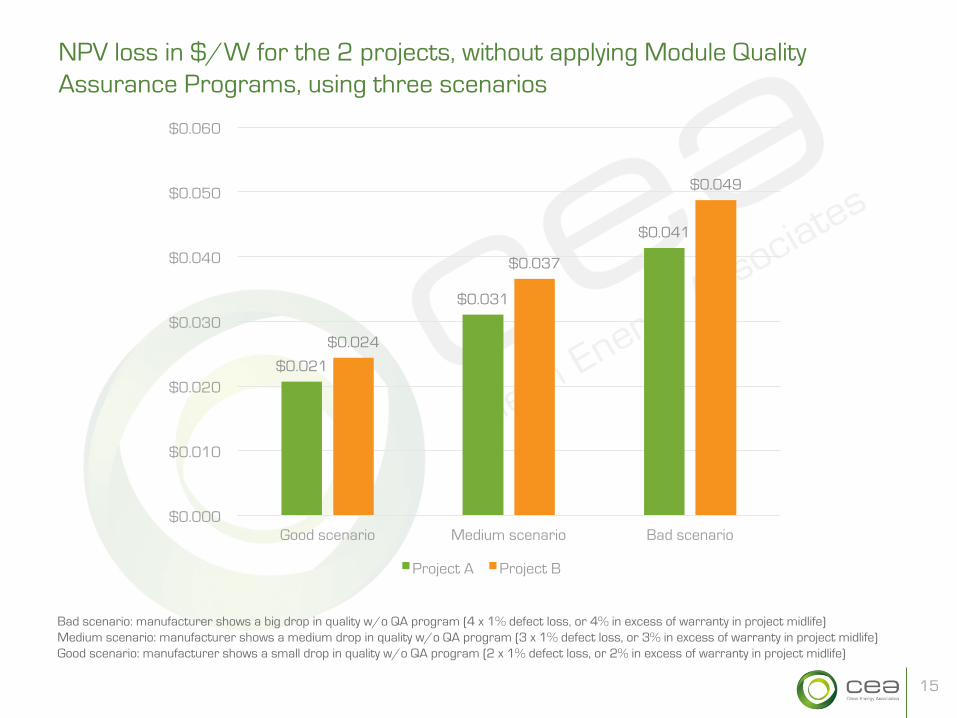
NPV loss in $/W for the 2 projects, without applying Module Quality Assurance Programs, using three scenarios
15
$0.021
$0.031
$0.041
$0.024
$0.037
$0.049
$0.000
$0.010
$0.020
$0.030
$0.040
$0.050
$0.060
Good scenario Medium scenario Bad scenario
Project A Project B
Bad scenario: manufacturer shows a big drop in quality w/o QA program (4 x 1% defect loss, or 4% in excess of warranty in project midlife) Medium scenario: manufacturer shows a medium drop in quality w/o QA program (3 x 1% defect loss, or 3% in excess of warranty in project midlife) Good scenario: manufacturer shows a small drop in quality w/o QA program (2 x 1% defect loss, or 2% in excess of warranty in project midlife)
The information herein has been prepared by CEA solely for the exclusive use of recipient. No representation, warranty or undertaking, express or implied, is made as to, and no reliance should be placed on, the fairness, accuracy, completeness or correctness of the information or the opinions contained herein. Neither CEA or any of its affiliates, advisors or representatives will be liable (in negligence or otherwise) for any loss howsoever arising from any use of this presentation.
16
Thank you for your attention