module 5, lesson 2 a line in the sand - aphg boot camp · 2020-03-17 · module 5, lesson 2 student...
TRANSCRIPT

Mapping Our World Using ArcGIS Online Module 5, Lesson 2 Student Directions
1
Module 5, Lesson 2
A line in the sand The ever-changing map of the world reflects the forces of conflict and cooperation among nations and peoples of the world. In this activity, you will explore one of the first boundary changes of the twenty-first century—the creation of a new border between Yemen and Saudi Arabia. After more than 60 years of conflict, the two nations signed the historic boundary agreement in June 2000. Using data from the Treaty of Jeddah, you will create a map reflecting the treaty’s territory and analyze underlying physiographic and cultural considerations that influenced the location of the boundary.
Task 1: Open the map
1. If you do not intend to save your work: a) Launch an internet browser. b) Go to this link: c) http://www.arcgis.com/home/webmap/viewer.html?webmap=b7c1fc2db1a840d3bffe01ebb0ef8b63
d) Skip Step 2 and proceed with the lesson. 2. If you wish to save in a Public or Organization account open the document entitled
Introduction – MOW Save Best Practices and follow the directions. The map document opens, and you see a physical map of the world with the Saudi Arabian Peninsula outlined in red.

Mapping Our World Using ArcGIS Online Module 5, Lesson 2 Student Directions
2
3. Click on the Modify Map button on the top right corner above your map.
4. Click on Show Contents of Map in the Table of Contents to the left of the map.
You are now able to see all the map layers available to view with a check mark next to the layer name that tells you the World physical map and Arabian Peninsula layers are turned on and visible on the map.
Task 2: Identify countries that border the Arabian Peninsula
5. Click the Bookmarks button and choose Arabian Peninsula. Now the Arabian Peninsula fills the view.
6. Look in the table of contents for a layer called “Neighbors - outline.” Click the box to
the left of the layer name to turn it on.
7. Click on any neighbor country on the map to display the country names in the popup box.
Q1: What countries border the Arabian Peninsula to the north?
Task 3: Investigate the physical characteristics of the Arabian Peninsula
The map on your screen is a shaded relief map. It depicts landforms such as mountain ranges, valleys, plateaus, and plains.
Q2: Is any part of the Arabian Peninsula mountainous? Q3: If so, where are the mountains located?
8. Turn on the Bodies of Water and Streams layers by clicking on the box to the left of
those two layers. 9. If necessary, zoom in one or two levels to see the streams and bodies of water
Answers to questions in this activity should be recorded on the answer sheet.

Mapping Our World Using ArcGIS Online Module 5, Lesson 2 Student Directions
3
display on the map. 10. Pan around the map to look at where the streams are located on the Arabian
Peninsula. Most of the streams you see on your map are intermittent, which means that they are dry during some parts of the year.
Q4: Are there any parts of the Arabian Peninsula that do not have any water at all?
If so, where are these regions?
Q5: Do you see any relationship between landforms and the availability of water?
11. Turn off the Streams layer and observe the distribution of permanent bodies of water on the Arabian Peninsula.
12. Zoom in one more level. Now you can see the bodies of water more closely. If you zoom in too far, your shaded relief map will disappear. Just zoom back out one level at a time until your map reappears.
Q6: Describe the bodies of water in terms of their connectedness or disconnectedness.
13. Click on the Bookmarks button to return to your view of the entire peninsula. Your map display should look like this one.
14. Turn off the Water layer.
15. Turn on the Annual Precipitation layer.
Amounts of rainfall are given in millimeters in the map document. The following table shows

Mapping Our World Using ArcGIS Online Module 5, Lesson 2 Student Directions
4
what some measurements in millimeters would be equivalent to in inches (25.4 mm = 1 in.).
Q7: A desert is defined as a place that gets less than 10 inches of rain per year.
How many millimeters equal 10 inches?
Q8: Based on the amounts of rainfall displayed on the map, do you think there is much farming on the Arabian Peninsula? Explain.
Q9: Approximately what percentage of the Arabian Peninsula is desert?
16. Turn off Annual Precipitation. Turn on the Temperature Temp: Sept. – Nov. layer.
Temperatures are given in degrees Celsius in the map document. The following table shows what some measurements in degrees Celsius would be equivalent to in degrees Fahrenheit.
Q10: What is the approximate range of temperatures across the Arabian Peninsula during September through November?
The three Temp layers below “Temp: Sept. - Nov.” display temperature information for the periods December–February, March–May, and June–August.
17. Turn the temperature layers on and off one at a time to see the change of temperatures on the Arabian Peninsula through the four seasons.
Q11: Which season is the hottest?
Q12: What is the approximate range of temperatures across the Arabian Peninsula during the hottest season?
18. Turn off the Temperature group. Turn on the Ecozones layer and expand its legend by clicking the name of the layer in the Contents.
Q13: What relationship do you see between the Arabian Peninsula’s ecozones and its patterns of landforms, precipitation, and temperature?

Mapping Our World Using ArcGIS Online Module 5, Lesson 2 Student Directions
5
Q14: Use your answers from previous questions and turn different layers on and off
to come up with three observations for each physical characteristic in the table on the answer sheet.
Q15: In your opinion, which of the region’s physical characteristics would be considered “valuable” in a boundary decision? Explain.
Task 4: Investigate the population characteristics of the Arabian Peninsula The population of the Arabian Peninsula is approximately 57 million. The majority of this population lives in Saudi Arabia (27.5 million) and Yemen (22 million). The remaining 7.5 million live in Oman, the United Arab Emirates, and Qatar.
19. Turn off Ecozones. Turn on the “Arabian Peninsula – names” layer. This layer identifies the countries by name but does not show their borders (you will explore the borders of these countries later in the activity).
20. Turn on the Agriculture layer. Click on the Agriculture layer name to expand the legend to see the types of agricultural activity on the Arabian Peninsula.
Q16: What is the principal agricultural activity on the peninsula?
Q17: Based on what you now know about the physical characteristics of the region,
why do you think the agricultural activity is so limited?
21. Turn on and expand the Population Density layer.
Q18: How does Yemen compare to the rest of the Arabian Peninsula in population density?
Mapping Our World Using ArcGIS Online Module 5, Lesson 2 Student Directions
6
Q19: Describe the overall population density of the Arabian Peninsula.
22. Turn off Population Density. Make sure Agriculture is still turned on.
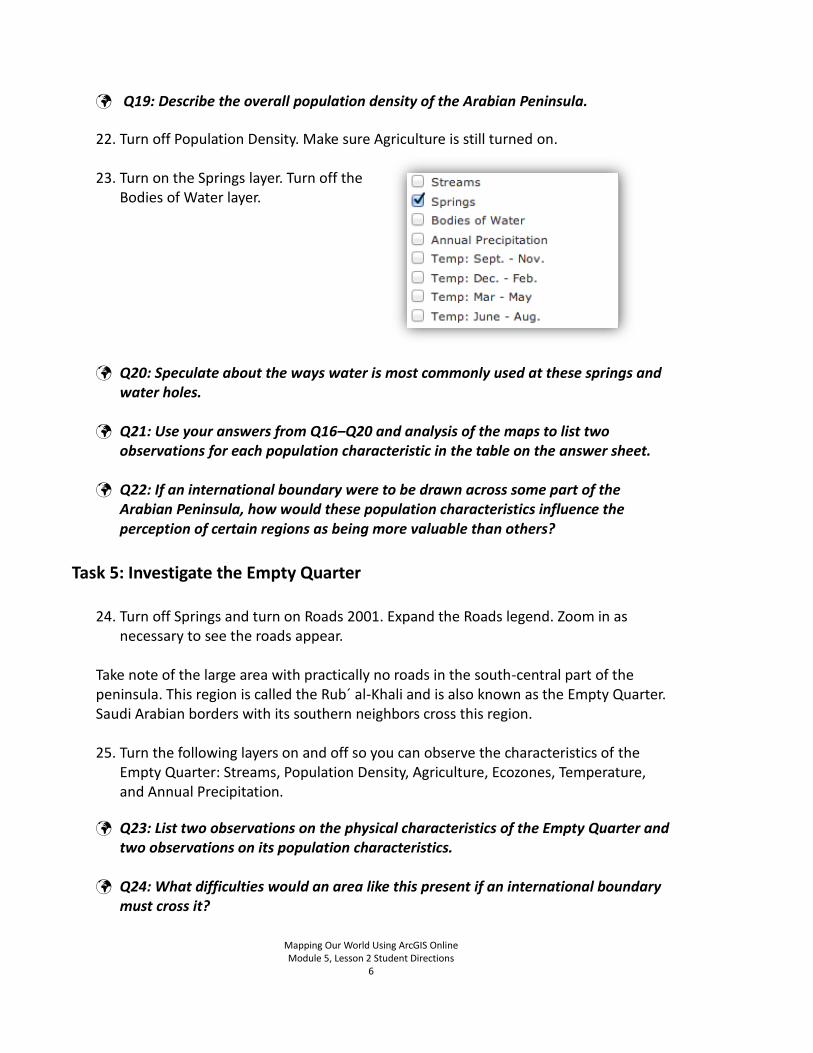
23. Turn on the Springs layer. Turn off the Bodies of Water layer.
Q20: Speculate about the ways water is most commonly used at these springs and water holes.
Q21: Use your answers from Q16–Q20 and analysis of the maps to list two observations for each population characteristic in the table on the answer sheet.
Q22: If an international boundary were to be drawn across some part of the Arabian Peninsula, how would these population characteristics influence the perception of certain regions as being more valuable than others?
Task 5: Investigate the Empty Quarter
24. Turn off Springs and turn on Roads 2001. Expand the Roads legend. Zoom in as necessary to see the roads appear.
Take note of the large area with practically no roads in the south-central part of the peninsula. This region is called the Rub´ al-Khali and is also known as the Empty Quarter. Saudi Arabian borders with its southern neighbors cross this region.
25. Turn the following layers on and off so you can observe the characteristics of the
Empty Quarter: Streams, Population Density, Agriculture, Ecozones, Temperature, and Annual Precipitation.
Q23: List two observations on the physical characteristics of the Empty Quarter and two observations on its population characteristics.
Q24: What difficulties would an area like this present if an international boundary must cross it?

Mapping Our World Using ArcGIS Online Module 5, Lesson 2 Student Directions
7
26. Turn all layers off except the Basemap and Arabian Peninsula - outline.
27. Hover to the right of the Basemap layer and click on the right arrow. Click on Transparency.
28. Drag the slider from 100% to 0% to see the country outlines appear.
Task 6: Explore Saudi Arabia’s southern boundaries
Boundaries define a country’s size and shape, or territorial morphology, which may be related to the cohesiveness of that country. Small compact nations or ones that are circular or hexagonal, for example, are likely to be more united than ones that are elongated or fragmented.
29. Turn on the 20th Century Boundary layer. This layer reflects the boundary agreements Saudi Arabia made with most of its southern neighbors at the end of the twentieth century.
Q25: Are the boundaries what you expected them to be?
Q26: Which boundary remained unsettled?
According to international boundary expert Richard Schofield, this boundary was “the last missing fence in the desert.” The only part of the boundary that was mutually agreed upon was the western area adjacent to the Red Sea. Over the years, the boundary has shifted. You will now add layers that reflect some of the major boundary changes.

Mapping Our World Using ArcGIS Online Module 5, Lesson 2 Student Directions
8
30. Turn on the Yemen1 layer and look at the red line of Yemen1.
31. This line represents the boundary between Yemen and Saudi Arabia established by the Treaty of Ta’if in 1934. It is the only part of the boundary that both countries recognized at the turn of the twenty-first century.
32. Turn on Yemen2.
The green line of Yemen2 represents the Saudi–Yemeni border recognized by Yemen at the end of the twentieth century. It is based on lines established when a portion of Yemen called the Aden Protectorate was under British control in the early twentieth century. Most maps used these lines to delineate the extent of Yemen prior to 2000. This boundary was not recognized by Saudi Arabia.
33. Turn on Yemen3.
This purple line represents the Saudi–Yemeni border claimed by Saudi Arabia at the end of the twentieth century. It is based on lines established by the Saudis in the mid-1930s. This line was still being used on Saudi Arabian maps to represent the boundary in the 1990s.
34. Click on the Bookmarks button and then click on Yemen to zoom unto the country of Yemen. Click the layer Yemen in the Table of Contents. Now the map is centered on the country of Yemen.
Q27: What does the area between the green and purple lines represent?
35. Turn on Agriculture and expand its legend.
Q28: What is the principal economic activity of the regions in dispute?
36. Turn off Agriculture and turn on and expand Population Density.
Q29: Describe the population distribution in the disputed territory.
If you were asked to settle the boundary dispute between Saudi Arabia and Yemen, where would you draw the line? You will now draw a proposed boundary between Saudi Arabia and Yemen.
37. Turn off Population Density.
Mapping Our World Using ArcGIS Online Module 5, Lesson 2 Student Directions
9
38. Click on Bookmarks and choose Yemen to zoom out to the entire country.
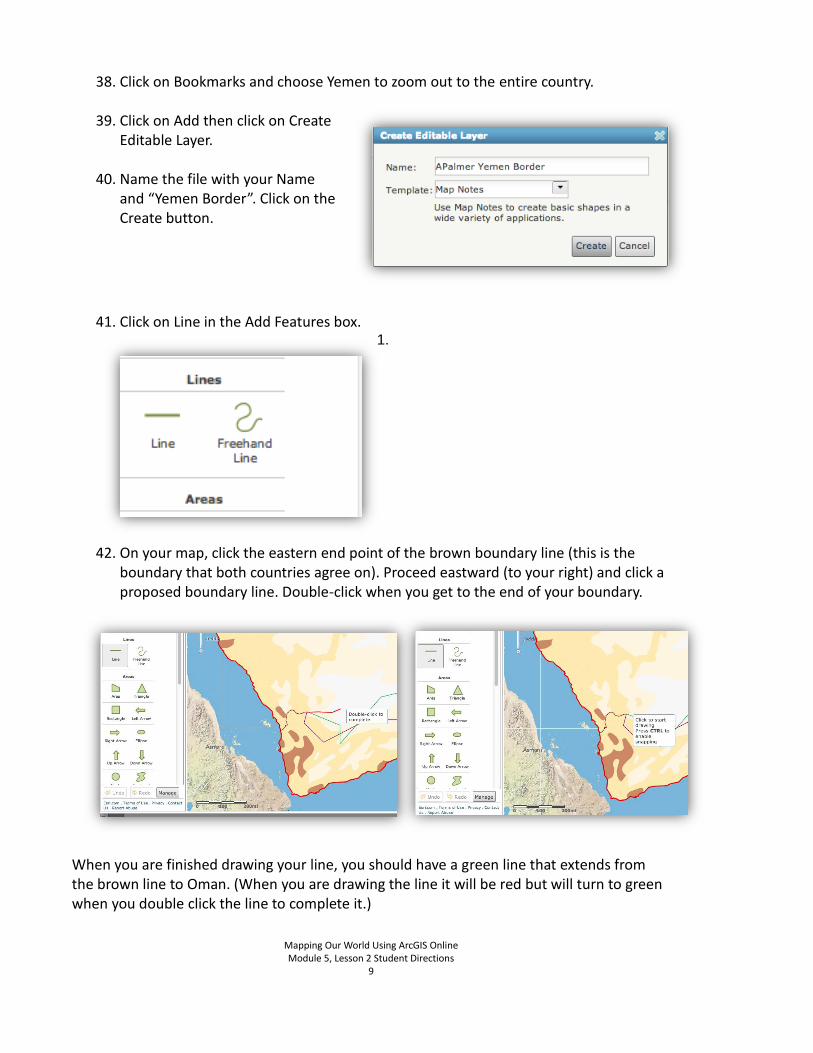
39. Click on Add then click on Create Editable Layer.
40. Name the file with your Name and “Yemen Border”. Click on the Create button.
41. Click on Line in the Add Features box. 1.
42. On your map, click the eastern end point of the brown boundary line (this is the
boundary that both countries agree on). Proceed eastward (to your right) and click a proposed boundary line. Double-click when you get to the end of your boundary.
When you are finished drawing your line, you should have a green line that extends from the brown line to Oman. (When you are drawing the line it will be red but will turn to green when you double click the line to complete it.)
Mapping Our World Using ArcGIS Online Module 5, Lesson 2 Student Directions
10
Task 7: Draw the Saudi-Yemeni boundary
In June of 2000, Saudi Arabia and Yemen signed the Treaty of Jeddah, which settled their 65-year-long boundary dispute. The boundary agreement had three parts. The first part of the treaty reaffirmed agreement on the 1934 Ta’if line (the Yemen1 line). The agreement did say, however, that the line would be amended in any place where it cuts through villages.
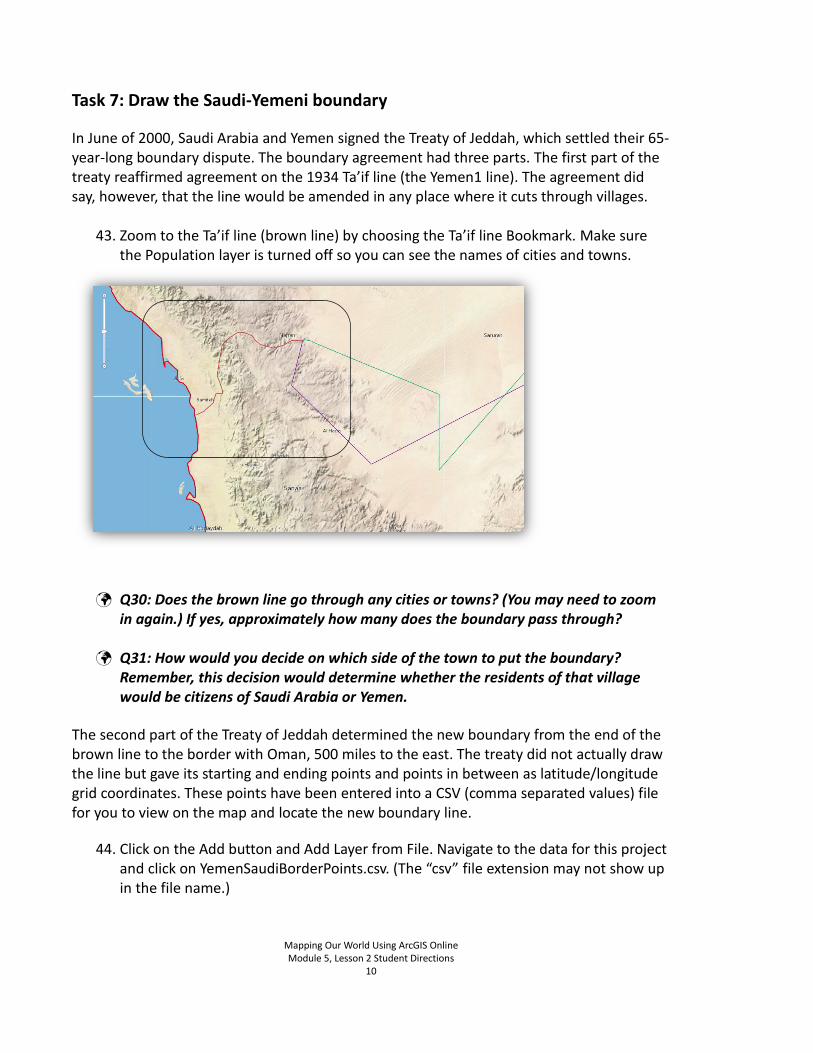
43. Zoom to the Ta’if line (brown line) by choosing the Ta’if line Bookmark. Make sure the Population layer is turned off so you can see the names of cities and towns.
Q30: Does the brown line go through any cities or towns? (You may need to zoom in again.) If yes, approximately how many does the boundary pass through?
Q31: How would you decide on which side of the town to put the boundary? Remember, this decision would determine whether the residents of that village would be citizens of Saudi Arabia or Yemen.
The second part of the Treaty of Jeddah determined the new boundary from the end of the brown line to the border with Oman, 500 miles to the east. The treaty did not actually draw the line but gave its starting and ending points and points in between as latitude/longitude grid coordinates. These points have been entered into a CSV (comma separated values) file for you to view on the map and locate the new boundary line.
44. Click on the Add button and Add Layer from File. Navigate to the data for this project and click on YemenSaudiBorderPoints.csv. (The “csv” file extension may not show up in the file name.)

Mapping Our World Using ArcGIS Online Module 5, Lesson 2 Student Directions
11
45. Click on Import Layer.
46. Repeating the previous procedures, draw a line connecting the GPS coordinates you just added. In this step just add the coordinates on LAND. Name your new layer “yourname Saudi Yemen Boundary Land”
Q32: Does the new line seem to favor Yemen or Saudi Arabia? Explain.
Task 8: Add the maritime portion of the boundary The third and final part of the Treaty of Jeddah clarified the maritime boundary between Saudi Arabia and Yemen. A maritime boundary defines the offshore limits of a country. It too was defined by a series of latitude/longitude grid coordinates.
47. Follow the procedure you just used above to draw the land border to now map the maritime boundary between Saudi Arabia and Yemen.
48. Click the zoom out bar once or until you can see the Maritime boundary you just drew.
Q33: What body of water does the maritime boundary traverse?
Q34: How does the actual boundary established by the Treaty of Jeddah compare with the boundary you drew earlier (black line)?
Q35: Write three observations about the boundary line created by the Treaty of Jeddah (turn on Agriculture and Population Density as needed).
Task 9: Define the pastoral area

Mapping Our World Using ArcGIS Online Module 5, Lesson 2 Student Directions
12
The Treaty of Jeddah included additional provisions about the new Saudi–Yemeni boundary. One of these was the creation of a “pastoral area” on either side of the boundary. Shepherds from either Yemen or Saudi Arabia are allowed to use the pastoral area and water sources on both sides of the border according to tribal traditions. The treaty declared that the pastoral area extends 20 kilometers on either side of the border. Think about how much land the 20-kilometer pastoral area would cover. (The 20 kilometer area on both sides of the border you drew is called a buffer in GIS.) You may want to measure that distance with the measure tool to get an idea of how much space that is on each side of the border.
Q36: How many miles is 20 kilometers? (1 kilometer = 0.6214 miles)
Q37: In which portion of the Saudi–Yemeni border will the pastoral area be most significant? Explain.
Q38: Why do you think the Treaty of Jeddah created a pastoral area?
In this lesson, you explored physical and population characteristics of the Arabian Peninsula. After analyzing this data, you explored boundary issues in this region and plotted the new Yemeni–Saudi boundary established by the 2000 Treaty of Jeddah.