module 1 principles and application
TRANSCRIPT
DOE-STD-1153-2002
A Graded Approach forEvaluating Radiation Doses toAquatic and Terrestrial Biota
MODULE 1
PRINCIPLES ANDAPPLICATION
MO
DU
LE
1:P
RIN
CIP
LE
SA
ND
AP
PL
ICA
TIO
N

DOE-STD-1153-2002
INTENTIONALLY BLANK
DOE-STD-1153-2002
M1-1
1 Introduction
The U.S. Department of Energy (DOE) is accountable to Congress and the public for the safeconduct of its activities, including facility operation, waste management and disposal activities,and remediation of environmental contamination. These routine activities may result inreleases of radionuclides to the air and water, accumulation of radionuclides in soil andsediment, and the potential for plants, animals, and members of the public to be exposed toradiation. DOE Order 5400.5, “Radiation Protection of the Public and the Environment”(1990a), lists the environmental radiation protection requirements that DOE and DOE-contractor employees must meet to protect aquatic animals. In addition, dose limits belowwhich deleterious effects on populations of aquatic and terrestrial organisms have not beenobserved, as discussed by the National Council on Radiation Protection and Measurements(NCRP 1991), and the International Atomic Energy Agency (IAEA 1992), are considered byDOE to be relevant to the protection of all aquatic and terrestrial biota on DOE sites.
1.1 Purpose
This DOE technical standard provides a graded approach (including screening methods andmethods for detailed analyses) and related guidance that DOE and DOE contractors may useto evaluate compliance with specified limits on radiation dose to populations of aquatic animals,terrestrial plants, and terrestrial animals due to anthropogenic sources at DOE sites.Specifically, the technical standard provides dose evaluation methods that can be used to meetthe requirements for protection of biota in DOE Orders 5400.1, "General EnvironmentalProtection Program" (DOE 1990b), 5400.5 (DOE 1990a), and the dose limits for protection ofbiota developed or discussed by the NCRP (1991) and IAEA (1992). Accordingly, this technicalstandard uses the biota dose limits specified below within a graded approach to demonstratethat populations of plants and animals are adequately protected from the effects of ionizingradiation:
C Aquatic Animals. The absorbed dose to aquatic animals should not exceed 1 rad/d(10 mGy/d) from exposure to radiation or radioactive material releases into the aquaticenvironment. This dose limit is specified in DOE Order 5400.5.
C Terrestrial Plants. The absorbed dose to terrestrial plants should not exceed 1 rad/d(10 mGy/d) from exposure to radiation or radioactive material releases into the terrestrialenvironment.
C Terrestrial Animals. The absorbed dose to terrestrial animals should not exceed 0.1 rad/d(1 mGy/d) from exposure to radiation or radioactive material releases into the terrestrialenvironment.
Avoiding measurable impairment of reproductive capability is deemed to be the criticalbiological endpoint of concern in establishing the dose limits for aquatic and terrestrial biota.Module 1, Section 1.2.2 discusses this issue further. Guidance for interpreting and applying
DOE-STD-1153-2002
M1-2
these dose limits with respect to the length of time and geographic area over which actualdoses should be compared with the limits is provided in Module 2, Section 3.
DOE has proposed these dose limits for aquatic and terrestrial biota under proposed ruleTitle 10, Code of Federal Regulations, Part 834 (10 CFR 834), “Radiation Protection of thePublic and the Environment” (DOE 1993). DOE has decided not to promulgate these doselimits until guidance for demonstrating compliance has been developed. Consequently, thistechnical standard was developed, in part, in response to comments and recommendationsreceived by DOE through the proposed rule comment period. Principal themes in thecomments included: (1) requests for development of cost-effective methods to support the useof DOE's existing and proposed biota dose limits, (2) support for a multi-tiered approach toinclude screening, (3) requests for guidance on biota monitoring, and (4) requests fordevelopment of a generic method to promote consistency, while retaining some flexibility forsite-specific methods and information. These themes served as the guiding principles fordevelopment of the methods contained in this technical standard.
The specific methods and guidance in this technical standard are acceptable for use by DOEand DOE-contractors when evaluating doses to biota in relation to the above dose limits.The methods and guidance in this technical standard should also be useful to ecological riskassessors who must evaluate risks to biota from radionuclides that occur on DOE sites. Usingthe graded approach provided in this technical standard, risk assessors can use soil, sediment,and water radionuclide concentration data to determine whether radionuclide concentrations ata site are likely to result in doses in excess of those listed above and would, therefore, have thepotential to impact resident populations of plants and animals. The methods can also give riskassessors an immediate qualitative assessment of the importance of doses of ionizing radiationto the resident receptors. The dose equations in this technical standard also provide methodsof estimating upper-bound (e.g., conservatively derived) doses to specific plants and animals.Refer to Module 1, Section 3, for a description of intended and potential applications of theDOE graded approach.
1.2 Background
1.2.1 Increasing Interest and Need for Biota Dose Evaluation Methods
There is growing national and international interest in establishing a regulatory framework (e.g.,to include standards or criteria) and supporting evaluation methodologies for demonstratingprotection of the environment from the effects of ionizing radiation. Regarding environmentalprotection, the ICRP statement that "...if man is adequately protected then other living thingsare also likely to be sufficiently protected" (ICRP 1977; 1991) uses human protection to inferenvironmental protection from the effects of ionizing radiation. This assumption is mostappropriate in cases where humans and other biota inhabit the same environment and havecommon routes of exposure, and less appropriate in cases where human access is restricted orpathways exist that are much more important for biota than for humans. The inclusion of
DOE-STD-1153-2002
M1-3
Benefits of a Screening Process
“A multi-tiered screening approach is normally used inecological risk assessments. Screening may also be apotentially cost-effective and easy way ofdemonstrating compliance with radiation criteria orstandards for protection of the environment. Screeningvalues should be used to identify radionuclides insituations of concern, and to determine whether theseradionuclides warrant further assessment, or if they areat levels that require no further attention. In practice,this initial screening is expected to be sufficient in themajority of cases. When initial screening fails,additional analysis or assessment may be needed. Atwo- or three-tiered scheme would help ensure that themagnitude of the assessment effort would be scaled tothe likelihood and severity of environmental impacts.”
From: IAEA-TECDOC-1091, Protection of theEnvironment from the Effects of Ionizing Radiation: AReport for Discussion (July 1999)
radiation as a stressor within ecological risk assessments is also a consideration. Ecologicalrisk assessments at contaminated sites being considered for remediation under theComprehensive Environmental Response, Compensation, and Liability Act (CERCLA) generallyrequire an assessment of all stressors, including radiation. Assessments of radiation impactson contaminated ecosystems are currently underway in the U.S. under CERCLA regulations(EPA 1988).
Nationally and internationally, nostandardized methods have beenadopted for evaluating doses anddemonstrating protection of plants andanimals from the effects of ionizingradiation. In 1999, the IAEA conveneda technical committee examiningprotection of the environment from theeffects of ionizing radiation andprovided recommendations anddiscussion points for moving forwardwith the development of protectionframeworks and dose assessmentmethods. The resulting IAEATechnical Document, "Protection ofthe Environment from the Effects ofIonizing Radiation" (1999) referencesmulti-tiered screening as a potentiallycost-effective and easy way ofdemonstrating compliance withradiation criteria for protection of biota.The IAEA has subsequently hosted aseries of Specialists’ Meetings on radiological protection of the environment, and the NuclearEnergy Agency (NEA) and the ICRP have sponsored a series of fora on this issue. It is hopedthat the methods and guidance provided in this DOE technical standard will serve as a platformfor national and international discussion of radiation protection frameworks, standards, anddose assessment methods for biota.
1.2.2 Basis for Biota Dose Limits Applied in this Technical Standard
A dose limit for controlling radiological impacts from DOE activities to native aquatic animals isspecified in DOE Order 5400.5. At present, DOE Orders do not specify dose limits forterrestrial organisms. However, an intended objective of DOE Orders 5400.1 and 5400.5 is toprotect the aquatic and terrestrial environment, including populations of plants and animals,within and beyond the boundaries of DOE sites from impacts of routine DOE activities. Thedose limits in this technical standard are consistent with (a) the intent of DOE Orders 5400.1
DOE-STD-1153-2002
M1-4
and 5400.5, (b) the dose limit for aquatic animals specified in DOE Order 5400.5, and(c) findings of the IAEA and NCRP regarding doses below which deleterious effects onpopulations of aquatic and terrestrial organisms have not been observed. They are alsoconsistent with the intent of the IAEA document, “The Principles of Radioactive WasteManagement” (IAEA 1995), in which Principle 2 states that “radioactive waste shall be managedin such a way as to provide an acceptable level of environmental protection.” The backgroundfor the dose limits for aquatic and terrestrial biota is briefly discussed below. These dose limitsrepresent expected safe levels of exposure, and are consensus No Adverse Effects Levels(NOAELs) for effects on population-relevant attributes in natural populations of biota.
1.2.2.1 Aquatic Organisms
At the request of DOE, the NCRP (1991) reviewed the literature on the effects of radiation onaquatic organisms and prepared a report on the then-current understanding of such effects.The report also provided guidance for protecting populations of aquatic organisms, concludingthat a chronic dose of no greater than 1 rad/d (0.4 mGy/h) to the maximally exposed individualin a population of aquatic organisms would ensure protection of the population.
The IAEA examined and summarized the conclusions regarding aquatic organisms of severalprevious reviews (IAEA 1992):
• Aquatic organisms are no more sensitive than other organisms; however, because theyare poikilothermic animals, temperature can control the time of expression of radiationeffects.
• The radiosensitivity of aquatic organisms increases with increasing complexity, that is,as organisms occupy successively higher positions on the phylogenetic scale.
• The radiosensitivity of many aquatic organisms changes with age, or, in the case ofunhatched eggs, with the stage of development.
• Embryo development in fish and the process of gametogenesis appear to be the mostradiosensitive stages of all aquatic organisms tested.
• The radiation-induced mutation rate for aquatic organisms appears to be between thatfor Drosophila (fruit flies) and mice.
Furthermore, the 1992 review found that the conclusions of an earlier IAEA review (1976) werestill supported; namely, that appreciable effects in aquatic populations would not be expected atdoses lower than 1 rad/d (10 mGy/d) and that limiting the dose to the maximally exposedindividuals to less than 1 rad/d would provide adequate protection of the population.
DOE-STD-1153-2002
M1-5
1.2.2.2 Terrestrial Organisms
The IAEA (1992) summarized information about the effects of acute ionizing radiation onterrestrial organisms as follows:
• Reproduction (encompassing the processes from gametic formation through embryonicdevelopment) is likely to be the most limiting endpoint in terms of survival of thepopulation.
• Lethal doses vary widely among different species, with birds, mammals, and a few treespecies being the most sensitive among those considered.
• Acute doses of 10 rad (100 mGy) or less are very unlikely to produce persistent andmeasurable deleterious changes in populations or communities of terrestrial plants oranimals.
The IAEA (1992) also summarized information about the effects of chronic radiation onterrestrial organisms:
• Reproduction (encompassing the processes from gametogenesis through embryonicdevelopment) is likely to be the most limiting endpoint in terms of populationmaintenance.
• Sensitivity to chronic radiation varies markedly among different taxa; certain mammals,birds, reptiles, and a few tree species appear to be the most sensitive.
• In the case of invertebrates, indirect responses to radiation-induced changes invegetation appear more critical than direct effects.
• Irradiation at chronic dose rates of 1 rad/d (10 mGy/d) or less does not appear likely tocause observable changes in terrestrial plant populations.
• Irradiation at chronic dose rates of 0.1 rad/d (1 mGy/d) or less does not appear likely tocause observable changes in terrestrial animal populations. The assumed threshold foreffects in terrestrial animals is less than that for terrestrial plants, primarily becausesome species of mammals and reptiles are considered to be more radiosensitive.
• Reproductive effects on long-lived species with low reproductive capacity may requirefurther consideration.
The NCRP and IAEA concluded for aquatic organisms and the IAEA concluded for terrestrialorganisms that the statement by the ICRP (1977; 1991), "...if man is adequately protected, thenother living things are also likely to be sufficiently protected" was reasonable within the

DOE-STD-1153-2002
M1-6
limitations of the generic exposure scenarios examined. A similar assessment was made at aDOE-sponsored workshop (Barnthouse 1995) held to evaluate the adequacy of existing effectsdata and approaches to radiation protection of aquatic and terrestrial organisms to supportmoving forward with setting regulatory limits. DOE workshop participants agreed thatprotecting humans generally protects biota, except under the following conditions: (1) humanaccess to a contaminated area is restricted but access by biota is not restricted, (2) uniqueexposure pathways exist for plants and animals that do not affect exposure of humans, (3) rareor endangered species are present, or (4) other stresses on the plant or animal population aresignificant.
1.2.2.3 Additional Summaries and Reviews of Radiation Effects Data on Biota ConfirmingNCRP and IAEA Findings
UNSCEAR. In 1996, the United Nations Scientific Committee on the Effects of AtomicRadiation (UNSCEAR) summarized and reviewed information on the responses to acute andchronic radiation of plants and animals, both as individuals and as populations (UNSCEAR1996). The conclusions from the UNSCEAR review were consistent with findings andrecommendations made earlier by the NCRP and IAEA concerning biota effects data andappropriate dose limits for protection of biota. In 2002, UNSCEAR reported that these doserate criteria (1 rad/d for aquatic animals and terrestrial plants; 0.1 rad/d for terrestrial animals)remain defensible for protection of populations of plants and animals. The UNSCEAR plans todevelop a new scientific annex to further address radioecology and effects of radiation on theenvironment (Gentner 2002).
UK Environment Agency. In 2001, the Environment Agency of the United Kingdom (UK)conducted a review of the available body of radiation effects data on biota (Copplestone et al.2001). They concluded that it is unlikely that there will be any significant effects in:
• populations of freshwater and coastal organisms at chronic dose rates below 400 uGy/h (or1 rad/d; 10 mGy/d);
• terrestrial plant populations at chronic dose rates below 400 uGy/h (or 1 rad/d; 10 mGy/d);and
• terrestrial animal populations at chronic dose rates below 40 uGy/h (or 0.1 rad/d; 1 mGy/d).
It is noteworthy that the UK Environment Agency’s review findings are largely consistent withthe findings and biota dose recommendations of the NCRP, the IAEA, and UNSCEAR citedabove. Additionally, they concluded that it is unlikely that there will be any significant effects inpopulations of organisms in the deep ocean at chronic dose rates below 1,000 uGy/h (or 2.5rad/d; 25 mGy/d).
DOE-STD-1153-2002
M1-7
ACRP. In 2002, the Advisory Committee on Radiation Protection (ACRP), charged withproviding advice to the Canadian Nuclear Safety Commission (CNSC) regarding approachesneeded for the radiological protection of the environment, provided recommendationsconcerning appropriate dose rate criteria for protection of biota. The ACRP recommended thatthe generic dose rate criterion for protecting biota should be in the range of 1-10 mGy/d (0.1-1rad/d). The ACRP indicated that this dose rate criterion is based on population-level effectsand, given the current state of knowledge and consensus views of radiation effects on biota,represents the level at which ecosystems will suffer no appreciable deleterious effects. Thecriterion is specified in terms of daily dose rather than annual dose. The intent is to avoid, forexample, what would be the annual dose at this dose rate criterion being received in a fewdays. The ACRP further recommended that there should be some flexibility in the averagingtime used in interpreting this dose rate criterion (CNSC-ACRP 2002).
1.2.2.4 Application of Biota Dose Limits as “Dose Rate Guidelines” for Evaluating Dosesto Biota
The biota dose limits specified in this technical standard are based on the current state ofscience and knowledge regarding effects of ionizing radiation on plants and animals. Theyshould not be interpreted as a “bright line” that, if exceeded, would trigger a mandatoryregulatory or remedial action. Rather, they should be interpreted and applied more as “DoseRate Guidelines” that provide an indication that populations of plants and animals could beimpacted from exposure to ionizing radiation and that further investigation and action is likelynecessary.
1.2.3 Protection of Populations
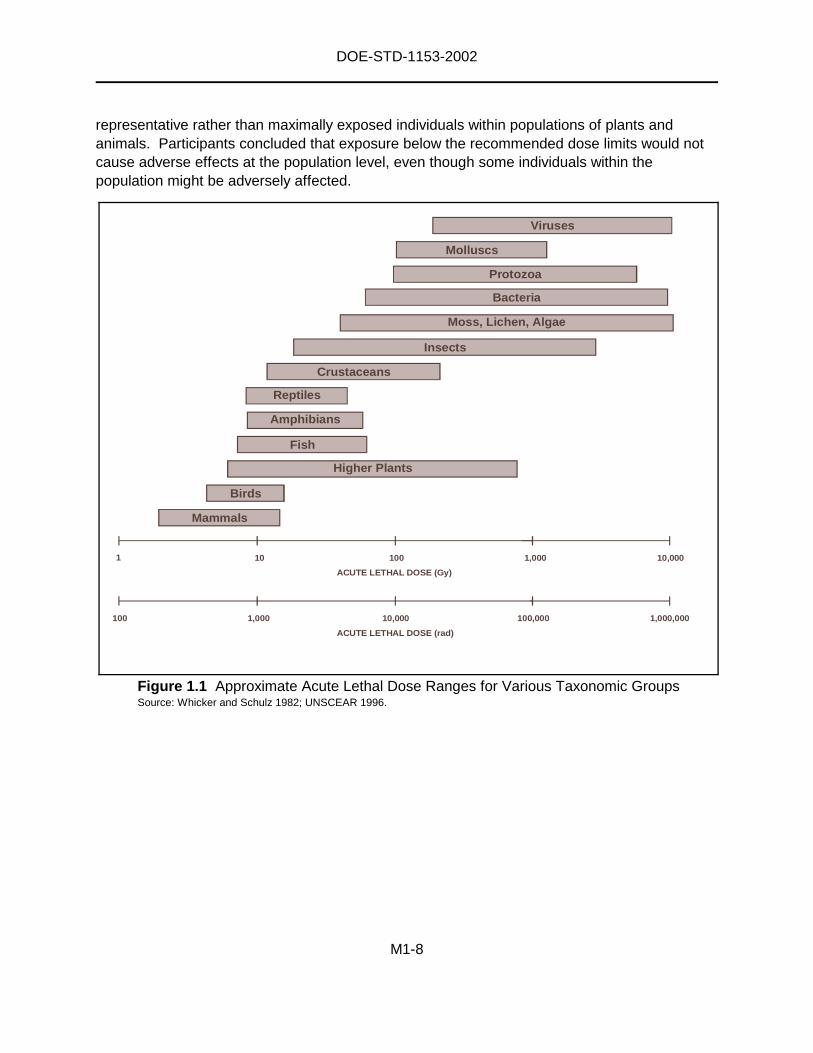
The intent of the graded approach (i.e., the screening and analysis methods) in this technicalstandard is to protect populations of aquatic animals, terrestrial animals, and terrestrial plantsfrom the effects of exposure to anthropogenic ionizing radiation. As noted above, certain taxaare more sensitive to ionizing radiation than others. Based on this observation, it is generallyassumed that protecting the more sensitive taxa will adequately protect other, less sensitivetaxa. Hence, in cases where site-specific evaluations may be required, receptors should beselected that (1) are important to the structure and function of the community, (2) are expectedto receive a comparatively high degree of exposure (e.g., expected to receive a radiation doseto reproductive tissues which is relatively high per unit of radionuclide present in the ecosystem,in comparison with other receptors in the same community), and (3) have a comparatively highdegree of radiosensitivity (e.g., radiation effects of concern occur at relatively low doses, incomparison with other receptors in the same community). Figure 1.1 shows the relativeradiosensitivity of various taxa for both aquatic and terrestrial systems.
Participants at the DOE-sponsored workshop to evaluate the adequacy of existing effects dataand approaches to radiation protection of aquatic and terrestrial organisms (Barnthouse 1995)concluded that existing data support the application of recommended dose limits to
DOE-STD-1153-2002
M1-8
representative rather than maximally exposed individuals within populations of plants andanimals. Participants concluded that exposure below the recommended dose limits would notcause adverse effects at the population level, even though some individuals within thepopulation might be adversely affected.
Viruses
Molluscs
Protozoa
Bacteria
Moss, Lichen, Algae
Insects
Crustaceans
Reptiles
Amphibians
Fish
Higher Plants
Birds
Mammals
ACUTE LETHAL DOSE (Gy)
ACUTE LETHAL DOSE (rad)
1
100
10
1,000
100
10,000
1,000
100,000
10,000
1,000,000
Figure 1.1 Approximate Acute Lethal Dose Ranges for Various Taxonomic GroupsSource: Whicker and Schulz 1982; UNSCEAR 1996.
DOE-STD-1153-2002
M1-9
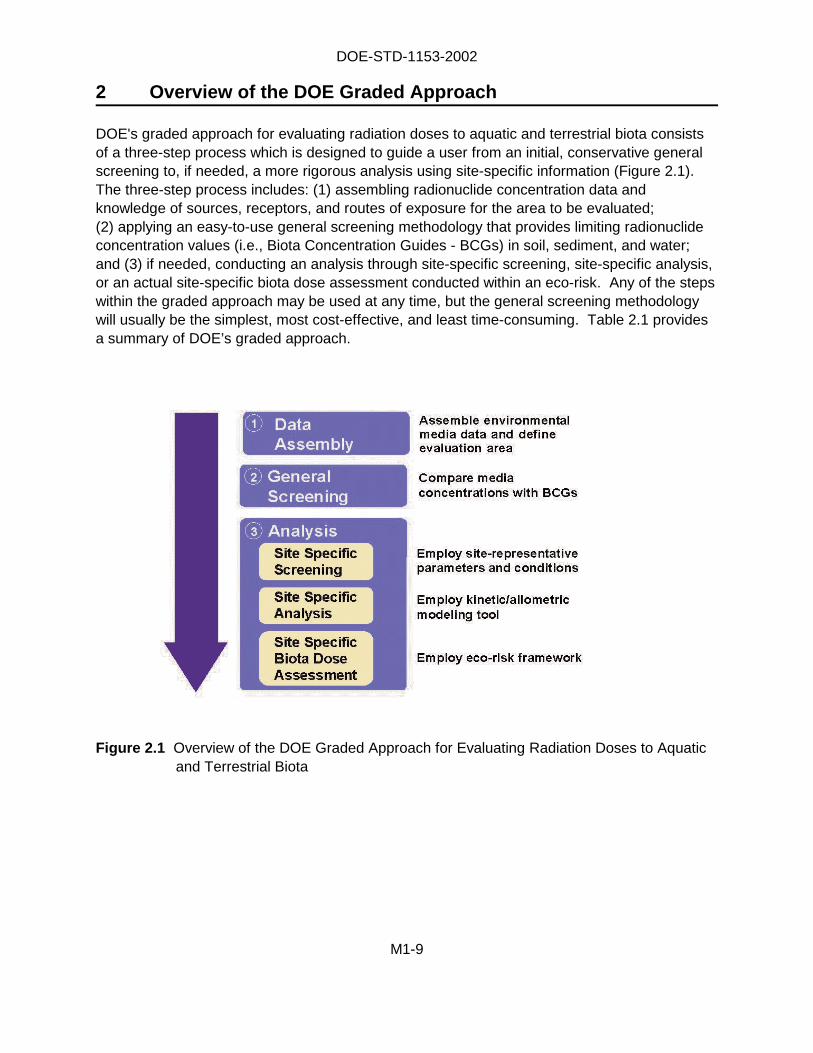
2 Overview of the DOE Graded Approach
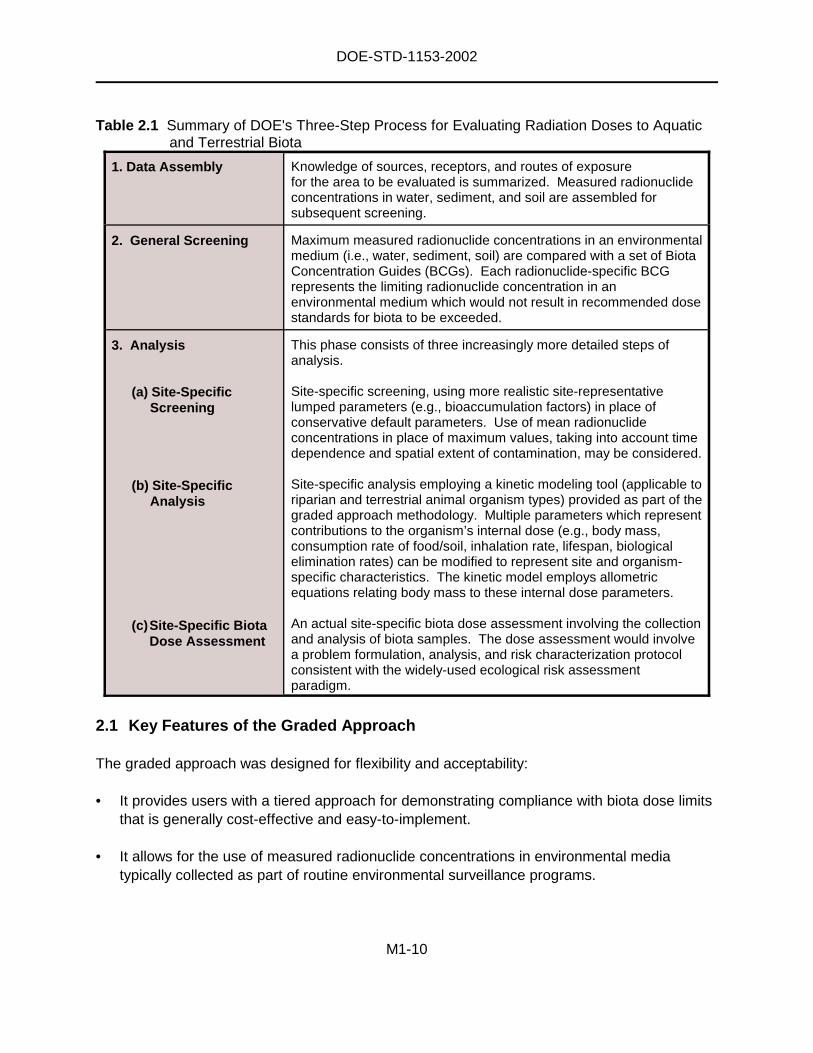
DOE's graded approach for evaluating radiation doses to aquatic and terrestrial biota consistsof a three-step process which is designed to guide a user from an initial, conservative generalscreening to, if needed, a more rigorous analysis using site-specific information (Figure 2.1).The three-step process includes: (1) assembling radionuclide concentration data andknowledge of sources, receptors, and routes of exposure for the area to be evaluated;(2) applying an easy-to-use general screening methodology that provides limiting radionuclideconcentration values (i.e., Biota Concentration Guides - BCGs) in soil, sediment, and water;and (3) if needed, conducting an analysis through site-specific screening, site-specific analysis,or an actual site-specific biota dose assessment conducted within an eco-risk. Any of the stepswithin the graded approach may be used at any time, but the general screening methodologywill usually be the simplest, most cost-effective, and least time-consuming. Table 2.1 providesa summary of DOE’s graded approach.
Figure 2.1 Overview of the DOE Graded Approach for Evaluating Radiation Doses to Aquaticand Terrestrial Biota
DOE-STD-1153-2002
M1-10
Table 2.1 Summary of DOE's Three-Step Process for Evaluating Radiation Doses to Aquaticand Terrestrial Biota
1. Data Assembly Knowledge of sources, receptors, and routes of exposurefor the area to be evaluated is summarized. Measured radionuclideconcentrations in water, sediment, and soil are assembled forsubsequent screening.
2. General Screening Maximum measured radionuclide concentrations in an environmentalmedium (i.e., water, sediment, soil) are compared with a set of BiotaConcentration Guides (BCGs). Each radionuclide-specific BCGrepresents the limiting radionuclide concentration in anenvironmental medium which would not result in recommended dosestandards for biota to be exceeded.
3. Analysis
(a) Site-SpecificScreening
(b) Site-SpecificAnalysis
(c)Site-Specific BiotaDose Assessment
This phase consists of three increasingly more detailed steps ofanalysis.
Site-specific screening, using more realistic site-representativelumped parameters (e.g., bioaccumulation factors) in place ofconservative default parameters. Use of mean radionuclideconcentrations in place of maximum values, taking into account timedependence and spatial extent of contamination, may be considered.
Site-specific analysis employing a kinetic modeling tool (applicable toriparian and terrestrial animal organism types) provided as part of thegraded approach methodology. Multiple parameters which representcontributions to the organism’s internal dose (e.g., body mass,consumption rate of food/soil, inhalation rate, lifespan, biologicalelimination rates) can be modified to represent site and organism-specific characteristics. The kinetic model employs allometricequations relating body mass to these internal dose parameters.
An actual site-specific biota dose assessment involving the collectionand analysis of biota samples. The dose assessment would involvea problem formulation, analysis, and risk characterization protocolconsistent with the widely-used ecological risk assessmentparadigm.
2.1 Key Features of the Graded Approach
The graded approach was designed for flexibility and acceptability:
• It provides users with a tiered approach for demonstrating compliance with biota dose limitsthat is generally cost-effective and easy-to-implement.
• It allows for the use of measured radionuclide concentrations in environmental mediatypically collected as part of routine environmental surveillance programs.
DOE-STD-1153-2002
M1-11
• It is designed for multiple applications. The technical standard is applicable todemonstrations of compliance with biota dose limits and for use in ecological riskassessments of radiological impact.
• It provides a framework that supports the use of site-specific information.
• It incorporates ecological risk assessment concepts and provides guidance for site-specificbiota dose assessments (where needed) employing the widely-used ecological riskassessment (ERA) paradigm.
• All of the equations and resulting BCGs contained in this technical standard have beenencoded into a series of electronic spreadsheets. The spreadsheets were built usingMicrosoft Excel® and incorporate Visual Basic® commands to help guide and automate theuser’s progression through the biota dose evaluation process. Use of these spreadsheets,termed the "RAD-BCG Calculator," is described in Module 1, Sections 4-8. Refer to Module1, Section 4 for an overview of the RAD-BCG Calculator and its contents for use as acompanion tool to this technical standard.
• It provides users with “a place to start” and “an analysis path forward.” The BCGs are notstand-alone. Exceedance of BCGs leads the user to the more-detailed tiers of analysis asneeded in a stepwise manner. These linkages are an integral part of the graded approachframework and are built into the companion software tool, the RAD-BCG Calculator.
2.2 Key Points Regarding Methods Derivation
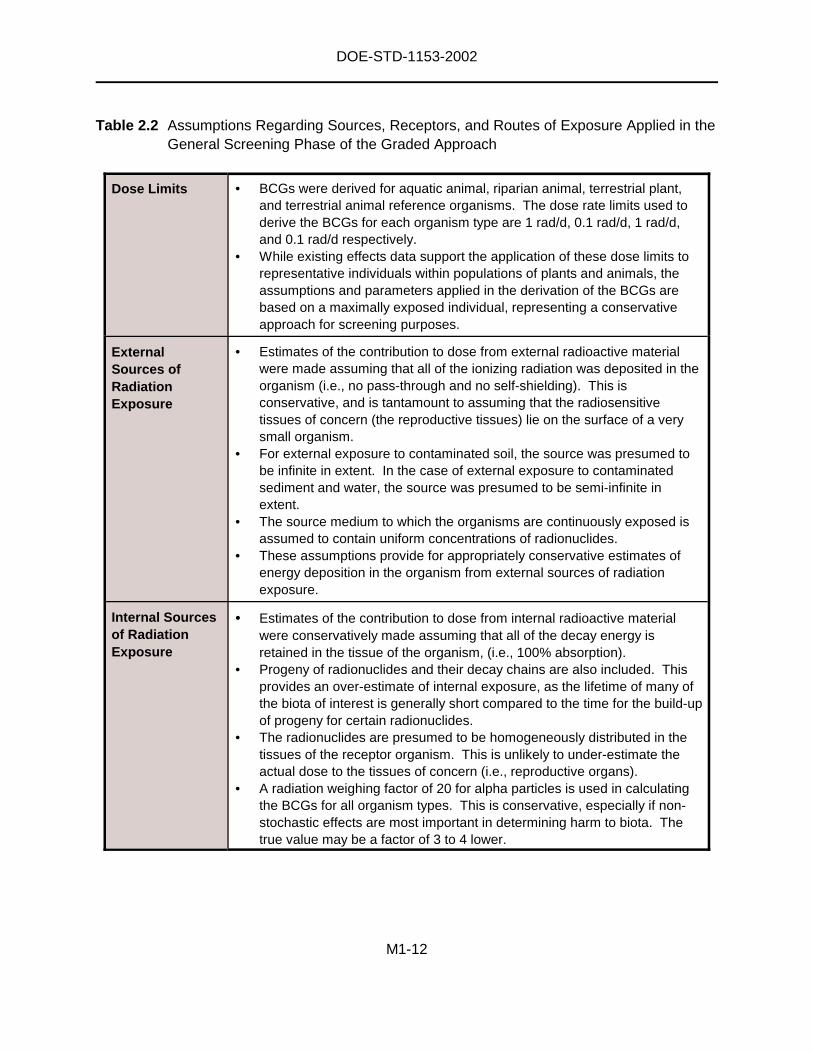
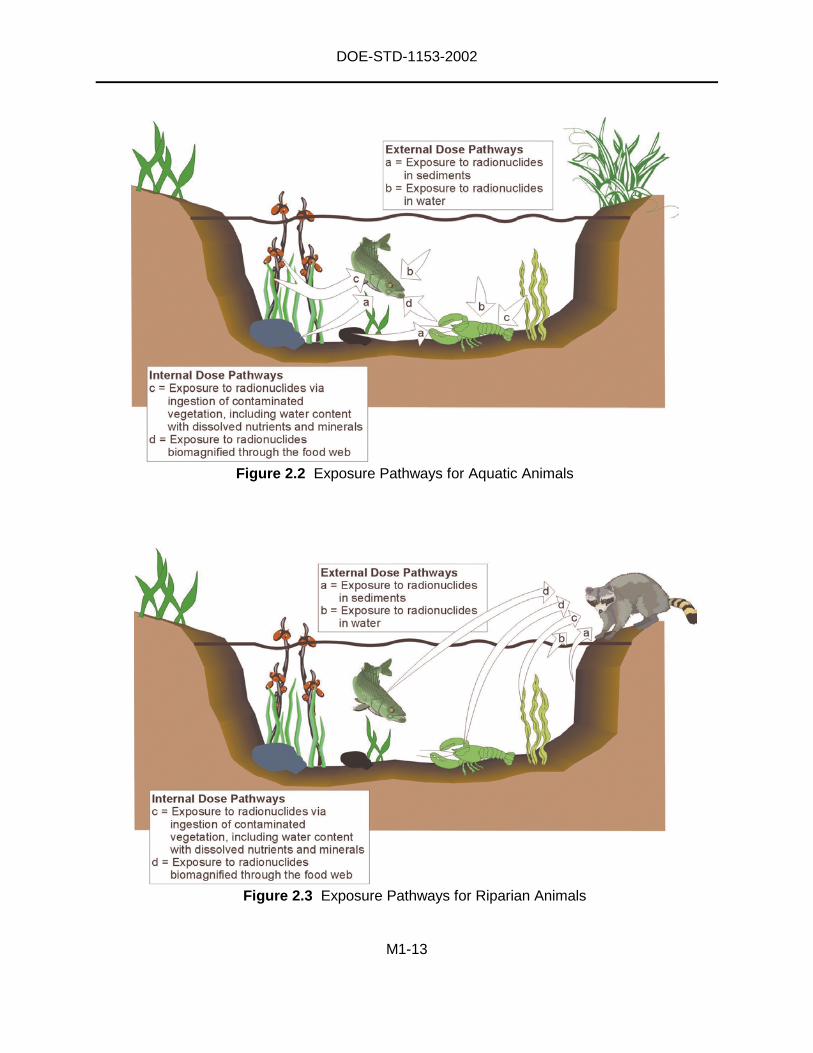
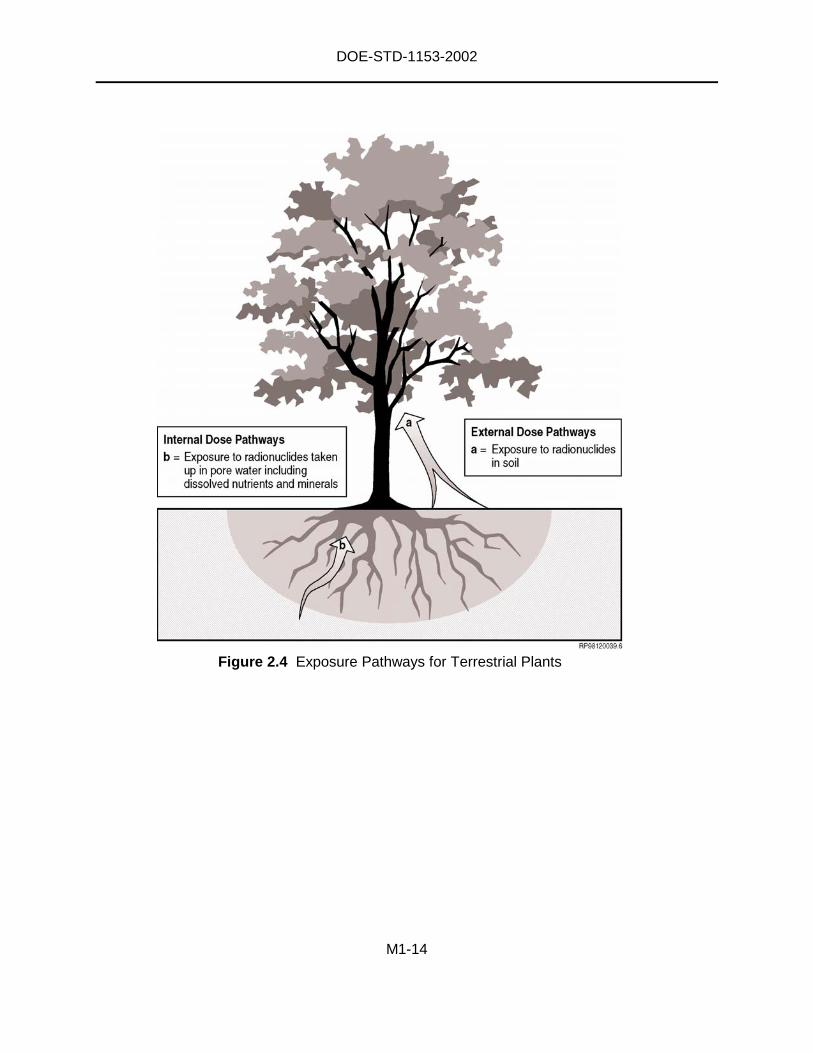
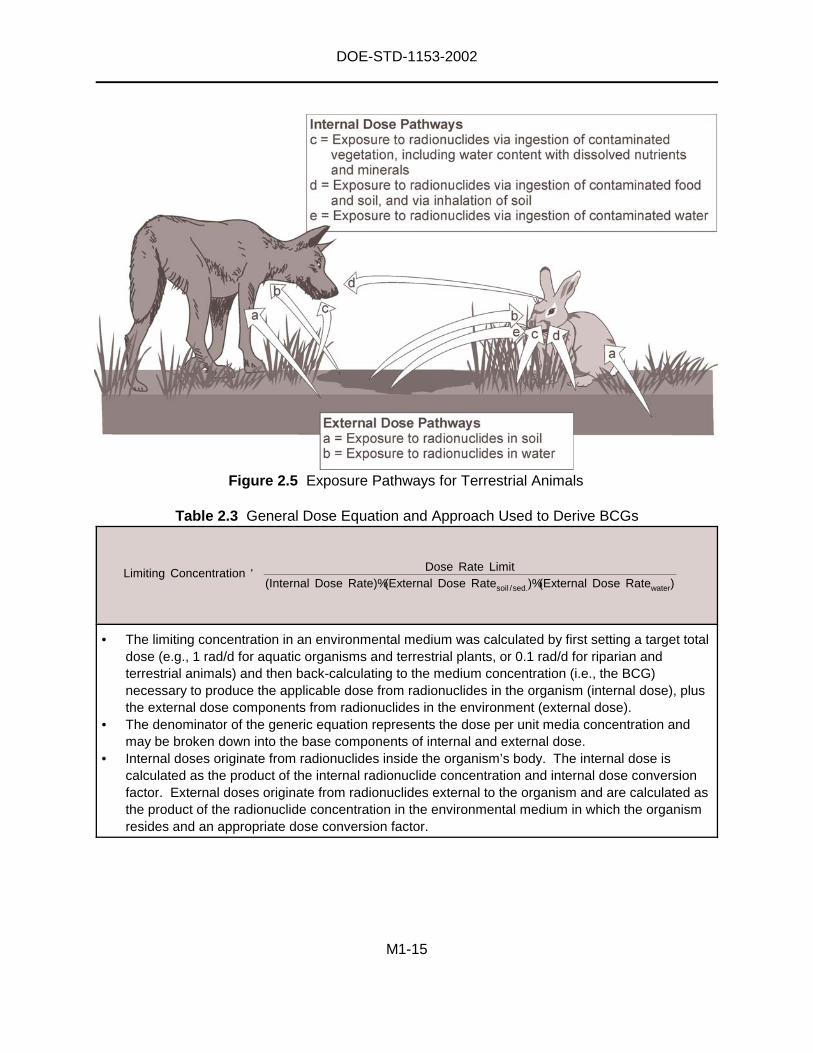
Internal and external sources of dose (and their contributing exposure pathways) areincorporated in the derivation of the graded approach methodology. Sufficient prudence hasbeen exercised in the development of each of the assumptions and default parameter values toensure that the resulting BCGs are appropriately conservative. In the event that an individualdefault parameter value is subsequently found to be an upper-end value but not the “mostlimiting” value for a unique site-specific exposure scenario, the other prudent assumptions anddefault parameter values will ensure that the BCGs (and resultant doses to biota) shouldcontinue to carry the appropriate degree of conservatism for screening purposes. Refer toModule 3 for a detailed description of the derivation of dose equations and default parametersused in the graded approach. Key assumptions used in deriving the BCGs that highlight theconservatism applied in the general screening phase are presented in Table 2.2. Exposurepathways for each of the reference organism types considered in the graded approach arepresented in Figures 2.2 through 2.5. A summary of the general dose equation and approachused to derive the BCGs is provided in Table 2.3.
DOE-STD-1153-2002
M1-12
Table 2.2 Assumptions Regarding Sources, Receptors, and Routes of Exposure Applied in theGeneral Screening Phase of the Graded Approach
Dose Limits • BCGs were derived for aquatic animal, riparian animal, terrestrial plant,and terrestrial animal reference organisms. The dose rate limits used toderive the BCGs for each organism type are 1 rad/d, 0.1 rad/d, 1 rad/d,and 0.1 rad/d respectively.
• While existing effects data support the application of these dose limits torepresentative individuals within populations of plants and animals, theassumptions and parameters applied in the derivation of the BCGs arebased on a maximally exposed individual, representing a conservativeapproach for screening purposes.
ExternalSources ofRadiationExposure
• Estimates of the contribution to dose from external radioactive materialwere made assuming that all of the ionizing radiation was deposited in theorganism (i.e., no pass-through and no self-shielding). This isconservative, and is tantamount to assuming that the radiosensitivetissues of concern (the reproductive tissues) lie on the surface of a verysmall organism.
• For external exposure to contaminated soil, the source was presumed tobe infinite in extent. In the case of external exposure to contaminatedsediment and water, the source was presumed to be semi-infinite inextent.
• The source medium to which the organisms are continuously exposed isassumed to contain uniform concentrations of radionuclides.
• These assumptions provide for appropriately conservative estimates ofenergy deposition in the organism from external sources of radiationexposure.
Internal Sourcesof RadiationExposure
• Estimates of the contribution to dose from internal radioactive materialwere conservatively made assuming that all of the decay energy isretained in the tissue of the organism, (i.e., 100% absorption).
• Progeny of radionuclides and their decay chains are also included. Thisprovides an over-estimate of internal exposure, as the lifetime of many ofthe biota of interest is generally short compared to the time for the build-upof progeny for certain radionuclides.
• The radionuclides are presumed to be homogeneously distributed in thetissues of the receptor organism. This is unlikely to under-estimate theactual dose to the tissues of concern (i.e., reproductive organs).
• A radiation weighing factor of 20 for alpha particles is used in calculatingthe BCGs for all organism types. This is conservative, especially if non-stochastic effects are most important in determining harm to biota. Thetrue value may be a factor of 3 to 4 lower.
DOE-STD-1153-2002
M1-13
Figure 2.2 Exposure Pathways for Aquatic Animals
Figure 2.3 Exposure Pathways for Riparian Animals
DOE-STD-1153-2002
M1-14
Figure 2.4 Exposure Pathways for Terrestrial Plants
DOE-STD-1153-2002
M1-15
Limiting Concentration 'Dose Rate Limit
(Internal Dose Rate)%(External Dose Ratesoil /sed.)%(External Dose Ratewater)
Figure 2.5 Exposure Pathways for Terrestrial Animals
Table 2.3 General Dose Equation and Approach Used to Derive BCGs
• The limiting concentration in an environmental medium was calculated by first setting a target totaldose (e.g., 1 rad/d for aquatic organisms and terrestrial plants, or 0.1 rad/d for riparian andterrestrial animals) and then back-calculating to the medium concentration (i.e., the BCG)necessary to produce the applicable dose from radionuclides in the organism (internal dose), plusthe external dose components from radionuclides in the environment (external dose).
• The denominator of the generic equation represents the dose per unit media concentration andmay be broken down into the base components of internal and external dose.
• Internal doses originate from radionuclides inside the organism’s body. The internal dose iscalculated as the product of the internal radionuclide concentration and internal dose conversionfactor. External doses originate from radionuclides external to the organism and are calculated asthe product of the radionuclide concentration in the environmental medium in which the organismresides and an appropriate dose conversion factor.
DOE-STD-1153-2002
M1-16
The Graded Approach Is a Framework forOrganizing Successively Rigorous Tiers ofAssessment, with a Particular Emphasis onIonizing Radiation.
The graded approach for evaluating radiationdoses to aquatic and terrestrial biota isconsistent with the standard ecological riskassessment (ERA) paradigm (EPA 1998). As inthe standard ERA paradigm, the gradedapproach moves from a simple and relativelyconservative screening evaluation to a moredetailed and realistic assessment. Each step inthe graded approach addresses, either explicitlyor implicitly, the principal ERA components.That is, the graded approach is a framework fororganizing the successively rigorous ERA tiers,but with a particular emphasis on ionizingradiation.
2.3 Relationship of the GradedApproach to Ecological RiskAssessment
The graded approach for evaluating radiationdoses to aquatic and terrestrial biota isconsistent with the standard ecological riskassessment (ERA) paradigm (EPA 1998).The ERA structure provides a process fororganizing and evaluating information todetermine the nature, likelihood, andmagnitude of potential impacts onenvironmental receptors (Suter 1993). Thethree major phases of an ERA are problemformulation, analysis of exposure andeffects, and risk characterization. The ERAis typically done in successively rigoroustiers, each of which includes the threegeneral ERA phases (Suter, Efroymson,Sample & Jones 2000). As in the widely-used ERA paradigm, the graded approach moves from a simple and relatively conservativescreening evaluation to a more detailed and realistic assessment. Each step in the gradedapproach addresses, either explicitly or implicitly, all of the aforementioned ERA components.That is, the graded approach is a framework for organizing the successively rigorous ERA tiers,but with a particular emphasis on ionizing radiation.
The ERA process is general in nature and could be applied to the evaluation of radiation as astressor, but not without some modifications and provision of additional guidance. There aresome noteworthy technical issues concerning the evaluation of radiation that require furtherconsideration and elaboration. Some issues are the same as for chemicals, but some areunique to radionuclides. In response to requests for guidance on this topic, Module 2, Section1 provides a basic “primer” on technical issues that should be considered when evaluatingradiation as a stressor to the environment, and draws on the experiences gained by BDACmembers in developing the graded approach and conducting radiological ERAs. To ourknowledge, standardized guidance on how to address these issues is not available elsewhere.
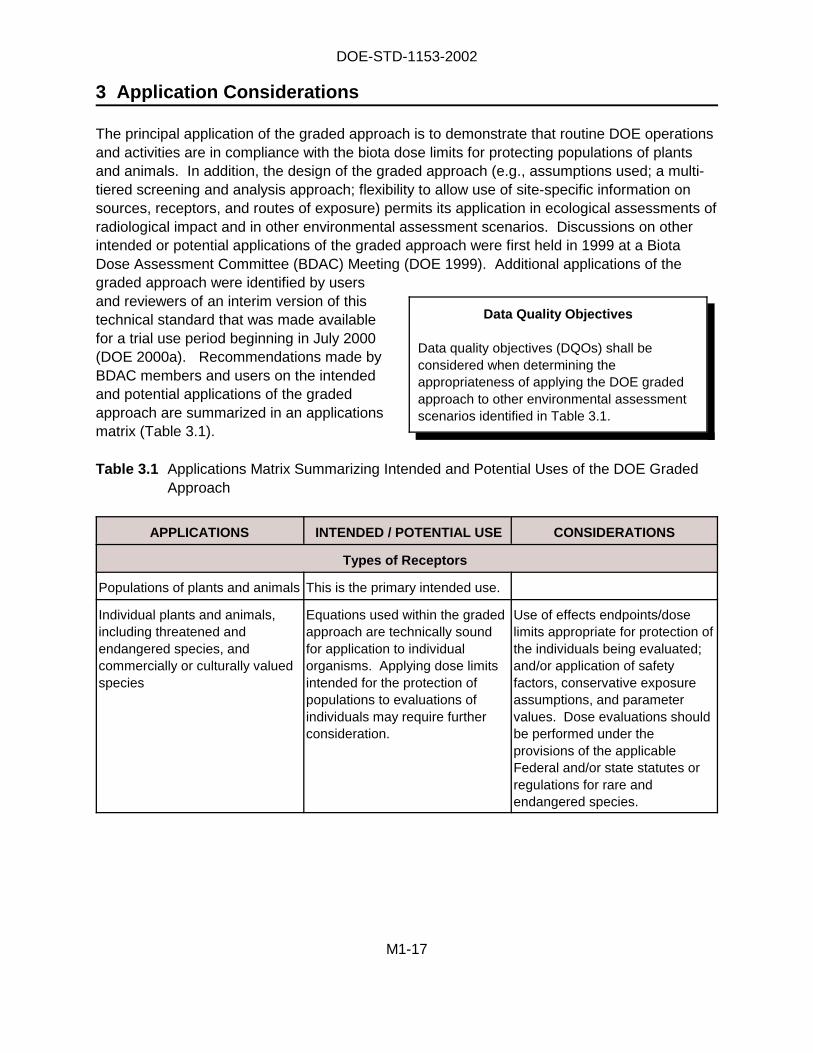
DOE-STD-1153-2002
M1-17
Data Quality Objectives
Data quality objectives (DQOs) shall beconsidered when determining theappropriateness of applying the DOE gradedapproach to other environmental assessmentscenarios identified in Table 3.1.
3 Application Considerations
The principal application of the graded approach is to demonstrate that routine DOE operationsand activities are in compliance with the biota dose limits for protecting populations of plantsand animals. In addition, the design of the graded approach (e.g., assumptions used; a multi-tiered screening and analysis approach; flexibility to allow use of site-specific information onsources, receptors, and routes of exposure) permits its application in ecological assessments ofradiological impact and in other environmental assessment scenarios. Discussions on otherintended or potential applications of the graded approach were first held in 1999 at a BiotaDose Assessment Committee (BDAC) Meeting (DOE 1999). Additional applications of thegraded approach were identified by usersand reviewers of an interim version of thistechnical standard that was made availablefor a trial use period beginning in July 2000(DOE 2000a). Recommendations made byBDAC members and users on the intendedand potential applications of the gradedapproach are summarized in an applicationsmatrix (Table 3.1).
Table 3.1 Applications Matrix Summarizing Intended and Potential Uses of the DOE GradedApproach
APPLICATIONS INTENDED / POTENTIAL USE CONSIDERATIONS
Types of Receptors
Populations of plants and animals This is the primary intended use.
Individual plants and animals,including threatened andendangered species, andcommercially or culturally valuedspecies
Equations used within the gradedapproach are technically soundfor application to individualorganisms. Applying dose limitsintended for the protection ofpopulations to evaluations ofindividuals may require furtherconsideration.
Use of effects endpoints/doselimits appropriate for protection ofthe individuals being evaluated;and/or application of safetyfactors, conservative exposureassumptions, and parametervalues. Dose evaluations shouldbe performed under theprovisions of the applicableFederal and/or state statutes orregulations for rare andendangered species.
DOE-STD-1153-2002
M1-18
Table 3.1 (Continued) Applications Matrix Summarizing Intended and Potential Uses of theDOE Graded Approach
APPLICATIONS INTENDED / POTENTIAL USE CONSIDERATIONS
Types of Exposure
Chronic The methodology assumeschronic exposure and equilibriumconditions.
Acute The methodology is not intendedto be used for assessing acuteexposures. The models andassumptions used in the gradedapproach assume equilibriumconditions.
Accidents Could be used to provide anindication of long-term "recovery"or health of the population overtime following an accident.Equations and models usedwithin the graded approach aretechnically sound for thisapplication.
Accidents typically result in short-term, acute exposures for whichthe methodology is not intended.However, it can be applied forassessing long-term exposuresdue to accidents.
Types of Environments
Fresh water, coastal, and marineenvironments
The methodology is intended tobe applied to fresh waterenvironments, and can beapplied to coastal and marineenvironments.
Care must be taken whenselecting parameter values (e.g.,receptor lumped parameters; Kd
values), as fresh water, coastal,and marine equilibrium chemistrydiffer considerably.
Terrestrial environments The methodology is intended tobe applied to terrestrialenvironments.
Compliance / Impact Assessment
Demonstration that DOE activitiesare in compliance with biota doselimits
This is a principal DOEapplication of the gradedapproach.
DOE-STD-1153-2002
M1-19
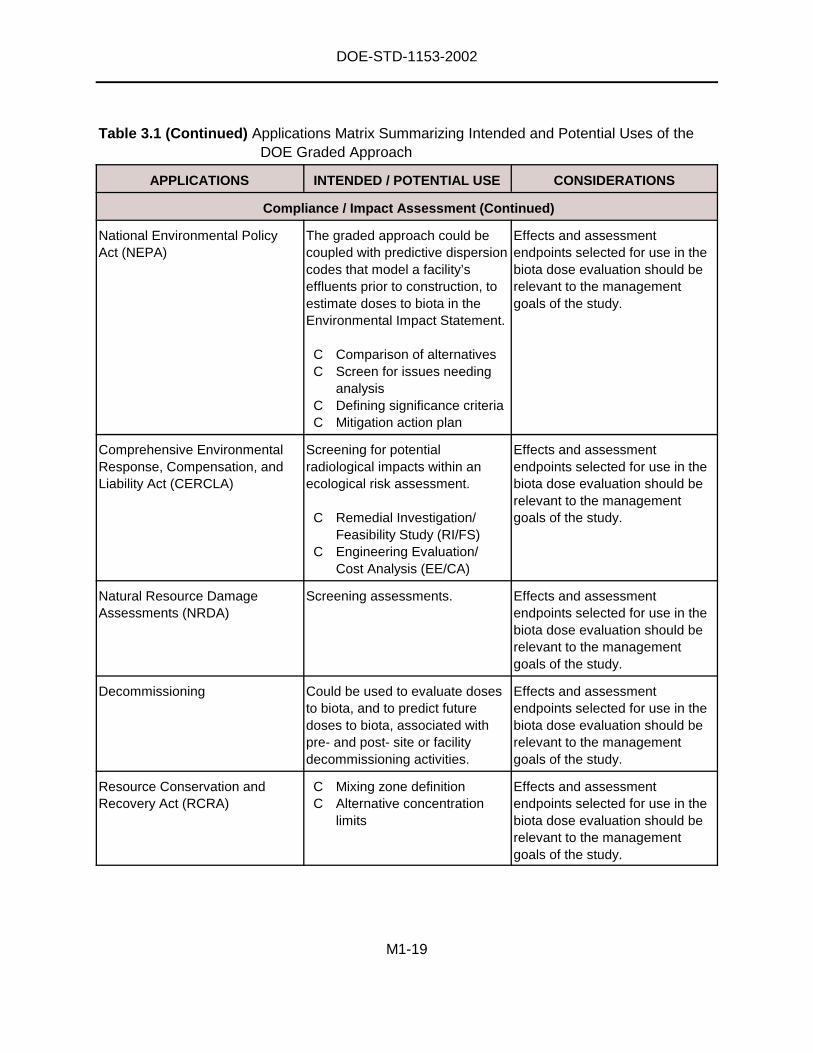
Table 3.1 (Continued) Applications Matrix Summarizing Intended and Potential Uses of theDOE Graded Approach
APPLICATIONS INTENDED / POTENTIAL USE CONSIDERATIONS
Compliance / Impact Assessment (Continued)
National Environmental PolicyAct (NEPA)
The graded approach could becoupled with predictive dispersioncodes that model a facility’seffluents prior to construction, toestimate doses to biota in theEnvironmental Impact Statement.
C Comparison of alternativesC Screen for issues needing
analysisC Defining significance criteriaC Mitigation action plan
Effects and assessmentendpoints selected for use in thebiota dose evaluation should berelevant to the managementgoals of the study.
Comprehensive EnvironmentalResponse, Compensation, andLiability Act (CERCLA)
Screening for potentialradiological impacts within anecological risk assessment.
C Remedial Investigation/Feasibility Study (RI/FS)
C Engineering Evaluation/Cost Analysis (EE/CA)
Effects and assessmentendpoints selected for use in thebiota dose evaluation should berelevant to the managementgoals of the study.
Natural Resource DamageAssessments (NRDA)
Screening assessments. Effects and assessmentendpoints selected for use in thebiota dose evaluation should berelevant to the managementgoals of the study.
Decommissioning Could be used to evaluate dosesto biota, and to predict futuredoses to biota, associated withpre- and post- site or facilitydecommissioning activities.
Effects and assessmentendpoints selected for use in thebiota dose evaluation should berelevant to the managementgoals of the study.
Resource Conservation andRecovery Act (RCRA)
C Mixing zone definitionC Alternative concentration
limits
Effects and assessmentendpoints selected for use in thebiota dose evaluation should berelevant to the managementgoals of the study.

DOE-STD-1153-2002
M1-20
Table 3.1 (Continued) Applications Matrix Summarizing Intended and Potential Uses of theDOE Graded Approach
APPLICATIONS INTENDED / POTENTIAL USE CONSIDERATIONS
Compliance / Impact Assessment (Continued)
Clean Water Act Mixing zone assessments. Effects and assessmentendpoints selected for use in thebiota dose evaluation should berelevant to the managementgoals of the study.
As mentioned earlier, the principal driver and basis of need for developing the graded approachwas to provide DOE field and program elements with methods for demonstrating compliancewith DOE biota dose limits and recommendations for radiological protection of the environment.Thus, many of the decisions that are traditionally made when conducting a case-specificassessment (e.g., choice of indicator receptors; defining receptor exposure profiles; selection ofeffects endpoints) were made at a programmatic level and incorporated into the screeningphase of the graded approach a priori. For example, the thresholds for adverse effects wereset at the recommended limits for protection of natural populations of biota. Those are theappropriate effects levels for demonstrating protection with DOE requirements andrecommendations for the protection of the environment from ionizing radiation (Module 1,Section 1.2). If the graded approach is used for other purposes (e.g., Table 3.1), then theprogrammatic objectives and the methods should be reviewed and discussed with the relevantdecision makers and stakeholders, preferably via the Data Quality Objectives (DQO) process(Bilyard et al. 1997) to ensure that the results obtained through application of the gradedapproach will support the management goals and objectives of the environmental assessment.
3.1 Evaluating Doses to Individual Organisms
The equations and models used within the graded approach for estimating the dose per unitconcentration of radionuclides in environmental media and for deriving the BCGs are alsoapplicable to individual organisms. However, there are questions concerning the applicability ofthe biota dose limits to individual organisms. While the biota dose limits presented in Module 1,Section 1.1 were derived based on dose-response information for the most radiosensitive of allspecies studied, and taking into account the most radiosensitive life stages, the question ofwhether these dose limits can be applied to protection of individual members of a species, incontrast to protection of populations of species, requires further consideration. That is, forindividual plants and animals, especially threatened and endangered species, the health effectsof concern could be different from the effects of concern in protection of populations.
The application of safety factors to these dose limits is one approach that has been used inevaluating doses to individual organisms (e.g., for culturally valued species). Use of safety
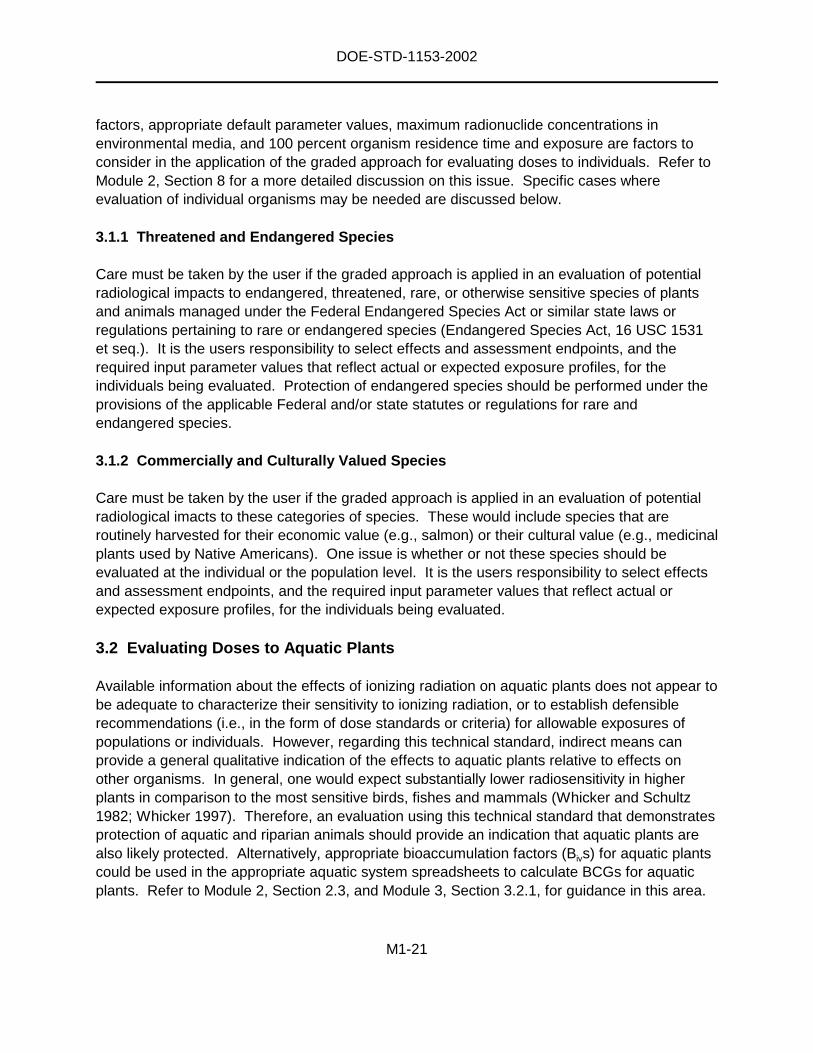
DOE-STD-1153-2002
M1-21
factors, appropriate default parameter values, maximum radionuclide concentrations inenvironmental media, and 100 percent organism residence time and exposure are factors toconsider in the application of the graded approach for evaluating doses to individuals. Refer toModule 2, Section 8 for a more detailed discussion on this issue. Specific cases whereevaluation of individual organisms may be needed are discussed below.
3.1.1 Threatened and Endangered Species
Care must be taken by the user if the graded approach is applied in an evaluation of potentialradiological impacts to endangered, threatened, rare, or otherwise sensitive species of plantsand animals managed under the Federal Endangered Species Act or similar state laws orregulations pertaining to rare or endangered species (Endangered Species Act, 16 USC 1531et seq.). It is the users responsibility to select effects and assessment endpoints, and therequired input parameter values that reflect actual or expected exposure profiles, for theindividuals being evaluated. Protection of endangered species should be performed under theprovisions of the applicable Federal and/or state statutes or regulations for rare andendangered species.
3.1.2 Commercially and Culturally Valued Species
Care must be taken by the user if the graded approach is applied in an evaluation of potentialradiological imacts to these categories of species. These would include species that areroutinely harvested for their economic value (e.g., salmon) or their cultural value (e.g., medicinalplants used by Native Americans). One issue is whether or not these species should beevaluated at the individual or the population level. It is the users responsibility to select effectsand assessment endpoints, and the required input parameter values that reflect actual orexpected exposure profiles, for the individuals being evaluated.
3.2 Evaluating Doses to Aquatic Plants
Available information about the effects of ionizing radiation on aquatic plants does not appear tobe adequate to characterize their sensitivity to ionizing radiation, or to establish defensiblerecommendations (i.e., in the form of dose standards or criteria) for allowable exposures ofpopulations or individuals. However, regarding this technical standard, indirect means canprovide a general qualitative indication of the effects to aquatic plants relative to effects onother organisms. In general, one would expect substantially lower radiosensitivity in higherplants in comparison to the most sensitive birds, fishes and mammals (Whicker and Schultz1982; Whicker 1997). Therefore, an evaluation using this technical standard that demonstratesprotection of aquatic and riparian animals should provide an indication that aquatic plants arealso likely protected. Alternatively, appropriate bioaccumulation factors (Bivs) for aquatic plantscould be used in the appropriate aquatic system spreadsheets to calculate BCGs for aquaticplants. Refer to Module 2, Section 2.3, and Module 3, Section 3.2.1, for guidance in this area.
DOE-STD-1153-2002
M1-22
3.3 Experimental Facilities
The methods in this technical standard are not directly intended to be applied to properlypermitted experimental facilities that expose biota to ionizing radiation without releasingmaterials to the environment (e.g., particle beam accelerators). Although the operation of suchfacilities may be considered to be “routine,” any inadvertent exposure of biota as a result ofsuch operations should have been addressed in the operating permit, precluding any need toapply the methods described herein. Additionally, any such exposures would be localized, andwould thus be unlikely to affect substantial populations of any species that this technicalstandard addresses. Refer to Module 2, Section 2.4 for detailed considerations and methodsfor evaluating potential impacts to biota around accelerators or other sources of direct radiation.
3.4 Hazardous Chemicals and Industrial Hazards
The methods in this technical standard are not appropriate for evaluating potential impacts onbiota from hazardous chemicals or industrial-type hazards, including noise and traffic.
3.5 Frequency of Conducting Evaluations
Dose evaluations for aquatic and terrestrial biota shall be conducted annually in conjunctionwith the preparation of annual site environmental reports that are required under DOE Orders5400.1 and 5400.5. More frequent evaluations could be required at the direction of DOE’sOffice of Environment, Safety and Health (EH).
DOE-STD-1153-2002
M1-23
• Consider sources, receptors androutes of exposure
• Define the area of evaluation
• Assemble radionuclide concentrationdata for each medium
• Compare maximum radionuclideconcentration data with genericBCGs. Sum all fractions for eachradionuclide and medium
Is sum offractions < 1.0?
Evaluation iscomplete.Documentrationale andresults.
Proceed toANALYSISPHASE.
YesYes
NoNo
Dat
aA
ssem
bly
Ph
ase
(5)
Gen
eral
Scr
een
ing
Ph
ase
(6)
4 Step-by-Step Implementation of the Graded Approach
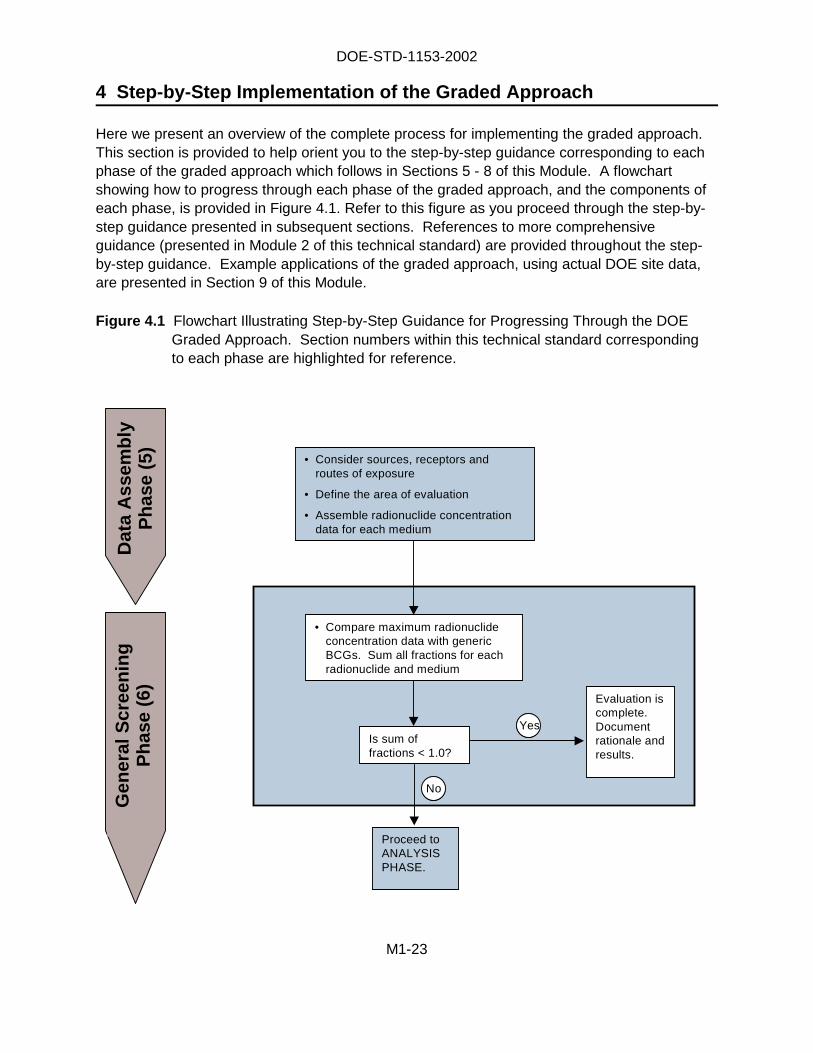
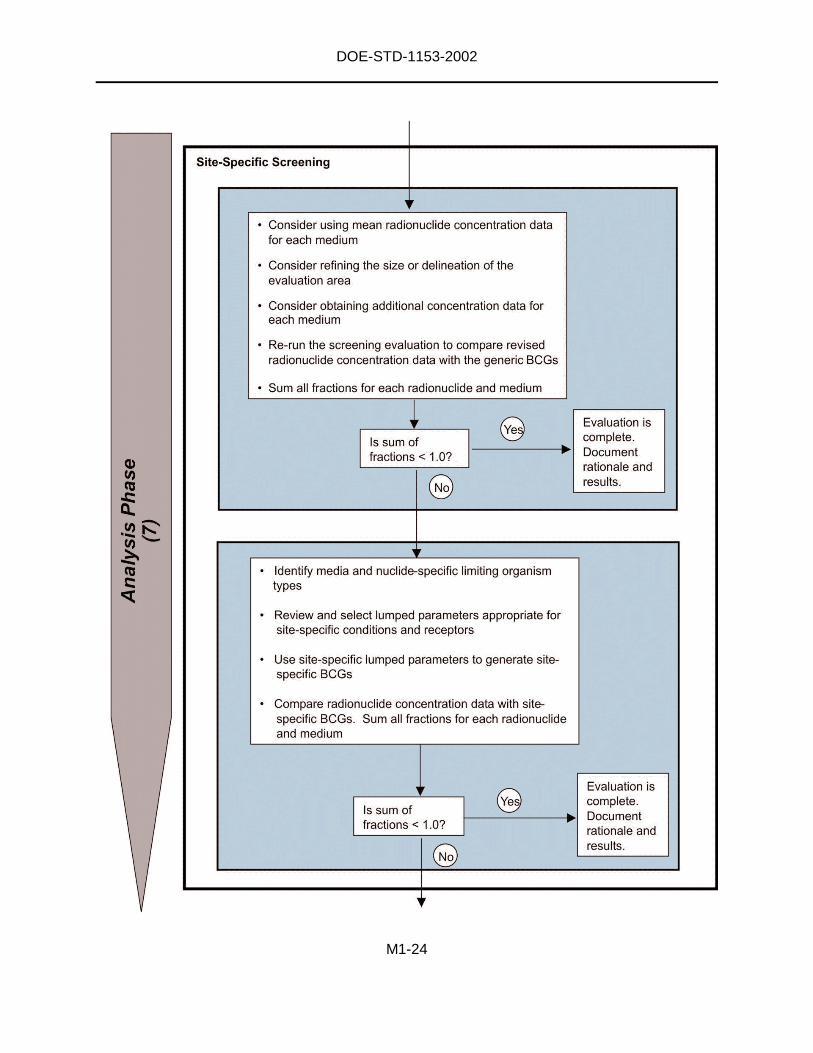
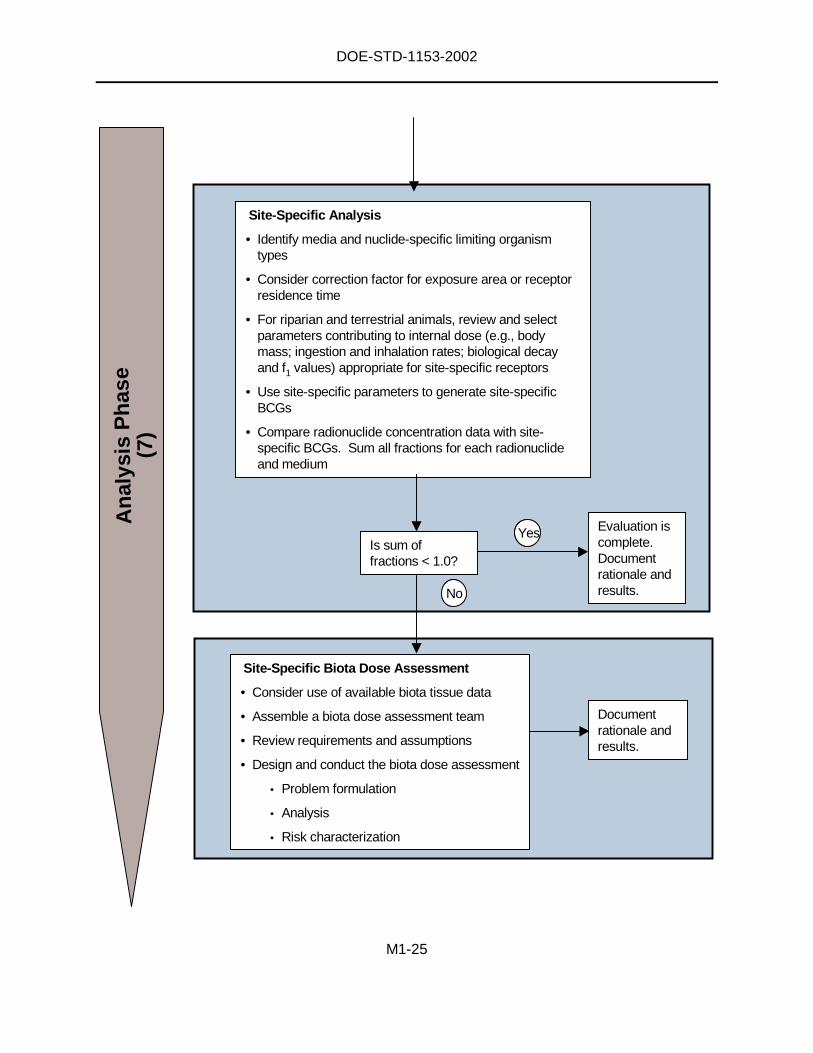
Here we present an overview of the complete process for implementing the graded approach.This section is provided to help orient you to the step-by-step guidance corresponding to eachphase of the graded approach which follows in Sections 5 - 8 of this Module. A flowchartshowing how to progress through each phase of the graded approach, and the components ofeach phase, is provided in Figure 4.1. Refer to this figure as you proceed through the step-by-step guidance presented in subsequent sections. References to more comprehensiveguidance (presented in Module 2 of this technical standard) are provided throughout the step-by-step guidance. Example applications of the graded approach, using actual DOE site data,are presented in Section 9 of this Module.
Figure 4.1 Flowchart Illustrating Step-by-Step Guidance for Progressing Through the DOEGraded Approach. Section numbers within this technical standard correspondingto each phase are highlighted for reference.
DOE-STD-1153-2002
M1-24
DOE-STD-1153-2002
M1-25
Site-Specific Biota Dose Assessment
• Consider use of available biota tissue data
• Assemble a biota dose assessment team
• Review requirements and assumptions
• Design and conduct the biota dose assessment
• Problem formulation
• Analysis
• Risk characterization
Documentrationale andresults.
Site-Specific Analysis
• Identify media and nuclide-specific limiting organismtypes
• Consider correction factor for exposure area or receptorresidence time
• For riparian and terrestrial animals, review and selectparameters contributing to internal dose (e.g., bodymass; ingestion and inhalation rates; biological decayand f1 values) appropriate for site-specific receptors
• Use site-specific parameters to generate site-specificBCGs
• Compare radionuclide concentration data with site-specific BCGs. Sum all fractions for each radionuclideand medium
Evaluation iscomplete.Documentrationale andresults.
Is sum offractions < 1.0?
YesYes
NoNo
An
alys
isP
has
e(7
)
DOE-STD-1153-2002
M1-26
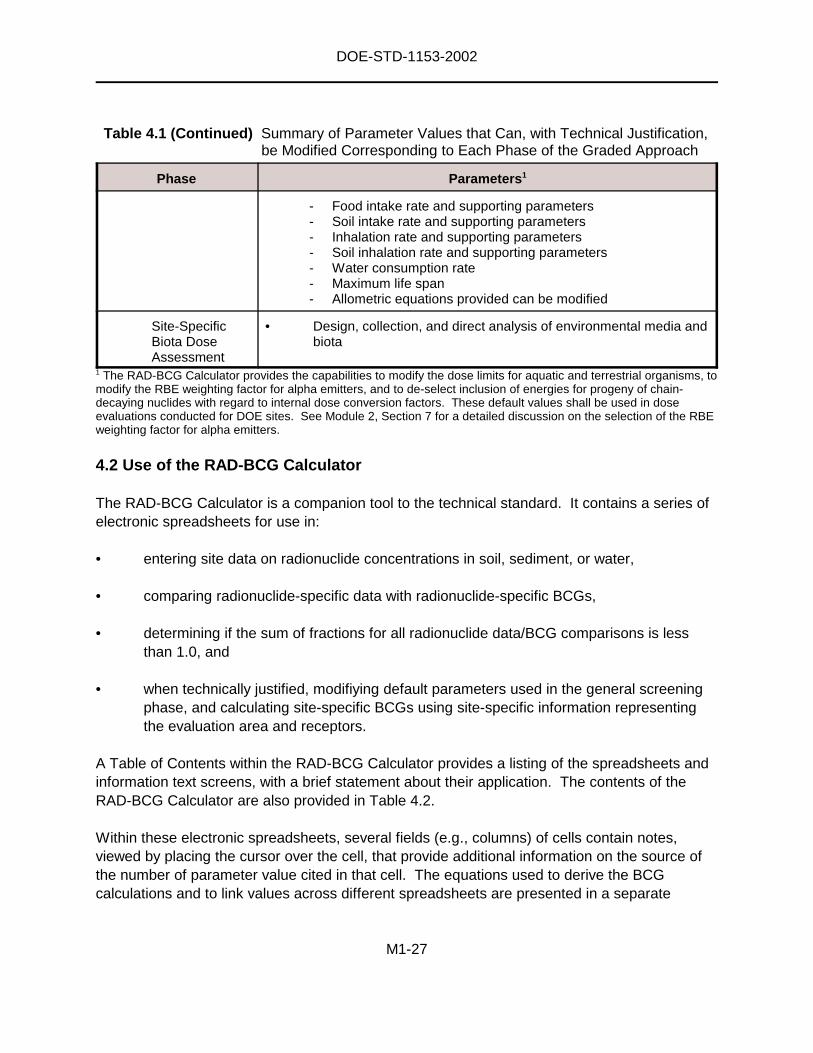
4.1 Parameter Values that Can be Modified in the Graded Approach
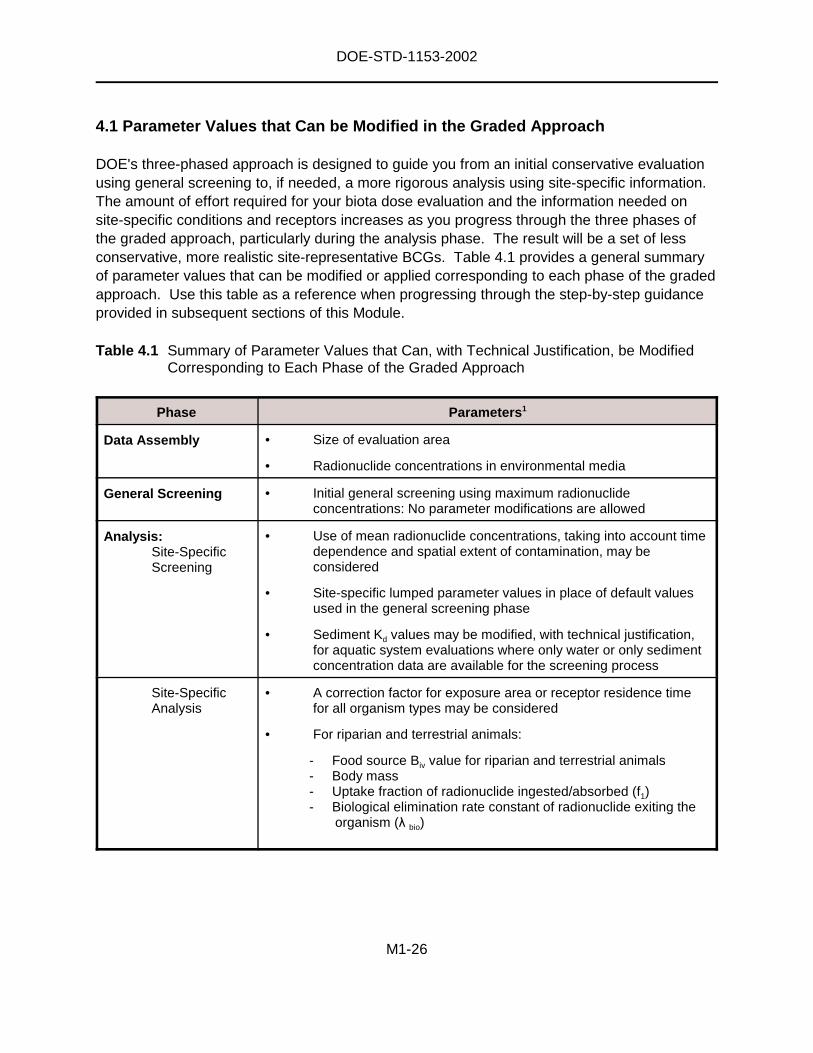
DOE's three-phased approach is designed to guide you from an initial conservative evaluationusing general screening to, if needed, a more rigorous analysis using site-specific information.The amount of effort required for your biota dose evaluation and the information needed onsite-specific conditions and receptors increases as you progress through the three phases ofthe graded approach, particularly during the analysis phase. The result will be a set of lessconservative, more realistic site-representative BCGs. Table 4.1 provides a general summaryof parameter values that can be modified or applied corresponding to each phase of the gradedapproach. Use this table as a reference when progressing through the step-by-step guidanceprovided in subsequent sections of this Module.
Table 4.1 Summary of Parameter Values that Can, with Technical Justification, be ModifiedCorresponding to Each Phase of the Graded Approach
Phase Parameters1
Data Assembly • Size of evaluation area
• Radionuclide concentrations in environmental media
General Screening • Initial general screening using maximum radionuclideconcentrations: No parameter modifications are allowed
Analysis:Site-SpecificScreening
• Use of mean radionuclide concentrations, taking into account timedependence and spatial extent of contamination, may beconsidered
• Site-specific lumped parameter values in place of default valuesused in the general screening phase
• Sediment Kd values may be modified, with technical justification,for aquatic system evaluations where only water or only sedimentconcentration data are available for the screening process
Site-SpecificAnalysis
• A correction factor for exposure area or receptor residence timefor all organism types may be considered
• For riparian and terrestrial animals:
- Food source Biv value for riparian and terrestrial animals- Body mass- Uptake fraction of radionuclide ingested/absorbed (f1)- Biological elimination rate constant of radionuclide exiting the
organism (λ bio)
DOE-STD-1153-2002
M1-27
Table 4.1 (Continued) Summary of Parameter Values that Can, with Technical Justification,be Modified Corresponding to Each Phase of the Graded Approach
Phase Parameters1
- Food intake rate and supporting parameters- Soil intake rate and supporting parameters- Inhalation rate and supporting parameters- Soil inhalation rate and supporting parameters- Water consumption rate- Maximum life span- Allometric equations provided can be modified
Site-SpecificBiota DoseAssessment
• Design, collection, and direct analysis of environmental media andbiota
1 The RAD-BCG Calculator provides the capabilities to modify the dose limits for aquatic and terrestrial organisms, tomodify the RBE weighting factor for alpha emitters, and to de-select inclusion of energies for progeny of chain-decaying nuclides with regard to internal dose conversion factors. These default values shall be used in doseevaluations conducted for DOE sites. See Module 2, Section 7 for a detailed discussion on the selection of the RBEweighting factor for alpha emitters.
4.2 Use of the RAD-BCG Calculator
The RAD-BCG Calculator is a companion tool to the technical standard. It contains a series ofelectronic spreadsheets for use in:
• entering site data on radionuclide concentrations in soil, sediment, or water,
• comparing radionuclide-specific data with radionuclide-specific BCGs,
• determining if the sum of fractions for all radionuclide data/BCG comparisons is lessthan 1.0, and
• when technically justified, modifiying default parameters used in the general screeningphase, and calculating site-specific BCGs using site-specific information representingthe evaluation area and receptors.
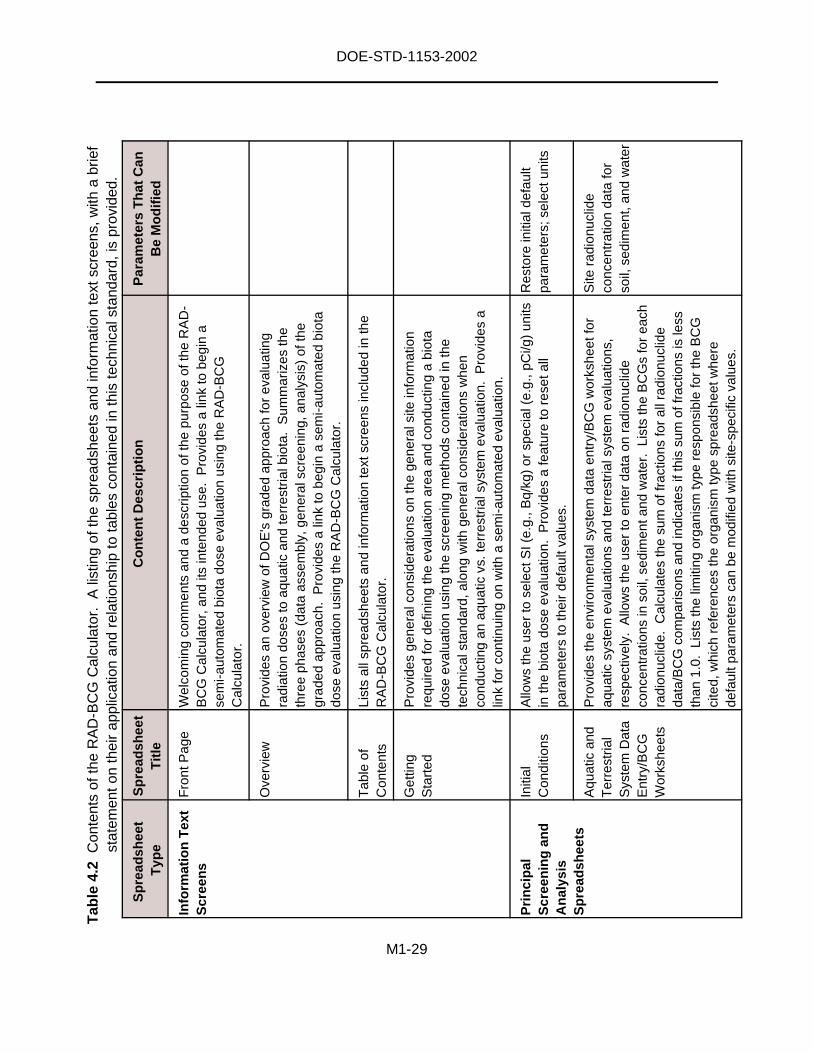
A Table of Contents within the RAD-BCG Calculator provides a listing of the spreadsheets andinformation text screens, with a brief statement about their application. The contents of theRAD-BCG Calculator are also provided in Table 4.2.
Within these electronic spreadsheets, several fields (e.g., columns) of cells contain notes,viewed by placing the cursor over the cell, that provide additional information on the source ofthe number of parameter value cited in that cell. The equations used to derive the BCGcalculations and to link values across different spreadsheets are presented in a separate
DOE-STD-1153-2002
M1-28
The BDAC is available as a resource to DOEprogram and field elements
The Department’s Biota Dose AssessmentCommittee is available as a technical resourceand advisory group concerning evaluation ofradiation doses to biota. Questions concerningthe application of the DOE graded approachshould be coordinated through DOE’s Air,Water and Radiation Division (EH-412).
protected spreadsheet within the RAD-BCG Calculator. The equations and assumptions usedto derive the BCGs are described in detail within Module 3 of this technical standard.
4.3 The Biota Dose Assessment Committee
The Biota Dose Assessment Committee (BDAC), chaired by DOE’s Air, Water and RadiationDivision (EH-412), is available as a resource to answer questions concerning the gradedapproach for evaluating radiation doses to biota. The BDAC is an approved technicalstandards topical committee organized underthe DOE Technical Standards Program. Asstated in its charter, the purpose of theBDAC is (a) to assist, consistent with DOEneeds, in developing and promoting technicalstandards and associated guidance for DOE-wide applications in assessing radiation doseto biota, (b) to serve as a major forum withinDOE for obtaining technical assistance,discussing technical issues, and sharinglessons learned regarding biota dosestandards and assessment methods, and (c)to serve as a technical resource and advisorygroup for DOE program and field elementsregarding site-specific biota dose assessments. The BDAC web site(http://homer.ornl.gov/oepa/public/bdac) provides internet access to guidance, methods, andrelated tools associated with this technical standard; links to related web sites also areprovided. Specific questions concerning the guidance and methods contained in this technicalstandard, and requests for consultation with the BDAC Core Team, should be coordinatedthrough EH-412 (contact Stephen Domotor, 202-586-0871, [email protected]).
DOE-STD-1153-2002
M1-29
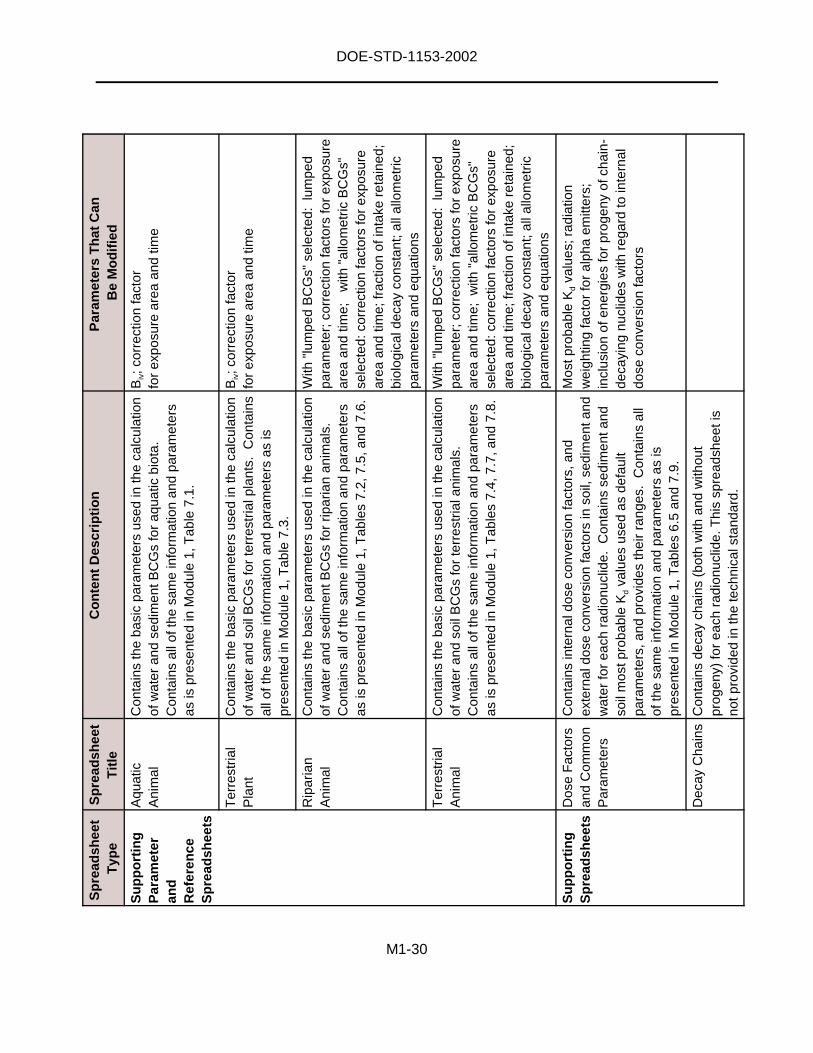
Tab
le4.
2C
onte
nts
ofth
eR
AD
-BC
GC
alcu
lato
r.A
listin
gof
the
spre
adsh
eets
and
info
rmat
ion
text
scre
ens,
with
abr
ief
stat
emen
ton
thei
rap
plic
atio
nan
dre
latio
nshi
pto
tabl
esco
ntai
ned
inth
iste
chni
cals
tand
ard,
ispr
ovid
ed.
Sp
read
shee
tT
ype
Sp
read
shee
tT
itle
Co
nte
nt
Des
crip
tio
nP
aram
eter
sT
hat
Can
Be
Mo
dif
ied
Info
rmat
ion
Tex
tS
cree
ns
Fro
ntP
age
Wel
com
ing
com
men
tsan
da
desc
riptio
nof
the
purp
ose
ofth
eR
AD
-B
CG
Cal
cula
tor,
and
itsin
tend
edus
e.P
rovi
des
alin
kto
begi
na
sem
i-aut
omat
edbi
ota
dose
eval
uatio
nus
ing
the
RA
D-B
CG
Cal
cula
tor.
Ove
rvie
wP
rovi
des
anov
ervi
ewof
DO
E's
grad
edap
proa
chfo
rev
alua
ting
radi
atio
ndo
ses
toaq
uatic
and
terr
estr
ialb
iota
.S
umm
ariz
esth
eth
ree
phas
es(d
ata
asse
mbl
y,ge
nera
lscr
eeni
ng,a
naly
sis)
ofth
egr
aded
appr
oach
.P
rovi
des
alin
kto
begi
na
sem
i-aut
omat
edbi
ota
dose
eval
uatio
nus
ing
the
RA
D-B
CG
Cal
cula
tor.
Tab
leof
Con
tent
sLi
sts
alls
prea
dshe
ets
and
info
rmat
ion
text
scre
ens
incl
uded
inth
eR
AD
-BC
GC
alcu
lato
r.
Get
ting
Sta
rted
Pro
vide
sge
nera
lcon
side
ratio
nson
the
gene
rals
itein
form
atio
nre
quire
dfo
rde
finin
gth
eev
alua
tion
area
and
cond
uctin
ga
biot
ado
seev
alua
tion
usin
gth
esc
reen
ing
met
hods
cont
aine
din
the
tech
nica
lsta
ndar
d,al
ong
with
gene
ralc
onsi
dera
tions
whe
nco
nduc
ting
anaq
uatic
vs.t
erre
stria
lsys
tem
eval
uatio
n.P
rovi
des
alin
kfo
rco
ntin
uing
onw
itha
sem
i-aut
omat
edev
alua
tion.
Pri
nci
pal
Scr
een
ing
and
An
alys
isS
pre
adsh
eets
Initi
alC
ondi
tions
Allo
ws
the
user
tose
lect
SI(
e.g.
,Bq/
kg)
orsp
ecia
l(e.
g.,p
Ci/g
)un
itsin
the
biot
ado
seev
alua
tion.
Pro
vide
sa
feat
ure
tore
seta
llpa
ram
eter
sto
thei
rde
faul
tval
ues.
Res
tore
initi
alde
faul
tpa
ram
eter
s;se
lect
units
Aqu
atic
and
Ter
rest
rial
Sys
tem
Dat
aE
ntry
/BC
GW
orks
heet
s
Pro
vide
sth
een
viro
nmen
tals
yste
mda
taen
try/
BC
Gw
orks
heet
for
aqua
ticsy
stem
eval
uatio
nsan
dte
rres
tria
lsys
tem
eval
uatio
ns,
resp
ectiv
ely.
Allo
ws
the
user
toen
ter
data
onra
dion
uclid
eco
ncen
trat
ions
inso
il,se
dim
enta
ndw
ater
.Li
sts
the
BC
Gs
for
each
radi
onuc
lide.
Cal
cula
tes
the
sum
offr
actio
nsfo
ral
lrad
ionu
clid
eda
ta/B
CG
com
paris
ons
and
indi
cate
sif
this
sum
offr
actio
nsis
less
than
1.0.
List
sth
elim
iting
orga
nism
type
resp
onsi
ble
for
the
BC
Gci
ted,
whi
chre
fere
nces
the
orga
nism
type
spre
adsh
eetw
here
defa
ultp
aram
eter
sca
nbe
mod
ified
with
site
-spe
cific
valu
es.
Site
radi
onuc
lide
conc
entr
atio
nda
tafo
rso
il,se
dim
ent,
and
wat
er
DOE-STD-1153-2002
M1-30
Sp
read
shee
tT
ype
Sp
read
shee
tT
itle
Co
nte
nt
Des
crip
tio
nP
aram
eter
sT
hat
Can
Be
Mo
dif
ied
Su
pp
ort
ing
Par
amet
eran
dR
efer
ence
Sp
read
shee
ts
Aqu
atic
Ani
mal
Con
tain
sth
eba
sic
para
met
ers
used
inth
eca
lcul
atio
nof
wat
eran
dse
dim
entB
CG
sfo
raq
uatic
biot
a.C
onta
ins
allo
fthe
sam
ein
form
atio
nan
dpa
ram
eter
sas
ispr
esen
ted
inM
odul
e1,
Tab
le7.
1.
Biv;c
orre
ctio
nfa
ctor
for
expo
sure
area
and
time
Ter
rest
rial
Pla
ntC
onta
ins
the
basi
cpa
ram
eter
sus
edin
the
calc
ulat
ion
ofw
ater
and
soil
BC
Gs
for
terr
estr
ialp
lant
s.C
onta
ins
allo
fthe
sam
ein
form
atio
nan
dpa
ram
eter
sas
ispr
esen
ted
inM
odul
e1,
Tab
le7.
3.
Biv;c
orre
ctio
nfa
ctor
for
expo
sure
area
and
time
Rip
aria
nA
nim
alC
onta
ins
the
basi
cpa
ram
eter
sus
edin
the
calc
ulat
ion
ofw
ater
and
sedi
men
tBC
Gs
for
ripar
ian
anim
als.
Con
tain
sal
loft
hesa
me
info
rmat
ion
and
para
met
ers
asis
pres
ente
din
Mod
ule
1,T
able
s7.
2,7.
5,an
d7.
6.
With
"lum
ped
BC
Gs"
sele
cted
:lu
mpe
dpa
ram
eter
;cor
rect
ion
fact
ors
for
expo
sure
area
and
time;
with
"allo
met
ricB
CG
s"se
lect
ed:c
orre
ctio
nfa
ctor
sfo
rex
posu
rear
eaan
dtim
e;fr
actio
nof
inta
kere
tain
ed;
biol
ogic
alde
cay
cons
tant
;all
allo
met
ricpa
ram
eter
san
deq
uatio
ns
Ter
rest
rial
Ani
mal
Con
tain
sth
eba
sic
para
met
ers
used
inth
eca
lcul
atio
nof
wat
eran
dso
ilB
CG
sfo
rte
rres
tria
lani
mal
s.C
onta
ins
allo
fthe
sam
ein
form
atio
nan
dpa
ram
eter
sas
ispr
esen
ted
inM
odul
e1,
Tab
les
7.4,
7.7,
and
7.8.
With
"lum
ped
BC
Gs"
sele
cted
:lu
mpe
dpa
ram
eter
;cor
rect
ion
fact
ors
for
expo
sure
area
and
time;
with
"allo
met
ricB
CG
s"se
lect
ed:c
orre
ctio
nfa
ctor
sfo
rex
posu
rear
eaan
dtim
e;fr
actio
nof
inta
kere
tain
ed;
biol
ogic
alde
cay
cons
tant
;all
allo
met
ricpa
ram
eter
san
deq
uatio
ns
Su
pp
ort
ing
Sp
read
shee
tsD
ose
Fac
tors
and
Com
mon
Par
amet
ers
Con
tain
sin
tern
aldo
seco
nver
sion
fact
ors,
and
exte
rnal
dose
conv
ersi
onfa
ctor
sin
soil,
sedi
men
tand
wat
erfo
rea
chra
dion
uclid
e.C
onta
ins
sedi
men
tand
soil
mos
tpro
babl
eK
dva
lues
used
asde
faul
tpa
ram
eter
s,an
dpr
ovid
esth
eir
rang
es.
Con
tain
sal
lof
the
sam
ein
form
atio
nan
dpa
ram
eter
sas
ispr
esen
ted
inM
odul
e1,
Tab
les
6.5
and
7.9.
Mos
tpro
babl
eK
dva
lues
;rad
iatio
nw
eigh
ting
fact
orfo
ral
pha
emitt
ers;
incl
usio
nof
ener
gies
for
prog
eny
ofch
ain-
deca
ying
nucl
ides
with
rega
rdto
inte
rnal
dose
conv
ersi
onfa
ctor
s
Dec
ayC
hain
sC
onta
ins
deca
ych
ains
(bot
hw
ithan
dw
ithou
tpr
ogen
y)fo
rea
chra
dion
uclid
e.T
his
spre
adsh
eeti
sno
tpro
vide
din
the
tech
nica
lsta
ndar
d.
DOE-STD-1153-2002
M1-31
5 Data Assembly Phase
The DOE graded approach for evaluating radiation doses to aquatic and terrestrial biota wasdesigned to minimize the need for additional data collection above and beyond environmentalradionuclide concentration data typically available through routine environmental monitoring andsurveillance programs. The data assembly phase encompasses three steps: (1) consideringthe sources of radioactivity, the key receptors, and the routes of exposure to these receptors;(2) defining the geographic area to be evaluated; and (3) assembling and organizing data onradionuclide concentrations in water, sediments, and soil for use in the general screeningphase, and for use in the analysis phase, if needed. Each of the three steps areinterdependent and should be considered collectively when implementing the data assemblyphase.
5.1 Step 1: Consider the Sources, Receptors, and Routes of Exposure
It is expected that general knowledge concerning sources, receptors, and routes of exposurewill be sufficient for defining the geographic area of evaluation when implementing the generalscreening phase of the graded approach. However, more detailed information regarding theseelements may need to be considered as you progress through the graded approach. Forexample, if the BCGs for the general screening evaluation are exceeded, you may wish torefine your input data for site-specific screening (e.g., using mean radionuclide concentrationdata in place of maximum values; re-defining the geographic area of evaluation). Alternatively,you may wish to move to the site-specific analysis component of the graded approach, whichmay require consideration of internal dose parameters relating to site-specific receptors androutes of exposure. Detailed guidance on consideration of sources, receptors, and routes ofexposure, for application in defining the area of evaluation and for use in the analysis phase, isprovided in Module 2, Section 2.
5.2 Step 2: Define Your Area of Evaluation
It is necessary to determine the spatialextent over which the graded approach willbe applied. The assumptions regardingsources, receptors, and routes of exposureused in the development of the gradedapproach provide for conservative BCGs. Inthe derivation of the screening approach, thesource medium to which the organisms areexposed is assumed to be infinite in extentand to contain uniform concentrations ofradionuclides. The organisms are alsoassumed to be resident in the contaminatedarea (e.g., exposed to contaminated media)100 percent of the time. Given these
Three conditions should be present for adose evaluation:
C Radioactivity should be present oranticipated to be present in theenvironment as a result of DOE activities
C Receptors (i.e., plants and/or animals)should be present in the vicinity of thosesources
C Routes of exposure should exist fromthose sources to the receptors
DOE-STD-1153-2002
M1-32
assumptions, the first approach shall be to use maximum radionuclide concentration dataapplicable to your geographic area of interest (e.g., the entire site). A review of your effluentmonitoring and environmental surveillance program design and resultant data should provideinsights on sampling locations yielding the highest radionuclide concentrations.
5.3 Step 3: Assemble and Organize Data on Radionuclide Concentrations inEnvironmental Media
The next step is to collect and organize relevant data on radionuclide concentrations inenvironmental media. Radionuclide concentrations in surface water and/or sediment and in soilare needed for implementing the graded approach. Acceptable sources of data include but arenot limited to: Annual Site Environmental Reports, effluent monitoring and environmentalsurveillance data, remediation data, and data from special site-specific studies (e.g., ecologicalstudies conducted for other purposes). The data should be organized by location and medium,and be applicable to the geographic area of evaluation identified in Step 2 above. Locationsmay be defined by management and administrative characteristics (e.g., remediation sites;operations areas; operable units), physical characteristics (e.g., watershed; pond; stream), orecological characteristics (e.g., corresponding to habitat types). Maximum radionuclideconcentrations in environmental media shall be used in the initial application of the generalscreening phase to provide the most conservative evaluation.
5.3.1 Aquatic System Considerations
If you are conducting an aquatic system evaluation, note that use of radionuclide concentrationdata from co-located surface water and sediment samples is preferred and will result in a lessconservative, more realistic evaluation. A mix of data from water and/or sediment samplescollected from different locations within the vicinity of one another may be used, withjustification. Note that where co-located samples are not available, only water or only sedimentdata may be used, but will result in a significantly more conservative evaluation. This isbecause the BCGs derived using individual water or sediment values involve the use of aconservative sediment distribution coefficient (Kd) to calculate the environmental mediaradionuclide concentration and dose contribution of either the missing water or sedimentcomponent.
5.3.2 Terrestrial System Considerations
If you are conducting a terrestrial system evaluation, you should consider the types of receptorsresident in your area of evaluation and the appropriateness of your soil samples with regard tothese receptors. For example, surface soil samples may not be representative of potentialradionuclide exposure to deep-rooted plant receptors. Refer to Module 2, Section 5 for detailedguidance in this area. Also note that if you have a water body in your evaluation area, you mustalso conduct an aquatic system evaluation.
DOE-STD-1153-2002
M1-33
CA
BCGA
%CB
BCGB
%...%CN
BCGN
water %CA
BCGA
%CB
BCGB
%...%CN
BCGN
sediment<1.0
CA
BCGA
%CB
BCGB
%...%CN
BCGN
water %CA
BCGA
%CB
BCGB
%...%CN
BCGN
soil<1.0
6 General Screening Phase
A major goal of the general screening phase is to provide a method that allows you to easilyapply data on radionuclide concentrations in an environmental medium to evaluate compliancewith the dose limits for biota. In the general screening phase, data on radionuclideconcentrations in environmental media are compared with a set of generic BCGs. Eachradionuclide-specific BCG represents the limiting radionuclide concentration in environmentalmedia which would not result in DOE’s established or recommended dose limits for biota to beexceeded. These limiting radionuclide concentrations, or BCGs, are presented in Tables 6.1through 6.4. These "look-up" tables allow for quick, easy comparisons of radionuclideconcentrations in environmental media with the BCGs. Guidance on using these look-up tablesis provided below.
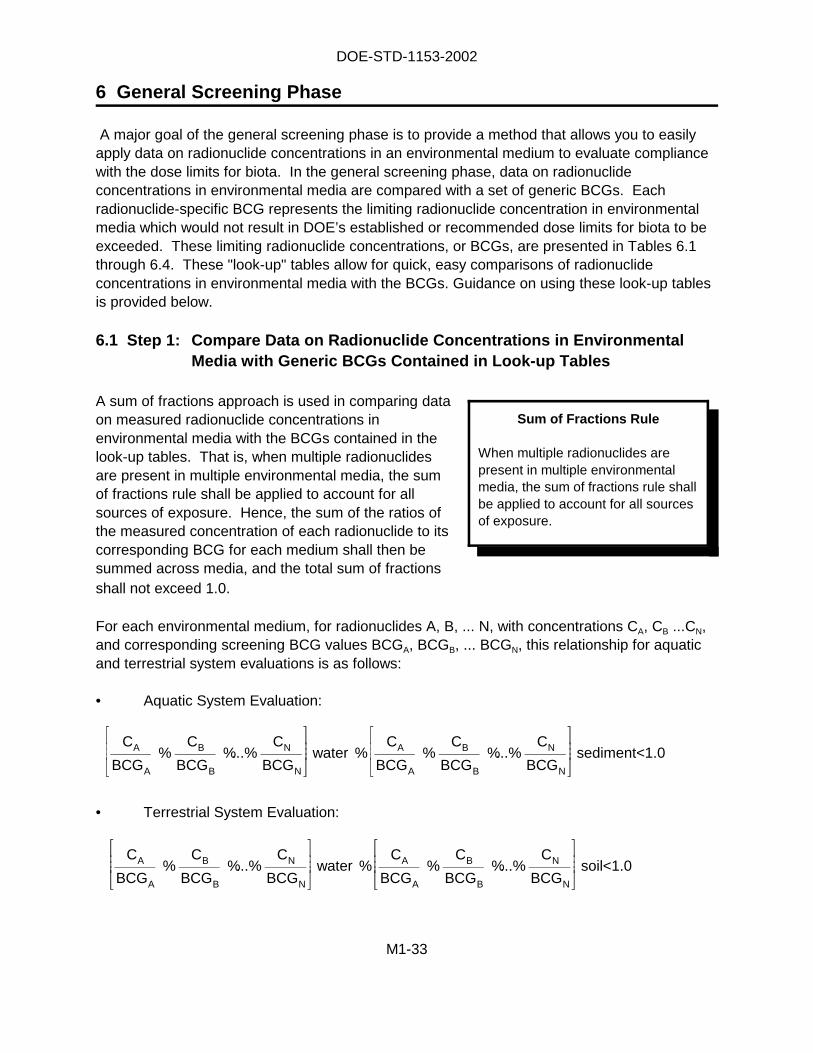
6.1 Step 1: Compare Data on Radionuclide Concentrations in EnvironmentalMedia with Generic BCGs Contained in Look-up Tables
A sum of fractions approach is used in comparing dataon measured radionuclide concentrations inenvironmental media with the BCGs contained in thelook-up tables. That is, when multiple radionuclidesare present in multiple environmental media, the sumof fractions rule shall be applied to account for allsources of exposure. Hence, the sum of the ratios ofthe measured concentration of each radionuclide to itscorresponding BCG for each medium shall then besummed across media, and the total sum of fractionsshall not exceed 1.0.
For each environmental medium, for radionuclides A, B, ... N, with concentrations CA, CB ...CN,and corresponding screening BCG values BCGA, BCGB, ... BCGN, this relationship for aquaticand terrestrial system evaluations is as follows:
• Aquatic System Evaluation:
• Terrestrial System Evaluation:
Sum of Fractions Rule
When multiple radionuclides arepresent in multiple environmentalmedia, the sum of fractions rule shallbe applied to account for all sourcesof exposure.
DOE-STD-1153-2002
M1-34
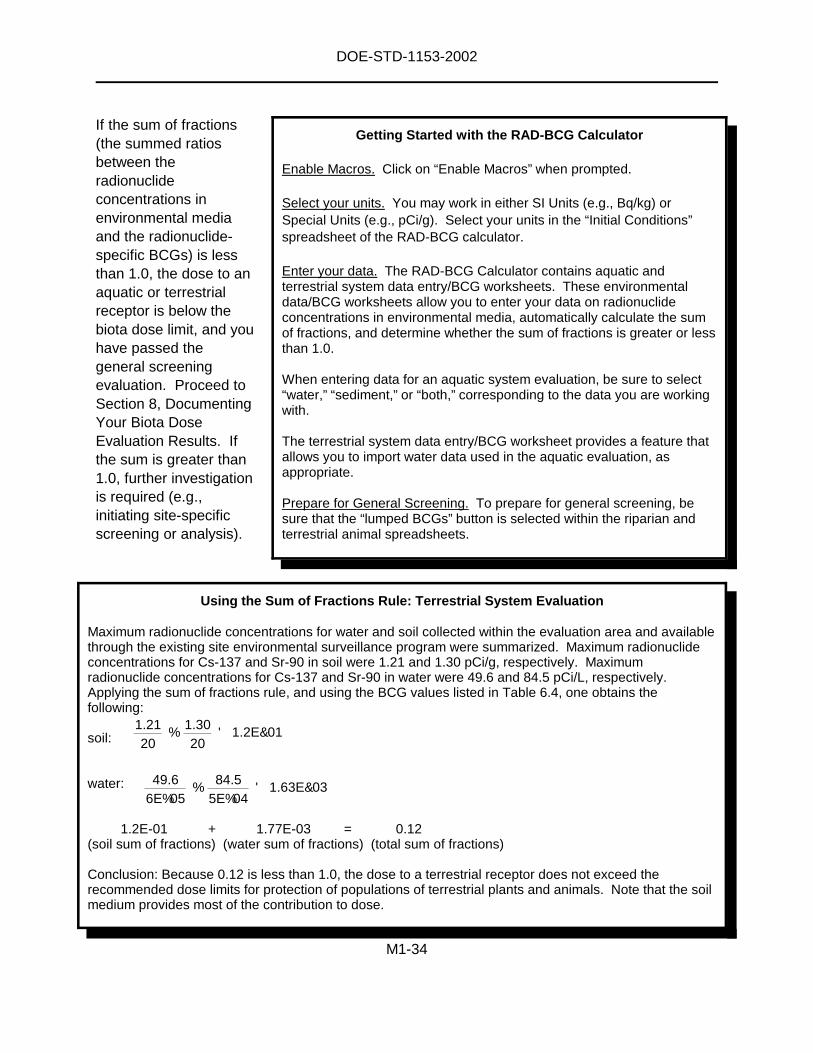
If the sum of fractions(the summed ratiosbetween theradionuclideconcentrations inenvironmental mediaand the radionuclide-specific BCGs) is lessthan 1.0, the dose to anaquatic or terrestrialreceptor is below thebiota dose limit, and youhave passed thegeneral screeningevaluation. Proceed toSection 8, DocumentingYour Biota DoseEvaluation Results. Ifthe sum is greater than1.0, further investigationis required (e.g.,initiating site-specificscreening or analysis).
Getting Started with the RAD-BCG Calculator
Enable Macros. Click on “Enable Macros” when prompted.
Select your units. You may work in either SI Units (e.g., Bq/kg) orSpecial Units (e.g., pCi/g). Select your units in the “Initial Conditions”spreadsheet of the RAD-BCG calculator.
Enter your data. The RAD-BCG Calculator contains aquatic andterrestrial system data entry/BCG worksheets. These environmentaldata/BCG worksheets allow you to enter your data on radionuclideconcentrations in environmental media, automatically calculate the sumof fractions, and determine whether the sum of fractions is greater or lessthan 1.0.
When entering data for an aquatic system evaluation, be sure to select“water,” “sediment,” or “both,” corresponding to the data you are workingwith.
The terrestrial system data entry/BCG worksheet provides a feature thatallows you to import water data used in the aquatic evaluation, asappropriate.
Prepare for General Screening. To prepare for general screening, besure that the “lumped BCGs” button is selected within the riparian andterrestrial animal spreadsheets.
1.2120
%1.3020
' 1.2E&01
49.66E%05
%84.5
5E%04' 1.63E&03
Using the Sum of Fractions Rule: Terrestrial System Evaluation
Maximum radionuclide concentrations for water and soil collected within the evaluation area and availablethrough the existing site environmental surveillance program were summarized. Maximum radionuclideconcentrations for Cs-137 and Sr-90 in soil were 1.21 and 1.30 pCi/g, respectively. Maximumradionuclide concentrations for Cs-137 and Sr-90 in water were 49.6 and 84.5 pCi/L, respectively.Applying the sum of fractions rule, and using the BCG values listed in Table 6.4, one obtains thefollowing:
soil:
water:
1.2E-01 + 1.77E-03 = 0.12(soil sum of fractions) (water sum of fractions) (total sum of fractions)
Conclusion: Because 0.12 is less than 1.0, the dose to a terrestrial receptor does not exceed therecommended dose limits for protection of populations of terrestrial plants and animals. Note that the soilmedium provides most of the contribution to dose.
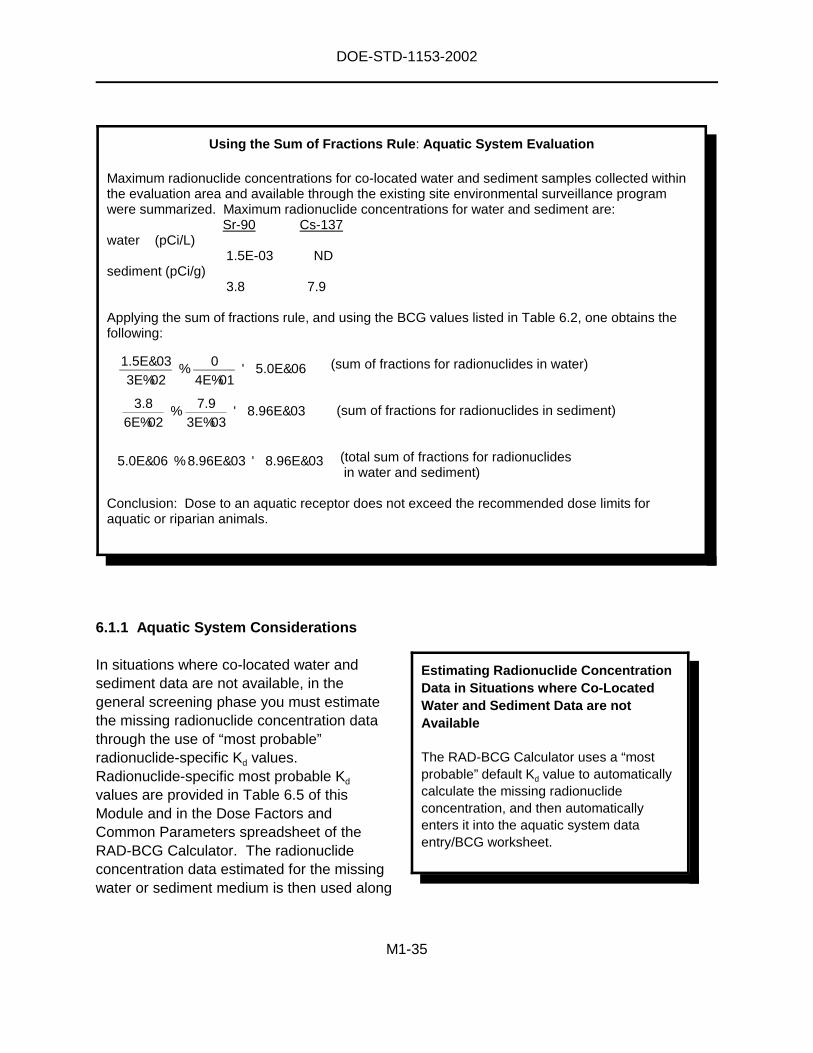
DOE-STD-1153-2002
M1-35
6.1.1 Aquatic System Considerations
In situations where co-located water andsediment data are not available, in thegeneral screening phase you must estimatethe missing radionuclide concentration datathrough the use of “most probable”radionuclide-specific Kd values.Radionuclide-specific most probable Kd
values are provided in Table 6.5 of thisModule and in the Dose Factors andCommon Parameters spreadsheet of theRAD-BCG Calculator. The radionuclideconcentration data estimated for the missingwater or sediment medium is then used along
1.5E&033E%02
%0
4E%01' 5.0E&06
5.0E&06 % 8.96E&03 ' 8.96E&03
3.86E%02
%7.9
3E%03' 8.96E&03
Using the Sum of Fractions Rule: Aquatic System Evaluation
Maximum radionuclide concentrations for co-located water and sediment samples collected withinthe evaluation area and available through the existing site environmental surveillance programwere summarized. Maximum radionuclide concentrations for water and sediment are:
Sr-90 Cs-137water (pCi/L)
1.5E-03 NDsediment (pCi/g)
3.8 7.9
Applying the sum of fractions rule, and using the BCG values listed in Table 6.2, one obtains thefollowing:
(sum of fractions for radionuclides in water)
(sum of fractions for radionuclides in sediment)
(total sum of fractions for radionuclidesin water and sediment)
Conclusion: Dose to an aquatic receptor does not exceed the recommended dose limits foraquatic or riparian animals.
Estimating Radionuclide ConcentrationData in Situations where Co-LocatedWater and Sediment Data are notAvailable
The RAD-BCG Calculator uses a “mostprobable” default Kd value to automaticallycalculate the missing radionuclideconcentration, and then automaticallyenters it into the aquatic system dataentry/BCG worksheet.
DOE-STD-1153-2002
M1-36
with the radionuclide concentration data for the available medium in the sum of fractionscalculation as described previously.
Judgement should be applied in determining if measured radionuclide concentration data forwater and sediment media can be considered as originating from co-located water andsediment samples. If measured radionuclide concentration data for water and sediment mediaare only available from separate locations, you should calculate the missing radionuclideconcentration data for each missing medium, and apply the approach that results in the highest(e.g., most conservative) sum of fractions in your biota dose evaluation. Equations forestimating radionuclide concentration data in situations where co-located water and sedimentdata are not available are provided in Module 3, Section 3.2.3. If the sum of fractions is lessthan 1.0, the dose to an aquatic receptor is below the biota dose limit, and you have passed thegeneral screening evaluation. Proceed to Section 8, Documenting Your Biota Dose EvaluationResults. If the sum is greater than 1.0, further investigation is required (e.g., initiating site-specific screening or analysis).
6.1.2 Dealing with High Background Levels of Naturally Occurring Radionuclides
Radiation dose rates at local background reference sites can be used to ensure that the site-related dose rates represent an actual increase in exposure. If the evaluation area is suspectedor has been documented to have high background levels of naturally occurring radionuclides,these background levels may be taken into account when determining compliance of DOEactivities with the biota dose limits. For example, this may be a consideration for the twoisotopes of radium (see BCGs for Ra-226 and Ra-228, Tables 6.1 - 6.4). Background levels forenvironmental media should be estimated based on data for the same or similar media types inuncontaminated areas. If the sum of fractions for measured radionuclide concentrations inmedia from the contaminated area exceeds 1.0, this sum should be compared with the sum offractions calculated using measured radionuclide concentrations in media from the backgroundarea. If the sum of fractions from the contaminated area does not exceed that from thebackground area, the contaminated area has passed the screening evaluation. Proceed toModule 1, Section 8 and document the results of the comparison. If it does exceed thebackground sum of fractions, proceed to the next phases of the graded approach. Refer toModule 2, Section 3.3.1, and Module 2, Section 6.3.1.5 for related guidance on this topic.
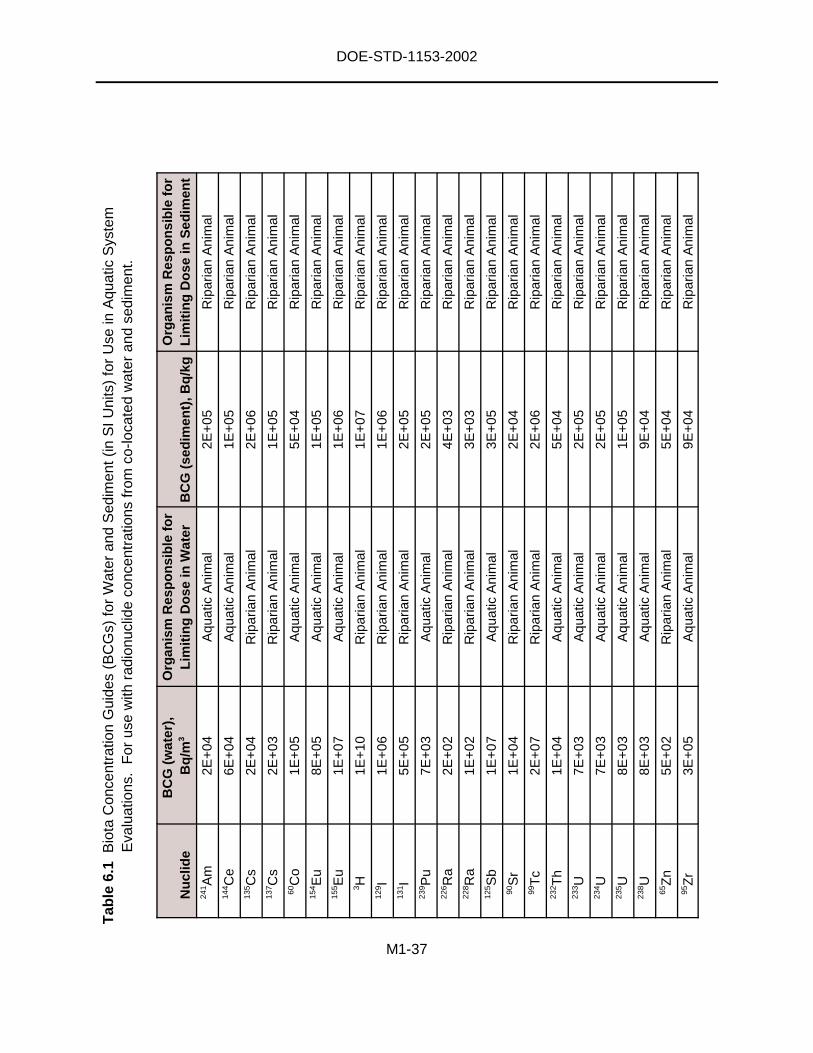
DOE-STD-1153-2002
M1-37
Tab
le6.
1B
iota
Con
cent
ratio
nG
uide
s(B
CG
s)fo
rW
ater
and
Sed
imen
t(in
SIU
nits
)fo
rU
sein
Aqu
atic
Sys
tem
Eva
luat
ions
.F
orus
ew
ithra
dion
uclid
eco
ncen
trat
ions
from
co-lo
cate
dw
ater
and
sedi
men
t.
Nu
clid
eB
CG
(wat
er),
Bq
/m3
Org
anis
mR
esp
on
sib
lefo
rL
imit
ing
Do
sein
Wat
erB
CG
(sed
imen
t),B
q/k
gO
rgan
ism
Res
po
nsi
ble
for
Lim
itin
gD
ose
inS
edim
ent
241 A
m2E
+04
Aqu
atic
Ani
mal
2E+
05R
ipar
ian
Ani
mal
144 C
e6E
+04
Aqu
atic
Ani
mal
1E+
05R
ipar
ian
Ani
mal
135 C
s2E
+04
Rip
aria
nA
nim
al2E
+06
Rip
aria
nA
nim
al13
7 Cs
2E+
03R
ipar
ian
Ani
mal
1E+
05R
ipar
ian
Ani
mal
60C
o1E
+05
Aqu
atic
Ani
mal
5E+
04R
ipar
ian
Ani
mal
154 E
u8E
+05
Aqu
atic
Ani
mal
1E+
05R
ipar
ian
Ani
mal
155 E
u1E
+07
Aqu
atic
Ani
mal
1E+
06R
ipar
ian
Ani
mal
3 H1E
+10
Rip
aria
nA
nim
al1E
+07
Rip
aria
nA
nim
al12
9 I1E
+06
Rip
aria
nA
nim
al1E
+06
Rip
aria
nA
nim
al13
1 I5E
+05
Rip
aria
nA
nim
al2E
+05
Rip
aria
nA
nim
al23
9 Pu
7E+
03A
quat
icA
nim
al2E
+05
Rip
aria
nA
nim
al22
6 Ra
2E+
02R
ipar
ian
Ani
mal
4E+
03R
ipar
ian
Ani
mal
228 R
a1E
+02
Rip
aria
nA
nim
al3E
+03
Rip
aria
nA
nim
al12
5 Sb
1E+
07A
quat
icA
nim
al3E
+05
Rip
aria
nA
nim
al90
Sr
1E+
04R
ipar
ian
Ani
mal
2E+
04R
ipar
ian
Ani
mal
99T
c2E
+07
Rip
aria
nA
nim
al2E
+06
Rip
aria
nA
nim
al23
2 Th
1E+
04A
quat
icA
nim
al5E
+04
Rip
aria
nA
nim
al23
3 U7E
+03
Aqu
atic
Ani
mal
2E+
05R
ipar
ian
Ani
mal
234 U
7E+
03A
quat
icA
nim
al2E
+05
Rip
aria
nA
nim
al23
5 U8E
+03
Aqu
atic
Ani
mal
1E+
05R
ipar
ian
Ani
mal
238 U
8E+
03A
quat
icA
nim
al9E
+04
Rip
aria
nA
nim
al65
Zn
5E+
02R
ipar
ian
Ani
mal
5E+
04R
ipar
ian
Ani
mal
95Z
r3E
+05
Aqu
atic
Ani
mal
9E+
04R
ipar
ian
Ani
mal
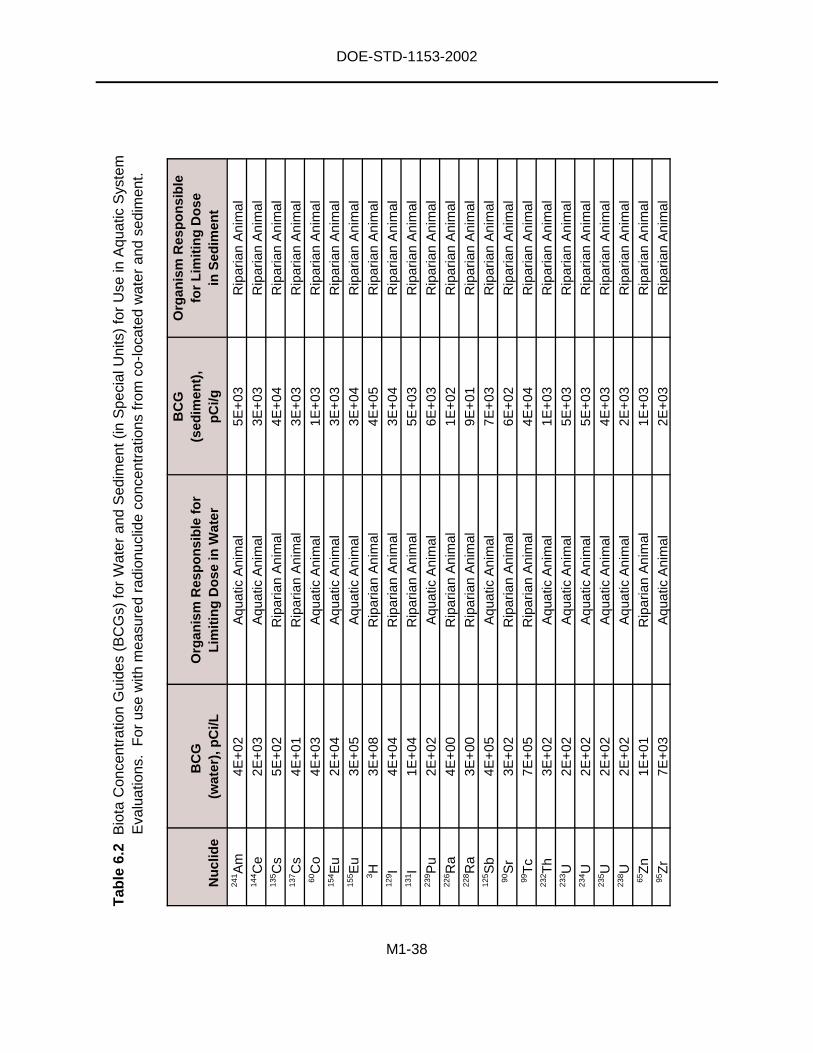
DOE-STD-1153-2002
M1-38
Tab
le6.
2B
iota
Con
cent
ratio
nG
uide
s(B
CG
s)fo
rW
ater
and
Sed
imen
t(in
Spe
cial
Uni
ts)
for
Use
inA
quat
icS
yste
mE
valu
atio
ns.
For
use
with
mea
sure
dra
dion
uclid
eco
ncen
trat
ions
from
co-lo
cate
dw
ater
and
sedi
men
t.
Nu
clid
eB
CG
(wat
er),
pC
i/LO
rgan
ism
Res
po
nsi
ble
for
Lim
itin
gD
ose
inW
ater
BC
G(s
edim
ent)
,p
Ci/g
Org
anis
mR
esp
on
sib
lefo
rL
imit
ing
Do
sein
Sed
imen
t24
1 Am
4E+
02A
quat
icA
nim
al5E
+03
Rip
aria
nA
nim
al14
4 Ce
2E+
03A
quat
icA
nim
al3E
+03
Rip
aria
nA
nim
al13
5 Cs
5E+
02R
ipar
ian
Ani
mal
4E+
04R
ipar
ian
Ani
mal
137 C
s4E
+01
Rip
aria
nA
nim
al3E
+03
Rip
aria
nA
nim
al60
Co
4E+
03A
quat
icA
nim
al1E
+03
Rip
aria
nA
nim
al15
4 Eu
2E+
04A
quat
icA
nim
al3E
+03
Rip
aria
nA
nim
al15
5 Eu
3E+
05A
quat
icA
nim
al3E
+04
Rip
aria
nA
nim
al3 H
3E+
08R
ipar
ian
Ani
mal
4E+
05R
ipar
ian
Ani
mal
129 I
4E+
04R
ipar
ian
Ani
mal
3E+
04R
ipar
ian
Ani
mal
131 I
1E+
04R
ipar
ian
Ani
mal
5E+
03R
ipar
ian
Ani
mal
239 P
u2E
+02
Aqu
atic
Ani
mal
6E+
03R
ipar
ian
Ani
mal
226 R
a4E
+00
Rip
aria
nA
nim
al1E
+02
Rip
aria
nA
nim
al22
8 Ra
3E+
00R
ipar
ian
Ani
mal
9E+
01R
ipar
ian
Ani
mal
125 S
b4E
+05
Aqu
atic
Ani
mal
7E+
03R
ipar
ian
Ani
mal
90S
r3E
+02
Rip
aria
nA
nim
al6E
+02
Rip
aria
nA
nim
al99
Tc
7E+
05R
ipar
ian
Ani
mal
4E+
04R
ipar
ian
Ani
mal
232 T
h3E
+02
Aqu
atic
Ani
mal
1E+
03R
ipar
ian
Ani
mal
233 U
2E+
02A
quat
icA
nim
al5E
+03
Rip
aria
nA
nim
al23
4 U2E
+02
Aqu
atic
Ani
mal
5E+
03R
ipar
ian
Ani
mal
235 U
2E+
02A
quat
icA
nim
al4E
+03
Rip
aria
nA
nim
al23
8 U2E
+02
Aqu
atic
Ani
mal
2E+
03R
ipar
ian
Ani
mal
65Z
n1E
+01
Rip
aria
nA
nim
al1E
+03
Rip
aria
nA
nim
al95
Zr
7E+
03A
quat
icA
nim
al2E
+03
Rip
aria
nA
nim
al
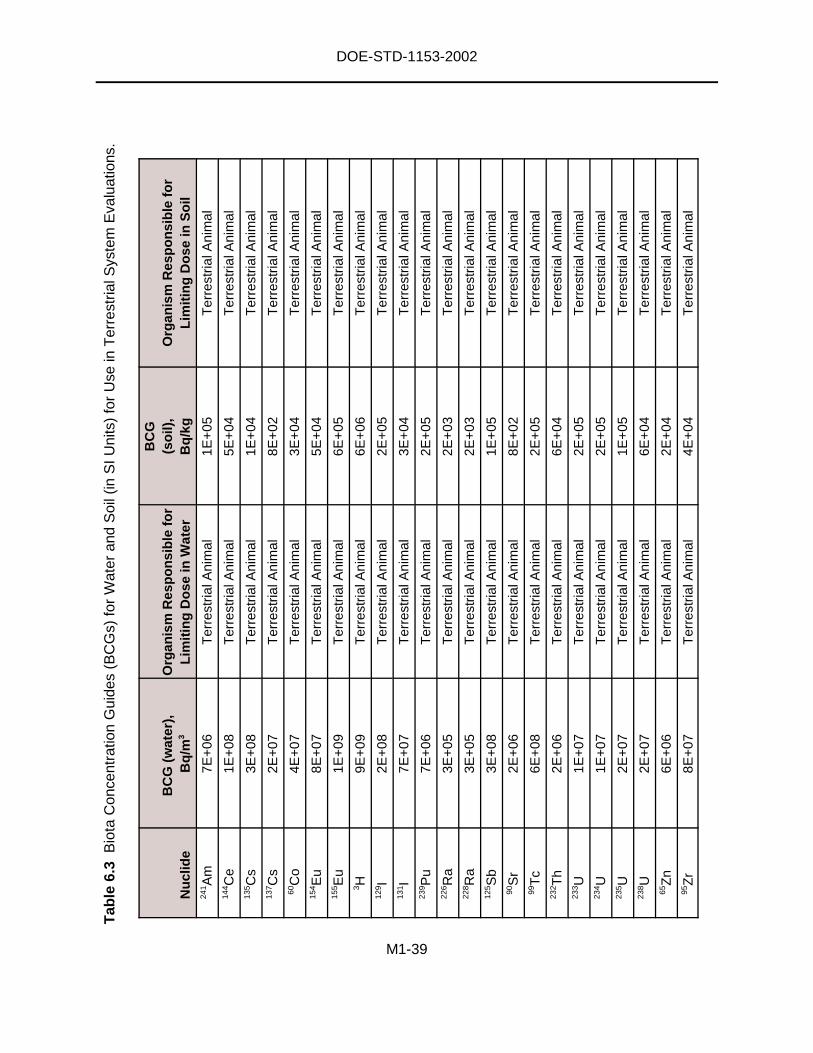
DOE-STD-1153-2002
M1-39
Tab
le6.
3B
iota
Con
cent
ratio
nG
uide
s(B
CG
s)fo
rW
ater
and
Soi
l(in
SIU
nits
)fo
rU
sein
Ter
rest
rialS
yste
mE
valu
atio
ns.
Nu
clid
eB
CG
(wat
er),
Bq
/m3
Org
anis
mR
esp
on
sib
lefo
rL
imit
ing
Do
sein
Wat
er
BC
G(s
oil)
,B
q/k
gO
rgan
ism
Res
po
nsi
ble
for
Lim
itin
gD
ose
inS
oil
241 A
m7E
+06
Ter
rest
rialA
nim
al1E
+05
Ter
rest
rialA
nim
al14
4 Ce
1E+
08T
erre
stria
lAni
mal
5E+
04T
erre
stria
lAni
mal
135 C
s3E
+08
Ter
rest
rialA
nim
al1E
+04
Ter
rest
rialA
nim
al13
7 Cs
2E+
07T
erre
stria
lAni
mal
8E+
02T
erre
stria
lAni
mal
60C
o4E
+07
Ter
rest
rialA
nim
al3E
+04
Ter
rest
rialA
nim
al15
4 Eu
8E+
07T
erre
stria
lAni
mal
5E+
04T
erre
stria
lAni
mal
155 E
u1E
+09
Ter
rest
rialA
nim
al6E
+05
Ter
rest
rialA
nim
al3 H
9E+
09T
erre
stria
lAni
mal
6E+
06T
erre
stria
lAni
mal
129 I
2E+
08T
erre
stria
lAni
mal
2E+
05T
erre
stria
lAni
mal
131 I
7E+
07T
erre
stria
lAni
mal
3E+
04T
erre
stria
lAni
mal
239 P
u7E
+06
Ter
rest
rialA
nim
al2E
+05
Ter
rest
rialA
nim
al22
6 Ra
3E+
05T
erre
stria
lAni
mal
2E+
03T
erre
stria
lAni
mal
228 R
a3E
+05
Ter
rest
rialA
nim
al2E
+03
Ter
rest
rialA
nim
al12
5 Sb
3E+
08T
erre
stria
lAni
mal
1E+
05T
erre
stria
lAni
mal
90S
r2E
+06
Ter
rest
rialA
nim
al8E
+02
Ter
rest
rialA
nim
al99
Tc
6E+
08T
erre
stria
lAni
mal
2E+
05T
erre
stria
lAni
mal
232 T
h2E
+06
Ter
rest
rialA
nim
al6E
+04
Ter
rest
rialA
nim
al23
3 U1E
+07
Ter
rest
rialA
nim
al2E
+05
Ter
rest
rialA
nim
al23
4 U1E
+07
Ter
rest
rialA
nim
al2E
+05
Ter
rest
rialA
nim
al23
5 U2E
+07
Ter
rest
rialA
nim
al1E
+05
Ter
rest
rialA
nim
al23
8 U2E
+07
Ter
rest
rialA
nim
al6E
+04
Ter
rest
rialA
nim
al65
Zn
6E+
06T
erre
stria
lAni
mal
2E+
04T
erre
stria
lAni
mal
95Z
r8E
+07
Ter
rest
rialA
nim
al4E
+04
Ter
rest
rialA
nim
al
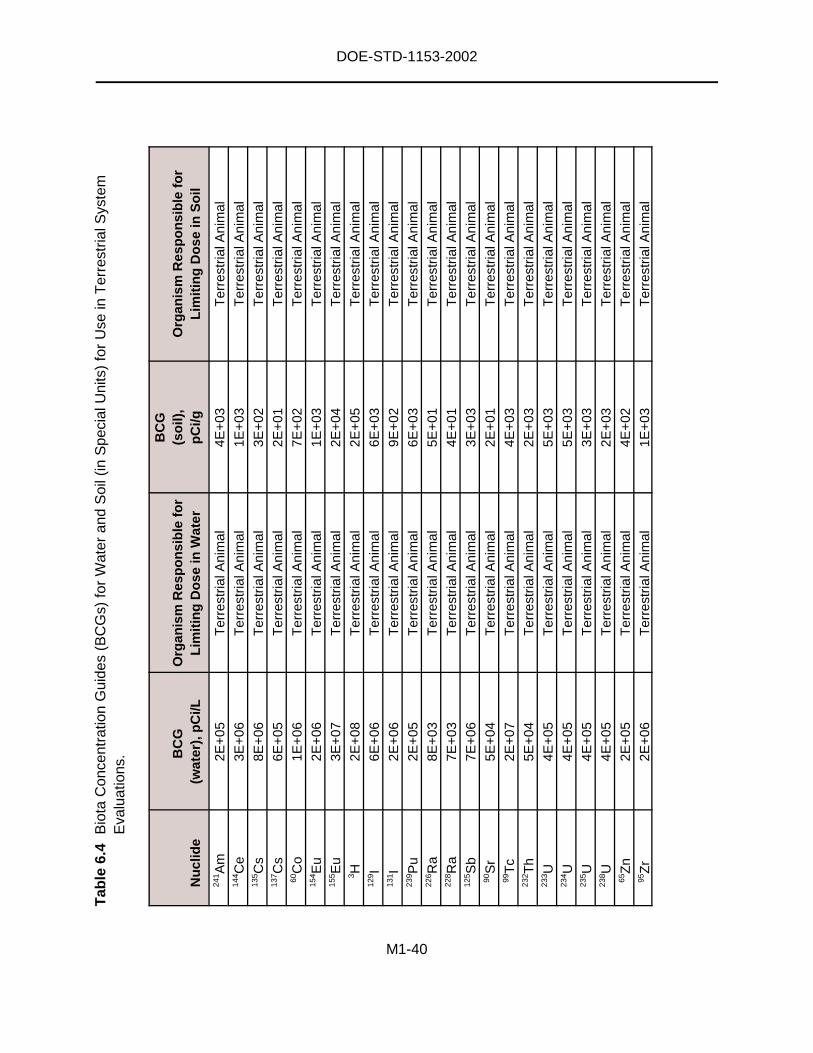
DOE-STD-1153-2002
M1-40
Tab
le6.
4B
iota
Con
cent
ratio
nG
uide
s(B
CG
s)fo
rW
ater
and
Soi
l(in
Spe
cial
Uni
ts)
for
Use
inT
erre
stria
lSys
tem
Eva
luat
ions
.
Nu
clid
eB
CG
(wat
er),
pC
i/LO
rgan
ism
Res
po
nsi
ble
for
Lim
itin
gD
ose
inW
ater
BC
G(s
oil)
,p
Ci/g
Org
anis
mR
esp
on
sib
lefo
rL
imit
ing
Do
sein
So
il24
1 Am
2E+
05T
erre
stria
lAni
mal
4E+
03T
erre
stria
lAni
mal
144 C
e3E
+06
Ter
rest
rialA
nim
al1E
+03
Ter
rest
rialA
nim
al13
5 Cs
8E+
06T
erre
stria
lAni
mal
3E+
02T
erre
stria
lAni
mal
137 C
s6E
+05
Ter
rest
rialA
nim
al2E
+01
Ter
rest
rialA
nim
al60
Co
1E+
06T
erre
stria
lAni
mal
7E+
02T
erre
stria
lAni
mal
154 E
u2E
+06
Ter
rest
rialA
nim
al1E
+03
Ter
rest
rialA
nim
al15
5 Eu
3E+
07T
erre
stria
lAni
mal
2E+
04T
erre
stria
lAni
mal
3 H2E
+08
Ter
rest
rialA
nim
al2E
+05
Ter
rest
rialA
nim
al12
9 I6E
+06
Ter
rest
rialA
nim
al6E
+03
Ter
rest
rialA
nim
al13
1 I2E
+06
Ter
rest
rialA
nim
al9E
+02
Ter
rest
rialA
nim
al23
9 Pu
2E+
05T
erre
stria
lAni
mal
6E+
03T
erre
stria
lAni
mal
226 R
a8E
+03
Ter
rest
rialA
nim
al5E
+01
Ter
rest
rialA
nim
al22
8 Ra
7E+
03T
erre
stria
lAni
mal
4E+
01T
erre
stria
lAni
mal
125 S
b7E
+06
Ter
rest
rialA
nim
al3E
+03
Ter
rest
rialA
nim
al90
Sr
5E+
04T
erre
stria
lAni
mal
2E+
01T
erre
stria
lAni
mal
99T
c2E
+07
Ter
rest
rialA
nim
al4E
+03
Ter
rest
rialA
nim
al23
2 Th
5E+
04T
erre
stria
lAni
mal
2E+
03T
erre
stria
lAni
mal
233 U
4E+
05T
erre
stria
lAni
mal
5E+
03T
erre
stria
lAni
mal
234 U
4E+
05T
erre
stria
lAni
mal
5E+
03T
erre
stria
lAni
mal
235 U
4E+
05T
erre
stria
lAni
mal
3E+
03T
erre
stria
lAni
mal
238 U
4E+
05T
erre
stria
lAni
mal
2E+
03T
erre
stria
lAni
mal
65Z
n2E
+05
Ter
rest
rialA
nim
al4E
+02
Ter
rest
rialA
nim
al95
Zr
2E+
06T
erre
stria
lAni
mal
1E+
03T
erre
stria
lAni
mal
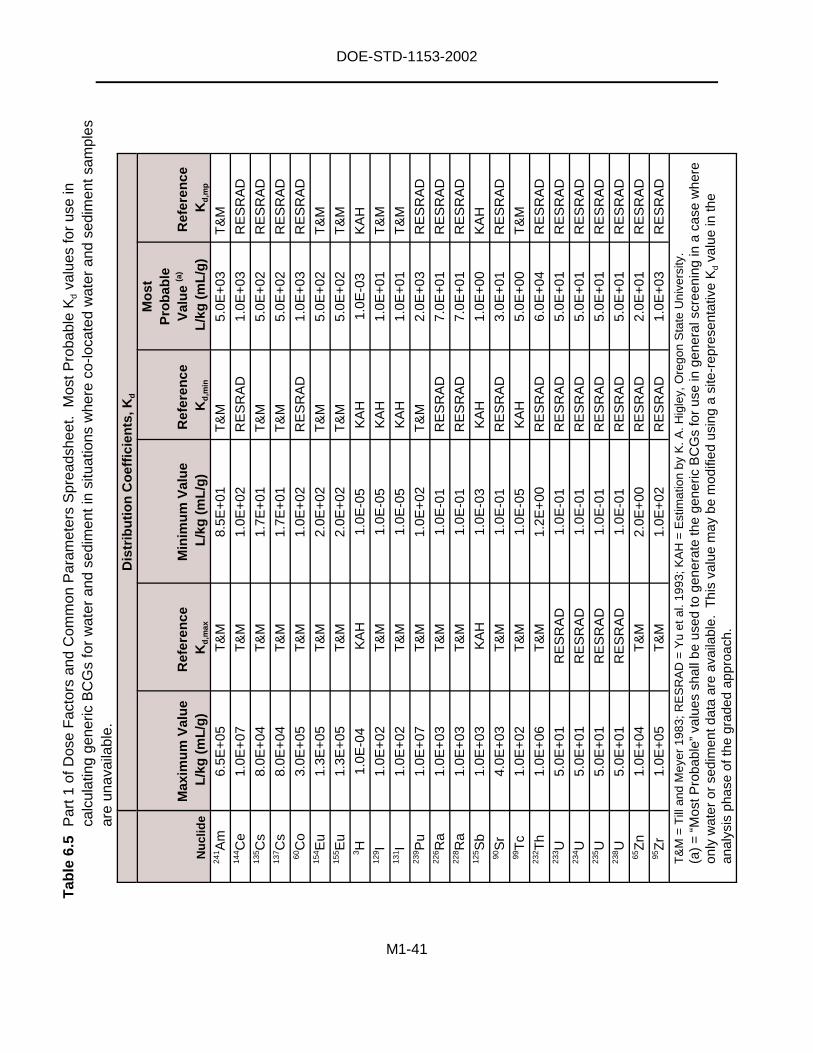
DOE-STD-1153-2002
M1-41
Dis
trib
uti
on
Co
effi
cien
ts,K
d
Nu
clid
e
Max
imu
mV
alu
eL
/kg
(mL
/g)
Ref
eren
ceK
d,m
ax
Min
imu
mV
alu
eL
/kg
(mL
/g)
Ref
eren
ceK
d,m
in
Mo
stP
rob
able
Val
ue
(a)
L/k
g(m
L/g
)R
efer
ence
Kd
,mp
241 A
m6.
5E+
05T
&M
8.5E
+01
T&
M5.
0E+
03T
&M
144 C
e1.
0E+
07T
&M
1.0E
+02
RE
SR
AD
1.0E
+03
RE
SR
AD
135 C
s8.
0E+
04T
&M
1.7E
+01
T&
M5.
0E+
02R
ES
RA
D13
7 Cs
8.0E
+04
T&
M1.
7E+
01T
&M
5.0E
+02
RE
SR
AD
60C
o3.
0E+
05T
&M
1.0E
+02
RE
SR
AD
1.0E
+03
RE
SR
AD
154 E
u1.
3E+
05T
&M
2.0E
+02
T&
M5.
0E+
02T
&M
155 E
u1.
3E+
05T
&M
2.0E
+02
T&
M5.
0E+
02T
&M
3 H1.
0E-0
4K
AH
1.0E
-05
KA
H1.
0E-0
3K
AH
129 I
1.0E
+02
T&
M1.
0E-0
5K
AH
1.0E
+01
T&
M13
1 I1.
0E+
02T
&M
1.0E
-05
KA
H1.
0E+
01T
&M
239 P
u1.
0E+
07T
&M
1.0E
+02
T&
M2.
0E+
03R
ES
RA
D22
6 Ra
1.0E
+03
T&
M1.
0E-0
1R
ES
RA
D7.
0E+
01R
ES
RA
D22
8 Ra
1.0E
+03
T&
M1.
0E-0
1R
ES
RA
D7.
0E+
01R
ES
RA
D12
5 Sb
1.0E
+03
KA
H1.
0E-0
3K
AH
1.0E
+00
KA
H90
Sr
4.0E
+03
T&
M1.
0E-0
1R
ES
RA
D3.
0E+
01R
ES
RA
D99
Tc
1.0E
+02
T&
M1.
0E-0
5K
AH
5.0E
+00
T&
M23
2 Th
1.0E
+06
T&
M1.
2E+
00R
ES
RA
D6.
0E+
04R
ES
RA
D23
3 U5.
0E+
01R
ES
RA
D1.
0E-0
1R
ES
RA
D5.
0E+
01R
ES
RA
D23
4 U5.
0E+
01R
ES
RA
D1.
0E-0
1R
ES
RA
D5.
0E+
01R
ES
RA
D23
5 U5.
0E+
01R
ES
RA
D1.
0E-0
1R
ES
RA
D5.
0E+
01R
ES
RA
D23
8 U5.
0E+
01R
ES
RA
D1.
0E-0
1R
ES
RA
D5.
0E+
01R
ES
RA
D65
Zn
1.0E
+04
T&
M2.
0E+
00R
ES
RA
D2.
0E+
01R
ES
RA
D95
Zr
1.0E
+05
T&
M1.
0E+
02R
ES
RA
D1.
0E+
03R
ES
RA
D
T&
M=
Till
and
Mey
er19
83;R
ES
RA
D=
Yu
etal
.199
3;K
AH
=E
stim
atio
nby
K.A
.Hig
ley,
Ore
gon
Sta
teU
nive
rsity
.(a
)=
“Mos
tPro
babl
e”va
lues
shal
lbe
used
toge
nera
teth
ege
neric
BC
Gs
for
use
inge
nera
lscr
eeni
ngin
aca
sew
here
only
wat
eror
sedi
men
tdat
aar
eav
aila
ble.
Thi
sva
lue
may
bem
odifi
edus
ing
asi
te-r
epre
sent
ativ
eK
dva
lue
inth
ean
alys
isph
ase
ofth
egr
aded
appr
oach
.
Tab
le6.
5P
art1
ofD
ose
Fac
tors
and
Com
mon
Par
amet
ers
Spr
eads
heet
.M
ostP
roba
ble
Kd
valu
esfo
rus
ein
calc
ulat
ing
gene
ricB
CG
sfo
rw
ater
and
sedi
men
tin
situ
atio
nsw
here
co-lo
cate
dw
ater
and
sedi
men
tsam
ples
are
unav
aila
ble.

DOE-STD-1153-2002
M1-42
INTENTIONALLY BLANK
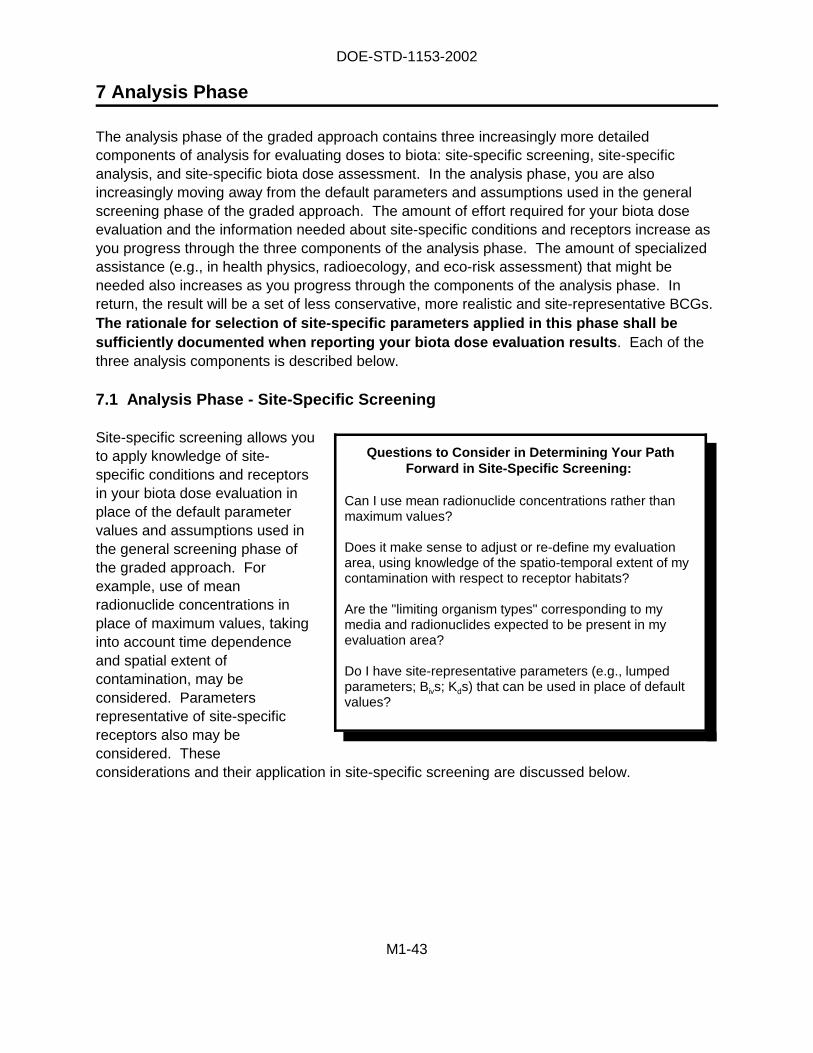
DOE-STD-1153-2002
M1-43
Questions to Consider in Determining Your PathForward in Site-Specific Screening:
Can I use mean radionuclide concentrations rather thanmaximum values?
Does it make sense to adjust or re-define my evaluationarea, using knowledge of the spatio-temporal extent of mycontamination with respect to receptor habitats?
Are the "limiting organism types" corresponding to mymedia and radionuclides expected to be present in myevaluation area?
Do I have site-representative parameters (e.g., lumpedparameters; Bivs; Kds) that can be used in place of defaultvalues?
7 Analysis Phase
The analysis phase of the graded approach contains three increasingly more detailedcomponents of analysis for evaluating doses to biota: site-specific screening, site-specificanalysis, and site-specific biota dose assessment. In the analysis phase, you are alsoincreasingly moving away from the default parameters and assumptions used in the generalscreening phase of the graded approach. The amount of effort required for your biota doseevaluation and the information needed about site-specific conditions and receptors increase asyou progress through the three components of the analysis phase. The amount of specializedassistance (e.g., in health physics, radioecology, and eco-risk assessment) that might beneeded also increases as you progress through the components of the analysis phase. Inreturn, the result will be a set of less conservative, more realistic and site-representative BCGs.The rationale for selection of site-specific parameters applied in this phase shall besufficiently documented when reporting your biota dose evaluation results. Each of thethree analysis components is described below.
7.1 Analysis Phase - Site-Specific Screening
Site-specific screening allows youto apply knowledge of site-specific conditions and receptorsin your biota dose evaluation inplace of the default parametervalues and assumptions used inthe general screening phase ofthe graded approach. Forexample, use of meanradionuclide concentrations inplace of maximum values, takinginto account time dependenceand spatial extent ofcontamination, may beconsidered. Parametersrepresentative of site-specificreceptors also may beconsidered. Theseconsiderations and their application in site-specific screening are discussed below.
DOE-STD-1153-2002
M1-44
7.1.1 Step 1: Assess the Representativeness of Your Input Data on RadionuclideConcentrations in Environmental Media and the Delineation of YourEvaluation Area
Spatial and temporal variability relative to the distribution of contamination in the evaluationarea can be taken into account when evaluating doses to biota. Each of the elements presentedbelow should be considered collectively as you proceed through this step.
7.1.1.1 Consider Using Mean Radionuclide Concentrations
Determine if mean radionuclide concentrations can be used in place of maximumconcentrations. For example, use of mean values is appropriate and permitted in situationswhere time-series data are available and of sufficient quality. Spatial variability in thedistribution of contamination can also be taken into account. Note that depending on thepurpose of your application of the graded approach, you may be requested (e.g., by regulatorsor stakeholders) to use only maximum radionuclide concentration data rather than meanvalues. Detailed guidance on applying spatio-temporal considerations in determining meanradionuclide concentrations for use in the graded approach is provided in Module 2, Section 3.
7.1.1.2 Consider Refining the Evaluation Area
It may be useful to re-assess your rationale for delineating the evaluation area (e.g., breakingone large area into several smaller areas) through consideration of the quality and spatio-temporal distribution of radionuclide concentration data, the ecological susceptibility andhabitats of the receptors, and the spatial distribution of contaminants with respect to thesehabitats. Refer to Module 2, Section 4 for detailed guidance in this area.
7.1.1.3 Consider Obtaining Additional Radionuclide Concentration Data
Consider collecting additional radionuclide concentration data. For an aquatic systemevaluation, consider using co-located water and sediment data if you have not already done so.
7.1.2 Step 2: Re-Run the Screening Evaluation Using Revised RadionuclideConcentration Data and/or Evaluation Area
Here you are comparing your refined data on measured radionuclide concentrationscorresponding to your original or re-defined evaluation area, with the generic BCGs. This isdone by re-entering these revised data into the appropriate environmental data/BCG worksheetin the RAD-BCG Calculator. It is important to note that in this step you have not modified theinitial, generic BCG values. They are the same generic BCGs that are used in the generalscreening phase of the graded approach. This step is considered a site-specific screen in thatyou are now making site-specific judgements relative to your measured radionuclideconcentration data and your evaluation area. If the sum of fractions is less than 1.0, then you
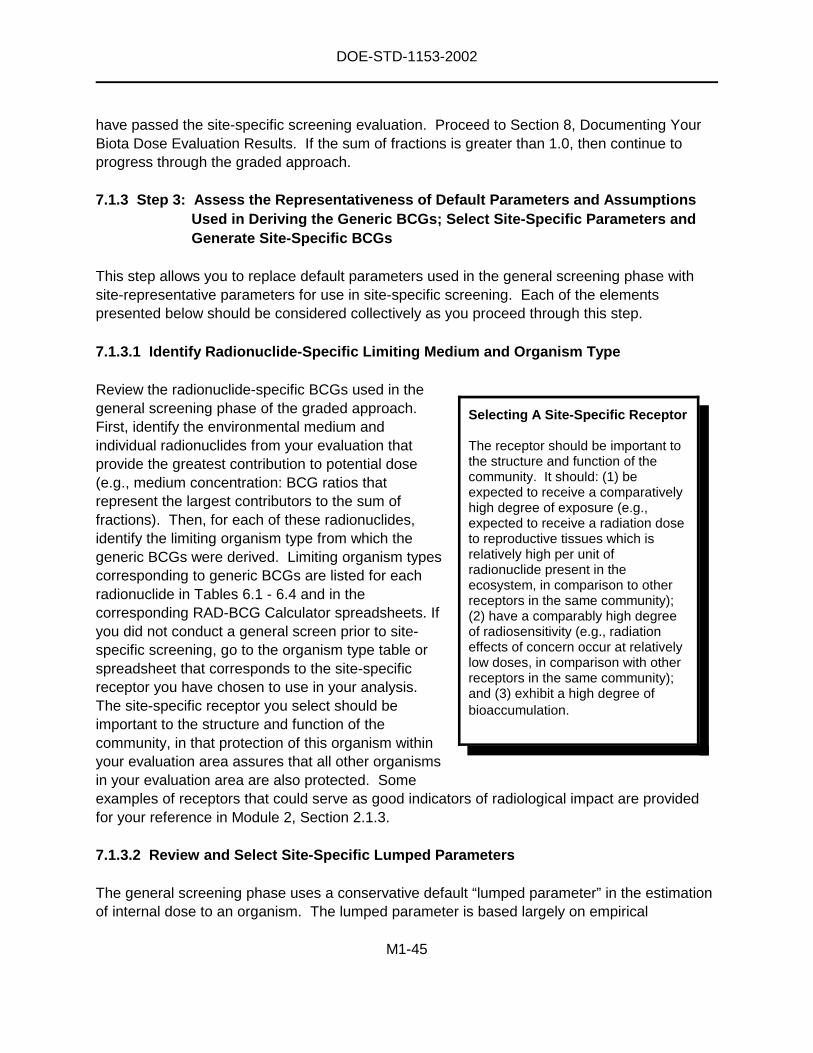
DOE-STD-1153-2002
M1-45
have passed the site-specific screening evaluation. Proceed to Section 8, Documenting YourBiota Dose Evaluation Results. If the sum of fractions is greater than 1.0, then continue toprogress through the graded approach.
7.1.3 Step 3: Assess the Representativeness of Default Parameters and AssumptionsUsed in Deriving the Generic BCGs; Select Site-Specific Parameters andGenerate Site-Specific BCGs
This step allows you to replace default parameters used in the general screening phase withsite-representative parameters for use in site-specific screening. Each of the elementspresented below should be considered collectively as you proceed through this step.
7.1.3.1 Identify Radionuclide-Specific Limiting Medium and Organism Type
Review the radionuclide-specific BCGs used in thegeneral screening phase of the graded approach.First, identify the environmental medium andindividual radionuclides from your evaluation thatprovide the greatest contribution to potential dose(e.g., medium concentration: BCG ratios thatrepresent the largest contributors to the sum offractions). Then, for each of these radionuclides,identify the limiting organism type from which thegeneric BCGs were derived. Limiting organism typescorresponding to generic BCGs are listed for eachradionuclide in Tables 6.1 - 6.4 and in thecorresponding RAD-BCG Calculator spreadsheets. Ifyou did not conduct a general screen prior to site-specific screening, go to the organism type table orspreadsheet that corresponds to the site-specificreceptor you have chosen to use in your analysis.The site-specific receptor you select should beimportant to the structure and function of thecommunity, in that protection of this organism withinyour evaluation area assures that all other organismsin your evaluation area are also protected. Someexamples of receptors that could serve as good indicators of radiological impact are providedfor your reference in Module 2, Section 2.1.3.
7.1.3.2 Review and Select Site-Specific Lumped Parameters
The general screening phase uses a conservative default “lumped parameter” in the estimationof internal dose to an organism. The lumped parameter is based largely on empirical
Selecting A Site-Specific Receptor
The receptor should be important tothe structure and function of thecommunity. It should: (1) beexpected to receive a comparativelyhigh degree of exposure (e.g.,expected to receive a radiation doseto reproductive tissues which isrelatively high per unit ofradionuclide present in theecosystem, in comparison to otherreceptors in the same community);(2) have a comparably high degreeof radiosensitivity (e.g., radiationeffects of concern occur at relativelylow doses, in comparison with otherreceptors in the same community);and (3) exhibit a high degree ofbioaccumulation.
DOE-STD-1153-2002
M1-46
measurements of radionuclides in biological tissues of organisms collected in contaminatedhabitats. In cases where empirical measurements are unavailable or few in number, thelumped parameter is based on a conservative value derived using uncertainty analysis on thekinetic/allometric method (see Module 3, Section 3.5). The lumped parameter serves as a“natural integrator” of internal contamination in that it inherently reflects all pathways of intakeby an organism. Here, in site-specific screening, lumped parameters representative of site-specific conditions and receptors are used to generate site-specific BCGs in place of the defaultlumped parameters that were used in generating the generic BCGs. This site-specific screeningresults in a less conservative, more realistic evaluation of potential doses to biota for your areaof evaluation.
The initial values of the lumped parameters were specifically chosen to produce conservative(e.g., highly protective) BCGs. It is recognized that actual lumped parameters for a singleradionuclide may range over several orders of magnitude, depending upon biotic and abioticfeatures of the environment. In step 3 you review the default lumped parameters used inderiving the BCGs for the appropriate organism type. The default lumped parameter values(and other input parameters) are contained in a set of organism type tables (Tables 7.1 - 7.4).The RAD-BCG Calculator contains similar tables which can be easily located (see Module 1,Section 4). Review and select lumped parameters representative of site-specific conditions andreceptors you have selected for your evaluation area. These site-specific lumped parametersare entered into the appropriate organism type spreadsheet in the RAD-BCG Calculator andused to generate site-specific BCGs. Sources for lumped parameter values representative ofyour site-specific conditions and receptors include: (1) your own site-derived lumpedparameters (e.g., Bivs) for site-specific receptors; (2) values published in the scientific literatureor in site-specific technical reports (e.g., from specialized ecological studies) for receptors thatare comparable to site-specific receptors in your evaluation area; and (3) databases such asthe pilot version of the Biota Dose Assessment Database of Environmental Parameters(BDAD), which is accessible via the Internet through the BDAC web site(http://homer.ornl.gov/oepa/public/bdac).
7.1.3.3 Review and Select Site-Representative Kds
For aquatic system evaluations where co-located water and sediment samples are notavailable, recall that in the general screening phase a most probable Kd is used to calculate theenvironmental media radionuclide concentration and dose contribution of either the missingwater or sediment component. Site-specific screening allows you to consider the use of a site-representative Kd value in place of the default most probable value that was used in the generalscreening phase. Minimum, maximum, and most probable Kd values for each radionuclide areprovided in Table 6.5. Sources for Kd values representative of your site specific conditionsinclude: (1) your own site-derived Kd values; (2) values published in the scientific literature or insite-specific technical reports; and (3) databases such as the pilot version of the BDAD, whichis accessible via the Internet (see above). Site-representative Kd values are entered into the
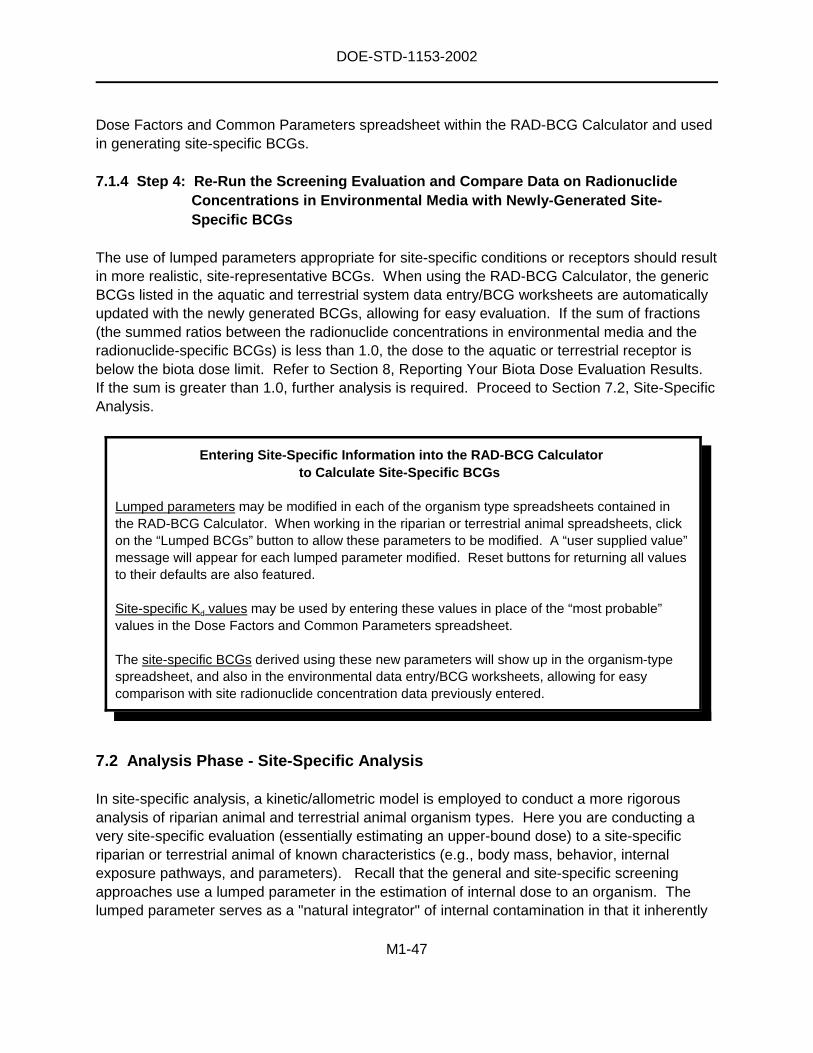
DOE-STD-1153-2002
M1-47
Dose Factors and Common Parameters spreadsheet within the RAD-BCG Calculator and usedin generating site-specific BCGs.
7.1.4 Step 4: Re-Run the Screening Evaluation and Compare Data on RadionuclideConcentrations in Environmental Media with Newly-Generated Site-Specific BCGs
The use of lumped parameters appropriate for site-specific conditions or receptors should resultin more realistic, site-representative BCGs. When using the RAD-BCG Calculator, the genericBCGs listed in the aquatic and terrestrial system data entry/BCG worksheets are automaticallyupdated with the newly generated BCGs, allowing for easy evaluation. If the sum of fractions(the summed ratios between the radionuclide concentrations in environmental media and theradionuclide-specific BCGs) is less than 1.0, the dose to the aquatic or terrestrial receptor isbelow the biota dose limit. Refer to Section 8, Reporting Your Biota Dose Evaluation Results.If the sum is greater than 1.0, further analysis is required. Proceed to Section 7.2, Site-SpecificAnalysis.
7.2 Analysis Phase - Site-Specific Analysis
In site-specific analysis, a kinetic/allometric model is employed to conduct a more rigorousanalysis of riparian animal and terrestrial animal organism types. Here you are conducting avery site-specific evaluation (essentially estimating an upper-bound dose) to a site-specificriparian or terrestrial animal of known characteristics (e.g., body mass, behavior, internalexposure pathways, and parameters). Recall that the general and site-specific screeningapproaches use a lumped parameter in the estimation of internal dose to an organism. Thelumped parameter serves as a "natural integrator" of internal contamination in that it inherently
Entering Site-Specific Information into the RAD-BCG Calculatorto Calculate Site-Specific BCGs
Lumped parameters may be modified in each of the organism type spreadsheets contained inthe RAD-BCG Calculator. When working in the riparian or terrestrial animal spreadsheets, clickon the “Lumped BCGs” button to allow these parameters to be modified. A “user supplied value”message will appear for each lumped parameter modified. Reset buttons for returning all valuesto their defaults are also featured.
Site-specific Kd values may be used by entering these values in place of the “most probable”values in the Dose Factors and Common Parameters spreadsheet.
The site-specific BCGs derived using these new parameters will show up in the organism-typespreadsheet, and also in the environmental data entry/BCG worksheets, allowing for easycomparison with site radionuclide concentration data previously entered.

DOE-STD-1153-2002
M1-48
reflects all pathways of intake by an organism. In site-specific analysis, simplistic, first-orderkinetic modeling is used to examine the internal pathways of exposure for riparian animal andterrestrial animal receptors in greater detail. Appropriate parameters representing individualmechanisms (e.g., ingestion; inhalation) that contribute to internal dose are applied in place ofthe lumped parameter (one value which reflects all mechanisms contributing to internal dose).Appropriate values (e.g., organism body mass; ingestion rate; inhalation rate; biological uptakeand elimination rates) representative of site-specific conditions and receptors are used in theestimation of internal dose and generation of site-specific BCGs. Allometric equations relatingbody size to many of these parameters (e.g., ingestion rate; inhalation rate; life span) are usedin the estimation of internal dose. Alternatively, you can enter your own values in place ofallometrically derived parameters. A correction factor for exposure area or organism residencetime may also be applied for all organism types in site-specific analysis.
7.2.1 Step 5: Assess the Representativeness of Default Parameters and AssumptionsEmployed in Kinetic/Allometric Models; Select Site-Specific Parametersand Generate Site-Specific BCGs
This step allows you to examine and replace default parameters, assumptions, and allometricrelationships used in kinetic/allometric models to derive BCGs for riparian animals andterrestrial animals. A correction factor for exposure area or organism residence time may alsobe applied for all organism types. Each of the elements presented below should be consideredcollectively when implementing this step.
7.2.1.1 Identify Radionuclide-Specific Limiting Medium and Organism Type
Review the radionuclide-specific BCGs used in the general or site-specific screening portions ofthe graded approach. First, identify the environmental medium and individual radionuclidesfrom your evaluation that provide the greatest contribution to potential dose (e.g., mediumconcentration:BCG ratios that represent the largest contributors to the sum of fractions). Then,for each of these radionuclides, identify the limiting organism type from which the general orsite-specific BCGs were derived. Limiting organism types corresponding to general BCGs arelisted for each radionuclide in Tables 6.1 - 6.4, and in the corresponding RAD-BCG Calculatorspreadsheets. If the riparian animal or terrestrial animal organism types are listed, then youmay consider the guidance in Sections 7.2.1.2 - 7.2.1.4. If riparian or terrestrial animals are notlisted as the limiting organism types, then you need only consider Section 7.2.1.2 below. If youdid not conduct a general or site-specific screen prior to site-specific analysis, the proceedingstatement applies to the site-specific receptor you have chosen to use in your analysis.
7.2.1.2 Consider Correction Factor for Exposure Area or Receptor Residence Time
A correction factor for exposure area or receptor residence time should be among the firstparameters that you consider in site-specific analysis. Temporal and spatial variability can betaken into account when evaluating doses to biota. For example: (1) radionuclides will typically
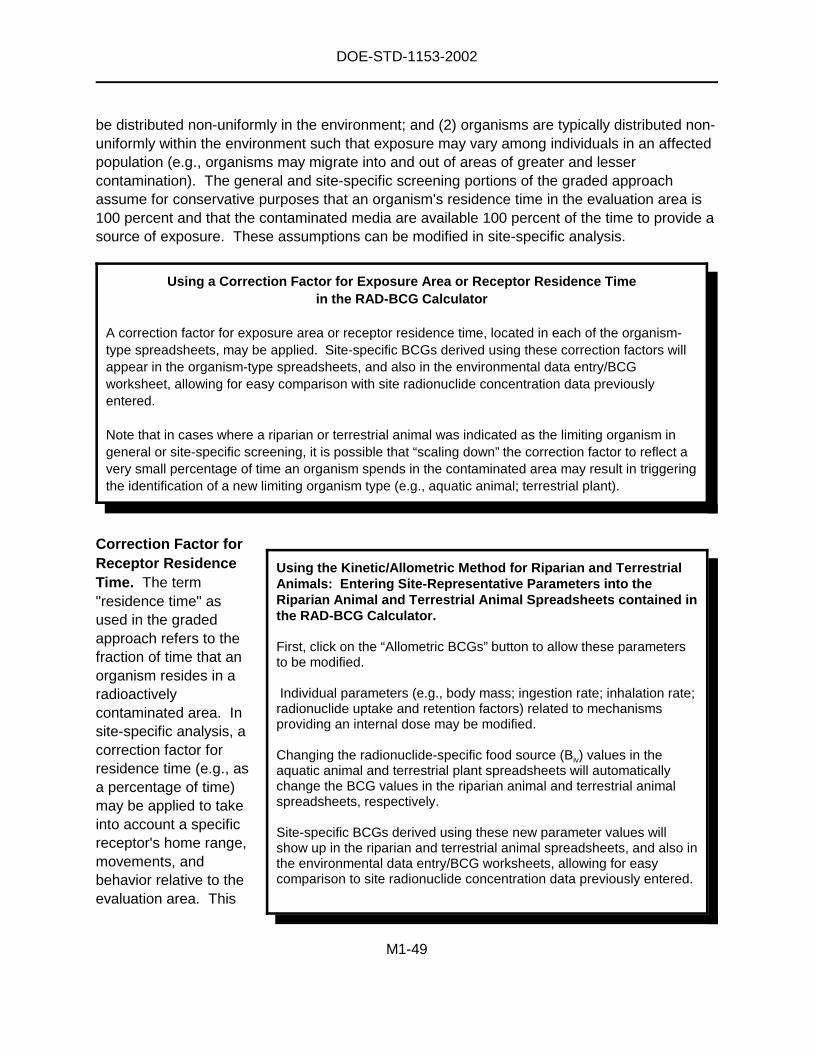
DOE-STD-1153-2002
M1-49
be distributed non-uniformly in the environment; and (2) organisms are typically distributed non-uniformly within the environment such that exposure may vary among individuals in an affectedpopulation (e.g., organisms may migrate into and out of areas of greater and lessercontamination). The general and site-specific screening portions of the graded approachassume for conservative purposes that an organism's residence time in the evaluation area is100 percent and that the contaminated media are available 100 percent of the time to provide asource of exposure. These assumptions can be modified in site-specific analysis.
Correction Factor forReceptor ResidenceTime. The term"residence time" asused in the gradedapproach refers to thefraction of time that anorganism resides in aradioactivelycontaminated area. Insite-specific analysis, acorrection factor forresidence time (e.g., asa percentage of time)may be applied to takeinto account a specificreceptor's home range,movements, andbehavior relative to theevaluation area. This
Using the Kinetic/Allometric Method for Riparian and TerrestrialAnimals: Entering Site-Representative Parameters into theRiparian Animal and Terrestrial Animal Spreadsheets contained inthe RAD-BCG Calculator.
First, click on the “Allometric BCGs” button to allow these parametersto be modified.
Individual parameters (e.g., body mass; ingestion rate; inhalation rate;radionuclide uptake and retention factors) related to mechanismsproviding an internal dose may be modified.
Changing the radionuclide-specific food source (Biv) values in theaquatic animal and terrestrial plant spreadsheets will automaticallychange the BCG values in the riparian animal and terrestrial animalspreadsheets, respectively.
Site-specific BCGs derived using these new parameter values willshow up in the riparian and terrestrial animal spreadsheets, and also inthe environmental data entry/BCG worksheets, allowing for easycomparison to site radionuclide concentration data previously entered.
Using a Correction Factor for Exposure Area or Receptor Residence Timein the RAD-BCG Calculator
A correction factor for exposure area or receptor residence time, located in each of the organism-type spreadsheets, may be applied. Site-specific BCGs derived using these correction factors willappear in the organism-type spreadsheets, and also in the environmental data entry/BCGworksheet, allowing for easy comparison with site radionuclide concentration data previouslyentered.
Note that in cases where a riparian or terrestrial animal was indicated as the limiting organism ingeneral or site-specific screening, it is possible that “scaling down” the correction factor to reflect avery small percentage of time an organism spends in the contaminated area may result in triggeringthe identification of a new limiting organism type (e.g., aquatic animal; terrestrial plant).

DOE-STD-1153-2002
M1-50
correction factor is entered into the appropriate organism type spreadsheet within the RAD-BCG Calculator and used in generating site-specific BCGs.
Correction Factor for Exposure Area. Radionuclides will typically be distributed non-uniformly in the environment. In site-specific analysis, a correction factor for contaminated area(e.g., as a percentage of time) can be applied to take into account an intermittent source ofexposure to all receptors in the evaluation area. This correction factor is entered into theappropriate organism type spreadsheet within the RAD-BCG Calculator and used in generatingsite-specific BCGs.
7.2.1.3 Riparian and Terrestrial Animals: Review and Select Parameters Representativeof Site-specific Conditions and Receptors
In site-specific analysis you can also modify the individual parameters that relate to internalexposure pathways for site-specific conditions and receptors. The RAD-BCG Calculator isdesigned for easy modification of these parameters and subsequent generation of site-specificBCGs that are derived using these new parameter values. Refer back to Table 4.1 for acomplete list of parameters that can be modified when conducting a site-specific analysis.
7.2.1.4 Riparian and Terrestrial Animals: Review and Select Food Source ParameterValues Representative of Site-Specific Receptors
The kinetic/allometric method for deriving riparian and terrestrial animal BCGs uses aradionuclide-specific food source parameter in calculating the internal dose contribution forthese organism types. The method uses radionuclide-specific default Bivs for aquatic animals(listed in Table 7.1) and terrestrial plants (listed in Table 7.3) as the default food sourceparameter values for riparian and terrestrial animals respectively. You may review theappropriateness of these default food source parameter values (i.e., the Bivs and their sourceorganisms) and replace these with food source parameter values (Bivs) corresponding toorganisms which are more representative of the expected food sources for the riparian orterrestrial animal you have selected to use in your site-specific analysis. When using the RAD-BCG Calculator, changing the radionuclide-specific Biv values in the aquatic animal andterrestrial plant spreadsheets will automatically change the BCG values in the riparian animaland terrestrial animal spreadsheets respectively. These new site-specific BCGs will also showup in the environmental system data entry/BCG worksheets, allowing for easy comparisons withpreviously entered radionuclide concentration data.
7.2.2 Step 6: Re-Run the RAD-BCG Calculator and Compare Data on RadionuclideConcentrations in Environmental Media with Newly-Generated Site-Specific BCGs
The use of parameter values and a correction factor appropriate for site-specific conditions orreceptors should result in more realistic, site-representative BCGs. If the sum of fractions (the
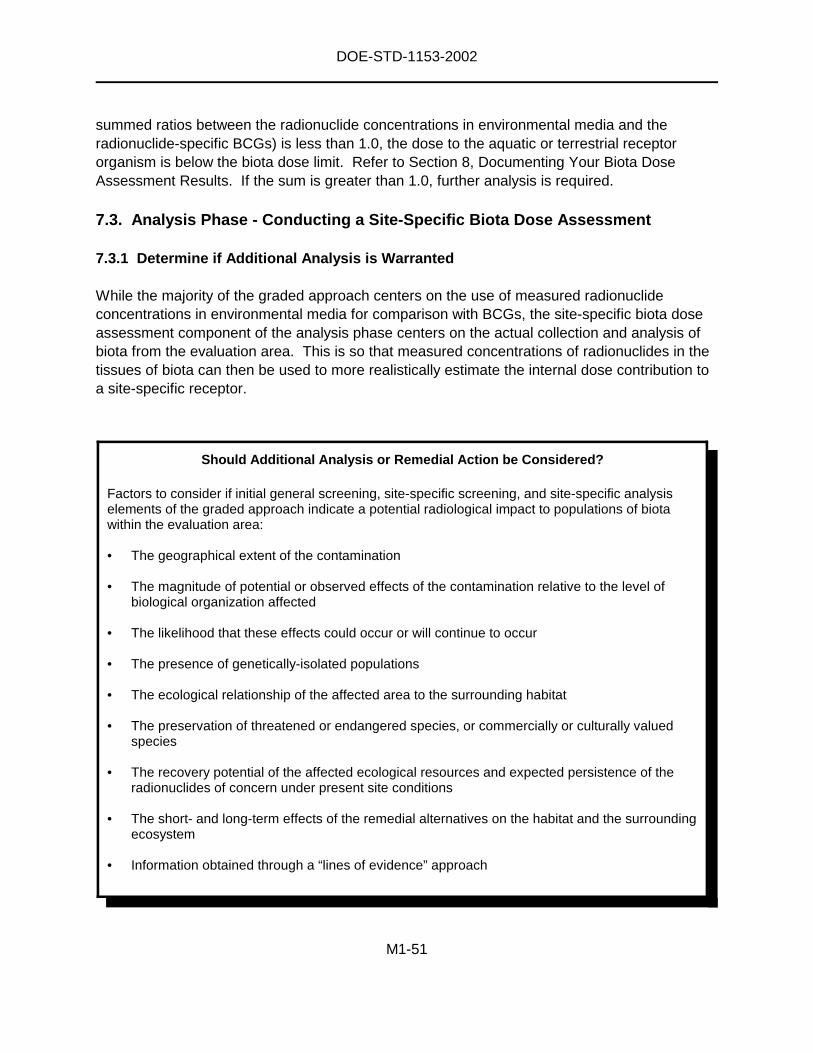
DOE-STD-1153-2002
M1-51
summed ratios between the radionuclide concentrations in environmental media and theradionuclide-specific BCGs) is less than 1.0, the dose to the aquatic or terrestrial receptororganism is below the biota dose limit. Refer to Section 8, Documenting Your Biota DoseAssessment Results. If the sum is greater than 1.0, further analysis is required.
7.3. Analysis Phase - Conducting a Site-Specific Biota Dose Assessment
7.3.1 Determine if Additional Analysis is Warranted
While the majority of the graded approach centers on the use of measured radionuclideconcentrations in environmental media for comparison with BCGs, the site-specific biota doseassessment component of the analysis phase centers on the actual collection and analysis ofbiota from the evaluation area. This is so that measured concentrations of radionuclides in thetissues of biota can then be used to more realistically estimate the internal dose contribution toa site-specific receptor.
Should Additional Analysis or Remedial Action be Considered?
Factors to consider if initial general screening, site-specific screening, and site-specific analysiselements of the graded approach indicate a potential radiological impact to populations of biotawithin the evaluation area:
• The geographical extent of the contamination
• The magnitude of potential or observed effects of the contamination relative to the level ofbiological organization affected
• The likelihood that these effects could occur or will continue to occur
• The presence of genetically-isolated populations
• The ecological relationship of the affected area to the surrounding habitat
• The preservation of threatened or endangered species, or commercially or culturally valuedspecies
• The recovery potential of the affected ecological resources and expected persistence of theradionuclides of concern under present site conditions
• The short- and long-term effects of the remedial alternatives on the habitat and the surroundingecosystem
• Information obtained through a “lines of evidence” approach
DOE-STD-1153-2002
M1-52
Additional analysis may be warranted if biota dose evaluations using the screening and analysismethods described to this point continue to indicate that there is a potential adverse impactfrom radiation as a stressor to populations of biota (i.e., the BCGs are exceeded). An importantpoint is that exceeding the BCGs should not force a mandatory decision regarding remediationof the evaluation area, but rather is an indication that further investigation is likely necessary.There are many factors that should be considered when deciding how to respond following adetermination that the BCGs are exceeded (e.g., ecological relevance and susceptibility of theaffected population; size of the contaminated area and persistence of contaminants; impacts ofremediation alternatives).
If radionuclide concentrations in environmental media exceed the BCGs, two courses of actionmay be taken. On the one hand, it may be desirable to perform detailed dose assessments forrelevant receptors. But given the potentially large expense that such a site-specific assessmentcould incur, removing the sources of ionizing radiation by reducing or eliminating discharges, orremediating existing environmental contamination, should also be considered. Site-specificconditions, especially the cost of eliminating discharges and/or remediating contaminatedareas, will determine which approach is the more desirable.
The discussion below provides basic guidance on how to conduct a site-specific biota doseassessment.
7.3.2 An Important Note Concerning the Use of Available Biota Tissue Data
It is important to note that the use of measured concentrations of radionuclides in tissues ofplants and animals in estimating internal dose is a reasonable and acceptable approach ifadequate data are available. That is, if it can be justified that the available tissue data (1) arerepresentative of species within the evaluation area that are capable of receiving the highestdose, and (2) reflect a representative sampling of the population within the evaluation area.These considerations are especially important in cases where biota tissue data becomesavailable as a result of opportunistic sampling (e.g., road kills; hunting). Detailed guidanceregarding the selection of representative receptor species, and representative population andexposure considerations, is provided in Module 2, Section 6. If available biota tissue data isdetermined to be inadequate, then collection and analysis of biota from the evaluation area willbe required. The internal dose conversion factors for biota, and external dose conversionfactors for water, sediment and soil used to derive the generic BCGs in the graded approachare provided in Table 7.9. These values, together with your measured radionuclideconcentrations in water, sediment and soil, and biota tissue data, can be used to estimate anupper-bound dose to a receptor.
7.3.3 Step 1: Assemble a Biota Dose Assessment Team
The composition of the biota dose assessment team is critical to designing and conducting atechnically sound dose assessment. Together, team members must have a complete set of the

DOE-STD-1153-2002
M1-53
relevant skills necessary to do the work. Necessary skills will vary somewhat by site, but shouldinclude ecology, health physics, radioecology, and specialists in fate and transport ofcontaminants for the environmental media of interest. Depending on the regulatory complianceagreements and monitoring program requirements that exist at the site, it may also be desirableto have a regulatory specialist participate in the assessment. Other site-specific conditions willdictate the need for other related skills within the team or the need for direct stakeholderparticipation at this level.
7.3.4 Step 2: Review Requirements
To perform a detailed dose assessment, it will usually be necessary to design and conduct arelatively comprehensive environmental study of the sources of ionizing radiation and thepotential receptors (e.g., to involve collection and analysis of site-specific organisms within theevaluation area). Such a study should be consistent with the requirements of applicable DOEOrders and guidance, Federal regulations, and State regulations. Particularly important are thefollowing DOE Orders:
C Order 5400.1, General Environmental Protection Program
C Order 5400.5, Radiation Protection of the Public and the Environment
C Order 414.1A, Quality Assurance
These Orders, and the Federal legislation and Executive Orders cited therein, applicable Stateregulations, and applicable DOE site-specific requirements should be consulted during thedesign and conduct of field and laboratory studies to support dose assessments.
7.3.5 Step 3: Review Assumptions
Two assumptions will most likely be implicit in the dose assessment:
C Because it will be impossible to assess dose to all potential receptor populations in thearea of contamination, one (to several) receptor species must serve as surrogates forall potentially exposed populations. Therefore, species selected for dose assessmentshould be among those that are most sensitive to the effects of ionizing radiation,helping to ensure that all populations are protected.
C The population of the receptor species for which doses are assessed is defined asthose individuals living within the contaminated area. This assumption is consistentwith the EPA definition of “population.” This assumption is conservative to the extentthat individuals move in and out of the contaminated area.
DOE-STD-1153-2002
M1-54
Any deviations from the above assumptions when designing or conducting the doseassessment should be documented.
7.3.6 Recommended Approaches to Designing and Conducting the Dose Assessment
It is strongly recommended that all dose assessments be designed and conducted following theGuidelines for Ecological Risk Assessment (EPA 1998). Use of these guidelines will helpensure that the resulting dose assessments are technically sound. In addition, some of thesteps in the ecological risk process (e.g., development of a site conceptual model) will be usefulfor assessing toxicological risks associated with some radionuclides (e.g., uranium isotopes) aswell as the ecological risks from other co-occurring substances or stressors within thecontaminated area (e.g., hazardous chemicals). The site conceptual model will also be usefulfor understanding the large-scale distribution of contaminants and the sources of ecological riskto the populations within and beyond the study area. Guidelines for Ecological RiskAssessment can be downloaded from the DOE EH-41 Dose and Risk Assessment web site(http://www.eh.doe.gov/oepa/risk). An electronic tool for developing a site conceptual model isalso available at this web site. If multiple stressors are present and need to be evaluated, thenappropriate guidance concerning cumulative risk assessment should be considered (e.g., seeEPA 1997b).
In addition to the references found in EPA’s Guidelines for Ecological Risk Assessment, thefollowing references and materials should be useful, many of which are also available on theEH-41 Dose and Risk Assessment web site: (http:/www.eh.doe.gov/oepa/risk).
C G.R. Bilyard, H. Beckert, J.J. Bascietto, C.W. Abrams, S.A. Dyer, and L.A. Haselow.1997. Using the Data Quality Objectives Process During the Design and Conduct ofEcological Risk Assessments. DOE/EH-0544, prepared for U.S. Department ofEnergy, Office of Environmental Policy and Assistance by Pacific Northwest NationalLaboratory, Richland, Washington.
C B.E. Sample, M.S. Aplin, R.A. Efroymson, G.W. Suter II, and C.J.E. Welsh. 1997.Methods and Tools for Estimation of the Exposure of Terrestrial Wildlife toContaminants. ORNL/TM-13391, prepared for U.S. Department of Energy, Office ofEnvironmental Policy and Assistance by Oak Ridge National Laboratory, Oak Ridge,Tennessee.
C U.S. Department of Energy. 1991. Environmental Regulatory Guide for RadiologicalEffluent Monitoring and Environmental Surveillance. DOE/EH-0173T, AssistantSecretary for Environment, Safety and Health, U.S. Department of Energy,Washington, D.C.
DOE-STD-1153-2002
M1-55
Assessment Endpoint
An explicit expression of the environmentalvalue that is to be protected, operationallydefined by an ecological entity and itsattributes. For example, salmon are valuedecological entities; reproduction and age classstructure are some of their important attributes.Together “salmon reproduction and age classstructure” form an assessment endpoint.
C U.S. Department of Energy. 1998. Compendium of EPA-Approved AnalyticalMethods for Measuring Radionuclides in Drinking Water. Office of EnvironmentalPolicy and Assistance, Assistant Secretary for Environment, Safety and Health, U.S.Department of Energy, Washington, D.C.
C U.S. Environmental Protection Agency (EPA). 1997. Ecological Risk AssessmentGuidance for Superfund: Process for Designing and Conducting Ecological RiskAssessments. EPA 540-R-97-006 (Interim Final June 5, 1997), U.S. EPA,Washington, D.C.
7.3.7 Designing and Conducting the Dose Assessment
The Guidelines for Ecological Risk Assessment (EPA 1998) provide a flexible framework forassessing ecological risks. The framework consists of three major phases of activity: problemformulation, analysis, and risk characterization. Activities within each of these phases can besummarized as follows:
In problem formulation, risk assessors evaluate goals and select assessment endpoints,prepare the conceptual model, and develop an analysis plan. During the analysis phase,assessors evaluate exposure to stressors and the relationship between stressor levels andecological effects. In the third phase, risk characterization, assessors estimate risk (or dose)through integration of exposure and stressor-response profiles, describe risk by discussinglines of evidence and determining ecological adversity, and prepare a report. A more detailed“primer” on how to evaluate doses to biota through the ecological risk assessment process isprovided in Module 2, Section 1.
The dose assessment team hasconsiderable latitude over how activitiesshould be conducted within each phase ofthe assessment. The dose limitsrecommended in Module 1, Section 1.1 donot compromise this flexibility, but provide amajor advantage for the dose assessmentteam because they define doses below whichrisks to populations are assumed not tooccur. This definition simplifies those stepsin the ecological risk assessment processthat involve assessing the relationshipbetween stressor levels and ecological effects, characterizing, estimating, and assessing risks.Caution should be exercised if more restrictive limits are selected, to ensure that the supportingeffects data are of high quality, reproducible, and clearly relevant to protection of naturalpopulations. In cases where evaluating dose to individual organisms is needed, you shouldconsider the guidance provided in Module 2, Section 8. The following brief overview of the
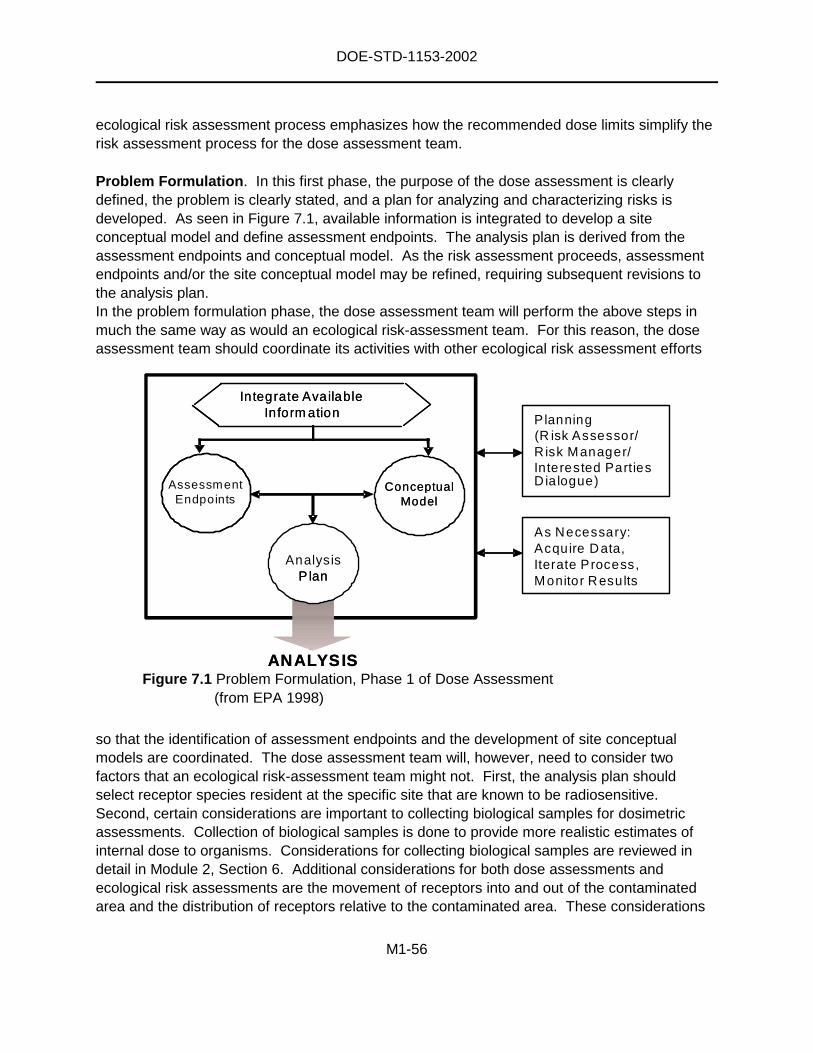
DOE-STD-1153-2002
M1-56
ANALYSIS
In tegrate AvailableInform ation
Integrate AvailableInform ation
As Necessary:Acquire Data,Iterate Process,Monitor Results
ConceptualModel
AssessmentEndpoints
ANALYSIS
(R isk Assessor/R isk Manager/Interested PartiesD ia logue)
P lanning
ConceptualModel
AnalysisP lanP lan
Figure 7.1 Problem Formulation, Phase 1 of Dose Assessment(from EPA 1998)
ecological risk assessment process emphasizes how the recommended dose limits simplify therisk assessment process for the dose assessment team.
Problem Formulation. In this first phase, the purpose of the dose assessment is clearlydefined, the problem is clearly stated, and a plan for analyzing and characterizing risks isdeveloped. As seen in Figure 7.1, available information is integrated to develop a siteconceptual model and define assessment endpoints. The analysis plan is derived from theassessment endpoints and conceptual model. As the risk assessment proceeds, assessmentendpoints and/or the site conceptual model may be refined, requiring subsequent revisions tothe analysis plan.In the problem formulation phase, the dose assessment team will perform the above steps inmuch the same way as would an ecological risk-assessment team. For this reason, the doseassessment team should coordinate its activities with other ecological risk assessment efforts
so that the identification of assessment endpoints and the development of site conceptualmodels are coordinated. The dose assessment team will, however, need to consider twofactors that an ecological risk-assessment team might not. First, the analysis plan shouldselect receptor species resident at the specific site that are known to be radiosensitive.Second, certain considerations are important to collecting biological samples for dosimetricassessments. Collection of biological samples is done to provide more realistic estimates ofinternal dose to organisms. Considerations for collecting biological samples are reviewed indetail in Module 2, Section 6. Additional considerations for both dose assessments andecological risk assessments are the movement of receptors into and out of the contaminatedarea and the distribution of receptors relative to the contaminated area. These considerations
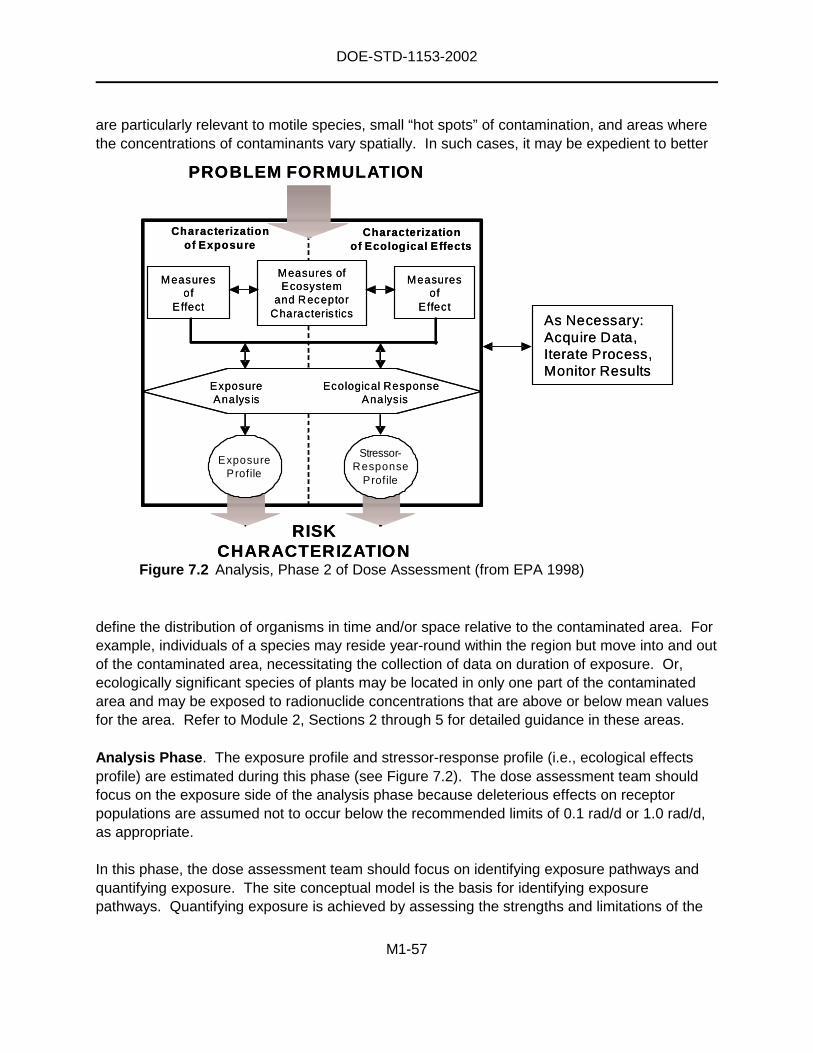
DOE-STD-1153-2002
M1-57
RISKCHARACTERIZATION
PROBLEM FORMULATION
Characterizationof Exposure
Characterizationof Ecological Effects
As Necessary:Acquire Data,Iterate Process,Monitor Results
Measuresof
Effect
Measuresof
Effect
Measures ofEcosystem
and ReceptorCharacteris tics
Exposure Ecological ResponseAnalys is Analysis
RISKCHARACTERIZATION
PROBLEM FORMULATION
Characterizationof Exposure
Characterizationof Ecological Effects
As Necessary:Acquire Data,Iterate Process,Monitor Results
Measuresof
Effect
Measuresof
Effect
Measures ofEcosystem
and ReceptorCharacteris tics
Exposure Ecological ResponseAnalys is Analysis
ExposureProfileExposureProfile
Stressor-Response
Profile
ExposureProfileExposureProfile
Stressor-Response
Profile
Figure 7.2 Analysis, Phase 2 of Dose Assessment (from EPA 1998)
are particularly relevant to motile species, small “hot spots” of contamination, and areas wherethe concentrations of contaminants vary spatially. In such cases, it may be expedient to better
define the distribution of organisms in time and/or space relative to the contaminated area. Forexample, individuals of a species may reside year-round within the region but move into and outof the contaminated area, necessitating the collection of data on duration of exposure. Or,ecologically significant species of plants may be located in only one part of the contaminatedarea and may be exposed to radionuclide concentrations that are above or below mean valuesfor the area. Refer to Module 2, Sections 2 through 5 for detailed guidance in these areas.
Analysis Phase. The exposure profile and stressor-response profile (i.e., ecological effectsprofile) are estimated during this phase (see Figure 7.2). The dose assessment team shouldfocus on the exposure side of the analysis phase because deleterious effects on receptorpopulations are assumed not to occur below the recommended limits of 0.1 rad/d or 1.0 rad/d,as appropriate.
In this phase, the dose assessment team should focus on identifying exposure pathways andquantifying exposure. The site conceptual model is the basis for identifying exposurepathways. Quantifying exposure is achieved by assessing the strengths and limitations of the
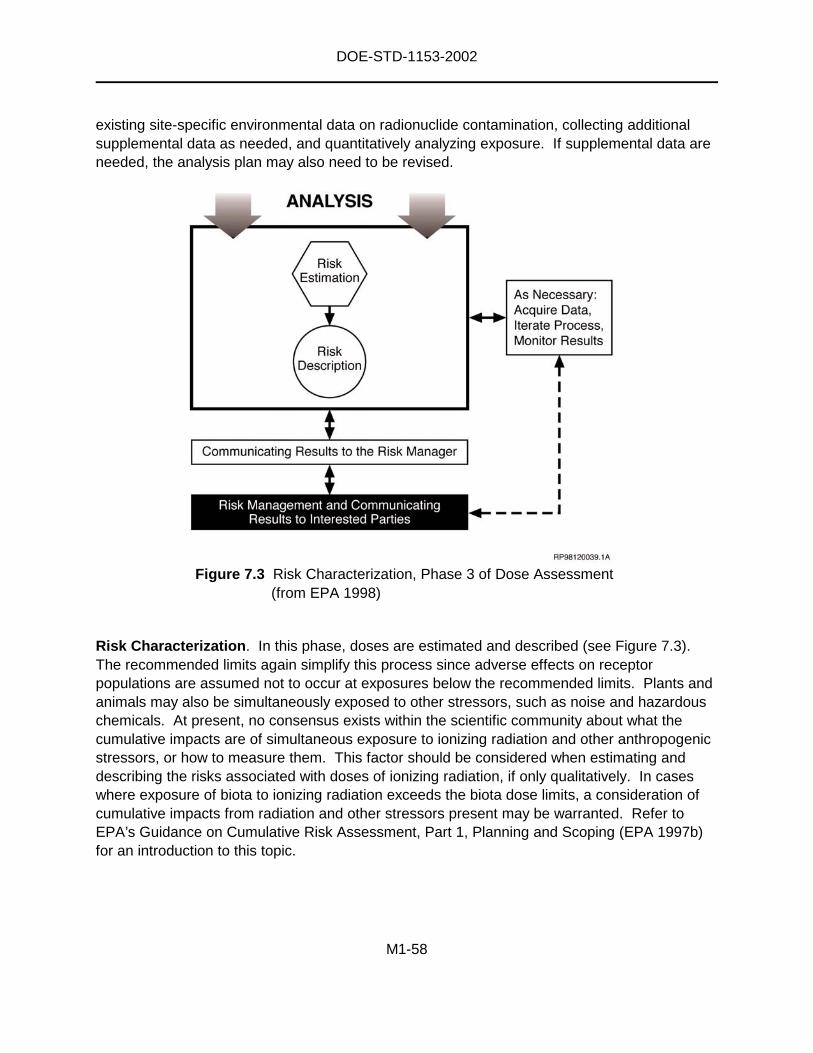
DOE-STD-1153-2002
M1-58
Figure 7.3 Risk Characterization, Phase 3 of Dose Assessment(from EPA 1998)
existing site-specific environmental data on radionuclide contamination, collecting additionalsupplemental data as needed, and quantitatively analyzing exposure. If supplemental data areneeded, the analysis plan may also need to be revised.
Risk Characterization. In this phase, doses are estimated and described (see Figure 7.3).The recommended limits again simplify this process since adverse effects on receptorpopulations are assumed not to occur at exposures below the recommended limits. Plants andanimals may also be simultaneously exposed to other stressors, such as noise and hazardouschemicals. At present, no consensus exists within the scientific community about what thecumulative impacts are of simultaneous exposure to ionizing radiation and other anthropogenicstressors, or how to measure them. This factor should be considered when estimating anddescribing the risks associated with doses of ionizing radiation, if only qualitatively. In caseswhere exposure of biota to ionizing radiation exceeds the biota dose limits, a consideration ofcumulative impacts from radiation and other stressors present may be warranted. Refer toEPA’s Guidance on Cumulative Risk Assessment, Part 1, Planning and Scoping (EPA 1997b)for an introduction to this topic.
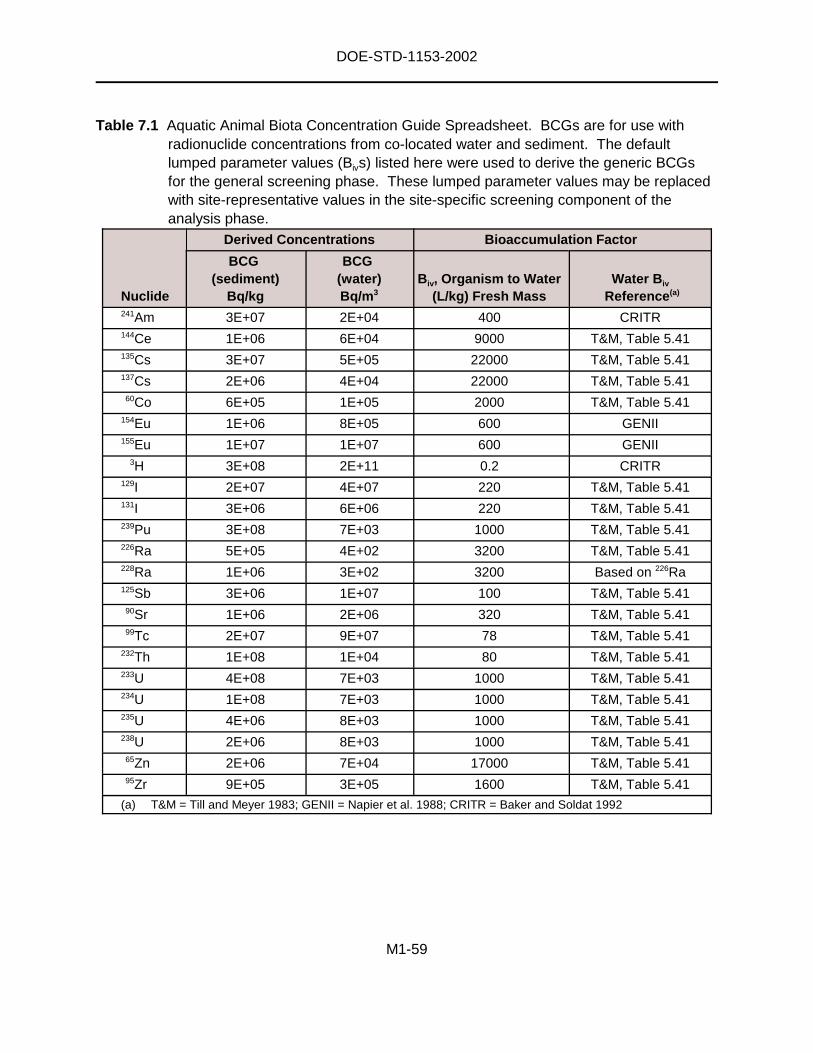
DOE-STD-1153-2002
M1-59
Table 7.1 Aquatic Animal Biota Concentration Guide Spreadsheet. BCGs are for use withradionuclide concentrations from co-located water and sediment. The defaultlumped parameter values (Bivs) listed here were used to derive the generic BCGsfor the general screening phase. These lumped parameter values may be replacedwith site-representative values in the site-specific screening component of theanalysis phase.
Nuclide
Derived Concentrations Bioaccumulation Factor
BCG(sediment)
Bq/kg
BCG(water)Bq/m3
Biv, Organism to Water(L/kg) Fresh Mass
Water Biv
Reference(a)
241Am 3E+07 2E+04 400 CRITR144Ce 1E+06 6E+04 9000 T&M, Table 5.41135Cs 3E+07 5E+05 22000 T&M, Table 5.41137Cs 2E+06 4E+04 22000 T&M, Table 5.41
60Co 6E+05 1E+05 2000 T&M, Table 5.41154Eu 1E+06 8E+05 600 GENII155Eu 1E+07 1E+07 600 GENII
3H 3E+08 2E+11 0.2 CRITR129I 2E+07 4E+07 220 T&M, Table 5.41131I 3E+06 6E+06 220 T&M, Table 5.41239Pu 3E+08 7E+03 1000 T&M, Table 5.41226Ra 5E+05 4E+02 3200 T&M, Table 5.41228Ra 1E+06 3E+02 3200 Based on 226Ra125Sb 3E+06 1E+07 100 T&M, Table 5.41
90Sr 1E+06 2E+06 320 T&M, Table 5.4199Tc 2E+07 9E+07 78 T&M, Table 5.41
232Th 1E+08 1E+04 80 T&M, Table 5.41233U 4E+08 7E+03 1000 T&M, Table 5.41234U 1E+08 7E+03 1000 T&M, Table 5.41235U 4E+06 8E+03 1000 T&M, Table 5.41238U 2E+06 8E+03 1000 T&M, Table 5.41
65Zn 2E+06 7E+04 17000 T&M, Table 5.4195Zr 9E+05 3E+05 1600 T&M, Table 5.41
(a) T&M = Till and Meyer 1983; GENII = Napier et al. 1988; CRITR = Baker and Soldat 1992
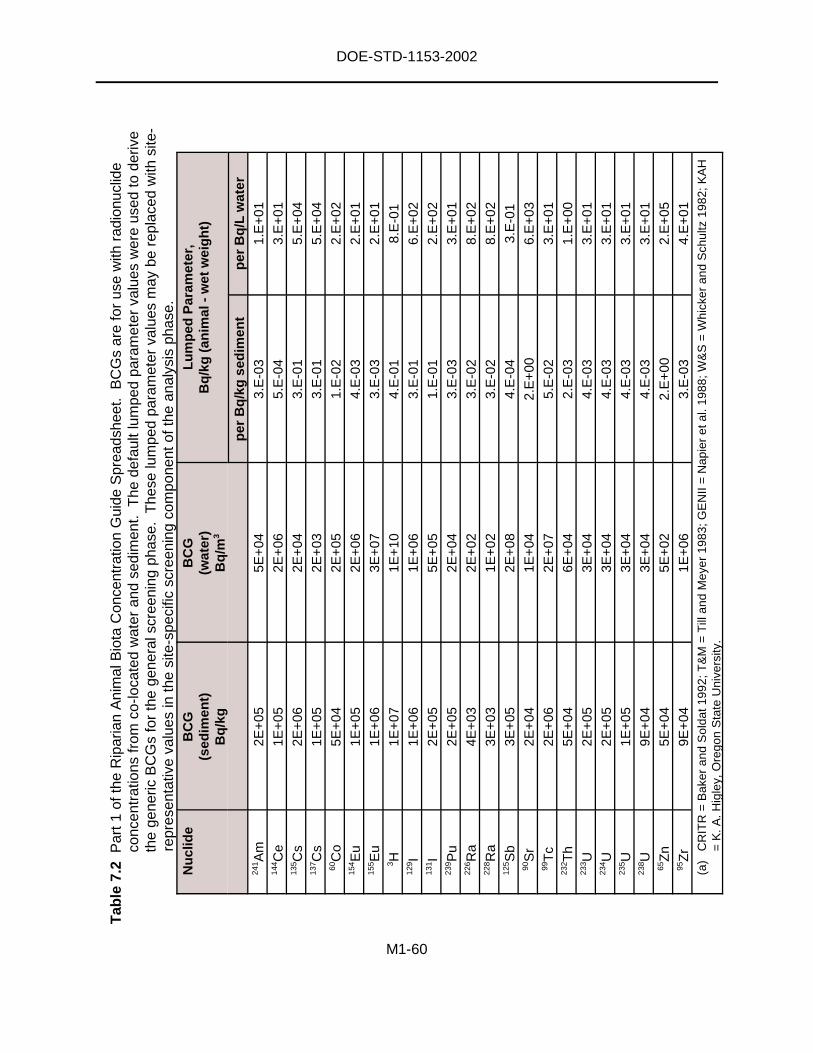
DOE-STD-1153-2002
M1-60
Tab
le7.
2P
art1
ofth
eR
ipar
ian
Ani
mal
Bio
taC
once
ntra
tion
Gui
deS
prea
dshe
et.
BC
Gs
are
for
use
with
radi
onuc
lide
conc
entr
atio
nsfr
omco
-loca
ted
wat
eran
dse
dim
ent.
The
defa
ultl
umpe
dpa
ram
eter
valu
esw
ere
used
tode
rive
the
gene
ricB
CG
sfo
rth
ege
nera
lscr
eeni
ngph
ase.
The
selu
mpe
dpa
ram
eter
valu
esm
aybe
repl
aced
with
site
-re
pres
enta
tive
valu
esin
the
site
-spe
cific
scre
enin
gco
mpo
nent
ofth
ean
alys
isph
ase.
Nu
clid
eB
CG
(sed
imen
t)B
q/k
g
BC
G(w
ater
)B
q/m
3
Lu
mp
edP
aram
eter
,B
q/k
g(a
nim
al-
wet
wei
gh
t)
per
Bq
/kg
sed
imen
tp
erB
q/L
wat
er24
1 Am
2E+
055E
+04
3.E
-03
1.E
+01
144 C
e1E
+05
2E+
065.
E-0
43.
E+
0113
5 Cs
2E+
062E
+04
3.E
-01
5.E
+04
137 C
s1E
+05
2E+
033.
E-0
15.
E+
0460
Co
5E+
042E
+05
1.E
-02
2.E
+02
154 E
u1E
+05
2E+
064.
E-0
32.
E+
0115
5 Eu
1E+
063E
+07
3.E
-03
2.E
+01
3 H1E
+07
1E+
104.
E-0
18.
E-0
112
9 I1E
+06
1E+
063.
E-0
16.
E+
0213
1 I2E
+05
5E+
051.
E-0
12.
E+
0223
9 Pu
2E+
052E
+04
3.E
-03
3.E
+01
226 R
a4E
+03
2E+
023.
E-0
28.
E+
0222
8 Ra
3E+
031E
+02
3.E
-02
8.E
+02
125 S
b3E
+05
2E+
084.
E-0
43.
E-0
190
Sr
2E+
041E
+04
2.E
+00
6.E
+03
99T
c2E
+06
2E+
075.
E-0
23.
E+
0123
2 Th
5E+
046E
+04
2.E
-03
1.E
+00
233 U
2E+
053E
+04
4.E
-03
3.E
+01
234 U
2E+
053E
+04
4.E
-03
3.E
+01
235 U
1E+
053E
+04
4.E
-03
3.E
+01
238 U
9E+
043E
+04
4.E
-03
3.E
+01
65Z
n5E
+04
5E+
022.
E+
002.
E+
0595
Zr
9E+
041E
+06
3.E
-03
4.E
+01
(a)
CR
ITR
=B
aker
and
Sol
dat1
992;
T&
M=
Till
and
Mey
er19
83;G
EN
II=
Nap
ier
etal
.198
8;W
&S
=W
hick
eran
dS
chul
tz19
82;K
AH
=K
.A.H
igle
y,O
rego
nS
tate
Uni
vers
ity.

DOE-STD-1153-2002
M1-61
Tab
le7.
3T
erre
stria
lPla
ntB
iota
Con
cent
ratio
nG
uide
Spr
eads
heet
.T
hede
faul
tlum
ped
para
met
erva
lues
(Bivs)
liste
dhe
rew
ere
used
tode
rive
the
gene
ricB
CG
sfo
rth
ege
nera
lscr
eeni
ngph
ase.
The
selu
mpe
dpa
ram
eter
valu
esm
aybe
repl
aced
with
site
-rep
rese
ntat
ive
valu
esin
the
site
-spe
cific
scre
enin
gco
mpo
nent
ofth
ean
alys
isph
ase.
Nu
clid
eB
CG
(so
il)B
q/k
gB
CG
(wat
er)
Bq
/m3
Bio
accu
mu
lati
on
Fac
tor,
Biv
Bq
/kg
(pla
nt
-w
etw
eig
ht)
per
Bq
/kg
(so
il)R
efer
ence
(a)
241 A
m8E
+05
3E+
108E
-03
T&
M,T
able
5.16
,Tab
le5.
1814
4 Ce
5E+
051E
+09
4E-0
2T
&M
,Tab
le5.
16,T
able
5.17
135 C
s1E
+06
3E+
101E
+01
T&
M,T
able
5.16
,Tab
le5.
1713
7 Cs
8E+
042E
+09
1E+
01T
&M
,Tab
le5.
16,T
able
5.17
60C
o2E
+05
6E+
082E
-01
T&
M,T
able
5.16
,Tab
le5.
1715
4 Eu
5E+
051E
+09
4E-0
2E
stim
ated
from
Ce
valu
eby
KA
H15
5 Eu
6E+
061E
+10
4E-0
2E
stim
ated
from
Ce
valu
eby
KA
H3 H
6E+
073E
+11
1E+
00E
stim
ated
from
NU
RE
G1.
109
129 I
6E+
062E
+10
4E-0
1T
&M
,Tab
le5.
16,T
able
5.17
131 I
9E+
053E
+09
4E-0
1T
&M
,Tab
le5.
16,T
able
5.17
for
129 I
239 P
u5E
+05
3E+
111E
-02
T&
M,T
able
5.16
,Tab
le5.
1822
6 Ra
1E+
045E
+08
1E-0
1T
&M
,Tab
le5.
16,T
able
5.18
228 R
a9E
+03
1E+
091E
-01
T&
M,T
able
5.16
,Tab
le5.
18fr
om22
6 Ra
125 S
b1E
+06
3E+
091E
-02
Fro
mG
EN
II,F
ood
Tra
nsfe
rLi
brar
y90
Sr
1E+
051E
+09
4E+
00T
&M
,Tab
le5.
16,T
able
5.17
99T
c8E
+05
2E+
108E
+00
Fro
mG
EN
II,F
ood
Tra
nsfe
rLi
brar
y23
2 Th
9E+
051E
+11
1E-0
3T
&M
,Tab
le5.
16,T
able
5.18
233 U
2E+
064E
+11
4E-0
3T
&M
,Tab
le5.
16,T
able
5.18
from
238 U
234 U
2E+
061E
+11
4E-0
3T
&M
,Tab
le5.
16,T
able
5.18
from
238 U
235 U
1E+
064E
+09
4E-0
3T
&M
,Tab
le5.
16,T
able
5.18
from
238 U
238 U
6E+
052E
+09
4E-0
3T
&M
,Tab
le5.
16,T
able
5.18
65Z
n9E
+05
2E+
093E
-01
T&
M,T
able
5.16
,Tab
le5.
1795
Zr
4E+
059E
+08
3E-0
2T
&M
,Tab
le5.
16,T
able
5.17
(a)
T&
M=
Till
and
Mey
er19
83;G
EN
II=
Nap
ier
etal
.198
8;K
AH
=K
.A.H
igle
y,O
rego
nS
tate
Uni
vers
ity.
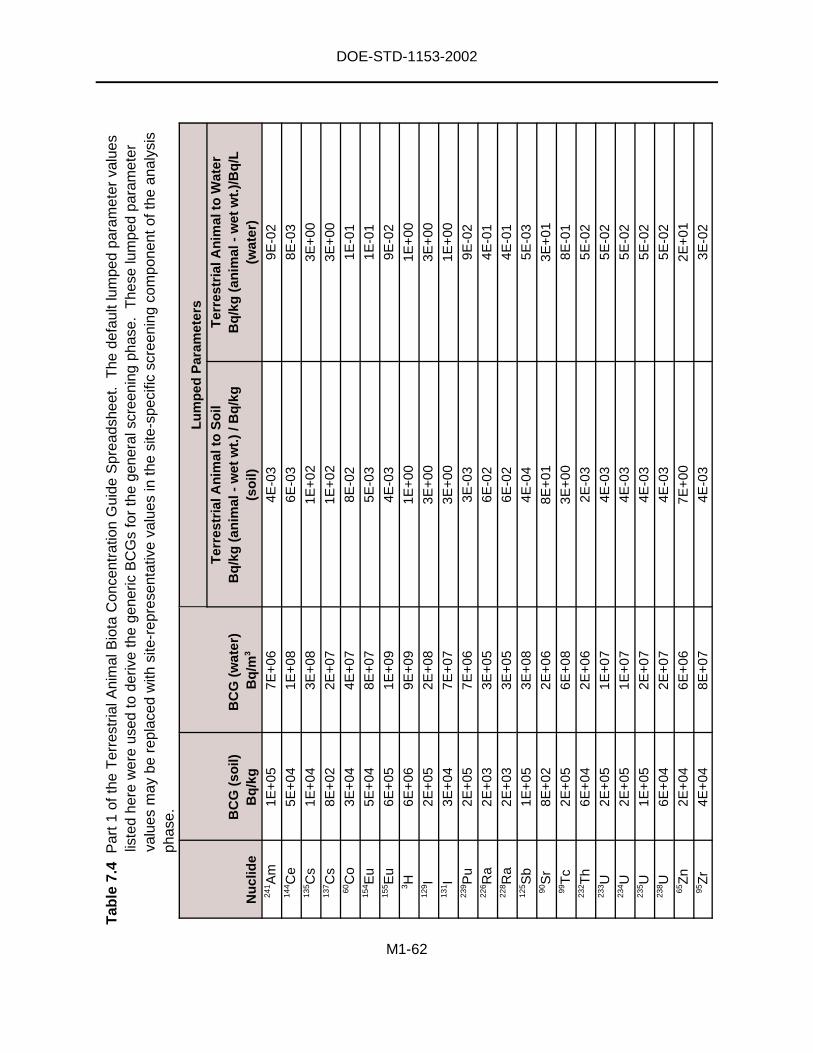
DOE-STD-1153-2002
M1-62
Tab
le7.
4P
art1
ofth
eT
erre
stria
lAni
mal
Bio
taC
once
ntra
tion
Gui
deS
prea
dshe
et.
The
defa
ultl
umpe
dpa
ram
eter
valu
eslis
ted
here
wer
eus
edto
deriv
eth
ege
neric
BC
Gs
for
the
gene
rals
cree
ning
phas
e.T
hese
lum
ped
para
met
erva
lues
may
bere
plac
edw
ithsi
te-r
epre
sent
ativ
eva
lues
inth
esi
te-s
peci
ficsc
reen
ing
com
pone
ntof
the
anal
ysis
phas
e.
Nu
clid
eB
CG
(so
il)B
q/k
gB
CG
(wat
er)
Bq
/m3
Lu
mp
edP
aram
eter
sT
erre
stri
alA
nim
alto
So
ilB
q/k
g(a
nim
al-
wet
wt.
)/B
q/k
g(s
oil)
Ter
rest
rial
An
imal
toW
ater
Bq
/kg
(an
imal
-w
etw
t.)/
Bq
/L(w
ater
)24
1 Am
1E+
057E
+06
4E-0
39E
-02
144 C
e5E
+04
1E+
086E
-03
8E-0
313
5 Cs
1E+
043E
+08
1E+
023E
+00
137 C
s8E
+02
2E+
071E
+02
3E+
0060
Co
3E+
044E
+07
8E-0
21E
-01
154 E
u5E
+04
8E+
075E
-03
1E-0
115
5 Eu
6E+
051E
+09
4E-0
39E
-02
3 H6E
+06
9E+
091E
+00
1E+
0012
9 I2E
+05
2E+
083E
+00
3E+
0013
1 I3E
+04
7E+
073E
+00
1E+
0023
9 Pu
2E+
057E
+06
3E-0
39E
-02
226 R
a2E
+03
3E+
056E
-02
4E-0
122
8 Ra
2E+
033E
+05
6E-0
24E
-01
125 S
b1E
+05
3E+
084E
-04
5E-0
390
Sr
8E+
022E
+06
8E+
013E
+01
99T
c2E
+05
6E+
083E
+00
8E-0
123
2 Th
6E+
042E
+06
2E-0
35E
-02
233 U
2E+
051E
+07
4E-0
35E
-02
234 U
2E+
051E
+07
4E-0
35E
-02
235 U
1E+
052E
+07
4E-0
35E
-02
238 U
6E+
042E
+07
4E-0
35E
-02
65Z
n2E
+04
6E+
067E
+00
2E+
0195
Zr
4E+
048E
+07
4E-0
33E
-02

DOE-STD-1153-2002
M1-63
Tab
le7.
5P
art2
ofth
eR
ipar
ian
Ani
mal
Bio
taC
once
ntra
tion
Gui
deS
prea
dshe
et.
The
defa
ultp
aram
eter
valu
eslis
ted
here
rela
ting
toth
eup
take
,ret
entio
nan
dbi
olog
ical
deca
yra
tes
ofra
dion
uclid
esfo
ra
ripar
ian
anim
alre
cept
orm
aybe
repl
aced
with
site
-rep
rese
ntat
ive
valu
esin
the
site
-spe
cific
anal
ysis
com
pone
ntof
the
anal
ysis
phas
e.
Nu
clid
e
Fra
ctio
no
fIn
take
Ret
ain
edf 1
(un
itle
ss)
Bio
log
ical
Dec
ayC
on
stan
tλ b
io(d
-1)
λbio
=In
(2)/
(aW
b)
λ bio
(d-1)
Ref
eren
ce(a
)
a(c
on
stan
t)b
(co
nst
ant)
241 A
m1E
-03
5.53
E-0
40.
80.
81IC
RP
30,P
art4
144 C
e3E
-04
3.46
E-0
41.
40.
8IC
RP
30,P
art1
135 C
s1E
+00
2.24
E-0
23.
50.
24W
&S
137 C
s1E
+00
2.24
E-0
23.
50.
24W
&S
60C
o5E
-02
3.01
E-0
22.
60.
24W
&S
154 E
u1E
-03
3.46
E-0
41.
40.
8IC
RP
30,P
art3
155 E
u1E
-03
3.46
E-0
41.
40.
8IC
RP
30,P
art3
3 H1E
+00
5.72
E-0
30.
820.
55W
&S
129 I
1E+
003.
13E
-02
6.8
0.13
W&
S13
1 I1E
+00
3.13
E-0
26.
80.
13W
&S
239 P
u1E
-03
5.53
E-0
40.
80.
81IC
RP
30,P
art4
226 R
a2E
-01
3.58
E-0
22
0.25
Est
imat
edby
KA
H22
8 Ra
2E-0
13.
58E
-02
20.
25E
stim
ated
byK
AH
125 S
b1E
-02
1.43
E-0
10.
50.
25IC
RP
30,P
art3
90S
r3E
-01
6.11
E-0
410
70.
26W
&S
99T
c8E
-01
6.11
E-0
20.
30.
4IC
RP
30,P
art2
232 T
h2E
-04
1.34
E-0
43.
30.
81IC
RP
30,P
art1
233 U
5E-0
26.
81E
-02
0.8
0.28
ICR
P30
,Par
t123
4 U5E
-02
6.81
E-0
20.
80.
28IC
RP
30,P
art1
235 U
5E-0
26.
81E
-02
0.8
0.28
ICR
P30
,Par
t123
8 U5E
-02
6.81
E-0
20.
80.
28IC
RP
30,P
art1
65Z
n5E
-01
7.16
E-0
410
00.
25IC
RP
30,P
art2
95Z
r2E
-03
7.16
E-0
410
00.
25IC
RP
30,P
art1
(a)
CR
ITR
=B
aker
and
Sol
dat1
992;
T&
M=
Till
and
Mey
er19
83;G
EN
II=
Nap
ier
etal
.198
8;W
&S
=W
hick
eran
dS
chul
tz19
82;
KA
H=
K.A
.Hig
ley,
Ore
gon
Sta
teU
nive
rsity
.
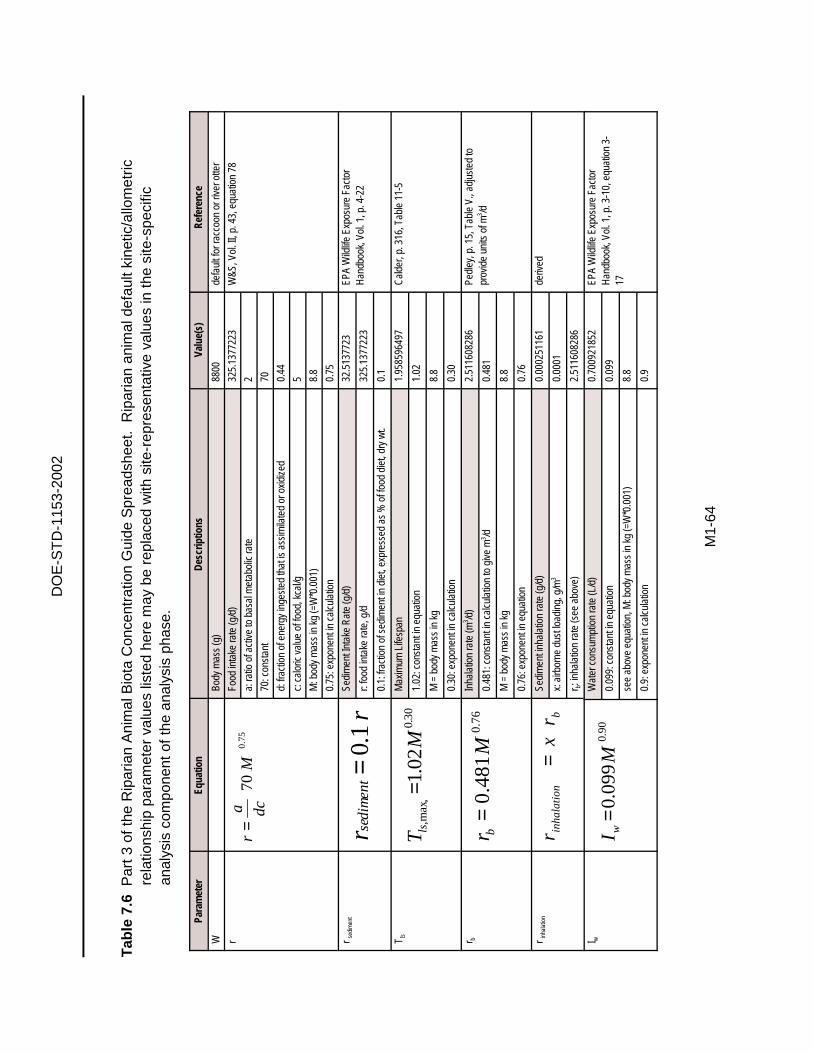
DO
E-S
TD
-115
3-20
02
M1-
64
rr
ent
dim
se1.0
=
75.070
Mdca
r=
bin
hala
tion
rx
r=
30.0,
max
,02.1
MT ls
=
76.048
1.0
Mr b
=
90.009
9.0
MI w
=
Tab
le7.
6P
art3
ofth
eR
ipar
ian
Ani
mal
Bio
taC
once
ntra
tion
Gui
deS
prea
dshe
et.
Rip
aria
nan
imal
defa
ultk
inet
ic/a
llom
etric
rela
tions
hip
para
met
erva
lues
liste
dhe
rem
aybe
repl
aced
with
site
-rep
rese
ntat
ive
valu
esin
the
site
-spe
cific
anal
ysis
com
pone
ntof
the
anal
ysis
phas
e.
Para
met
erEq
uatio
nD
escr
iptio
nsVa
lue(
s)R
efer
ence
WBo
dym
ass
(g)
8800
defa
ultf
orra
ccoo
nor
river
otte
r
rFo
odin
take
rate
(g/d
)32
5.13
7722
3W
&S,V
ol.I
I,p.
43,e
quat
ion
78
a:ra
tioof
activ
eto
basa
lmet
abol
icra
te2
70:c
onst
ant
70
d:fra
ctio
nof
ener
gyin
gest
edth
atis
assi
mila
ted
orox
idiz
ed0.
44
c:ca
loric
valu
eof
food
,kca
l/g5
M:b
ody
mas
sin
kg(=
W*0
.001
)8.
8
0.75
:exp
onen
tin
calc
ulat
ion
0.75
r sed
imen
tSe
dim
entI
ntak
eR
ate
(g/d
)32
.513
7723
EPA
Wild
life
Expo
sure
Fact
orH
andb
ook,
Vol.
1,p.
4-22
r:fo
odin
take
rate
,g/d
325.
1377
223
0.1:
fract
ion
ofse
dim
enti
ndi
et,e
xpre
ssed
as%
offo
oddi
et,d
ryw
t.0.
1
T Is
Max
imum
Life
span
1.95
8596
497
Cal
der,
p.31
6,Ta
ble
11-5
1.02
:con
stan
tin
equa
tion
1.02
M=
body
mas
sin
kg8.
8
0.30
:exp
onen
tin
calc
ulat
ion
0.30
r bIn
hala
tion
rate
(m3 /d
)2.
5116
0828
6Pe
dley
,p.1
5,Ta
ble
V.,a
djus
ted
topr
ovid
eun
itsof
m3 /d
0.48
1:co
nsta
ntin
calc
ulat
ion
togi
vem
3 /d0.
481
M=
body
mas
sin
kg8.
8
0.76
:exp
onen
tin
equa
tion
0.76
r inh
alat
ion
Sedi
men
tinh
alat
ion
rate
(g/d
)0.
0002
5116
1de
rived
x:ai
rbor
nedu
stlo
adin
g,g/
m3
0.00
01
r b:in
hala
tion
rate
(see
abov
e)2.
5116
0828
6
I wW
ater
cons
umpt
ion
rate
(L/d
)0.
7009
2185
2EP
AW
ildlif
eEx
posu
reFa
ctor
Han
dboo
k,Vo
l.1,
p.3-
10,e
quat
ion
3-17
0.09
9:co
nsta
ntin
equa
tion
0.09
9
see
abov
eeq
uatio
n,M
:bod
ym
ass
inkg
(=W
*0.0
01)
8.8
0.9:
expo
nent
inca
lcul
atio
n0.
9
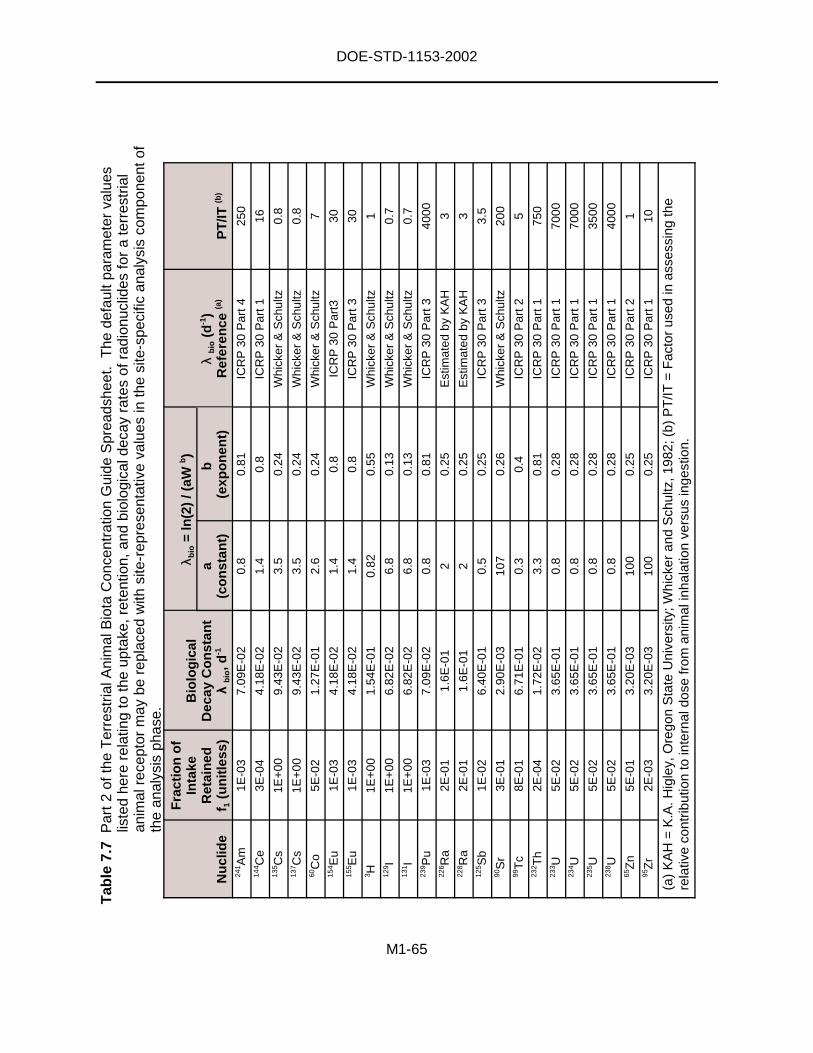
DOE-STD-1153-2002
M1-65
Tab
le7.
7P
art2
ofth
eT
erre
stria
lAni
mal
Bio
taC
once
ntra
tion
Gui
deS
prea
dshe
et.
The
defa
ultp
aram
eter
valu
eslis
ted
here
rela
ting
toth
eup
take
,ret
entio
n,an
dbi
olog
ical
deca
yra
tes
ofra
dion
uclid
esfo
ra
terr
estr
ial
anim
alre
cept
orm
aybe
repl
aced
with
site
-rep
rese
ntat
ive
valu
esin
the
site
-spe
cific
anal
ysis
com
pone
ntof
the
anal
ysis
phas
e.
Nu
clid
e
Fra
ctio
no
fIn
take
Ret
ain
edf 1
(un
itle
ss)
Bio
log
ical
Dec
ayC
on
stan
tλ
bio,d
-1
λ bio
=ln
(2)
/(aW
b)
λ b
io(d
-1)
Ref
eren
ce(a
)P
T/IT
(b)
a(c
on
stan
t)b
(exp
on
ent)
241 A
m1E
-03
7.09
E-0
20.
80.
81IC
RP
30P
art4
250
144 C
e3E
-04
4.18
E-0
21.
40.
8IC
RP
30P
art1
1613
5 Cs
1E+
009.
43E
-02
3.5
0.24
Whi
cker
&S
chul
tz0.
813
7 Cs
1E+
009.
43E
-02
3.5
0.24
Whi
cker
&S
chul
tz0.
860
Co
5E-0
21.
27E
-01
2.6
0.24
Whi
cker
&S
chul
tz7
154 E
u1E
-03
4.18
E-0
21.
40.
8IC
RP
30P
art3
3015
5 Eu
1E-0
34.
18E
-02
1.4
0.8
ICR
P30
Par
t330
3 H1E
+00
1.54
E-0
10.
820.
55W
hick
er&
Sch
ultz
112
9 I1E
+00
6.82
E-0
26.
80.
13W
hick
er&
Sch
ultz
0.7
131 I
1E+
006.
82E
-02
6.8
0.13
Whi
cker
&S
chul
tz0.
723
9 Pu
1E-0
37.
09E
-02
0.8
0.81
ICR
P30
Par
t340
0022
6 Ra
2E-0
11.
6E-0
12
0.25
Est
imat
edby
KA
H3
228 R
a2E
-01
1.6E
-01
20.
25E
stim
ated
byK
AH
312
5 Sb
1E-0
26.
40E
-01
0.5
0.25
ICR
P30
Par
t33.
590
Sr
3E-0
12.
90E
-03
107
0.26
Whi
cker
&S
chul
tz20
099
Tc
8E-0
16.
71E
-01
0.3
0.4
ICR
P30
Par
t25
232 T
h2E
-04
1.72
E-0
23.
30.
81IC
RP
30P
art1
750
233 U
5E-0
23.
65E
-01
0.8
0.28
ICR
P30
Par
t170
0023
4 U5E
-02
3.65
E-0
10.
80.
28IC
RP
30P
art1
7000
235 U
5E-0
23.
65E
-01
0.8
0.28
ICR
P30
Par
t135
0023
8 U5E
-02
3.65
E-0
10.
80.
28IC
RP
30P
art1
4000
65Z
n5E
-01
3.20
E-0
310
00.
25IC
RP
30P
art2
195
Zr
2E-0
33.
20E
-03
100
0.25
ICR
P30
Par
t110
(a)
KA
H=
K.A
.Hig
ley,
Ore
gon
Sta
teU
nive
rsity
;Whi
cker
and
Sch
ultz
,198
2;(b
)P
T/IT
=F
acto
rus
edin
asse
ssin
gth
ere
lativ
eco
ntrib
utio
nto
inte
rnal
dose
from
anim
alin
hala
tion
vers
usin
gest
ion.
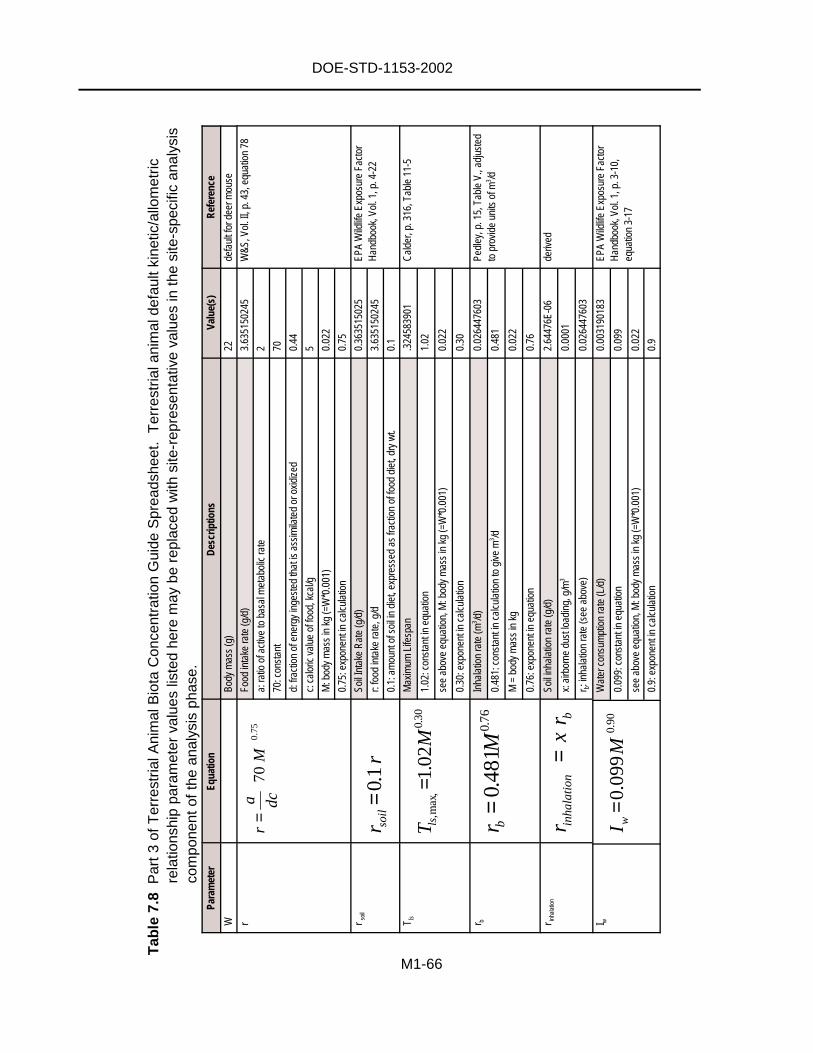
75.070
Mdca
r=
bin
hala
tion
rx
r=r
r soil
1.0=
30.0,
max
,02.1
MT ls
=
76.048
1.0
Mr b
=
90.009
9.0
MI w
=
Tab
le7.
8P
art3
ofT
erre
stria
lAni
mal
Bio
taC
once
ntra
tion
Gui
deS
prea
dshe
et.
Ter
rest
riala
nim
alde
faul
tkin
etic
/allo
met
ricre
latio
nshi
ppa
ram
eter
valu
eslis
ted
here
may
bere
plac
edw
ithsi
te-r
epre
sent
ativ
eva
lues
inth
esi
te-s
peci
fican
alys
isco
mpo
nent
ofth
ean
alys
isph
ase.
Para
met
erEq
uatio
nD
escr
iptio
nsVa
lue(
s)R
efer
ence
WBo
dym
ass
(g)
22de
faul
tfor
deer
mou
se
rFo
odin
take
rate
(g/d
)3.
6351
5024
5W
&S,V
ol.I
I,p.
43,e
quat
ion
78
a:ra
tioof
activ
eto
basa
lmet
abol
icra
te2
70:c
onst
ant
70
d:fra
ctio
nof
ener
gyin
gest
edth
atis
assi
mila
ted
orox
idiz
ed0.
44
c:ca
loric
valu
eof
food
,kca
l/g5
M:b
ody
mas
sin
kg(=
W*0
.001
)0.
022
0.75
:exp
onen
tin
calc
ulat
ion
0.75
r soi
lSo
ilIn
take
Rat
e(g
/d)
0.36
3515
025
EPA
Wild
life
Expo
sure
Fact
orH
andb
ook,
Vol.
1,p.
4-22
r:fo
odin
take
rate
,g/d
3.63
5150
245
0.1:
amou
ntof
soil
indi
et,e
xpre
ssed
asfra
ctio
nof
food
diet
,dry
wt.
0.1
T Is
Max
imum
Life
span
.324
5839
01C
alde
r,p.
316,
Tabl
e11
-5
1.02
:con
stan
tin
equa
tion
1.02
see
abov
eeq
uatio
n,M
:bod
ym
ass
inkg
(=W
*0.0
01)
0.02
2
0.30
:exp
onen
tin
calc
ulat
ion
0.30
r bIn
hala
tion
rate
(m3 /d
)0.
0264
4760
3Pe
dley
,p.1
5,Ta
ble
V.,a
djus
ted
topr
ovid
eun
itsof
m3 /d
0.48
1:co
nsta
ntin
calc
ulat
ion
togi
vem
3 /d0.
481
M=
body
mas
sin
kg0.
022
0.76
:exp
onen
tin
equa
tion
0.76
r inha
latio
nSo
ilin
hala
tion
rate
(g/d
)2.
6447
6E-0
6de
rived
x:ai
rbor
nedu
stlo
adin
g,g/
m3
0.00
01
r b:in
hala
tion
rate
(see
abov
e)0.
0264
4760
3
I wW
ater
cons
umpt
ion
rate
(L/d
)0.
0031
9018
3EP
AW
ildlif
eEx
posu
reFa
ctor
Han
dboo
k,Vo
l.1,
p.3-
10,
equa
tion
3-17
0.09
9:co
nsta
ntin
equa
tion
0.09
9
see
abov
eeq
uatio
n,M
:bod
ym
ass
inkg
(=W
*0.0
01)
0.02
2
0.9:
expo
nent
inca
lcul
atio
n0.
9
M1-66
DOE-STD-1153-2002
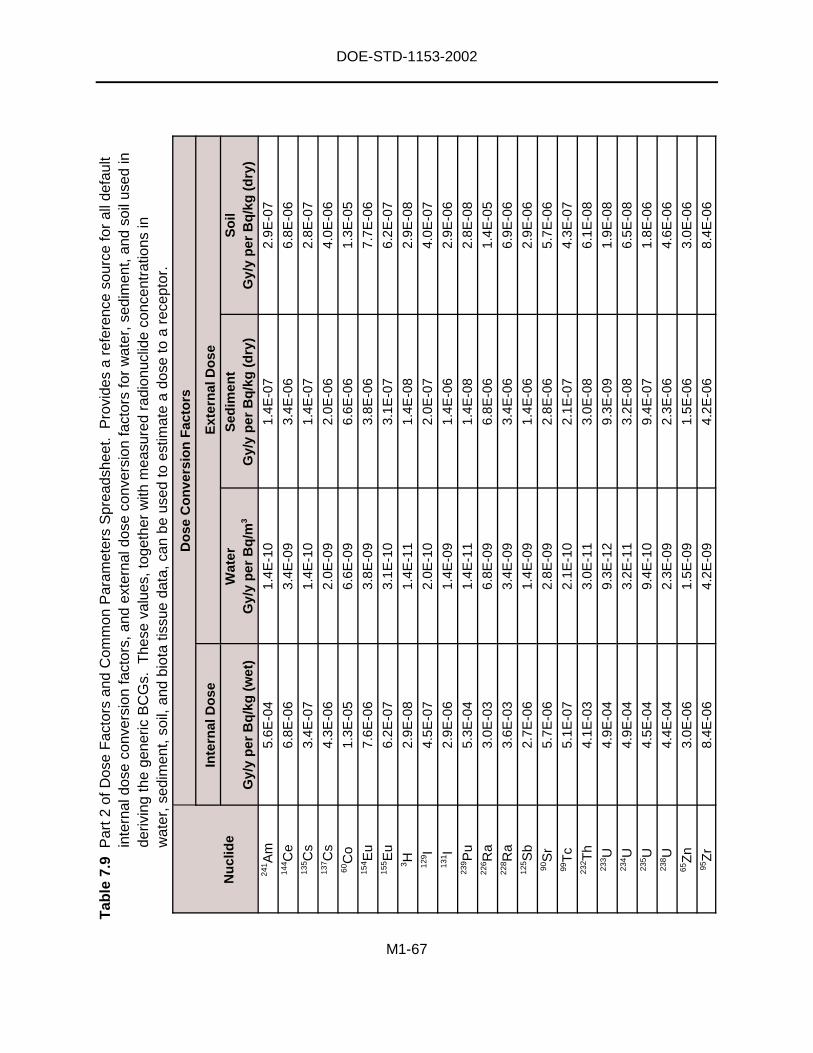
DOE-STD-1153-2002
M1-67
Tab
le7.
9P
art2
ofD
ose
Fac
tors
and
Com
mon
Par
amet
ers
Spr
eads
heet
.P
rovi
des
are
fere
nce
sour
cefo
ral
ldef
ault
inte
rnal
dose
conv
ersi
onfa
ctor
s,an
dex
tern
aldo
seco
nver
sion
fact
ors
for
wat
er,s
edim
ent,
and
soil
used
inde
rivin
gth
ege
neric
BC
Gs.
The
seva
lues
,tog
ethe
rw
ithm
easu
red
radi
onuc
lide
conc
entr
atio
nsin
wat
er,s
edim
ent,
soil,
and
biot
atis
sue
data
,can
beus
edto
estim
ate
ado
seto
are
cept
or.
Nu
clid
e
Do
seC
on
vers
ion
Fac
tors
Inte
rnal
Do
seE
xter
nal
Do
se
Gy/
yp
erB
q/k
g(w
et)
Wat
erG
y/y
per
Bq
/m3
Sed
imen
tG
y/y
per
Bq
/kg
(dry
)S
oil
Gy/
yp
erB
q/k
g(d
ry)
241 A
m5.
6E-0
41.
4E-1
01.
4E-0
72.
9E-0
714
4 Ce
6.8E
-06
3.4E
-09
3.4E
-06
6.8E
-06
135 C
s3.
4E-0
71.
4E-1
01.
4E-0
72.
8E-0
713
7 Cs
4.3E
-06
2.0E
-09
2.0E
-06
4.0E
-06
60C
o1.
3E-0
56.
6E-0
96.
6E-0
61.
3E-0
515
4 Eu
7.6E
-06
3.8E
-09
3.8E
-06
7.7E
-06
155 E
u6.
2E-0
73.
1E-1
03.
1E-0
76.
2E-0
73 H
2.9E
-08
1.4E
-11
1.4E
-08
2.9E
-08
129 I
4.5E
-07
2.0E
-10
2.0E
-07
4.0E
-07
131 I
2.9E
-06
1.4E
-09
1.4E
-06
2.9E
-06
239 P
u5.
3E-0
41.
4E-1
11.
4E-0
82.
8E-0
822
6 Ra
3.0E
-03
6.8E
-09
6.8E
-06
1.4E
-05
228 R
a3.
6E-0
33.
4E-0
93.
4E-0
66.
9E-0
612
5 Sb
2.7E
-06
1.4E
-09
1.4E
-06
2.9E
-06
90S
r5.
7E-0
62.
8E-0
92.
8E-0
65.
7E-0
699
Tc
5.1E
-07
2.1E
-10
2.1E
-07
4.3E
-07
232 T
h4.
1E-0
33.
0E-1
13.
0E-0
86.
1E-0
823
3 U4.
9E-0
49.
3E-1
29.
3E-0
91.
9E-0
823
4 U4.
9E-0
43.
2E-1
13.
2E-0
86.
5E-0
823
5 U4.
5E-0
49.
4E-1
09.
4E-0
71.
8E-0
623
8 U4.
4E-0
42.
3E-0
92.
3E-0
64.
6E-0
665
Zn
3.0E
-06
1.5E
-09
1.5E
-06
3.0E
-06
95Z
r8.
4E-0
64.
2E-0
94.
2E-0
68.
4E-0
6

DOE-STD-1153-2002
M1-68
INTENTIONALLY BLANK
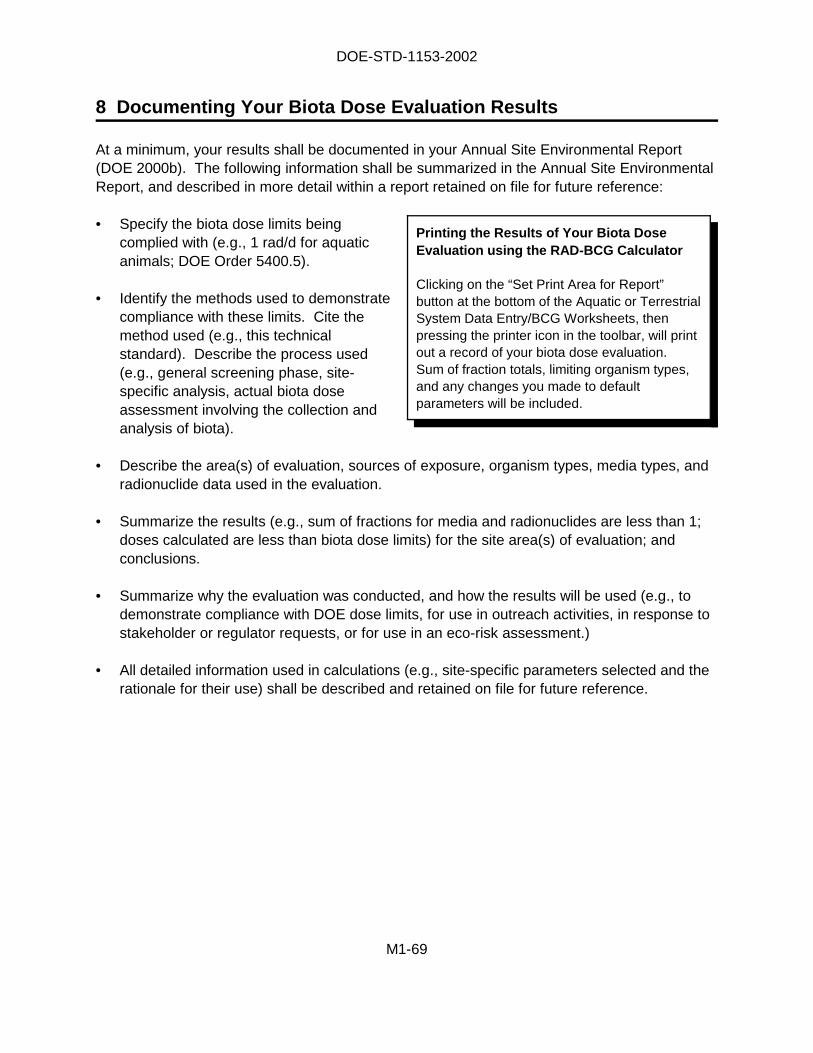
DOE-STD-1153-2002
M1-69
Printing the Results of Your Biota DoseEvaluation using the RAD-BCG Calculator
Clicking on the “Set Print Area for Report”button at the bottom of the Aquatic or TerrestrialSystem Data Entry/BCG Worksheets, thenpressing the printer icon in the toolbar, will printout a record of your biota dose evaluation.Sum of fraction totals, limiting organism types,and any changes you made to defaultparameters will be included.
8 Documenting Your Biota Dose Evaluation Results
At a minimum, your results shall be documented in your Annual Site Environmental Report(DOE 2000b). The following information shall be summarized in the Annual Site EnvironmentalReport, and described in more detail within a report retained on file for future reference:
• Specify the biota dose limits beingcomplied with (e.g., 1 rad/d for aquaticanimals; DOE Order 5400.5).
• Identify the methods used to demonstratecompliance with these limits. Cite themethod used (e.g., this technicalstandard). Describe the process used(e.g., general screening phase, site-specific analysis, actual biota doseassessment involving the collection andanalysis of biota).
• Describe the area(s) of evaluation, sources of exposure, organism types, media types, andradionuclide data used in the evaluation.
• Summarize the results (e.g., sum of fractions for media and radionuclides are less than 1;doses calculated are less than biota dose limits) for the site area(s) of evaluation; andconclusions.
• Summarize why the evaluation was conducted, and how the results will be used (e.g., todemonstrate compliance with DOE dose limits, for use in outreach activities, in response tostakeholder or regulator requests, or for use in an eco-risk assessment.)
• All detailed information used in calculations (e.g., site-specific parameters selected and therationale for their use) shall be described and retained on file for future reference.

DOE-STD-1153-2002
M1-70
INTENTIONALLY BLANK
DOE-STD-1153-2002
M1-71
9 Example Applications of the Graded Approach
9.1 Generic Example of an Aquatic System Evaluation
This example was prepared using actual measured radionuclide concentration data from a DOEsite. However, the data is used within a hypothetical context for a generic site (e.g., PoplarSprings Site, a hypothetical site). Two cases are provided, drawing from the same data set ofmeasured radionuclide concentrations from surface water samples. The first case considersthe entire Poplar Springs Site as the evaluation area, and options for proceeding when the Sitefails a general screening evaluation. The second case begins with the goal of assessingseveral evaluation areas independently within the boundary of the Poplar Springs Site. Thecases are intended only to highlight key steps and concepts of the graded approach, and tohighlight several alternatives within each that would also result in a determination of protectionrelative to Dose Rate Guidelines.

DOE-STD-1153-2002
M1-72
Purpose:
The purpose of the evaluation was to demonstrate that the Poplar Springs Site (PSS) is incompliance with DOE’s biota dose limit for aquatic animals pursuant to DOE Order 5400.5 II3.a.(c)(5): “to protect native animal aquatic organisms, the absorbed does to these organisms shallnot exceed 1 rad/d from exposure to the radioactive material in liquid wastes discharged to naturalwaterways.”
1. Data Assembly (Phase 1 of the Graded Approach):
A. Verify Data is Appropriate for a Biota Dose Evaluation
Surface water samples are collected and analyzed to assess the impact of past and current DOEoperations on the quality of local surface water. Sampling locations include streams within the mainplant area and at downstream locations from Poplar Springs Site (PSS) facilities; all are within thePSS boundary. These sampling stations are located within the Blue Falls Creek Watershed (mainplant and down stream locations) and within other smaller watersheds, all of which flow into theDarlington River. Surface water data (via the surface water surveillance program) are collectedthroughout the year. The sampling frequency is dependant on historical data and the processes orlegacy activities nearby or upstream from these locations. Therefore, sampling occurs at differentlocations monthly, bimonthly, quarterly, or semiannually. The sampling locations are presented inTable 1.
Table 1 Surface Water Sampling Locations for the Poplar Springs SiteWatershed Sampling Locations
Blue Falls CreekMain Plant–On-site StreamLocations:
Two Falls Creek TFCK 0.5
Broad Creek BRCKNorthwest Tributary NWTK 0.5
Downstream Locations: Muddy Branch MB 0.6Blue Falls Creek BFCK 3.0Blue Falls Creek at Blue Falls Dam BFCK 1.4
Other Watersheds Entering Taylor’s Creek TCK 1.0the Darlington River Beaver Creek BVCK 2.3
B. Request Sampling Data, to Include Maximum and Mean Water and SedimentRadionuclide Concentrations (co-located if possible) Collected for the EnvironmentalMonitoring and Surveillance Program at Poplar Springs Site
Environmental surveillance surface water monitoring results were available. However, no on-sitesediment data (co-located with water sampling stations) were available. The data were organized bycollection location and summarized in a table for future use (Table 2). It was determined that thesampling locations indicated in Table 2 were each representative of individual evaluation areaswithin the larger Poplar Springs Site. Each of the evaluation areas were identified because theyprovide a good indication of potential impacts to biota in natural waterways within the Poplar SpringsSite.
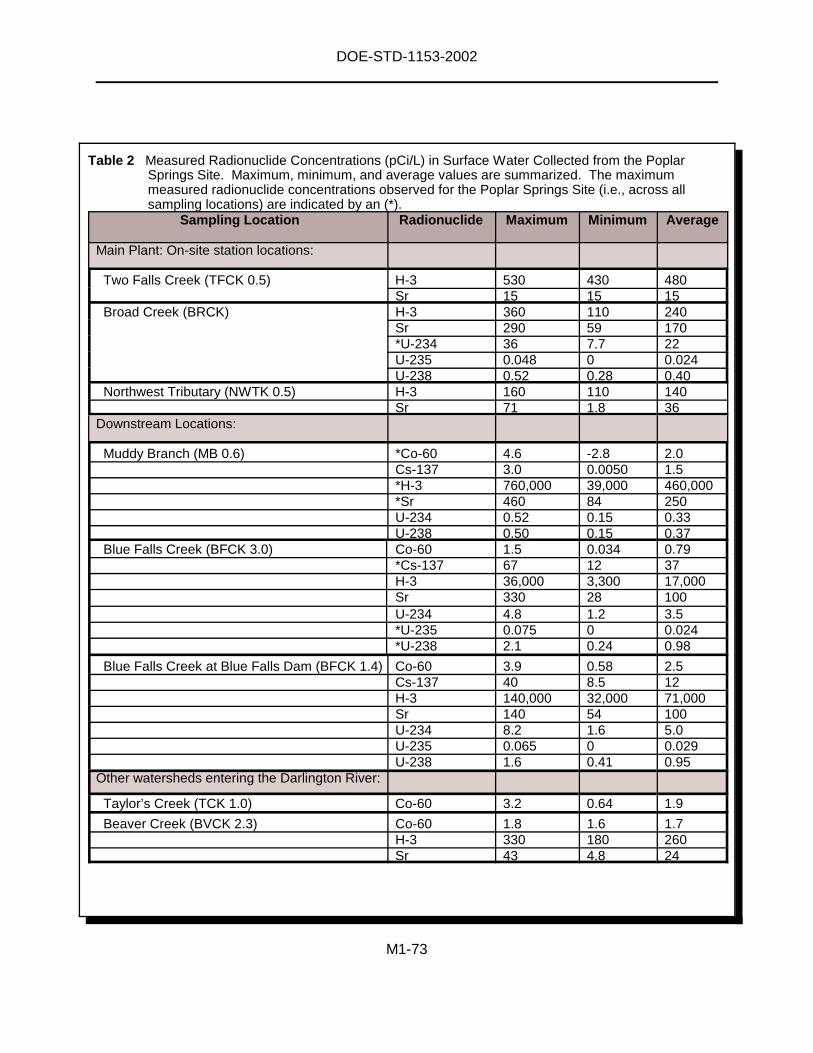
DOE-STD-1153-2002
M1-73
Table 2 Measured Radionuclide Concentrations (pCi/L) in Surface Water Collected from the PoplarSprings Site. Maximum, minimum, and average values are summarized. The maximummeasured radionuclide concentrations observed for the Poplar Springs Site (i.e., across allsampling locations) are indicated by an (*).
Sampling Location Radionuclide Maximum Minimum Average
Main Plant: On-site station locations:
Two Falls Creek (TFCK 0.5) H-3 530 430 480Sr 15 15 15
Broad Creek (BRCK) H-3 360 110 240Sr 290 59 170*U-234 36 7.7 22U-235 0.048 0 0.024U-238 0.52 0.28 0.40
Northwest Tributary (NWTK 0.5) H-3 160 110 140Sr 71 1.8 36
Downstream Locations:
Muddy Branch (MB 0.6) *Co-60 4.6 -2.8 2.0Cs-137 3.0 0.0050 1.5*H-3 760,000 39,000 460,000*Sr 460 84 250U-234 0.52 0.15 0.33U-238 0.50 0.15 0.37
Blue Falls Creek (BFCK 3.0) Co-60 1.5 0.034 0.79*Cs-137 67 12 37H-3 36,000 3,300 17,000Sr 330 28 100U-234 4.8 1.2 3.5*U-235 0.075 0 0.024*U-238 2.1 0.24 0.98
Blue Falls Creek at Blue Falls Dam (BFCK 1.4) Co-60 3.9 0.58 2.5Cs-137 40 8.5 12H-3 140,000 32,000 71,000Sr 140 54 100U-234 8.2 1.6 5.0U-235 0.065 0 0.029U-238 1.6 0.41 0.95
Other watersheds entering the Darlington River:
Taylor’s Creek (TCK 1.0) Co-60 3.2 0.64 1.9
Beaver Creek (BVCK 2.3) Co-60 1.8 1.6 1.7H-3 330 180 260Sr 43 4.8 24

DOE-STD-1153-2002
M1-74
CASE 1. Use of Maximum Measured Radionuclide Concentrations for the Entire PoplarSprings Site
1. General Screening Evaluation (Phase 2 of the Graded Approach)
A. Enter Data into the RAD-BCG Calculator
Maximum measured radionuclide concentration data for surface water detected for the entire PoplarSprings Site (i.e., the radionuclide-specific maximum values detected across the entire Site) wereentered into the Aquatic System Data Entry/BCG Worksheet within the RAD-BCG Calculator. TheRAD-BCG Calculator automatically calculated the missing sediment radionuclide concentration data(e.g., by using the “most probable” radionuclide-specific Kd values) and entered the calculatedradionuclide concentrations into the appropriate fields.
B. Compare Measured Radionuclide Concentrations in Environmental Media with BCGs
The RAD-BCG Calculator automatically calculated the radionuclide-specific partial sum of fractionsfor water and sediment, then calculated the total sum of fractions. A summary of the comparisonsfor each medium and radionuclide (which is similar in presentation to what you would see in theAquatic System Data Entry/BCG Worksheet) is provided in Table 3. Note that this comparisoncould also be done manually by using Tables 6.1 - 6.2 and associated guidance contained inModule 1 of the DOE technical standard. The results indicated that the Poplar Springs Site failedthe general screening evaluation using maximum radionuclide concentration data. Results alsoindicated that the water medium appears to be limiting (see partial sum of fractions for water andsediment, respectively, in Table 3). In addition, Cs-137 and Sr-90 were the radionuclides thatprovided the greatest contribution to the total sum of fractions (i.e., they were the most limitingradionuclides, providing the greatest contribution to potential dose). A riparian animal was indicatedas the limiting organism type for these radionuclides.
Table 3 Aquatic System Evaluation: General Screening Results for Poplar Springs Site usingMaximum Measured Radionuclide Concentrations in Surface Water Across the Entire Site
RadionuclideMaximum Measured Radionuclide
Concentrations (pCi/L)Water Sumof Fractions
Sediment Sumof Fractions
H-3 760,000 2.9E-03 2.03E-06Sr-90 460 1.70 2.37E-02U-234 36 1.8E-01 3.42E-04U-235 0.075 3.4E-04 1.01E-06U-238 2.1 9.4E-03 4.22E-05Co-60 4.6 1.2E-03 3.14E-03Cs-137 67 1.6 1.07E-02Total of partial sum offractions for each medium
3.42 3.80E-02
Total sum of fractions for allradionuclides and media
3.45
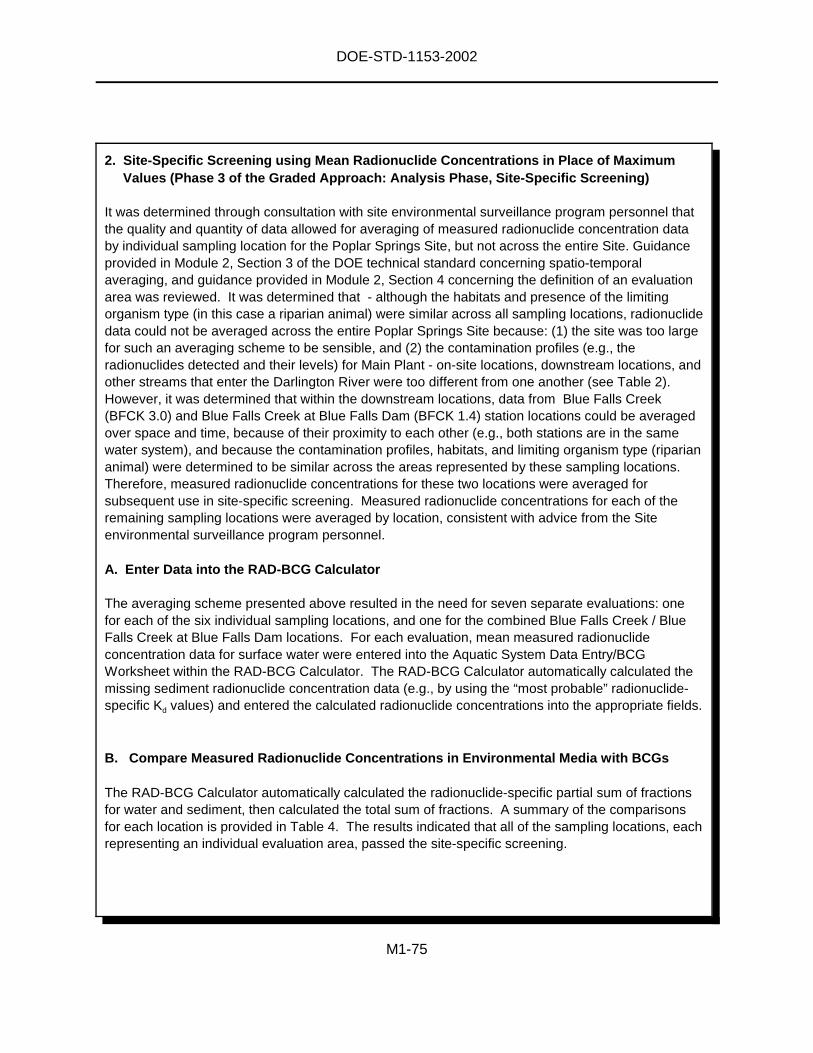
DOE-STD-1153-2002
M1-75
2. Site-Specific Screening using Mean Radionuclide Concentrations in Place of MaximumValues (Phase 3 of the Graded Approach: Analysis Phase, Site-Specific Screening)
It was determined through consultation with site environmental surveillance program personnel thatthe quality and quantity of data allowed for averaging of measured radionuclide concentration databy individual sampling location for the Poplar Springs Site, but not across the entire Site. Guidanceprovided in Module 2, Section 3 of the DOE technical standard concerning spatio-temporalaveraging, and guidance provided in Module 2, Section 4 concerning the definition of an evaluationarea was reviewed. It was determined that - although the habitats and presence of the limitingorganism type (in this case a riparian animal) were similar across all sampling locations, radionuclidedata could not be averaged across the entire Poplar Springs Site because: (1) the site was too largefor such an averaging scheme to be sensible, and (2) the contamination profiles (e.g., theradionuclides detected and their levels) for Main Plant - on-site locations, downstream locations, andother streams that enter the Darlington River were too different from one another (see Table 2).However, it was determined that within the downstream locations, data from Blue Falls Creek(BFCK 3.0) and Blue Falls Creek at Blue Falls Dam (BFCK 1.4) station locations could be averagedover space and time, because of their proximity to each other (e.g., both stations are in the samewater system), and because the contamination profiles, habitats, and limiting organism type (ripariananimal) were determined to be similar across the areas represented by these sampling locations.Therefore, measured radionuclide concentrations for these two locations were averaged forsubsequent use in site-specific screening. Measured radionuclide concentrations for each of theremaining sampling locations were averaged by location, consistent with advice from the Siteenvironmental surveillance program personnel.
A. Enter Data into the RAD-BCG Calculator
The averaging scheme presented above resulted in the need for seven separate evaluations: onefor each of the six individual sampling locations, and one for the combined Blue Falls Creek / BlueFalls Creek at Blue Falls Dam locations. For each evaluation, mean measured radionuclideconcentration data for surface water were entered into the Aquatic System Data Entry/BCGWorksheet within the RAD-BCG Calculator. The RAD-BCG Calculator automatically calculated themissing sediment radionuclide concentration data (e.g., by using the “most probable” radionuclide-specific Kd values) and entered the calculated radionuclide concentrations into the appropriate fields.
B. Compare Measured Radionuclide Concentrations in Environmental Media with BCGs
The RAD-BCG Calculator automatically calculated the radionuclide-specific partial sum of fractionsfor water and sediment, then calculated the total sum of fractions. A summary of the comparisonsfor each location is provided in Table 4. The results indicated that all of the sampling locations, eachrepresenting an individual evaluation area, passed the site-specific screening.
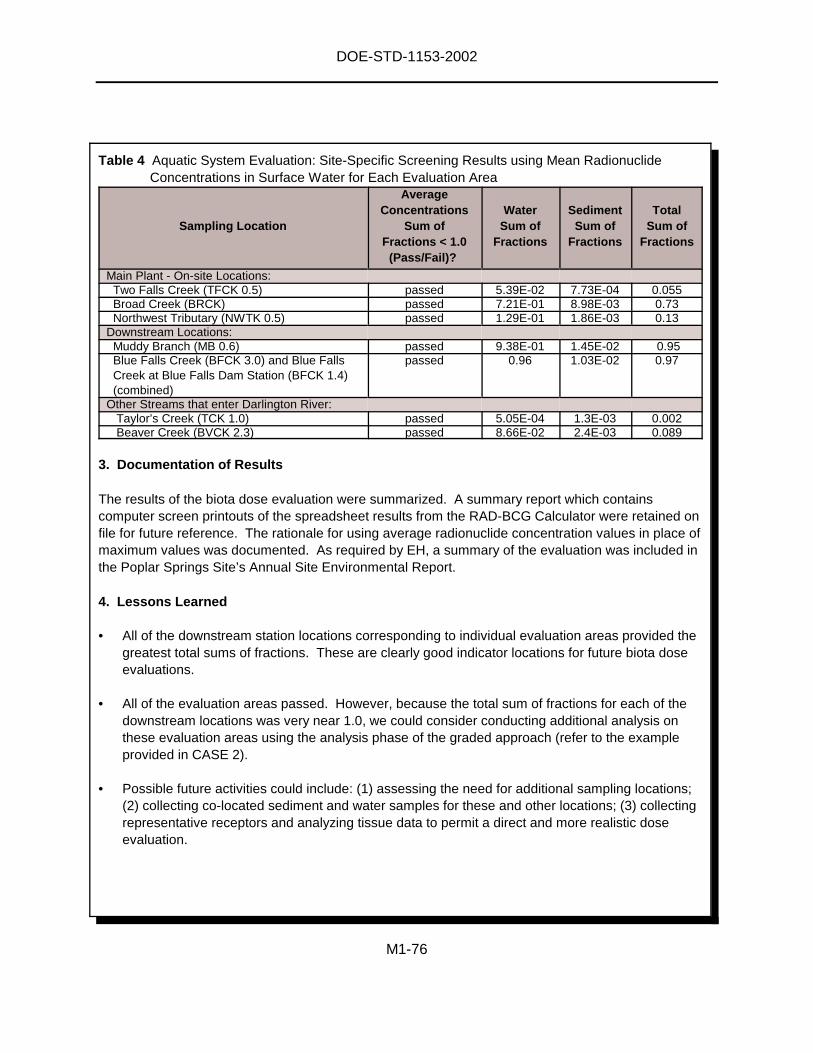
DOE-STD-1153-2002
M1-76
Table 4 Aquatic System Evaluation: Site-Specific Screening Results using Mean RadionuclideConcentrations in Surface Water for Each Evaluation Area
Sampling Location
AverageConcentrations
Sum ofFractions < 1.0
(Pass/Fail)?
WaterSum of
Fractions
SedimentSum of
Fractions
TotalSum of
Fractions
Main Plant - On-site Locations:Two Falls Creek (TFCK 0.5) passed 5.39E-02 7.73E-04 0.055Broad Creek (BRCK) passed 7.21E-01 8.98E-03 0.73Northwest Tributary (NWTK 0.5) passed 1.29E-01 1.86E-03 0.13
Downstream Locations:Muddy Branch (MB 0.6) passed 9.38E-01 1.45E-02 0.95Blue Falls Creek (BFCK 3.0) and Blue FallsCreek at Blue Falls Dam Station (BFCK 1.4)(combined)
passed 0.96 1.03E-02 0.97
Other Streams that enter Darlington River:Taylor’s Creek (TCK 1.0) passed 5.05E-04 1.3E-03 0.002Beaver Creek (BVCK 2.3) passed 8.66E-02 2.4E-03 0.089
3. Documentation of Results
The results of the biota dose evaluation were summarized. A summary report which containscomputer screen printouts of the spreadsheet results from the RAD-BCG Calculator were retained onfile for future reference. The rationale for using average radionuclide concentration values in place ofmaximum values was documented. As required by EH, a summary of the evaluation was included inthe Poplar Springs Site’s Annual Site Environmental Report.
4. Lessons Learned
• All of the downstream station locations corresponding to individual evaluation areas provided thegreatest total sums of fractions. These are clearly good indicator locations for future biota doseevaluations.
• All of the evaluation areas passed. However, because the total sum of fractions for each of thedownstream locations was very near 1.0, we could consider conducting additional analysis onthese evaluation areas using the analysis phase of the graded approach (refer to the exampleprovided in CASE 2).
• Possible future activities could include: (1) assessing the need for additional sampling locations;(2) collecting co-located sediment and water samples for these and other locations; (3) collectingrepresentative receptors and analyzing tissue data to permit a direct and more realistic doseevaluation.
DOE-STD-1153-2002
M1-77
CASE 2. Evaluation of Several Evaluation Areas Using Maximum MeasuredRadionuclide Concentration Data
1. General Screening Evaluation (Phase 2 of the Graded Approach)
A. Enter Data into the RAD-BCG Calculator
Maximum measured radionuclide concentration data for surface water for each sampling location(each representative of individual evaluation areas) were entered into the Aquatic System DataEntry/BCG Worksheet within the RAD-BCG Calculator (i.e., in this case, eight individual evaluations,one for each sampling location representative of an evaluation area, were conducted). The RAD-BCG Calculator automatically calculated the missing sediment radionuclide concentration data (e.g.,by using the “most probable” radionuclide-specific Kd values) and entered the calculatedradionuclide concentrations into the appropriate fields.
B. Compare Measured Radionuclide Concentrations in Environmental Media with BCGs
The RAD-BCG Calculator automatically calculated the radionuclide-specific partial sum of fractionsfor water and sediment, then calculated the total sum of fractions. A summary of the comparisonsfor each location is provided in Table 5. The results indicated that four of the locations evaluated(Broad Creek, Muddy Branch, Blue Falls Creek, and Blue Falls Creek at Blue Falls Dam) failed thegeneral screening evaluation using maximum radionuclide concentration data. Results alsoindicated that the water medium is limiting (see partial sum of fractions for water and sediment,respectively, in Table 5). It was also determined that Cs-137 and Sr-90 were the radionuclides thatprovided the greatest contribution to the total sum of fractions (i.e., they were the most limitingradionuclides, providing the greatest contribution to potential dose). A riparian animal was thelimiting organism type for these radionuclides.
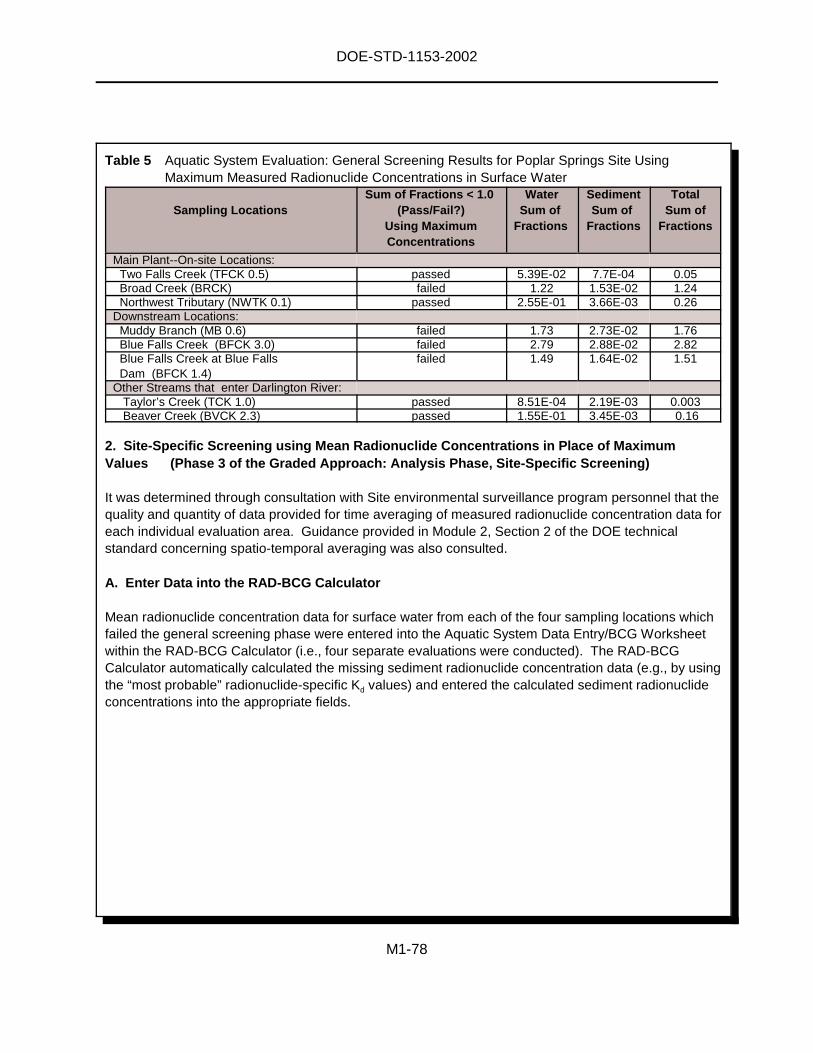
DOE-STD-1153-2002
M1-78
Table 5 Aquatic System Evaluation: General Screening Results for Poplar Springs Site UsingMaximum Measured Radionuclide Concentrations in Surface Water
Sampling LocationsSum of Fractions < 1.0
(Pass/Fail?)Using MaximumConcentrations
WaterSum of
Fractions
SedimentSum of
Fractions
TotalSum of
Fractions
Main Plant--On-site Locations:Two Falls Creek (TFCK 0.5) passed 5.39E-02 7.7E-04 0.05Broad Creek (BRCK) failed 1.22 1.53E-02 1.24Northwest Tributary (NWTK 0.1) passed 2.55E-01 3.66E-03 0.26
Downstream Locations:Muddy Branch (MB 0.6) failed 1.73 2.73E-02 1.76Blue Falls Creek (BFCK 3.0) failed 2.79 2.88E-02 2.82Blue Falls Creek at Blue FallsDam (BFCK 1.4)
failed 1.49 1.64E-02 1.51
Other Streams that enter Darlington River:Taylor’s Creek (TCK 1.0) passed 8.51E-04 2.19E-03 0.003Beaver Creek (BVCK 2.3) passed 1.55E-01 3.45E-03 0.16
2. Site-Specific Screening using Mean Radionuclide Concentrations in Place of MaximumValues (Phase 3 of the Graded Approach: Analysis Phase, Site-Specific Screening)
It was determined through consultation with Site environmental surveillance program personnel that thequality and quantity of data provided for time averaging of measured radionuclide concentration data foreach individual evaluation area. Guidance provided in Module 2, Section 2 of the DOE technicalstandard concerning spatio-temporal averaging was also consulted.
A. Enter Data into the RAD-BCG Calculator
Mean radionuclide concentration data for surface water from each of the four sampling locations whichfailed the general screening phase were entered into the Aquatic System Data Entry/BCG Worksheetwithin the RAD-BCG Calculator (i.e., four separate evaluations were conducted). The RAD-BCGCalculator automatically calculated the missing sediment radionuclide concentration data (e.g., by usingthe “most probable” radionuclide-specific Kd values) and entered the calculated sediment radionuclideconcentrations into the appropriate fields.
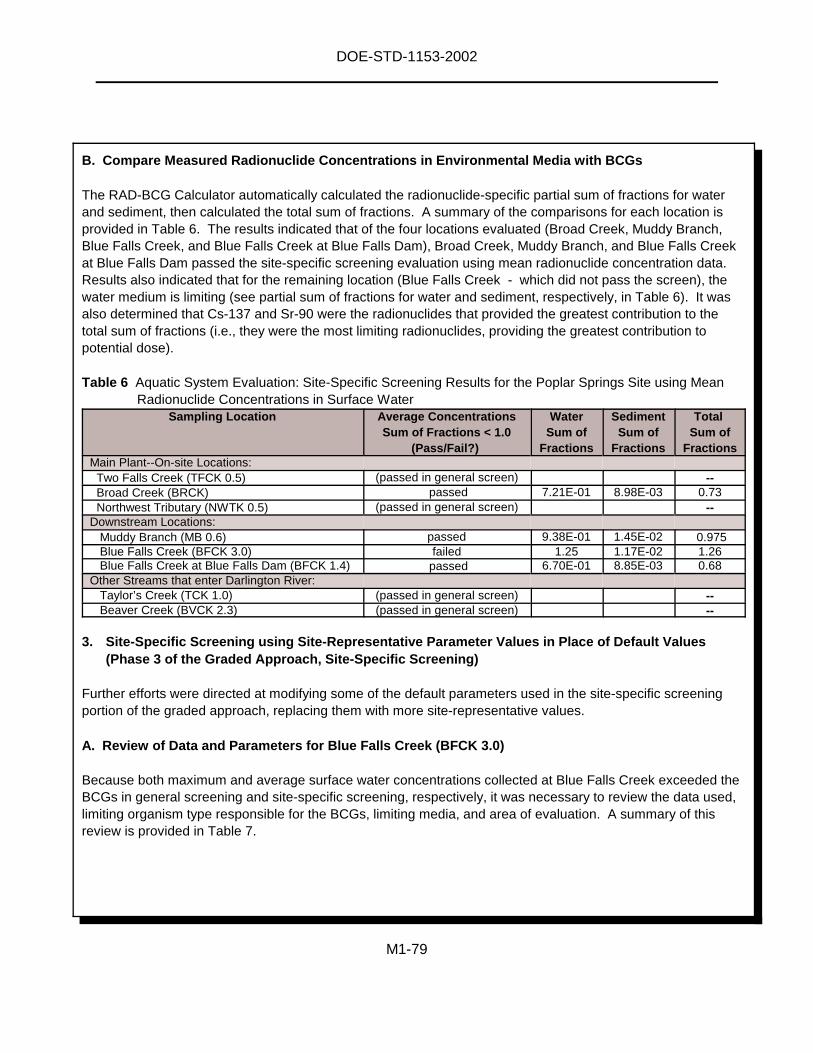
DOE-STD-1153-2002
M1-79
B. Compare Measured Radionuclide Concentrations in Environmental Media with BCGs
The RAD-BCG Calculator automatically calculated the radionuclide-specific partial sum of fractions for waterand sediment, then calculated the total sum of fractions. A summary of the comparisons for each location isprovided in Table 6. The results indicated that of the four locations evaluated (Broad Creek, Muddy Branch,Blue Falls Creek, and Blue Falls Creek at Blue Falls Dam), Broad Creek, Muddy Branch, and Blue Falls Creekat Blue Falls Dam passed the site-specific screening evaluation using mean radionuclide concentration data.Results also indicated that for the remaining location (Blue Falls Creek - which did not pass the screen), thewater medium is limiting (see partial sum of fractions for water and sediment, respectively, in Table 6). It wasalso determined that Cs-137 and Sr-90 were the radionuclides that provided the greatest contribution to thetotal sum of fractions (i.e., they were the most limiting radionuclides, providing the greatest contribution topotential dose).
Table 6 Aquatic System Evaluation: Site-Specific Screening Results for the Poplar Springs Site using MeanRadionuclide Concentrations in Surface Water
Sampling Location Average ConcentrationsSum of Fractions < 1.0
(Pass/Fail?)
WaterSum of
Fractions
SedimentSum of
Fractions
TotalSum of
FractionsMain Plant--On-site Locations:
Two Falls Creek (TFCK 0.5) (passed in general screen) --Broad Creek (BRCK) passed 7.21E-01 8.98E-03 0.73Northwest Tributary (NWTK 0.5) (passed in general screen) --
Downstream Locations:Muddy Branch (MB 0.6) passed 9.38E-01 1.45E-02 0.975Blue Falls Creek (BFCK 3.0) failed 1.25 1.17E-02 1.26Blue Falls Creek at Blue Falls Dam (BFCK 1.4) passed 6.70E-01 8.85E-03 0.68
Other Streams that enter Darlington River:Taylor’s Creek (TCK 1.0) (passed in general screen) --Beaver Creek (BVCK 2.3) (passed in general screen) --
3. Site-Specific Screening using Site-Representative Parameter Values in Place of Default Values(Phase 3 of the Graded Approach, Site-Specific Screening)
Further efforts were directed at modifying some of the default parameters used in the site-specific screeningportion of the graded approach, replacing them with more site-representative values.
A. Review of Data and Parameters for Blue Falls Creek (BFCK 3.0)
Because both maximum and average surface water concentrations collected at Blue Falls Creek exceeded theBCGs in general screening and site-specific screening, respectively, it was necessary to review the data used,limiting organism type responsible for the BCGs, limiting media, and area of evaluation. A summary of thisreview is provided in Table 7.
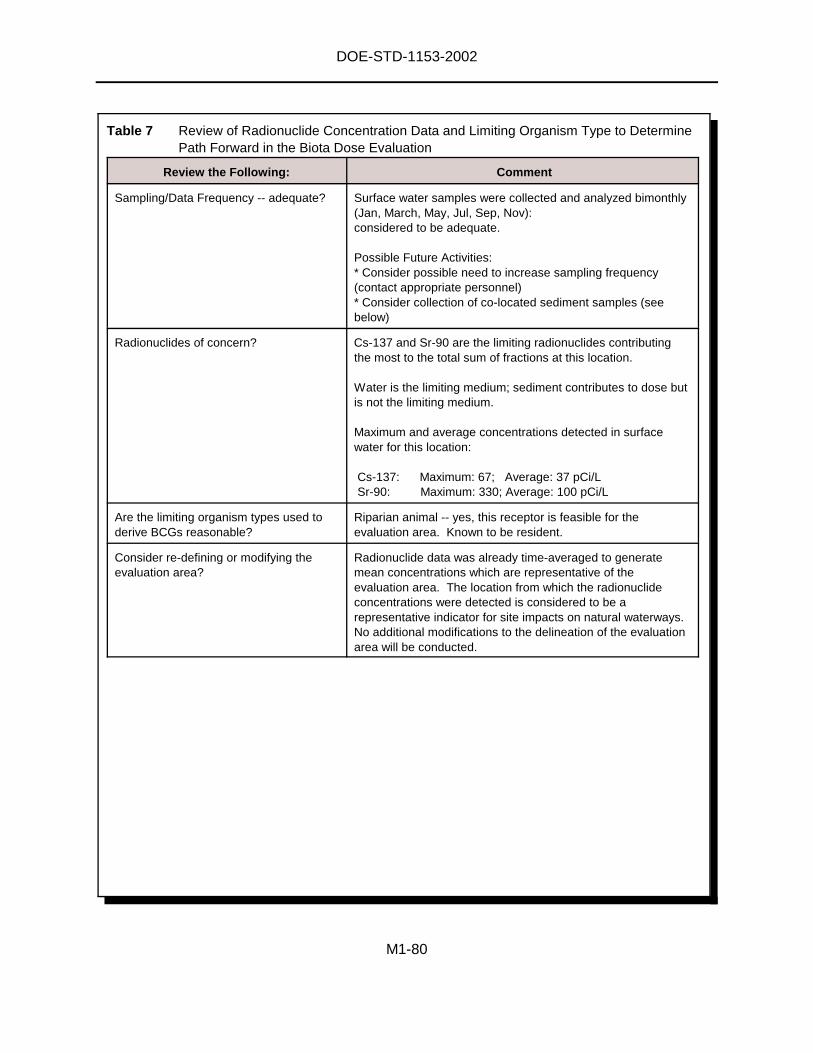
DOE-STD-1153-2002
M1-80
Table 7 Review of Radionuclide Concentration Data and Limiting Organism Type to DeterminePath Forward in the Biota Dose Evaluation
Review the Following: Comment
Sampling/Data Frequency -- adequate? Surface water samples were collected and analyzed bimonthly(Jan, March, May, Jul, Sep, Nov):considered to be adequate.
Possible Future Activities:* Consider possible need to increase sampling frequency(contact appropriate personnel)* Consider collection of co-located sediment samples (seebelow)
Radionuclides of concern? Cs-137 and Sr-90 are the limiting radionuclides contributingthe most to the total sum of fractions at this location.
Water is the limiting medium; sediment contributes to dose butis not the limiting medium.
Maximum and average concentrations detected in surfacewater for this location:
Cs-137: Maximum: 67; Average: 37 pCi/LSr-90: Maximum: 330; Average: 100 pCi/L
Are the limiting organism types used toderive BCGs reasonable?
Riparian animal -- yes, this receptor is feasible for theevaluation area. Known to be resident.
Consider re-defining or modifying theevaluation area?
Radionuclide data was already time-averaged to generatemean concentrations which are representative of theevaluation area. The location from which the radionuclideconcentrations were detected is considered to be arepresentative indicator for site impacts on natural waterways.No additional modifications to the delineation of the evaluationarea will be conducted.
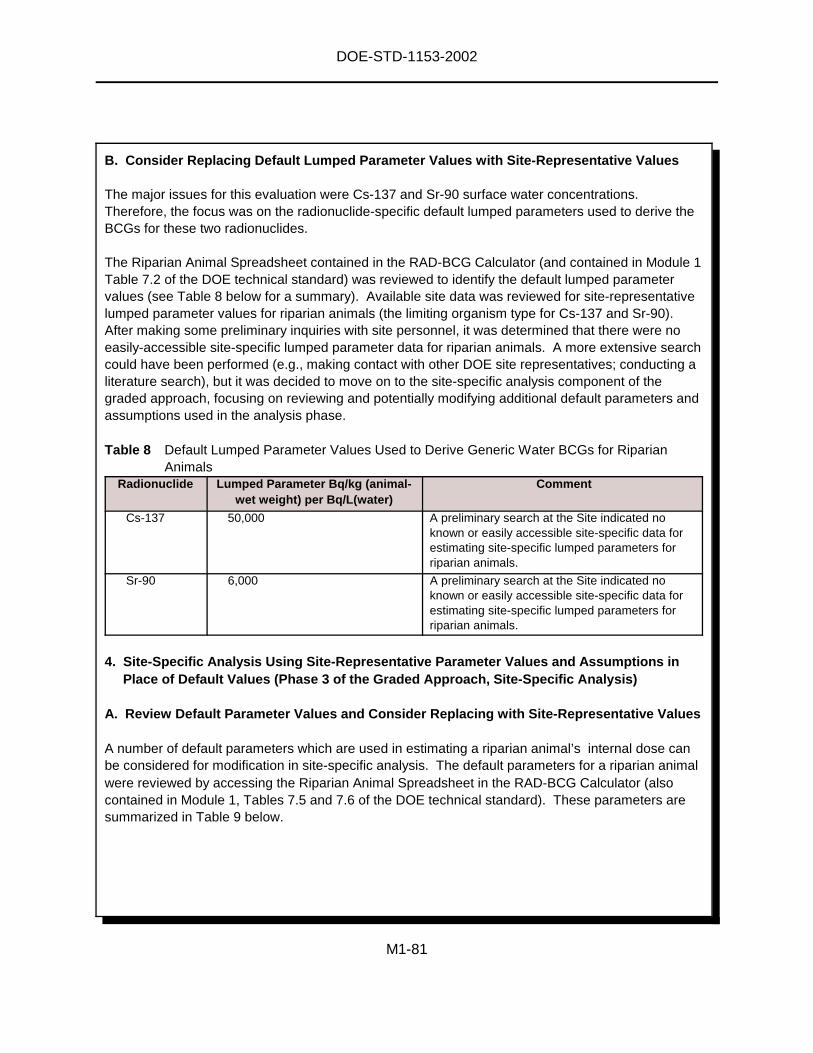
DOE-STD-1153-2002
M1-81
B. Consider Replacing Default Lumped Parameter Values with Site-Representative Values
The major issues for this evaluation were Cs-137 and Sr-90 surface water concentrations.Therefore, the focus was on the radionuclide-specific default lumped parameters used to derive theBCGs for these two radionuclides.
The Riparian Animal Spreadsheet contained in the RAD-BCG Calculator (and contained in Module 1Table 7.2 of the DOE technical standard) was reviewed to identify the default lumped parametervalues (see Table 8 below for a summary). Available site data was reviewed for site-representativelumped parameter values for riparian animals (the limiting organism type for Cs-137 and Sr-90).After making some preliminary inquiries with site personnel, it was determined that there were noeasily-accessible site-specific lumped parameter data for riparian animals. A more extensive searchcould have been performed (e.g., making contact with other DOE site representatives; conducting aliterature search), but it was decided to move on to the site-specific analysis component of thegraded approach, focusing on reviewing and potentially modifying additional default parameters andassumptions used in the analysis phase.
Table 8 Default Lumped Parameter Values Used to Derive Generic Water BCGs for RiparianAnimals
Radionuclide Lumped Parameter Bq/kg (animal-wet weight) per Bq/L(water)
Comment
Cs-137 50,000 A preliminary search at the Site indicated noknown or easily accessible site-specific data forestimating site-specific lumped parameters forriparian animals.
Sr-90 6,000 A preliminary search at the Site indicated noknown or easily accessible site-specific data forestimating site-specific lumped parameters forriparian animals.
4. Site-Specific Analysis Using Site-Representative Parameter Values and Assumptions inPlace of Default Values (Phase 3 of the Graded Approach, Site-Specific Analysis)
A. Review Default Parameter Values and Consider Replacing with Site-Representative Values
A number of default parameters which are used in estimating a riparian animal’s internal dose canbe considered for modification in site-specific analysis. The default parameters for a riparian animalwere reviewed by accessing the Riparian Animal Spreadsheet in the RAD-BCG Calculator (alsocontained in Module 1, Tables 7.5 and 7.6 of the DOE technical standard). These parameters aresummarized in Table 9 below.
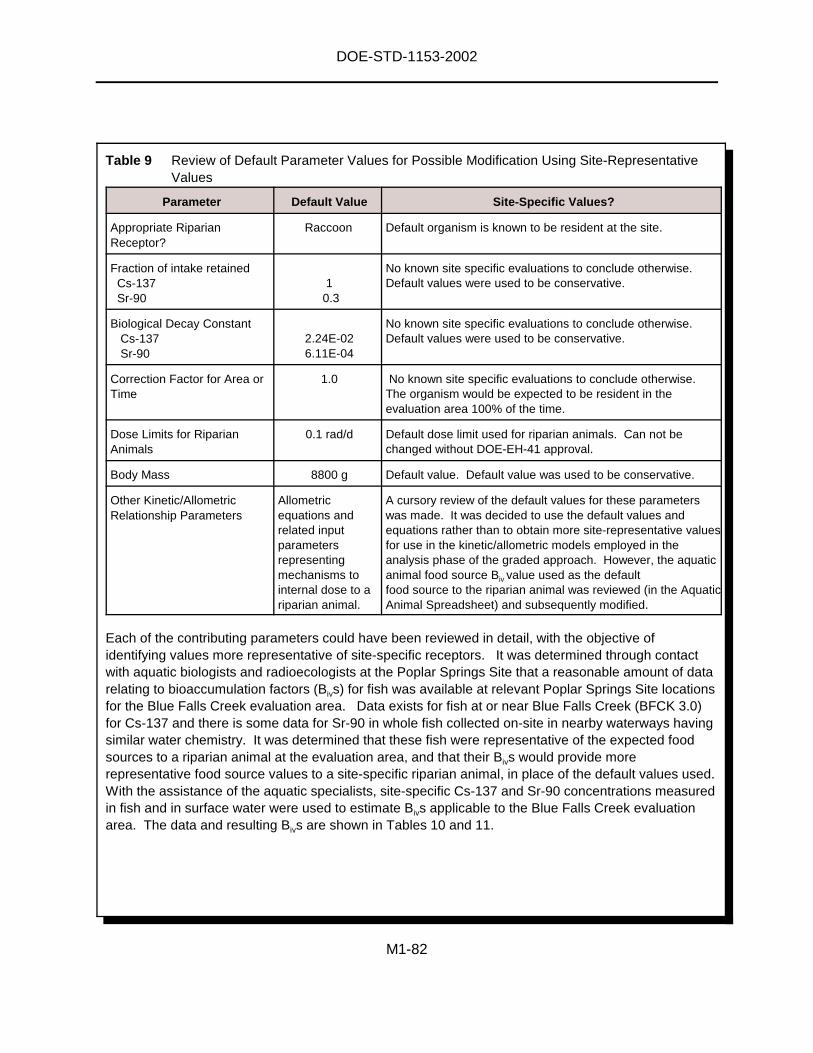
DOE-STD-1153-2002
M1-82
Table 9 Review of Default Parameter Values for Possible Modification Using Site-RepresentativeValues
Parameter Default Value Site-Specific Values?
Appropriate RiparianReceptor?
Raccoon Default organism is known to be resident at the site.
Fraction of intake retainedCs-137Sr-90
10.3
No known site specific evaluations to conclude otherwise.Default values were used to be conservative.
Biological Decay ConstantCs-137Sr-90
2.24E-026.11E-04
No known site specific evaluations to conclude otherwise.Default values were used to be conservative.
Correction Factor for Area orTime
1.0 No known site specific evaluations to conclude otherwise.The organism would be expected to be resident in theevaluation area 100% of the time.
Dose Limits for RiparianAnimals
0.1 rad/d Default dose limit used for riparian animals. Can not bechanged without DOE-EH-41 approval.
Body Mass 8800 g Default value. Default value was used to be conservative.
Other Kinetic/AllometricRelationship Parameters
Allometricequations andrelated inputparametersrepresentingmechanisms tointernal dose to ariparian animal.
A cursory review of the default values for these parameterswas made. It was decided to use the default values andequations rather than to obtain more site-representative valuesfor use in the kinetic/allometric models employed in theanalysis phase of the graded approach. However, the aquaticanimal food source Biv value used as the defaultfood source to the riparian animal was reviewed (in the AquaticAnimal Spreadsheet) and subsequently modified.
Each of the contributing parameters could have been reviewed in detail, with the objective ofidentifying values more representative of site-specific receptors. It was determined through contactwith aquatic biologists and radioecologists at the Poplar Springs Site that a reasonable amount of datarelating to bioaccumulation factors (Bivs) for fish was available at relevant Poplar Springs Site locationsfor the Blue Falls Creek evaluation area. Data exists for fish at or near Blue Falls Creek (BFCK 3.0)for Cs-137 and there is some data for Sr-90 in whole fish collected on-site in nearby waterways havingsimilar water chemistry. It was determined that these fish were representative of the expected foodsources to a riparian animal at the evaluation area, and that their Bivs would provide morerepresentative food source values to a site-specific riparian animal, in place of the default values used.With the assistance of the aquatic specialists, site-specific Cs-137 and Sr-90 concentrations measuredin fish and in surface water were used to estimate Bivs applicable to the Blue Falls Creek evaluationarea. The data and resulting Bivs are shown in Tables 10 and 11.
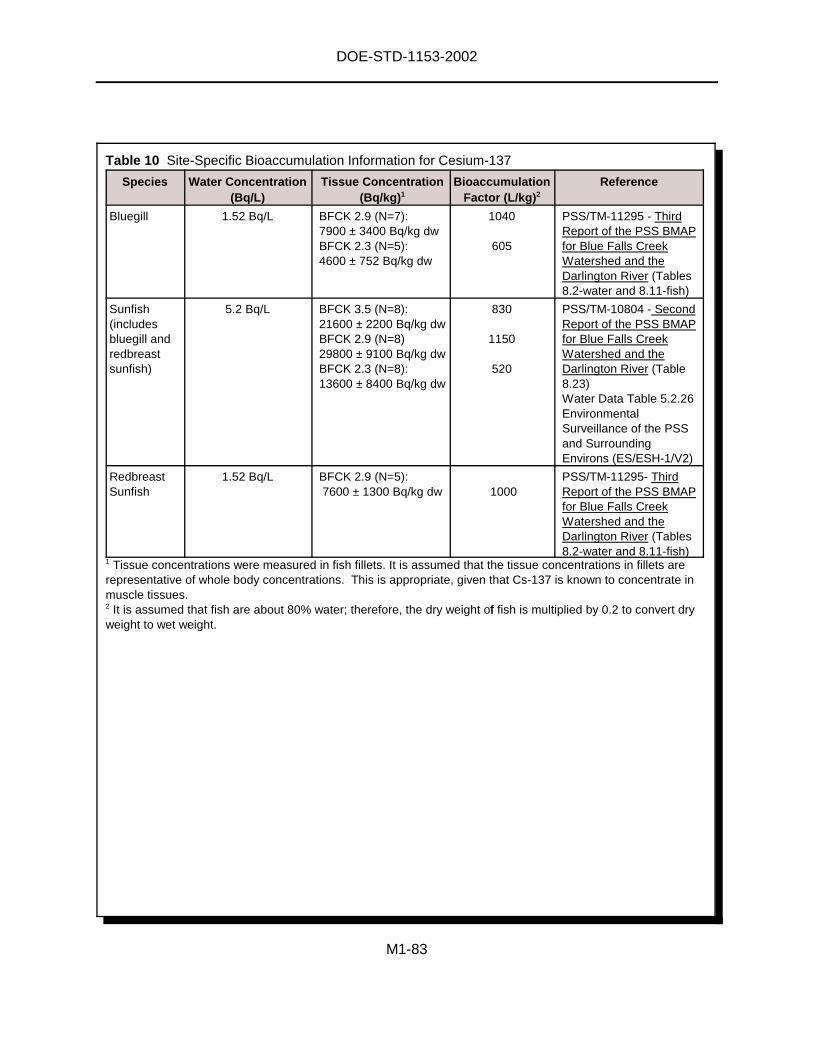
DOE-STD-1153-2002
M1-83
Table 10 Site-Specific Bioaccumulation Information for Cesium-137
Species Water Concentration(Bq/L)
Tissue Concentration(Bq/kg)1
BioaccumulationFactor (L/kg)2
Reference
Bluegill 1.52 Bq/L BFCK 2.9 (N=7):7900 ± 3400 Bq/kg dwBFCK 2.3 (N=5):4600 ± 752 Bq/kg dw
1040
605
PSS/TM-11295 - ThirdReport of the PSS BMAPfor Blue Falls CreekWatershed and theDarlington River (Tables8.2-water and 8.11-fish)
Sunfish(includesbluegill andredbreastsunfish)
5.2 Bq/L BFCK 3.5 (N=8):21600 ± 2200 Bq/kg dwBFCK 2.9 (N=8)29800 ± 9100 Bq/kg dwBFCK 2.3 (N=8):13600 ± 8400 Bq/kg dw
830
1150
520
PSS/TM-10804 - SecondReport of the PSS BMAPfor Blue Falls CreekWatershed and theDarlington River (Table8.23)Water Data Table 5.2.26EnvironmentalSurveillance of the PSSand SurroundingEnvirons (ES/ESH-1/V2)
RedbreastSunfish
1.52 Bq/L BFCK 2.9 (N=5):7600 ± 1300 Bq/kg dw 1000
PSS/TM-11295- ThirdReport of the PSS BMAPfor Blue Falls CreekWatershed and theDarlington River (Tables8.2-water and 8.11-fish)
1 Tissue concentrations were measured in fish fillets. It is assumed that the tissue concentrations in fillets arerepresentative of whole body concentrations. This is appropriate, given that Cs-137 is known to concentrate inmuscle tissues.2 It is assumed that fish are about 80% water; therefore, the dry weight off fish is multiplied by 0.2 to convert dryweight to wet weight.
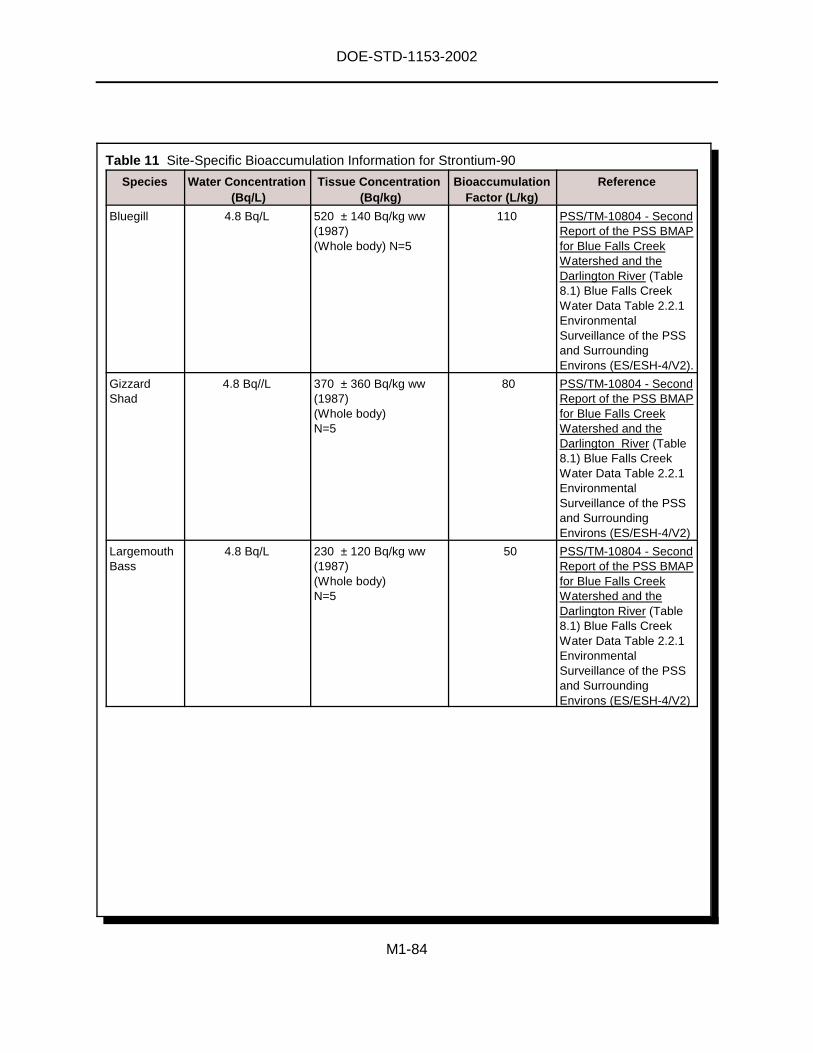
DOE-STD-1153-2002
M1-84
Table 11 Site-Specific Bioaccumulation Information for Strontium-90
Species Water Concentration(Bq/L)
Tissue Concentration(Bq/kg)
BioaccumulationFactor (L/kg)
Reference
Bluegill 4.8 Bq/L 520 ± 140 Bq/kg ww(1987)(Whole body) N=5
110 PSS/TM-10804 - SecondReport of the PSS BMAPfor Blue Falls CreekWatershed and theDarlington River (Table8.1) Blue Falls CreekWater Data Table 2.2.1EnvironmentalSurveillance of the PSSand SurroundingEnvirons (ES/ESH-4/V2).
GizzardShad
4.8 Bq//L 370 ± 360 Bq/kg ww(1987)(Whole body)N=5
80 PSS/TM-10804 - SecondReport of the PSS BMAPfor Blue Falls CreekWatershed and theDarlington River (Table8.1) Blue Falls CreekWater Data Table 2.2.1EnvironmentalSurveillance of the PSSand SurroundingEnvirons (ES/ESH-4/V2)
LargemouthBass
4.8 Bq/L 230 ± 120 Bq/kg ww(1987)(Whole body)N=5
50 PSS/TM-10804 - SecondReport of the PSS BMAPfor Blue Falls CreekWatershed and theDarlington River (Table8.1) Blue Falls CreekWater Data Table 2.2.1EnvironmentalSurveillance of the PSSand SurroundingEnvirons (ES/ESH-4/V2)
DOE-STD-1153-2002
M1-85
B. Modification of Default Biv Values for Organisms Consumed by the Limiting Organism
The Aquatic Animal Spreadsheet within the RAD-BCG Calculator was accessed and the default Biv
values for Cs-137 and Sr-90 were reviewed. Based on literature reviews, calculated values (Table10 and Table 11), and consultations with the aquatic specialists, the following site-specific Bivs forfish were selected:
Cs-137: 1150 (L/kg). Most conservative estimated bioaccumulation factor for fishcollected at or near the sampling location (BFCK 2.9).
Sr-90: 110 (L/kg). Most conservative estimated bioaccumulation factor for fish collected on thePoplar Springs Site.
Enter Site-Representative Parameter Values into the RAD-BCG Calculator
First, the “allometric BCGs” button on the Riparian Animal Spreadsheet of the RAD-BCG Calculatorwas selected. This selection allowed the calculation of BCGs using the kinetic/allometric method.Then, the Aquatic Animal Spreadsheet of the RAD-BCG Calculator was accessed, and the defaultBiv values for Cs-137 and Sr-90 were replaced by entering the site-specific Biv values listed above.A “user supplied value” message appeared in the Aquatic Animal Spreadsheet to provide areminder that default values had been modified. The BCGs for Cs-137 and Sr-90 wereautomatically updated within the RAD-BCG Calculator to reflect these site-specific input values. Thesite-specific BCGs for these two radionuclides were shown in the Riparian Animal Spreadsheet, andin the Aquatic System Data Entry/BCG Worksheet - where our mean measured radionuclideconcentration data was previously entered. A new partial and total sum of fractions wereautomatically calculated by the RAD-BCG Calculator.
Compare Measured Radionuclide Concentrations in Environmental Media with BCGs
Due to the adjustment of the Cesium-137 Biv to 1150 and the Sr-90 Biv to 110, the total sum offractions for Blue Falls Creek was less than 1.0, indicating that we passed the site-specific analysis.
It is also noteworthy that - had we used the site-specific food source Biv values compared withmaximum measured radionuclide concentration data rather than mean values, the total sum offractions for our riparian animal would also have passed. This would be a useful approach if wewere required by regulators or stakeholders to use only maximum measured radionuclideconcentrations in our evaluation. This point highlights one example regarding the flexibility of thegraded approach.
DOE-STD-1153-2002
M1-86
5. Documentation of Results
The results of the biota dose evaluation were summarized. A summary report containing computerscreen printouts of the spreadsheets from the RAD-BCG Calculator were retained on file for futurereference. The rationale for selecting site-representative Bivs as a food source value to a ripariananimal was documented. As required by EH, a summary of the evaluation was included in thePoplar Springs Site’s Annual Site Environmental Report.
6. Lessons Learned
• Possible future activities could include: (1) assessing the need for additional sampling locations;(2) collecting co-located sediment and water samples for these and other locations; (3)collecting representative receptors and analyzing tissue data to permit a direct and more realisticdose evaluation.