module 1 overview: how does our electric system work? · pdf fileoverview: how does our...
TRANSCRIPT
The Regulatory Assistance Project 50 State Street, Suite 3 Montpelier, VT 05602
Phone: 802-223-8199 web: www.raponline.org
Module 1 Overview: How Does Our Electric
System Work?
August 15, 2011
Presented by Ken Colburn, Christopher James, and John Shenot
Electric Energy Training for Air Regulatory & Planning Staff
US EPA OAQPS – August 15-16, 2011

Disclaimer
Presentations by non-EPA employees do not imply any official EPA endorsement of, or responsibility for, the opinions, ideas, data or products presented, or guarantee the validity of the information provided. Presentations by non-EPA employees are provided solely as information on topics related to environmental protection that may be useful to EPA staff and the public.
2

U.S. Energy Sources Overall
3

U.S. Electricity-Only
• Coal and nuclear share ~double
• “Supply-Side” Resources – i.e., supply power to the grid
to meet demand
– Fossil (coal, natural gas, oil)
– Nuclear
– Renewable (hydro, wind, solar, etc.)
4

Electric System Fundamentals (1)
• Today, most electricity is generated by combustion of fuels to produce steam or exhaust which in turn drives a turbine.
• This combustion process emits criteria and toxic air pollutants and greenhouse gases (GHG).
5
6

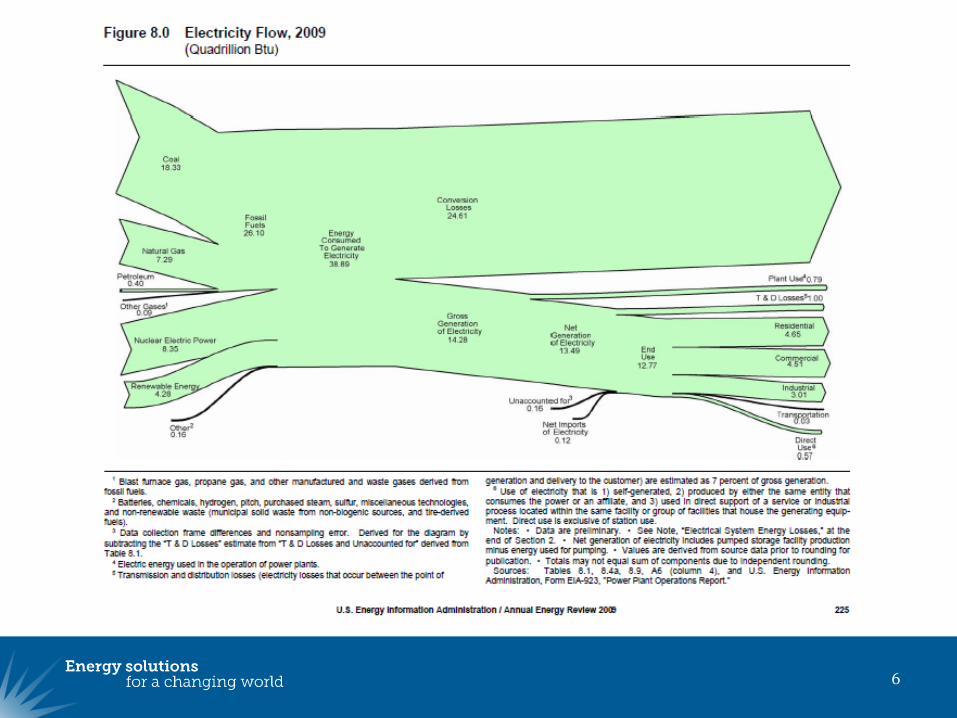
EIA Electricity Flow Diagram
7
(Quads, 1999)

Electric System Fundamentals (2)
• Electricity demand (“load”) must be dynamically balanced with supply
– Electricity can‟t be stored in volume • Minor exceptions (e.g., pumped storage)
– Every time a light, motor, or machine is turned on, its load must be satisfied by a power plant
– Creates “peak load” capacity problems • Accompanying cost peaks, pollution peaks
– Worse, peak load in U.S. growing faster than baseload, driven by air conditioning, especially homes
8

Electric System Fundamentals (2)
• Dynamic balancing historically achieved by intensive management of supply-side resources – Reserve capacity, spinning reserves, etc.
– Instantaneous balancing through frequency regulation
• Increasingly addressed by “Demand-Side” measures: – Energy Efficiency - Usually reduces load permanently
– “Demand Response” (DR) – Usually temporary load
curtailment
9

10

Electric System Fundamentals (3)
• Power plants can be close to the electrical loads they serve, but are often tens or hundreds of miles away.
11

Source: EIA, National Energy Education Development Project
http://www.eia.gov/energyexplained/index.cfm?page=electricity_delivery
12

Electric System Fundamentals
• Transmission & Distribution (T&D) electric grid systems:
– Impose T&D costs ($20-$30/MWH)
– Impact reliability (i.e., imposes storm and other risks, requires maintenance, etc.)
– Require additional generation due to “line losses” averaging at least 6-7%
13

Average Line Loss Components
14
Source: ConEd
Marginal Energy Losses are Greater
15
0
0.2
0.4
0.6
0.8
1
1.2
1 2 3 4 5 6 7 8 9 10
Load Level (MVA)
Lo
ss
es
(M
VA
)
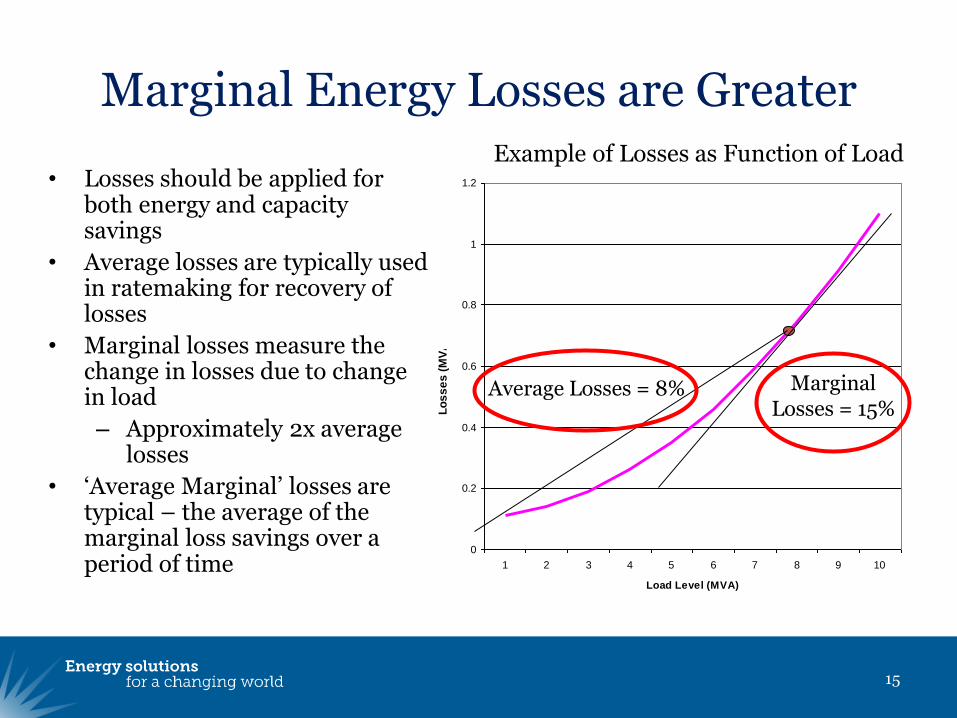
• Losses should be applied for both energy and capacity savings
• Average losses are typically used in ratemaking for recovery of losses
• Marginal losses measure the change in losses due to change in load
– Approximately 2x average losses
• „Average Marginal‟ losses are typical – the average of the marginal loss savings over a period of time
Average Losses = 8% Marginal Losses = 15%
Example of Losses as Function of Load
Electric System Fundamentals (4)
• Electricity‟s Holy Grail: “Reliability”
• Analogous to “attainment of NAAQS” for air regulators
• Reliability means:
1. Adequate generation capacity to meet peak load plus a margin of safety; and
2. Reliable means to deliver it (T&D)
16
17
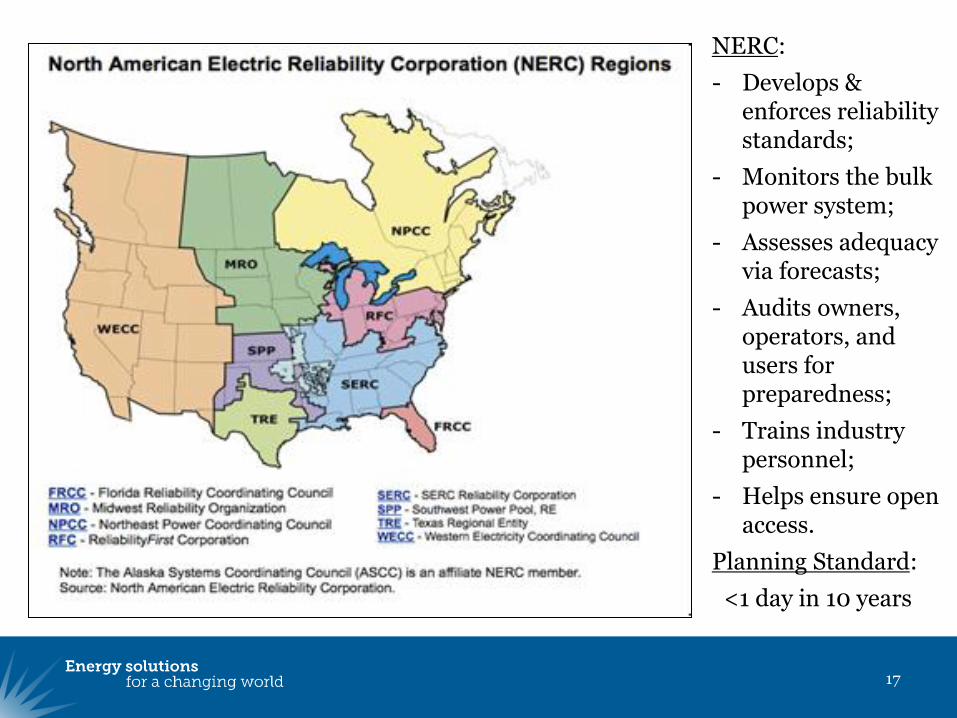
NERC:
- Develops & enforces reliability standards;
- Monitors the bulk power system;
- Assesses adequacy via forecasts;
- Audits owners, operators, and users for preparedness;
- Trains industry personnel;
- Helps ensure open access.
Planning Standard:
<1 day in 10 years
18
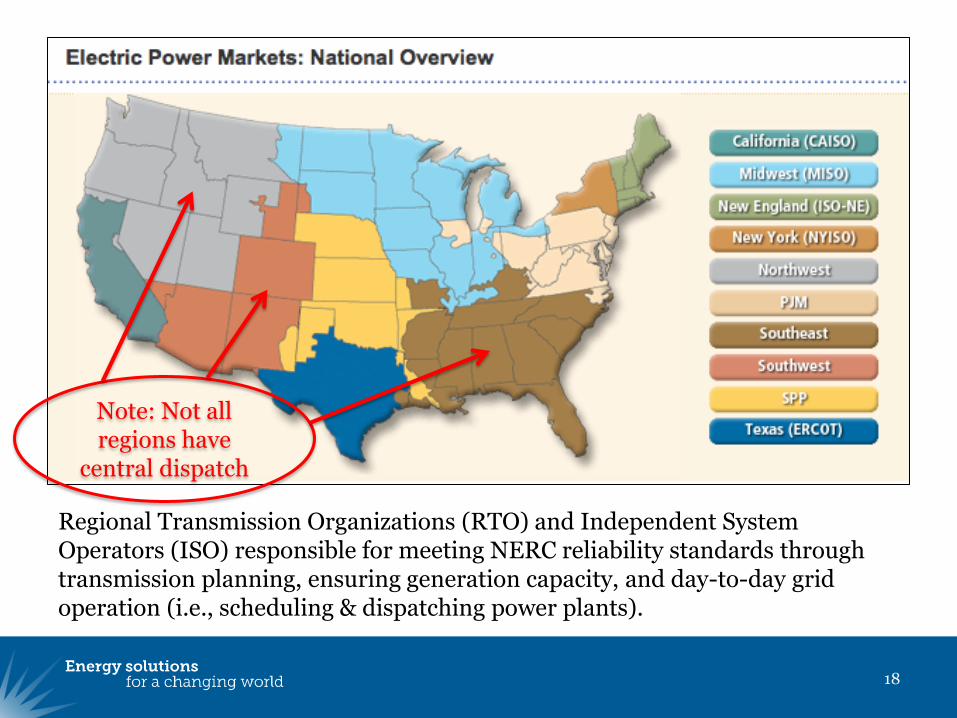
Regional Transmission Organizations (RTO) and Independent System Operators (ISO) responsible for meeting NERC reliability standards through transmission planning, ensuring generation capacity, and day-to-day grid operation (i.e., scheduling & dispatching power plants).
Note: Not all regions have
central dispatch
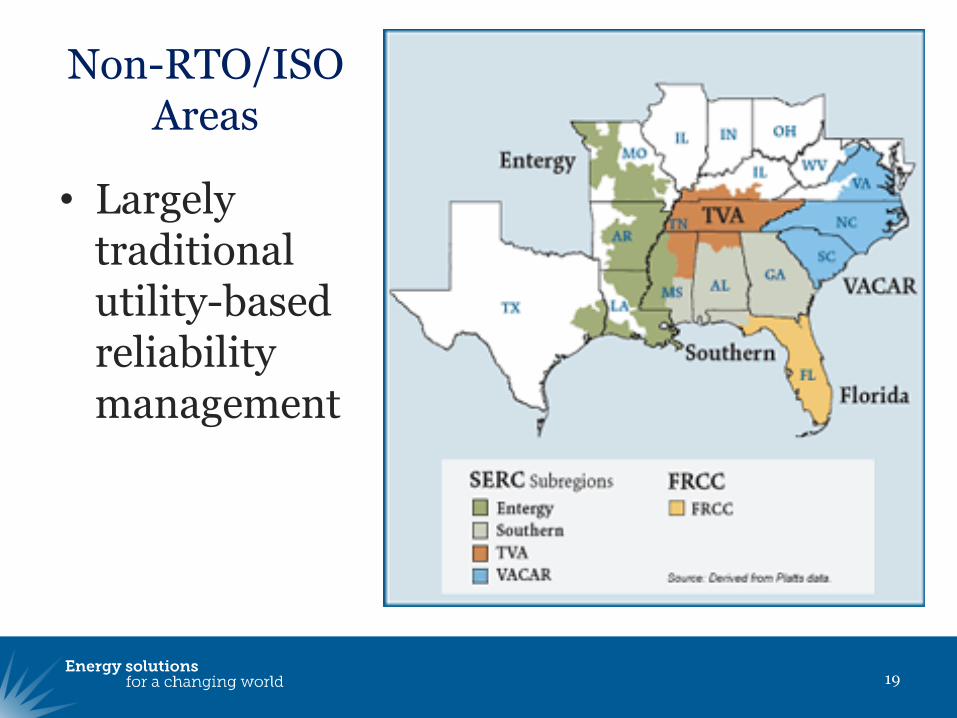
Non-RTO/ISO Areas
• Largely traditional utility-based reliability management
19

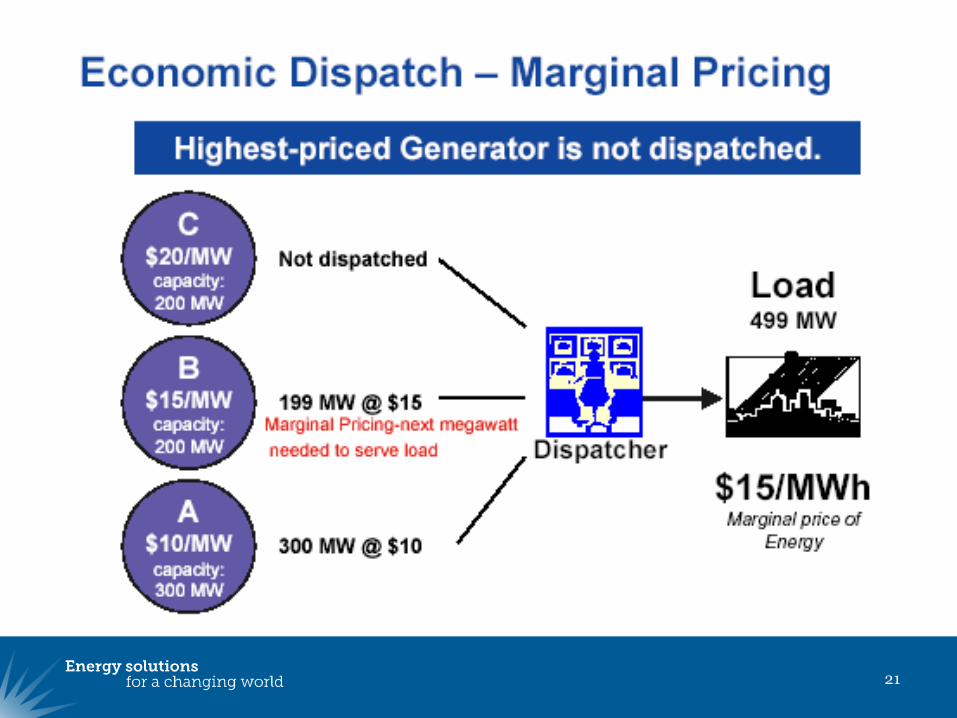
Market Clearing Prices & Economic Dispatch
• The bid price of the marginal unit necessary to satisfy the last bit of load is paid to all generators
• Avoids turmoil due to gaming, but…
• Small load changes at the margin, especially near peak loads, create very large cost differences
• System arguably benefits old, low-cost, high-emitting units
• Opportunity: “Demand Reduction Induced Price Effect” (DRIPE)
20
21

22
501 MW

0
5000
10000
15000
20000
25000
30000
8/6/01 8/7/01 8/8/01 8/9/01 8/10/01
MW
ISO-NE Load
(Source: www.iso-ne.com)
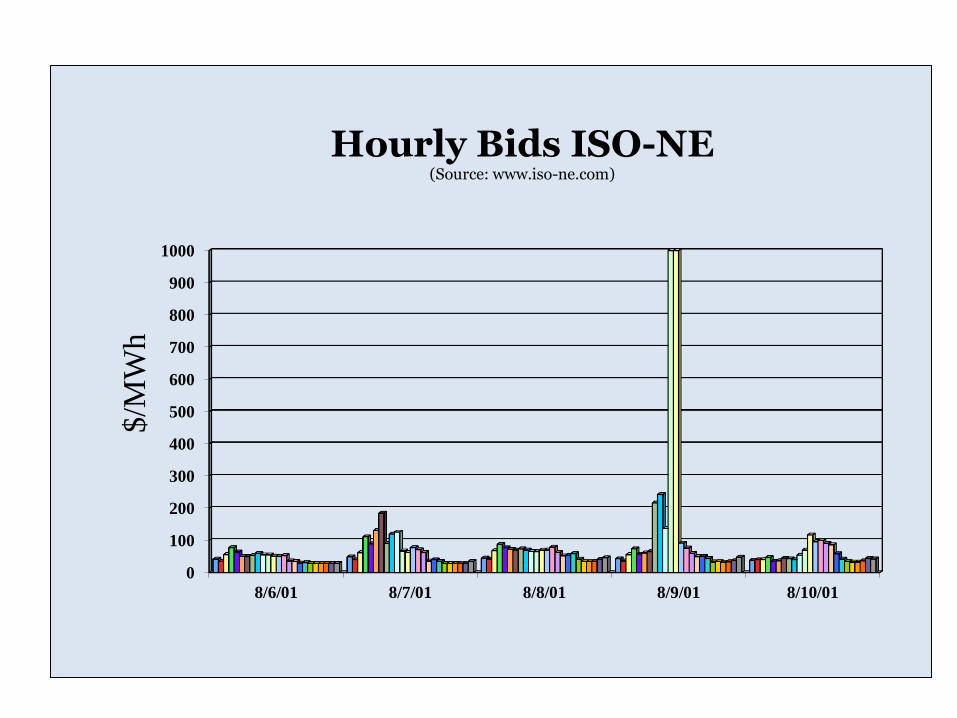
0
100
200
300
400
500
600
700
800
900
1000
8/6/01 8/7/01 8/8/01 8/9/01 8/10/01
$/M
Wh
Hourly Bids ISO-NE
(Source: www.iso-ne.com)
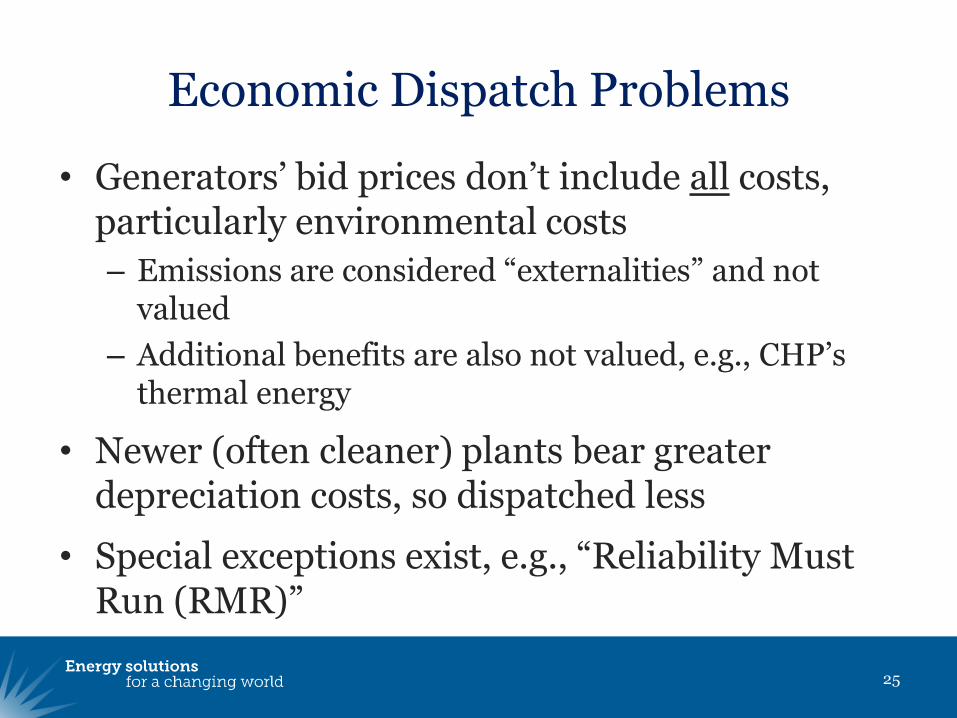
Economic Dispatch Problems
• Generators‟ bid prices don‟t include all costs, particularly environmental costs
– Emissions are considered “externalities” and not valued
– Additional benefits are also not valued, e.g., CHP‟s thermal energy
• Newer (often cleaner) plants bear greater depreciation costs, so dispatched less
• Special exceptions exist, e.g., “Reliability Must Run (RMR)”
25

Economic Dispatch Opportunities
• Some states have adopted preferential “loading order” requirements
– e.g., efficiency 1st , renewables 2nd , etc.
– China is using “Efficiency Power Plants” in at least 5 provinces
• “Environmental dispatch”
– In RAP terms, “Clean First”
– China has implemented environmental dispatch using grid-telemetered CEMS-based SO2 data
26

Electricity Rates (Prices) vs. Bills
• Public/political attention had been trained to focus on electric “rates” or “electricity prices,” but…
• Customers pay “bills,” not rates!
27

0%
10%
20%
30%
40%
50%
60%
70%
80%
90%
100%
28
In general, higher electricity prices
In general, lower electricity prices
Electricity Prices Generally Lower in Coal Country
% of Coal in Electric Mix

29
Retail Sales of Electricity per Dollar of GSP
0.0
0.1
0.2
0.3
0.4
0.5
0.6
0.7
0.8
WY
WV
KY
MS
AL
SC
AR
MT
LA
OK ID ND IN TN
MO
NE
OH IA GA
KS
NC
TX FL
AZ
SD
NM
WI
NV
VA
PA
OR
WA
MI
US
UT
MN
ME
MD IL VT
CO
DE
NH
AK HI
NJ
RI
MA
CT
CA
DC
NY
Kw
h p
er
Ch
ain
ed
(2
00
0)
Do
lla
r
30
0.00
2.00
4.00
6.00
8.00
10.00
12.00
14.00
16.00
18.00
20.00
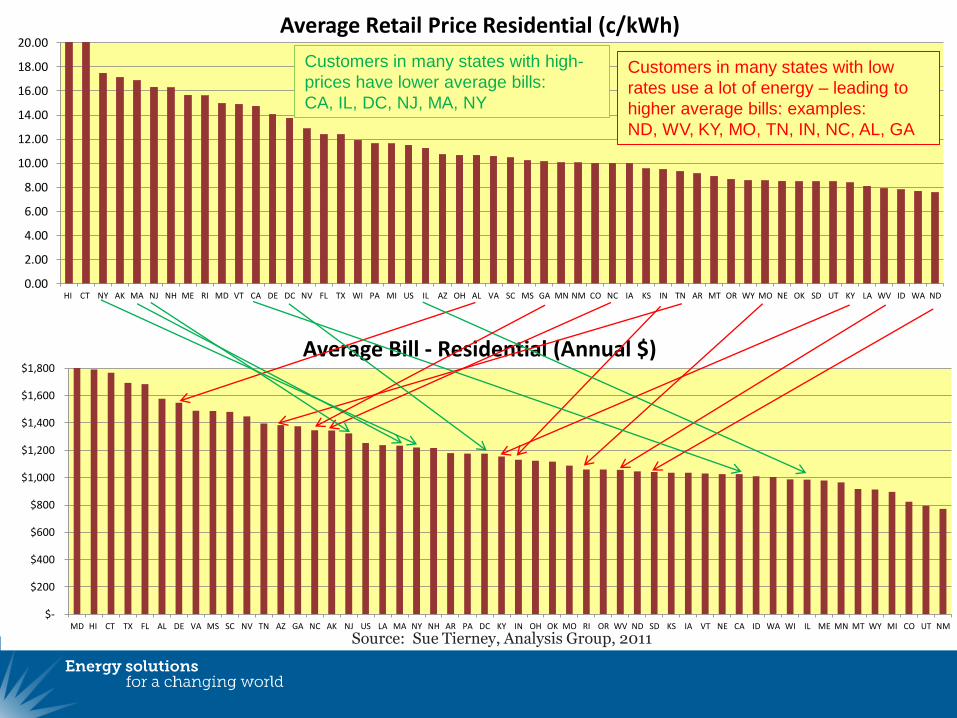
HI CT NY AK MA NJ NH ME RI MD VT CA DE DC NV FL TX WI PA MI US IL AZ OH AL VA SC MS GA MN NM CO NC IA KS IN TN AR MT OR WY MO NE OK SD UT KY LA WV ID WA ND
Average Retail Price Residential (c/kWh)
$-
$200
$400
$600
$800
$1,000
$1,200
$1,400
$1,600
$1,800
MD HI CT TX FL AL DE VA MS SC NV TN AZ GA NC AK NJ US LA MA NY NH AR PA DC KY IN OH OK MO RI OR WV ND SD KS IA VT NE CA ID WA WI IL ME MN MT WY MI CO UT NM
Average Bill - Residential (Annual $)
Customers in many states with low
rates use a lot of energy – leading to
higher average bills: examples:
ND, WV, KY, MO, TN, IN, NC, AL, GA
Customers in many states with high-
prices have lower average bills:
CA, IL, DC, NJ, MA, NY
Source: Sue Tierney, Analysis Group, 2011

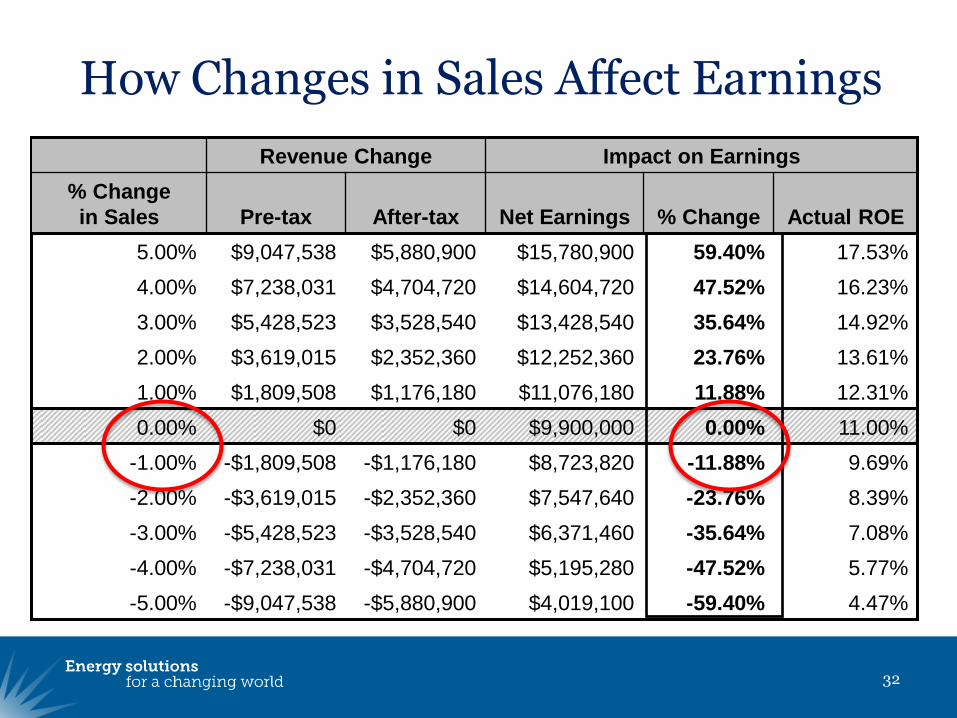
Revenue Decoupling
• Rates are normally set based on sales volumes and provide the revenue needed to cover costs plus a reasonable rate of return. If actual sales are higher or lower, rates are not adjusted in most cases.
– Creates a “throughput incentive”
• Decoupling separates a utility‟s fixed cost recovery from the amount of electricity it sells.
– Utilities are protected from sales declines due to efficiency, so are more likely to invest it (or less likely to resist)
31
32
12.31% 11.88% $11,076,180 $1,176,180 $1,809,508 1.00%
13.61% 23.76% $12,252,360 $2,352,360 $3,619,015 2.00%
14.92% 35.64% $13,428,540 $3,528,540 $5,428,523 3.00%
16.23% 47.52% $14,604,720 $4,704,720 $7,238,031 4.00%
17.53% 59.40% $15,780,900 $5,880,900 $9,047,538 5.00%
11.00% 0.00% $9,900,000 $0 $0 0.00%
4.47% -59.40% $4,019,100 -$5,880,900 -$9,047,538 -5.00%
5.77% -47.52% $5,195,280 -$4,704,720 -$7,238,031 -4.00%
7.08% -35.64% $6,371,460 -$3,528,540 -$5,428,523 -3.00%
8.39% -23.76% $7,547,640 -$2,352,360 -$3,619,015 -2.00%
9.69% -11.88% $8,723,820 -$1,176,180 -$1,809,508 -1.00%
Actual ROE % Change Net Earnings After-tax Pre-tax
% Change
in Sales
Impact on Earnings Revenue Change
How Changes in Sales Affect Earnings

33

Utility Restructuring or Deregulation
• THEN: Central generating stations and T&D systems (poles & wires) were “natural monopolies,” thus regulated
• NOW: New options for electric generation (financial, technological, operational) enable “merchant generation” – generation is no longer a “natural monopoly” and should be a competitive market
– And retail choice enables customers to “shop” for generation
• T&D is still a natural monopoly, so “wire companies” remain regulated
• DG threatens more, faster change
34

35
MT
WY
ID
WA
OR
NV
UT
CA
AZ
ND
SD
NE
CO
NM
TX
OK
KS
AR
LA
MO
IA
MN
WI
IL IN
KY
TN
MS AL GA
FL
SC
NC
VA WV
OH
MI
NY
PA
MD
DE
NJ
CT RI
MA
ME
VT
NH
AK
HI
States with Restructured Retail Electric Markets
States that
suspended
restructuring
– and still
have some
residual
customer
choice and
competitive
retail supply.
States that
restructured
their electric
industry
Restructured states as share of U.S.:
= 34% of residential MWh sales
= 38% of commercial sales Source: EIA, as of September 2010.

Some Impacts of Deregulation
• Utility “Integrated Resource Planning” (IRP) often abolished or weakened
• System benefits charge (SBC) for EE, low-income aid, etc. weakened or restructured
• No automatic recovery of pollution control costs
• New approaches were needed to ensure “resource adequacy” or “capacity”
36

Future of Deregulation?
• Progress came to a halt with California‟s 2000-2001 experience
– Poor policy design, plus Enron‟s “market manipulation”
• Technological, financial pressure building for further progress
37

Federal & State Roles (1)
“Electricity is a political issue the world over, but especially so in _[nation]_. The debate over reform pits the central government against regional governors. Although _[nation]_ controls wholesale electricity tariffs, the governors control retail prices. They are adamant about keeping this power so they can protect industries to which they have ties. Moreover, they are determined to maintain low electricity prices for households, …
38
… which pay about $2 a month to keep their lights on, roughly the price of a cheap bottle of vodka.”
Source: RFF, Brennan, April 2003, citing The Economist, Aug. 31, 2002.

Federal & State Roles (2)
• Federal Energy Regulatory Commission
– Wholesale electricity markets, i.e., interstate transmission, market design, pricing, etc.
– Some authority (as yet largely unexercised) over transmission siting
– Groundbreakers: • 1996 Order 888 (open access)
• 1999 Order 2000 (RTOs)
• 2011 Order 1000 (include “policy considerations” in planning)
39
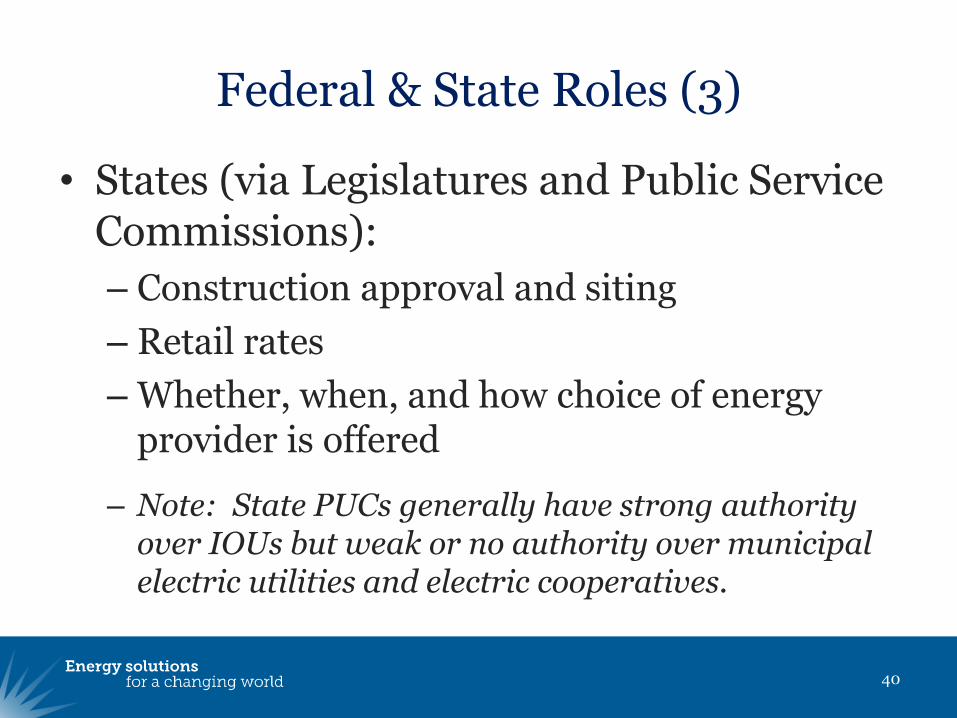
Federal & State Roles (3)
• States (via Legislatures and Public Service Commissions):
– Construction approval and siting
– Retail rates
– Whether, when, and how choice of energy provider is offered
– Note: State PUCs generally have strong authority over IOUs but weak or no authority over municipal electric utilities and electric cooperatives.
40

Federal & State Roles (4)
• Note key differences in fed vs. state; energy vs. environment
– Environment (AQ) – Strong federal oversight
• Federal (EPA) delegation; within federal law & regs; subject to review & approval (SIPs)
– Energy – Complete freedom at retail
• History of state initiative/leadership
• EE, RE (RPS), siting, etc.
41

Agency Roles & Operation
• PSCs: – Formal, quasi-judicial docket processes
• DEPs: – Delegated authority (primarily) – Notice-and-comment rulemaking
• SEOs: – Typically non-regulatory; “everything else” – Key implementing arms (e.g., ARRA); lead-by-
example; research, review, and report issues & opportunities; assist economic development
42

What‟s the “Take Home” Message for AQ? (1)
43
• Peak AQ concerns (O3) coincide with peak power days
• On the margin at peak: – Generation to meet load: 1.00 – Line losses (@ ~1.5x): up to 0.20 – Generation efficiency loss: 0.03 – Capacity: 0.20
• ~1.5 EGUs operating to deliver 1.0 of power
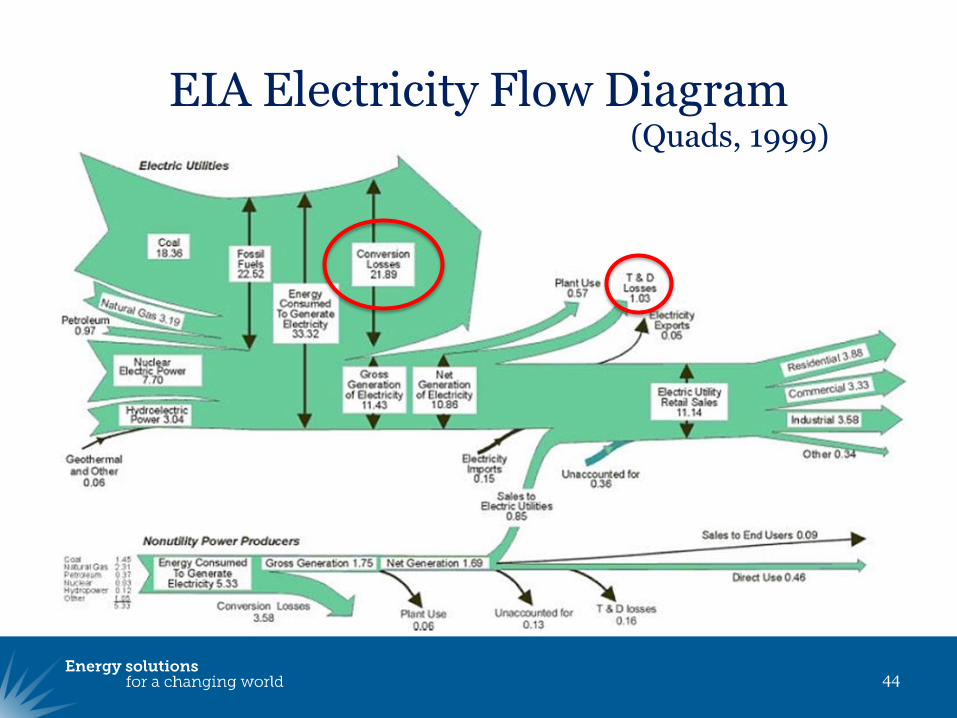
EIA Electricity Flow Diagram
44
(Quads, 1999)
What‟s the “Take Home” Message for AQ? (2)
45
• ~1.5 EGUs => 4.5 (3x) emissions due to conversion losses
• Plus, meeting peak load requires that higher-emitting EGUs run…

46
+7.5% MW = +53% NOx

47
Is there any question why it’s important for EPA and
the states to encourage EE/RE/DR in environmental
& energy regulation?
(and we haven’t even touched on savings, jobs, competitiveness or
security benefits yet…)
Question & Answer Period
• Thank You!
48
About RAP
The Regulatory Assistance Project (RAP) is a global, non-profit team of experts that focuses on the long-term economic and environmental sustainability of the power and natural gas sectors. RAP has deep expertise in regulatory and market policies that:
Promote economic efficiency Protect the environment Ensure system reliability Allocate system benefits fairly among all consumers
Learn more about RAP at www.raponline.org
Ken Colburn, Senior Associate
617-784-6975

50

Additional Slides
51

“BHAG” vs. the Cost of Saved Energy
52