modulation of gut microbiota dysbioses in type 2 diabetic patients by macrobiotic … · modulation...
TRANSCRIPT

Modulation of gut microbiota dysbioses in type 2 diabetic patientsby macrobiotic Ma-Pi 2 diet
Marco Candela1*, Elena Biagi1, Matteo Soverini1, Clarissa Consolandi2, Sara Quercia1, Marco Severgnini2,Clelia Peano2, Silvia Turroni1, Simone Rampelli1, Paolo Pozzilli3, Mario Pianesi4, Francesco Fallucca5 andPatrizia Brigidi1
1Department of Pharmacy and Biotechnology, University of Bologna, 40126 Bologna, Italy2Institute of Biomedical Technologies, Italian National Research Council, 20090 Segrate, Milan, Italy3Department of Endocrinology and Diabetes, University Campus Bio-Medico, 00128 Rome, Italy4International Study Center for Environment, Agriculture, Food, Health and Economics, 62029 Tolentino, Italy5In Unam Sapientiam, La Sapienza University, 00161 Rome, Italy
(Submitted 7 October 2015 – Final revision received 4 February 2016 – Accepted 17 February 2016 – First published online 6 May 2016)
AbstractThe gut microbiota exerts a role in type 2 diabetes (T2D), and deviations from a mutualistic ecosystem layout are considered a keyenvironmental factor contributing to the disease. Thus, the possibility of improving metabolic control in T2D by correcting gut microbiomedysbioses through diet has been evaluated. Here, we explore the potential of two different energy-restricted dietary approaches – thefibre-rich macrobiotic Ma-Pi 2 diet or a control diet recommended by Italian professional societies for T2D treatment – to correct gutmicrobiota dysbioses in T2D patients. In a previous 21-d open-label MADIAB trial, fifty-six overweight T2D patients were randomised to theMa-Pi 2 or the control diet. For the present study, stools were collected before and after intervention from a subset of forty MADIABparticipants, allowing us to characterise the gut microbiota by 16S rRNA sequencing and imputed metagenomics. To highlight microbiotadysbioses in T2D, the gut microbiota of thirteen normal-weight healthy controls were characterised. According to our findings, both diets wereeffective in modulating gut microbiome dysbioses in T2D, resulting in an increase of the ecosystem diversity and supporting the recovery ofa balanced community of health-promoting SCFA producers, such as Faecalibacterium, Roseburia, Lachnospira, Bacteroides andAkkermansia. The Ma-Pi 2 diet, but not the control diet, was also effective in counteracting the increase of possible pro-inflammatory groups,such as Collinsella and Streptococcus, in the gut ecosystem, showing the potential to reverse pro-inflammatory dysbioses in T2D, and possiblyexplaining the greater efficacy in improving the metabolic control.
Key words: Type 2 diabetes: Gut microbiota: Dysbiosis: Fibre-rich diets: Macrobiotic diets
Type 2 diabetes (T2D) is markedly increasing its prevalence inWesternised countries(1), and it represents a challenging problemfor national healthcare systems(2). Recent insights providedevidence of an altered gut microbiota (GM) in T2D subjects,suggesting a possible role for gut micro-organisms in the diseaseonset(3–7).Intestinal micro-organisms, and their metabolic products,
have been shown to exert relevant functions in regulating hostmetabolic pathways(8). Indeed, GM components can modulatedifferent factors contributing to the host metabolic phenotype,such as intestinal gluconeogenesis, insulin sensitivity, lipidaccumulation and glucose control(9,10). Although a mutualisticGM composition is crucial to support the host energyhomeostasis, certain GM dysbioses can result in profoundderegulations of the host metabolism, supporting the onset
and consolidation of metabolic diseases, such as T2D(11,12).Moreover, a pro-inflammatory layout of the gut microbialecosystem has been suggested to be the basis of chronicinflammatory processes observed in T2D, and the new conceptof metabolic infection has been proposed(13,14). As a resultof an increased gut permeability, endotoxins from pro-inflammatory GM components can penetrate the epithelialbarrier and aggravate metabolic inflammation and insulinresistance in T2D(15). Thus, the GM has the potential to exerta multifactorial role in T2D, and deviations from a health-promoting GM composition could represent a key determinantcontributing to the disease onset(11,16–18). As diet has beenrecognised as a potent modulator of the composition andmetabolism of the human GM(19), the possibility to improvemetabolic control in T2D by developing selective diets
Abbreviations: CTR, control diet; FBG, fasting blood glucose; GM, gut microbiota; KO, KEGG Orthology; PCoA, principal coordinates analysis; T2D, type 2 diabetes.
* Corresponding author: M. Candela, fax +39 051 2099734, email [email protected]
British Journal of Nutrition (2016), 116, 80–93 doi:10.1017/S0007114516001045© The Authors 2016. This is an Open Access article, distributed under the terms of the CreativeCommons Attribution licence (http://creativecommons.org/licenses/by/4.0/), which permits unrestricted re-use,distribution, and reproduction in any medium, provided the original work is properly cited.
Dow
nloaded from https://w
ww
.cambridge.org/core . IP address: 54.39.106.173 , on 01 Feb 2020 at 07:50:32 , subject to the Cam
bridge Core terms of use, available at https://w
ww
.cambridge.org/core/term
s . https://doi.org/10.1017/S0007114516001045

that are able to correct the GM dysbioses has beenconsidered(11,16,20).Very recently, the Ma-Pi 2 macrobiotic diet has been reported to
be more effective than a control (CTR) diet, which is based on thedietary guidelines recommended by professional societies in Italy,for the improvement of metabolic control in T2D patients(21).Conceived by Mario Pianesi, the Ma-Pi 2 diet is a fibre-richmacrobiotic diet with a prebiotic potential, which is in line withthe dietary recommendations of the Academy of Nutrition andDietetics(22). Specifically, the Ma-Pi 2 diet is enriched in complexcarbohydrates, legumes, fermented products, sea salt and green tea,and it excludes fat and protein from animal source and addedsugars. In a 21-d controlled open-label trial (MADIAB trial), fifty-sixoverweight T2D patients were randomised (1:1 ratio) to the Ma-Pi 2macrobiotic diet or the CTR diet. At the end of this short-termnutritional intervention, the Ma-Pi 2 macrobiotic diet proved to bemore effective in reducing fasting and postprandial blood glucose,glycated Hb (HbA1c), serum cholesterol, homeostasis modelassessment of insulin resistance (HOMA-IR), BMI and waist and hipcircumferences compared with the CTR diet(21). According to theauthors, the greater effect of the high-fibre Ma-Pi 2 diet on severalmetabolic parameters of T2D patients was probably because of, atleast in part, an inherent capability of favouring the recovery of amutualistic GM layout. To verify this hypothesis, in this study, wespecifically compared the efficacy of the Ma-Pi 2 and the CTR diet inmodulating GM dysbioses in a subset of forty overweight T2Dpatients participating in the MADIAB trial, for whom stools weresuccessfully collected before and after intervention. To this aim,stools were analysed for the microbiota composition by next-generation sequencing (NGS) of the 16S rRNA gene and imputedmetagenomics. To provide a picture of the baseline GM dysbiosesin the enrolled T2D patients, their microbiota profiles werecompared with those of thirteen normal-weight healthy controls.Our findings suggest that the Ma-Pi 2 diet has the potential toreverse compositional and functional GM dysbioses in T2D,favouring the recovery of a mutualistic configuration capable ofsupporting the host energy homeostasis.
Methods
Study design
The design of the MADIAB trial is described in Soare et al.(21).Briefly, it was designed as a 21-d controlled open-label trial, inwhich the participants were assigned (1:1) to the Ma-Pi 2macrobiotic diet or a CTR diet based on the dietary guidelinesfor T2D recommended by professional societies in Italy. Thetrial was conducted in accordance with the Declaration ofHelsinki and the Good Clinical Practice guidelines, and thestudy was approved by the Institutional Review Board ofUniversity Campus Bio-Medico (trial registration numberISRCTN10467793; http://www.isrctn.com/ISRCTN10467793).Written informed consent was obtained from all subjects/patients. The Department of Endocrinology and Diabetesof the University Campus Bio-Medico in Rome (Italy) recruitedoverweight or obese (BMI 27–45 kg/m2) subjects, aged40–77 years and affected by T2D (Table 1). Associatedmetabolic syndrome was evaluated according to the National
Cholesterol Education Program Adult Treatment Panel IIIcriteria, although it was not an inclusion criterion. Inclusioncriteria were as follows: T2D diagnosed at least 1 year beforethe start of the trial, treated exclusively with dietary interven-tion, oral hypoglycaemic drugs or both for 6 months beforestudy entry. Exclusion criteria were as follows: the use of insulineither at present or at any time in the 2 year before the study,current use of corticosteroid therapy or any other drug that caninterfere with carbohydrate metabolism, alcohol abuse andpregnancy. Subjects who already followed a macrobioticdiet were excluded from the study. Participants’ eating habitsconcerning the period antecedent the study start were assessedusing qualitative and quantitative questionnaires (onlineSupplementary Table S1). Eligible T2D subjects were dividedinto two groups according to the diet randomly assigned(twenty-eight participants were randomised to the Ma-Pi 2diet and twenty-eight to the CTR diet), and they wereaccommodated in two different hotels, which were locatedclose to each other. Randomisation was stratified by BMI atbaseline and by sex.
Stratified random sampling was used to ensure that thegroups contained similar numbers of patients with BMI≥ 35·0kg/m2 (the median in the cohort of eligible patients) and similarnumber of male patients. The menus were designed as a 2-ddiet repeated cyclically along the whole duration of the study.Both diets were energy intake restricted to 7949 kJ (1900 kcal)for men and 7113 kJ (1700 kcal) for women (online Supple-mentary Table S2). In particular, the CTR diet derivedenergy from 40–60% carbohydrate, 10–20% protein, 30% fatand ≥20 g/4184 kJ (1000 kcal) fibre. It was adapted to theMediterranean culinary style. Vegetables, fruit, cereal, fish andwhite meat typical of the Mediterranean style were used;alcohol and sucrose consumption was forbidden. Diet mealplans and recipes are described in the Additional File 1 of thestudy by Soare et al.(21). Briefly, daily diet administration wasorganised in three meals (breakfast, lunch and dinner) and twosnacks, 2·5 h after breakfast and lunch. Every participant wasinformed that a leftover ≥5% of the total food intake meant thedismissal from the trial. Participants were asked to keep theirexercise habits unvaried during the intervention period,and their physical activity was registered using a pedometer(Tri-axial activity monitor, XL-18/XL-18 CN-AND; A&DMedical). Primary outcomes were the change in fasting bloodglucose (FBG) and postprandial blood glucose (PPBG) levelsfrom the baseline (T0) to the 21st day of treatment (T1).Secondary outcomes included changes from baseline inplasma concentration of HbA1c, total cholesterol, LDL-cholesterol, HDL-cholesterol and the LDL:HDL ratio, C-reactiveprotein (CRP), TNF-α and IL-6, as well as insulin resistance,body weight, BMI, waist and hip circumference and GMcomposition. For GM analysis, participants were asked toprovide a faecal sample before (T0) and after the 21-dnutritional intervention (T1). Stool samples were successfullycollected from a subset of forty T2D patients participating in theMADIAB trial aged 50–77 years (mean age 66 years): twenty-one assigned to the Ma-Pi 2 diet and nineteen to the CTR diet.The gut microbiome study was conducted in this subset of fortyMADIAB participants.
Gut microbiota and diet in type 2 diabetes 81
Dow
nloaded from https://w
ww
.cambridge.org/core . IP address: 54.39.106.173 , on 01 Feb 2020 at 07:50:32 , subject to the Cam
bridge Core terms of use, available at https://w
ww
.cambridge.org/core/term
s . https://doi.org/10.1017/S0007114516001045

In addition, thirteen healthy controls, aged 21–40 years(mean age 32 years) and with 18·3–24·6 kg/m2 BMI, wereenrolled for the study (Table 1). They were asked to providea faecal sample, and their eating habits were assessed usingqualitative and quantitative questionnaires as well (onlineSupplementary Table S1). All samples were immediately frozenat −20°C, and then transferred within 1 week to −80°C andstored there until processing.
16S ribosomal DNA sequencing and processing
Total microbial DNA was extracted from faeces using theDNeasy Blood & Tissue Kit (Qiagen) by introducing threeFastPrep (MP Biomedicals) bead-beating 1-min steps at5·5 movements/s, with 5-min incubation in ice between treat-ments(23). DNA recovery was evaluated using the NanoDropND-1000 spectrophotometer (NanoDrop Technologies) and 2200
Table 1. Anthropometric characteristics of type 2 diabetes (T2D) patients, measured at T0 and T1 (after 21-d Ma-Pi 2 or control diet (CTR) intervention),and normal-weight healthy controls(Mean values and standard deviations)
No. ArmAge
(years) SexWeightT0 (kg)
Mean weightT0 (kg) SD
WeightT1 (kg)
Mean weightT1 (kg) SD
BMI T0(kg/m2)
Mean BMIT0 (kg/m2) SD
BMI T1(kg/m2)
Mean BMIT1 (kg/m2) SD
1 Ma-Pi 2 50 F 99·1 88·4 17·5 93·5 82·8 16·5 41·4 34·3 6·5 39·1 32·2 6·12 Ma-Pi 2 72 M 108·6 103·2 34·1 32·43 Ma-Pi 2 77 F 72·8 68·7 35 334 Ma-Pi 2 67 M 88 82·5 30 28·25 Ma-Pi 2 72 F 104 96·4 50·7 476 Ma-Pi 2 62 M 72·4 68·6 24·3 237 Ma-Pi 2 76 M 130 121·7 45·5 42·68 Ma-Pi 2 63 F 108·4 100·5 43·2 40·19 Ma-Pi 2 59 M 95·7 89·1 35·4 3310 Ma-Pi 2 75 F 73·9 70 33·2 31·511 Ma-Pi 2 75 F 60·1 55·2 28·9 26·512 Ma-Pi 2 73 M 88·9 82·9 30·7 28·713 Ma-Pi 2 70 F 75·8 71·5 31·3 29·514 Ma-Pi 2 71 F 81·1 77·2 30·9 29·515 Ma-Pi 2 62 M 74·7 69·2 29·6 27·416 Ma-Pi 2 57 F 116·9 109·3 36·8 34·417 Ma-Pi 2 60 M 81 75·2 27·7 25·618 Ma-Pi 2 76 M 77·6 72 29·9 27·719 Ma-Pi 2 61 F 75·6 69·9 31·3 2920 Ma-Pi 2 72 F 77·7 73·3 31·1 29·321 Ma-Pi 2 66 F 93·4 88·8 40 381 CTR 60 F 122·2 88·2 15·5 119 85·5 14·9 50·7 32·1 6·3 49·3 31·1 6·12 CTR 56 M 103·1 98·6 36·5 34·93 CTR 51 M 88·3 85·9 33·7 32·84 CTR 57 F 88 85·9 33·1 32·35 CTR 72 F 55·9 55·3 22 226 CTR 73 F 77 75·2 30·8 30·17 CTR 74 M 89·3 86·8 27·3 26·58 CTR 68 M 80·7 78·8 24·9 24·49 CTR 74 M 72·8 69·6 28·8 27·510 CTR 72 M 78·5 75·1 28·2 2711 CTR 53 M 105·4 100·2 32·1 30·612 CTR 69 M 85·9 83·3 28·1 27·213 CTR 74 F 80·7 77·8 33·6 32·314 CTR 67 M 104·5 100·6 36·2 34·915 CTR 62 M 80·3 78·3 29·5 28·816 CTR 69 M 104·2 101·2 34·8 33·817 CTR 63 F 85·7 83·5 31·9 31·118 CTR 64 F 72·4 69·3 27·6 26·419 CTR 65 F 101·8 99·8 40·7 39·91 IT1 38 M 78·2 65·6 10·7 N/A N/A N/A 22·9 22·0 1·8 N/A N/A N/A2 IT2 34 F 62·4 N/A 20 N/A3 IT3 29 F 60·9 N/A 22·4 N/A4 IT4 27 M 87·2 N/A 22·9 N/A5 IT5 30 M 72·3 N/A 23·2 N/A6 IT6 32 F 58·4 N/A 22·7 N/A7 IT9 39 F 54·3 N/A 20·3 N/A8 IT10 40 F 53·1 N/A 18·3 N/A9 IT11 40 F 67·6 N/A 24·8 N/A10 IT12 30 F 57·5 N/A 22 N/A11 IT14 21 F 59·3 N/A 21·3 N/A12 IT15 29 M 80·4 N/A 24·6 N/A13 IT16 32 F 61·3 N/A 21·2 N/A
F, female; M, male; IT, Italian healthy controls.
82 M. Candela et al.
Dow
nloaded from https://w
ww
.cambridge.org/core . IP address: 54.39.106.173 , on 01 Feb 2020 at 07:50:32 , subject to the Cam
bridge Core terms of use, available at https://w
ww
.cambridge.org/core/term
s . https://doi.org/10.1017/S0007114516001045

TapeStation instrument (Agilent Technologies). For each sample,the V3–V4 region of the 16S rRNA gene was PCR-amplified in25-μl volumes containing 12·5ng of microbial DNA, 2× KAPA HiFiHotStart ReadyMix (Kapa Biosystems) and 200nmol/l ofS-D-Bact-0341-b-S-17/S-D-Bact-0785-a-A-21 primers(24) carryingIllumina overhang adapter sequences (Bio-Fab Research). Thermalcycle consisted of an initial denaturation at 95°C for 3min, twenty-five cycles of denaturation at 95°C for 30 s, annealing at 55°C for30 s, extension at 72°C for 30 s and a final extension step at 72°C for5min. Amplicons of about 460bp were purified with a magneticbead-based clean-up system (Agencourt AMPure XP; BeckmanCoulter) and sequenced on Illumina MiSeq platform using a2×300bp paired end protocol, according to the manufacturer’sinstructions (Illumina). Briefly, indexed libraries were prepared bylimited-cycle PCR using Nextera technology and further cleaned upwith AMPure XP magnetic beads (Beckman Coulter). Librarieswere pooled at equimolar concentrations, denatured and diluted to6pmol/l before loading onto the MiSeq flow cell. Ampliconsequences were deposited in the MG-RAST database (http://metagenomics.anl.gov/linkin.cgi?project=17675).
Bioinformatics and statistics
Raw sequences were processed using a pipeline combiningPANDAseq (paired-end assembler for Illumina sequences)(25) andQIIME (Quantitative Insights Into Microbial Ecology)(26). High-quality reads were binned into operational taxonomic units (OTU)at a 0·97 similarity threshold using UCLUST(27). Taxonomy wasassigned using the RDP (Ribosomal Database Project) classifieragainst Greengenes database (May 2013 release). Chimera filteringwas performed by discarding all singleton OTU. α Rarefaction wasanalysed by using the Faith’s phylogenetic diversity, Chao1,observed species and Shannon index metrics. β Diversity wasestimated by computing weighted and unweighted UniFrac dis-tances. Weighted UniFrac distances were used for principal coor-dinates analysis (PCoA) and plotted by the rgl and vegan packagesof R. Data separation in the PCoA was tested using a permutationtest with pseudo F ratios (function adonis in the vegan package).Heat-map analysis was performed using the R ggplot2 package.Metagenome imputation of Greengenes-picked OTU was per-
formed using PICRUSt (Phylogenetic Investigation of Communitiesby Reconstruction of Unobserved States)(28) with default settings.The KEGG (Kyoto Encyclopedia of Genes and Genomes) Orthol-ogy (KO) database(29) was used for functional annotation. Pro-crustes superimposition was conducted on the normalised KO genedata set and phylogenetic compositional data using vegan and rgl.The correlation between age and GM diversity was computed
by Kendall τ correlation test. To identify which feature ineach diet contributed to the modulation of single bacterialgroups, a graphical representation of phylogenetic data anddietary metadata was obtained using GraPhlAn(30).All statistical analyses were performed in R, version 3.1.3.
Significant differences were assessed by Wilcoxon’s signedrank-sum test. When appropriate, a paired test was used. Wherenecessary, P values were corrected for multiple comparisonsusing the Benjamini–Hochberg method. P< 0·05 was con-sidered statistically significant.
Statistical analysis of the primary and other secondaryoutcomes from the subset of forty MADIAB participants whoprovided stool samples was carried out as reported by Soareet al.(21). Briefly, quantitative variables were summarised usingpercentiles, and the comparison between time points and dietarygroups was performed using the Wilcoxon’s signed rank-sum test.
Results
Comparison of the gut microbiota compositionalstructure between overweight type 2 diabetes patientsand healthy controls
The phylogenetic structure of the GM ecosystem of fortyoverweight T2D patients before (T0) and after (T1) nutritionalintervention, and thirteen normal-weight healthy adults,was characterised by NGS of the V3–V4 region of the 16Sribosomal DNA (rDNA) (online Supplementary Fig. S1).A total of 3 198 509 high-quality reads were obtained, witha mean of 30 277 (SD 4850) reads per sample. Reads were clus-tered in 30 874 OTU at 97% identity. Rarefaction curves obtainedwith Shannon, Chao1, PD (phylogenetic diversity) whole treeand observed species phylogenetic metrics approximated thesaturation level after 3300 reads (online Supplementary Fig. S1).
To characterise GM dysbioses in T2D at the enrolment, thecompositional structure of the GM at T0 was compared withthat of healthy controls. In the online Supplementary Table S1,we provide the dietary behaviours during the 6 months beforethe trial for all T2D patients, as well as the dietary habits of thehealthy controls. T2D patients were characterised by a sig-nificant reduction of the GM Shannon diversity index (P< 0·05,Wilcoxon’s signed rank-sum test). Even if it cannot be excludedthat the age differences between T2D patients (mean age66 years) and healthy controls (mean age 32 years) contribute,at least in part, to the observed differences in GM diversity, wefailed to detect any significant correlation between age andmicrobiome diversity in our data set (online SupplementaryFig. S2). The PCoA of the weighted UniFrac distances resulted ina significant segregation between the two groups (Fig. 1(a))(P< 0·001, permutation test with pseudo F ratios), confirmingthe presence of compositional differences in the GM structureof T2D patients and healthy controls. To identify the microbialgenera responsible for this separation, the biplot of the averagebacterial coordinates weighted by the corresponding bacterialabundance per sample was superimposed on the PCoA plot(Fig. 1(b)), as previously carried out by Lozupone et al.(31).The GM genera that clustered with T2D patients and healthycontrols and the corresponding relative abundance valuesare reported in Table 2. According to our biplot analysis,T2D patients showed a higher load of several potentiallypro-inflammatory GM components, such as Enterobacteriaceae,Collinsella(32) and Streptococcus. In particular, Enterobacter-iaceae, Collinsella and Streptococcus were, respectively, 8·5, 3·5and 4·1 times more in T2D patients than in healthy controls.T2D patients also showed a significantly higher abundanceof Lactobacillus, with an increase of about 150 times, andLachnospiraceae:Ruminococcus, which was 1·1 times morethan in healthy controls. Conversely, T2D patients were slightly
Gut microbiota and diet in type 2 diabetes 83
Dow
nloaded from https://w
ww
.cambridge.org/core . IP address: 54.39.106.173 , on 01 Feb 2020 at 07:50:32 , subject to the Cam
bridge Core terms of use, available at https://w
ww
.cambridge.org/core/term
s . https://doi.org/10.1017/S0007114516001045
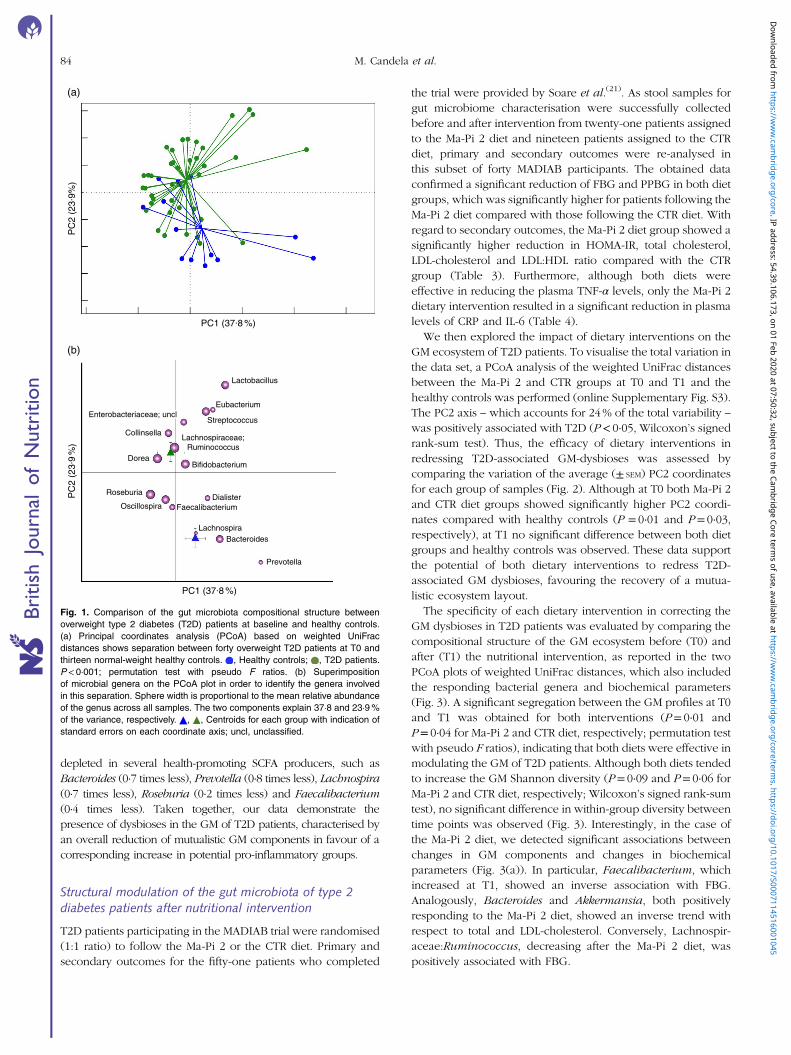
depleted in several health-promoting SCFA producers, such asBacteroides (0·7 times less), Prevotella (0·8 times less), Lachnospira(0·7 times less), Roseburia (0·2 times less) and Faecalibacterium(0·4 times less). Taken together, our data demonstrate thepresence of dysbioses in the GM of T2D patients, characterised byan overall reduction of mutualistic GM components in favour of acorresponding increase in potential pro-inflammatory groups.
Structural modulation of the gut microbiota of type 2diabetes patients after nutritional intervention
T2D patients participating in the MADIAB trial were randomised(1:1 ratio) to follow the Ma-Pi 2 or the CTR diet. Primary andsecondary outcomes for the fifty-one patients who completed
the trial were provided by Soare et al.(21). As stool samples forgut microbiome characterisation were successfully collectedbefore and after intervention from twenty-one patients assignedto the Ma-Pi 2 diet and nineteen patients assigned to the CTRdiet, primary and secondary outcomes were re-analysed inthis subset of forty MADIAB participants. The obtained dataconfirmed a significant reduction of FBG and PPBG in both dietgroups, which was significantly higher for patients following theMa-Pi 2 diet compared with those following the CTR diet. Withregard to secondary outcomes, the Ma-Pi 2 diet group showed asignificantly higher reduction in HOMA-IR, total cholesterol,LDL-cholesterol and LDL:HDL ratio compared with the CTRgroup (Table 3). Furthermore, although both diets wereeffective in reducing the plasma TNF-α levels, only the Ma-Pi 2dietary intervention resulted in a significant reduction in plasmalevels of CRP and IL-6 (Table 4).
We then explored the impact of dietary interventions on theGM ecosystem of T2D patients. To visualise the total variation inthe data set, a PCoA analysis of the weighted UniFrac distancesbetween the Ma-Pi 2 and CTR groups at T0 and T1 and thehealthy controls was performed (online Supplementary Fig. S3).The PC2 axis – which accounts for 24% of the total variability –
was positively associated with T2D (P< 0·05, Wilcoxon’s signedrank-sum test). Thus, the efficacy of dietary interventions inredressing T2D-associated GM-dysbioses was assessed bycomparing the variation of the average (± SEM) PC2 coordinatesfor each group of samples (Fig. 2). Although at T0 both Ma-Pi 2and CTR diet groups showed significantly higher PC2 coordi-nates compared with healthy controls (P = 0·01 and P= 0·03,respectively), at T1 no significant difference between both dietgroups and healthy controls was observed. These data supportthe potential of both dietary interventions to redress T2D-associated GM dysbioses, favouring the recovery of a mutua-listic ecosystem layout.
The specificity of each dietary intervention in correcting theGM dysbioses in T2D patients was evaluated by comparing thecompositional structure of the GM ecosystem before (T0) andafter (T1) the nutritional intervention, as reported in the twoPCoA plots of weighted UniFrac distances, which also includedthe responding bacterial genera and biochemical parameters(Fig. 3). A significant segregation between the GM profiles at T0and T1 was obtained for both interventions (P= 0·01 andP= 0·04 for Ma-Pi 2 and CTR diet, respectively; permutation testwith pseudo F ratios), indicating that both diets were effective inmodulating the GM of T2D patients. Although both diets tendedto increase the GM Shannon diversity (P= 0·09 and P= 0·06 forMa-Pi 2 and CTR diet, respectively; Wilcoxon’s signed rank-sumtest), no significant difference in within-group diversity betweentime points was observed (Fig. 3). Interestingly, in the case ofthe Ma-Pi 2 diet, we detected significant associations betweenchanges in GM components and changes in biochemicalparameters (Fig. 3(a)). In particular, Faecalibacterium, whichincreased at T1, showed an inverse association with FBG.Analogously, Bacteroides and Akkermansia, both positivelyresponding to the Ma-Pi 2 diet, showed an inverse trend withrespect to total and LDL-cholesterol. Conversely, Lachnospir-aceae:Ruminococcus, decreasing after the Ma-Pi 2 diet, waspositively associated with FBG.
PC
2 (2
3.9%
)
PC1 (37.8 %)
PC
2 (2
3.9
%)
Lachnospiraceae;Ruminococcus
Lactobacillus
Eubacterium
StreptococcusEnterobacteriaceae; uncl
Collinsella
DoreaBifidobacterium
Roseburia
OscillospiraDialister
Faecalibacterium
LachnospiraBacteroides
Prevotella
PC1 (37.8 %)
(a)
(b)
Fig. 1. Comparison of the gut microbiota compositional structure betweenoverweight type 2 diabetes (T2D) patients at baseline and healthy controls.(a) Principal coordinates analysis (PCoA) based on weighted UniFracdistances shows separation between forty overweight T2D patients at T0 andthirteen normal-weight healthy controls. , Healthy controls; , T2D patients.P< 0·001; permutation test with pseudo F ratios. (b) Superimpositionof microbial genera on the PCoA plot in order to identify the genera involvedin this separation. Sphere width is proportional to the mean relative abundanceof the genus across all samples. The two components explain 37·8 and 23·9%of the variance, respectively. , , Centroids for each group with indication ofstandard errors on each coordinate axis; uncl, unclassified.
84 M. Candela et al.
Dow
nloaded from https://w
ww
.cambridge.org/core . IP address: 54.39.106.173 , on 01 Feb 2020 at 07:50:32 , subject to the Cam
bridge Core terms of use, available at https://w
ww
.cambridge.org/core/term
s . https://doi.org/10.1017/S0007114516001045

To dissect the specific GM compositional changes inresponse to the dietary regimen, we focused our analysis on thecore GM community, defined as the sum of the microbialgenera present at a relative abundance >1% in at least 30% ofthe subjects. Selected genera accounted together for >80% ofthe total ecosystem. To estimate the degree of dysbiosis of thecore GM in T2D, the ratio of the median genus abundance inT2D patients and healthy controls was calculated. The heat mapof the log-ratios at T0 and T1 for the Ma-Pi 2 and the CTR diet isshown in Fig. 4. According to our findings, both diets wereeffective in counteracting the decrease of Bacteroides, Doreaand Faecalibacterium in T2D patients, as demonstrated by therecovery of median abundance values similar to those ofhealthy controls. Moreover, both Ma-Pi 2 and CTR diet resultedin an increase of Akkermansia above the abundance valuescharacteristic of healthy controls. On the other hand, both dietssupported the reduction of Lachnospiraceae:Ruminococcusdown to the median abundance values shown by healthycontrols. Diet-specific effects on the GM composition of T2Dpatients regarded only a few genera under-represented in T2Dpatients compared with healthy controls: Lachnospira andRoseburia, for which only the CTR diet favoured the recovery ofhealth-like median abundance values, and Oscillospira, forwhich the recovery of health-like values occurred only in theMa-Pi 2 diet group. Conversely, the genera Collinsella andStreptococcus, and unclassified Lachnospiraceae, which wereenriched in T2D patients compared with healthy controls,decreased down to health-like abundances only in patients whounderwent the Ma-Pi 2 diet intervention.To highlight specific dietary features affecting the GM com-
position, a comparison between the microbiota profiles at T1 ofthe two groups was performed, taking into account also thedietary features of the two different interventions (Fig. 5). T1samples from the Ma-Pi 2 diet group showed significantlyhigher abundance of Peptostreptococcaceae (P= 0·02;Wilcoxon’s signed rank-sum test) and Leuconostocaceae(P= 0·0002), which were also positively correlated with theingested amount of dietary components that were represented
in a higher percentage in Ma-Pi 2 compared with the CTR diet(whole grain 28·1 v. 8·5%, vegetables, sauces and herbs 64·5 v.32·0%), or only present in the Ma-Pi 2 diet (seeds, seaweedsand fermented products) (see also online Supplementary TableS2). On the contrary, bacteria from the family Erysipelo-trichaceae showed significantly higher abundance in T1 sam-ples from the CTR diet group (P= 0·008), and were positivelycorrelated with the ingested amount of dietary componentspresent only in CTR diet (bread, cereal, pasta and grains, meats,eggs and meat broths, dairy products, fruit and fruit juice andextra-virgin olive oil). The same positive correlations wereobtained for Coriobacteriaceae, even if the abundance of thisbacterial family was not significantly higher in the CTR dietgroup T1 samples. This bacterial group also showed a positivecorrelation with the food category ‘other starch’ (containinglegumes and potatoes), which was more represented in the CTRdiet than in the Ma-Pi 2 diet (5·5 v. 3·0%). This food categorywas also correlated to the Ruminococcaceae family.
Impact of nutritional intervention on the functionalconfiguration of the gut microbiome of type 2diabetes patients
To gain insight into the GM functions, gut metagenomesstructures were inferred from the respective phylogenetic pro-files using PICRUSt(28), as previously performed by Davidet al.(19) and Morgan et al.(33). A total of 329 KEGG pathwayswere generated, of these 249 showed a significantly differentabundance between healthy controls and T2D patients, andthirty-four showed a significant variation in response to theMa-Pi 2 diet, whereas no KEGG pathway respondedsignificantly to the CTR diet. The Procrustes analysis of the 16SrDNA sequences and imputed KO gene data set co-illustratesthe data, supporting the significant association betweentaxonomic and inferred functional profiles of the gut micro-biome across our study cohort (P= 0·001, Protest; onlineSupplementary Fig. S4). The PCoA of the imputed functional
Table 2. Relative genus abundance in forty overweight type 2 diabetes (T2D) patients and thirteen normal-weight healthy controls(Percentages and standard deviations)*
Genera Rel. Ab. (T2D, %) SD Rel. Ab. (healthy, %) SD P
Bifidobacterium 3·32 0·05 7·23 0·05 0·007Collinsella 2·67 0·02 0·60 0·01 0·01Bacteroides 3·05 0·04 10·8 0·09 0·002Streptococcus 3·62 0·07 0·73 0·01 0·09Dorea 2·06 0·01 1·56 0·01 0·1Lachnospira 0·47 0·01 1·55 0·01 0·0006Roseburia 5·38 0·07 6·98 0·05 0·07Lachnospiraceae:Ruminococcus 4·98 0·05 2·33 0·02 0·01Faecalibacterium 4·95 0·04 7·85 0·05 0·02Oscillospira 1·18 0·01 1·71 0·01 0·04Unclassified Enterobacteriaceae 1·79 0·03 0·19 0·01 0·2Prevotella 0·42 0·01 1·97 0·04 0·1Eubacterium 1·18 0·02 0·26 0·01 0·08Dialister 1·08 0·02 0·95 0·02 0·8Lactobacillus 2·98 0·08 0·02 0·01 0·0002
Rel.Ab., relative abundance.* Relative P values calculated by applying the Wilcoxon’s signed rank-sum test are also reported
Gut microbiota and diet in type 2 diabetes 85
Dow
nloaded from https://w
ww
.cambridge.org/core . IP address: 54.39.106.173 , on 01 Feb 2020 at 07:50:32 , subject to the Cam
bridge Core terms of use, available at https://w
ww
.cambridge.org/core/term
s . https://doi.org/10.1017/S0007114516001045

Table 3. Primary and secondary outcome comparison between Ma-Pi 2 and control (CTR) diet at T0 and T1(Medians and 1st–3rd quartile ranges)
Ma-Pi 2 diet (n 21) CTR diet (n 19)
T0 T1 T0 T1
Median 1st–3rd quartile Median 1st–3rd quartile P* Median 1st–3rd quartile Median 1st–3rd quartile P† P‡ P§
Fasting blood glucose (mg/l) 1260 1110; 1530 950 850; 1000 0·007 1380 1125; 1645 1080 1025; 1150 0·004 0·7 0·0002Postprandial blood glucose (mg/l) 1270 1090; 1790 1000 940; 1060 0·009 1470 1360; 2130 1275 1117; 1537 0·009 0·03 0·0002HbA1c (%) 6·5 6·10; 7·7 6·1 5·8; 7·0 0·2 6·9 6·4; 7·5 6·8 6·2; 7·1 0·4 0·7 0·3HOMA-IR 3·3 1·4; 4·2 1·0 0·6; 2·1 0·0004 3·2 0·9; 4·6 1·4 1·1; 2·2 0·08 0·8 0·1Total cholesterol (mg/l) 1780 1550; 2290 1230 1030; 1390 0·0002 1830 1520; 2140 1560 1375; 1895 0·1 0·9 0·01LDL-cholesterol (mg/l) 1020 870; 1340 630 430; 870 0·0003 1050 880; 1270 850 670; 1045 0·07 0·9 0·03HDL-cholesterol (mg/l) 490 390; 520 440 380; 510 0·5 500 440; 570 470 405; 570 0·7 0·4 0·3LDL:HDL ratio 2·4 2·0; 3·0 1·5 0·9; 1·9 0·004 2·0 1·9; 2·8 1·8 1·4; 2·3 0·2 0·2 0·2Weight (kg) 81·1 75·6; 99·1 77·2 70·0; 93·5 0·2 85·9 79·4; 102·5 83·3 75·2; 92·7 0·2 0·8 0·7BMI (kg/m2) 31·3 30·0; 36·8 29·5 28·2; 34·4 0·2 30·8 27·8; 34·2 30·1 26·9; 33·3 0·4 0·1 0·4Waist circumference (cm) 108·1 100·3; 114·7 103·4 95·8; 11·7 0·2 105·5 101·8; 112·8 102·9 100·1; 108·0 0·4 0·6 0·9Hip circumference (cm) 109·5 103·3; 123·8 105·3 101·8; 120·0 0·4 109·1 100·6; 117·5 107·5 99·5; 115·1 0·6 0·5 0·8
HbA1c, glycated Hb; HOMA-IR, homeostasis model assessment of insulin resistance.* P values indicated for T0 and T1 for Ma-Pi 2 diet.† P values indicated for T0 and T1 for CTR diet.‡ P values indicated for Ma-Pi 2 and CTR diet at T0.§ P values indicated for Ma-Pi 2 and CTR diet at T1.
Table 4. Inflammatory marker comparison between Ma-Pi 2 and control (CTR) diet at T0 and T1(Medians and 1st–3rd quartile ranges)
Ma-Pi 2 diet (n 21) CTR diet (n 19)
T0 T1 T0 T1
Median 1st–3rd quartile Median 1st–3rd quartile P* Median 1st–3rd quartile Median 1st–3rd quartile P value† P value‡ P value§
CRP (mg/l) 3·2 1·2; 11·8 1·0 0·3; 2·1 0·004 2·7 1·4; 5·9 1·6 1·1; 4·9 0·4 0·8 0·03TNF-α (pg/ml) 23·3 0·0; 35·7 0·0 0·0; 2·1 0·001 26·2 11·2; 38·9 4·0 0·5; 8·4 0·002 0·4 0·01IL-6 (pg/ml) 4·3 0·8; 6·4 2·9 2·4; 5·1 0·006 3·3 0·1; 5·5 3·5 2·1; 5·8 0·4 0·2 0·6
CRP, C-reactive protein.* P values indicated for T0 and T1 for Ma-Pi 2 diet.† P values indicated for T0 and T1 for CTR diet.‡ P values indicated for Ma-Pi 2 and CTR diet at T0.§ P values indicated for Ma-Pi 2 and CTR diet at T1.
86M.Can
dela
etal.
Downloaded from https://www.cambridge.org/core. IP address: 54.39.106.173, on 01 Feb 2020 at 07:50:32, subject to the Cambridge Core terms of use, available at https://www.cambridge.org/core/terms. https://doi.org/10.1017/S0007114516001045

GM profiles showing segregation among the Ma-Pi 2 and CTRgroups at T0 and T1 and healthy controls is provided as theonline Supplementary Fig. S5.The Euclidean principal component analysis (PCA) of the KO
level gene abundances showed separate clustering between thegut microbiome structure of T2D patients at T0 and healthycontrols (P= 0·03, permutation test with pseudo F ratios). Toidentify functions responsible for this separation, the averagecoordinates of the metabolic pathways in all samples, weightedby gene count per sample, were obtained and the resultingbiplot of pathway distribution was superimposed on the PCAplot (Fig. 6). The pathways clustering with T2D patients andhealthy controls are listed in the online Supplementary Table S3.In the context of this functional separation, T2D patientsshowed a general perturbation in microbiome pathwaysinvolved in the metabolism of amino acids, lipids and second-ary metabolites. In particular, T2D patients were depleted ingenes involved in the metabolism of D-arginine and D-ornithine,as well as of D-glutamine and D-glutamate, while being enrichedin pathways involved in tyrosine metabolism and alanine,aspartate and glutamate metabolism. This functional layout maylead to a reduced production of arginine – as a result of both thereduction of pathways directly involved in arginine biosynthesisand the lower amount of glutamate available for argininebiosynthesis – and to a corresponding increase in alanine levels.Although arginine has been reported as insulinogenic(34), anincreased alanine production has been connected toaugmented energy intake, cholesterol level and BMI(35).Furthermore, an increased tyrosine metabolism in T2Dpatients could result in higher levels of the 4-cresol metabolite,which has been associated with diverse inflammatoryconditions in the gut(36). Finally, compared with healthycontrols, the GM of T2D patients showed increased abundanceof functions involved in the arachidonic acid metabolism.Interestingly, the bacterial metabolism of this key inflammatoryintermediate is a well-recognised immune-escaping strategyfor proteobacteria(37). A higher level of arachidonic acidmetabolism in the GM of T2D patients, together with theincrease in the biosynthesis of polyketide sugars – bacterialsecondary metabolites with a range of biological functionsincluding immunosuppression(38) – might be the result of
the hypothesised bloom of pro-inflammatory pathobionts inthe gut.
With the aim to explore the impact of nutritional interven-tions on the functional configuration of the gut microbiome inT2D patients, the Euclidean PCA of KO level gene abundancesat T0 and T1 for both dietary groups was carried out. Differentlyfrom the CTR diet, which resulted in no significant functionalchange in the predicted gut metagenome (P= 0·4, permutationtest with pseudo F ratios), the Ma-Pi 2 diet was effective inmodulating the GM metagenome in T2D patients, as demon-strated by significant sample clustering according to the timepoint (P= 0·007). As previously described, the correspondingbiplot of metabolic pathway distribution was superimposed onthe PCA plot (Fig. 7). The pathways clustering with the Ma-Pi 2diet time points are listed in online Supplementary Table S3.According to our findings, the Ma-Pi 2 diet effectively coun-teracted the functional dysbioses in the GM of T2D patients,resulting in the decrease of the abundance of severalT2D-associated GM functional markers, such as alanine meta-bolism, arachidonic acid metabolism and polyketide sugarbiosynthesis, as well as in the reduction of GM functions relatedto oxidative phosphorylation and glycosphingolipid biosynth-esis. Moreover, the Ma-Pi 2 diet favoured an increase in GMfunctions involved in D-glutamine and D-glutamate metabolism,previously reported as reduced in T2D patients, and in thebiosynthesis of unsaturated fatty acids, which have beenshown to improve lipoprotein profile, glycaemic control andantioxidant status in T2D(39,40). Finally, the Ma-Pi 2 diet resultedin the increase of GM pathways involved in the metabolism oftaurine, cysteine, methionine, valine, leucine and isoleucine,potentially providing the host with an additional source ofimportant nutrients and essential amino acids.
Discussion
In the present study, the GM phylogenetic and functional dys-bioses in forty overweight T2D patients participating in theMADIAB trial(21) were explored. In agreement with previousfindings(11), T2D involved a significant reduction of the GMdiversity, which is a common feature shared by several disease-associated dysbiotic microbiome configurations, such as thoseassociated with inflammatory bowel disease and age(41,42).According to our results, the reduction of the GM compositionaldiversity in T2D corresponded to phylogenetic changes. T2Dpatients were indeed enriched in Lactobacillus, Lachnospir-aceae:Ruminococcus and in several potential pro-inflammatoryGM components, such as Enterobacteriaceae, Collinsella andStreptococcus(32,39,43–46), whereas they were depleted inimportant health-promoting SCFA producers, such as membersof Lachnospiraceae, Faecalibacterium, Bacteroides and Prevotella.Strengthening these findings, analogous T2D-associated GMstructural dysbioses have already been identified in previousstudies(3,6,7,47). Subsequently, we explored the changes inGM functions matching these compositional perturbations byinferred metagenomics. Our data suggest deregulation inpathways involved in the metabolism of amino acids, lipidsand secondary metabolites in the GM of T2D patients, including a
PC20
****
******
*******
*
**
Fig. 2. Variation of the weighted UniFrac PC2 coordinates between the studygroups. , Ma-Pi 2 diet group at T0; , control (CTR) diet group at T0;, healthy controls; , Ma-Pi 2 diet group at T1; , CTR diet group at T1. For
each group, average (± SEM, error bar) PC2 coordinates are shown. Thesignificance of the differences between the PC2 coordinates of the groups isindicated as follows: * P< 0·001 (Ma-Pi 2 diet group at T0 v. T1), ** P= 0·01(CTR diet group at T0 v. T1), *** P= 0·01 (Ma-Pi 2 diet group at T0 v. healthycontrols), **** P= 0·03 (CTR diet group at T0 v. healthy controls); Wilcoxon’ssigned rank-sum test.
Gut microbiota and diet in type 2 diabetes 87
Dow
nloaded from https://w
ww
.cambridge.org/core . IP address: 54.39.106.173 , on 01 Feb 2020 at 07:50:32 , subject to the Cam
bridge Core terms of use, available at https://w
ww
.cambridge.org/core/term
s . https://doi.org/10.1017/S0007114516001045

reduced abundance of functions for the metabolism of D-arginineand D-ornithine, as well as of D-glutamine and D-glutamate, acorresponding increase in the metabolism of tyrosine, alanine,aspartate and glutamate, and a higher load of functions involved inarachidonic acid metabolism and polyketide sugar biosynthesis.
The observed T2D-related dysbiotic microbial communitycould exert a multifactorial role in the disease onset,contributing to metabolic and immune deregulation. Indeed,the T2D GM is slightly depleted in fibrolytic health-promotingmutualists, fundamental for providing butyrate and propionate
Total cholesterol LDL-cholesterol
Lachnospiraceae;Ruminococcus
Fasting bloodglucose
Faecalibacterium
Akkermansia
Bacteroides
Bacteroides
Lachnospira
Faecalibacterium
Lachnospiraceae;Ruminococcus
PC
2 (2
4.8
%)
PC1 (35 %)
PC
2 (2
0.2
%)
PC1 (32 %)
(a)
(b)
Fig. 3. Comparison of the gut microbiota compositional structure of type 2 diabetes (T2D) patients before and after the nutritional interventions. (a) Principalcoordinates analysis (PCoA) based on weighted UniFrac distances for T2D subjects following the Ma-Pi 2 diet (n 21) shows separation between T0 ( ) and T1 ( ).The two components explain 35·0 and 24·8% of the variance, respectively. P= 0·01; permutation test with pseudo F ratios. (b) PCoA based on weighted UniFracdistances for T2D subjects following the control (CTR) diet (n 19). , T0; , T1. The two components explain 32·0 and 20·2% of the variance, respectively. P= 0·04;permutation test with pseudo F ratios. Lines connect T0 and T1 samples from the same patient. , responding bacterial genera and biochemicalparameters, respectively; , direction of significant correlations; , , , , centroids for each time point.
88 M. Candela et al.
Dow
nloaded from https://w
ww
.cambridge.org/core . IP address: 54.39.106.173 , on 01 Feb 2020 at 07:50:32 , subject to the Cam
bridge Core terms of use, available at https://w
ww
.cambridge.org/core/term
s . https://doi.org/10.1017/S0007114516001045

from the degradation of indigestible plant polysaccharides andstarch, such as the butyrate-producing Dorea, Lachnospira,Roseburia and Faecalibacterium, and the propionate-producing Bacteroides and Prevotella(48). Even if the biologi-cal relevance of this depletion of SCFA producers remains to bedetermined, it could result in the reduction of bioavailability ofthese crucial GM metabolites in the gut, with consequences onthe host metabolic and immunological homeostasis. Forinstance, butyrate and propionate are important for host glu-cose control(11), insulin sensitivity regulation, insulin signallingand intestinal gluconeogenesis(9,49); also, they represent potentimmune modulators, being involved in peripheral regulatoryT-cell generation(50) and in the regulation of pro-inflammatorycytokine production(51). In parallel, the observed increase ofpotential pro-inflammatory micro-organisms in the gut ofT2D patients, such as Enterobacteriaceae, Collinsella andStreptococcus(32,39,43–46), could further contribute to raise thehost inflammatory level, supporting the evolution of insulinresistance(52). Finally, the functional GM layout of T2D patientswe obtained by imputed metagenomics suggests additionalmechanisms involved in the GM contribution to the disease,including the reduced production of the insulinogenicarginine(34), and the increased production of alanine, a recog-nised marker of higher energy intake and cholesterol level(35),which could contribute to the loss of metabolic control in T2D.Moreover, the higher potential for the production of tyrosinemetabolites could further boost pro-inflammatory stimuli in thegut(36). Interestingly, the survey of GM in T2D patients allowedus to find traces of functions related to immune escaping, suchas pathways involved in the metabolism of arachidonic acid and
polyketide sugar biosynthesis, further highlighting the ongoingbloom of pro-inflammatory GM components in T2D(39).However, the functional conclusions derived from imputedmetagenomics must be taken with caution until experimentallyconfirmed by shotgun metagenomics.
In the subset of forty MADIAB participants – twenty-oneassigned to the Ma-Pi 2 diet and nineteen to the CTR diet – wethen explored the efficacy of the nutritional interventions insupporting the recovery of a mutualistic GM configurationin T2D patients. Primary and secondary outcomes werere-analysed for this patient subset included in the gut micro-biome study, confirming that the Ma-Pi 2 diet was associatedwith a greater reduction in FBG and PPBG, total serumcholesterol, CRP and IL-6 in T2D patients. According to gutmicrobiome data, both Ma-Pi 2 and CTR diet were able tomodulate the GM dysbioses in T2D patients, supporting therecovery of a healthy-like compositional structure and resultingin an increased ecosystem diversity, which represents a strate-gic feature for a healthy GM ecosystem(53). In addition, bothdiets supported the recovery of a balanced health-promotingcommunity of fibrolytic SCFA producers in the gut of T2Dpatients, by re-increasing the abundance of propionate andbutyrate producers (i.e. Bacteroides, Dorea, Faecalibacterium)and consolidating a healthy-like abundance of Roseburia,Lachnospira, Lachnospiraceae:Ruminococcus and Oscillospira.Moreover, both dietary interventions resulted in the increase ofAkkermansia, a human mucus coloniser recently correlated toan improved metabolic profile(54), providing the rationale for itsuse in the prevention or treatment of obesity and associatedmetabolic disorders. Finally, it is important to point out that only
Bifidobacterium
Collinsella
Bacteroides
Streptococcus
Unclassified Clostridiales
Unclassified Lachnospiraceae
Blautia
Coprococcus
Dorea
Lachnospira
Roseburia
Lachnospiraceae:Ruminococcus
Unclassified Ruminococcaceae
Faecalibacterium
Oscillospira
Ruminococcaceae:Ruminococcus
Unclassified Enterobacteriaceae
Akkermansia
T0 T1 T0 T1
Ma-Pi 2 CTR
Colour key
–4 –2 0 2 4Value
Fig. 4. Impact of dietary interventions on the taxonomic structure of the core microbiota in type 2 diabetes (T2D) patients. Heat maps were calculated for both Ma-Pi 2and control (CTR) diet, based on the log-ratio of the median genus abundance in T2D patients (T0 and T1 samples) and healthy controls. The colour code and
segment line reveal the deviation in terms of fold change from the median profile of healthy subjects ( ). T2D patients following the Ma-Pi 2 diet (n 21); T2D patientsfollowing the CTR diet (n 19); healthy controls (n 13).
Gut microbiota and diet in type 2 diabetes 89
Dow
nloaded from https://w
ww
.cambridge.org/core . IP address: 54.39.106.173 , on 01 Feb 2020 at 07:50:32 , subject to the Cam
bridge Core terms of use, available at https://w
ww
.cambridge.org/core/term
s . https://doi.org/10.1017/S0007114516001045

the Ma-Pi 2 diet showed the potential to counteract the rise ofputative pro-inflammatory components (i.e. Collinsella andStreptococcus) in the GM ecosystem of T2D patients. When wesought associations between GM components and biochemicalparameters, significant trends were obtained only in the case ofthe Ma-Pi 2 diet. Indeed, in Ma-Pi 2-treated subjects, theabundance of Faecalibacterium was negatively associated withFBG and, analogously, the abundance of Bacteroides andAkkermansia showed an inverse association with total andLDL-cholesterol. Conversely, Lachnospiraceae:Ruminococcuswas positively associated with FBG. These findings suggest thatthese micro-organisms, the first increasing and the latterdecreasing in response to the Ma-Pi 2 diet, could representMa-Pi 2-responding GM components associated with primaryand secondary study outcomes. Supporting our findings, thenegative association between Faecalibacterium and FBGconcentration had already been detected in a study exploring
the structural modulation of the GM in T2D subjects treated witha Chinese herbal formula(55). Moreover, in a study carried outin mice, Akkermansia muciniphila treatment has beendemonstrated to reverse high-fat diet-induced metabolicdisorders, including fat-mass gain, metabolic endotoxaemia,adipose tissue inflammation and insulin resistance(54). On theother hand, Lachnospiraceae:Ruminococcus has recently beenpositively correlated with insulin resistance in obese women(56).According to imputed metagenomics, only the Ma-Pi 2diet resulted in a significant modulation of the functionalmicrobiome layout in T2D patients. In particular, the decreaseof several markers of functional GM dysbioses in T2D patients,such as imbalances in alanine metabolism, arachidonic acidmetabolism and polyketide sugar biosynthesis, was observed.Moreover, the Ma-Pi 2 diet favoured the reduction ofGM functions related to oxidative phosphorylation andglycosphingolipids biosynthesis. Anaerobic respiration provides
Ext
ra-v
irgin
oliv
e oi
l
Ferm
ente
d pr
oduc
ts
Sea
wee
dsS
eeds
Veg
etab
les,
sau
ces
and
he
rbs
Frui
t and
frui
t jui
ce
Dai
ry p
rodu
cts
Mea
ts, e
ggs
and
mea
t broths
Who
le g
rain
Oth
er s
tarc
hB
read
, cer
eal,
pasta
and
grains
Ruminococcaceae Verrucomicrobia
Coriobacteriaceae Synergistetes
Peptostreptococcaceae
Firmicutes
Leuconostocaceae
Erysipelotrichaceae Bacteroidetes
Actinobacteria
Proteobacteria
Alcaligenaceae
Fig. 5. Impact of dietary components on the gut microbiota taxonomic structure. Cladogram obtained with the GraPhlAn tool, showing the family-level gut microbiotaprofile of T1 samples from both intervention groups with a phylum-based colour code ( , Firmicutes; , Bacteroidetes; , Proteobacteria; , Actinobacteria;, Verrucomicrobia; , Synergistetes). Families with relative abundance of at least 0·5% in at least two samples are plotted. Larger circles identify bacterial families
having a positive correlation with at least one dietary component; the names of these families are reported. Filled circles identify bacterial families that showedsignificantly higher abundance in T1 samples of the Ma-Pi 2 diet group ( ) or the CTR diet group ( ). Bacterial family-food component correlations are indicated byfilled boxes in the external rings of the plot, referring to the list of dietary components. T2D patients following the Ma-Pi 2 diet (n 21); T2D patients following the CTR diet(n 19).
90 M. Candela et al.
Dow
nloaded from https://w
ww
.cambridge.org/core . IP address: 54.39.106.173 , on 01 Feb 2020 at 07:50:32 , subject to the Cam
bridge Core terms of use, available at https://w
ww
.cambridge.org/core/term
s . https://doi.org/10.1017/S0007114516001045

Fatty acids biosynthesis
Glycolysis/gluconeogenesis
D-Glutamine and D-Glutamate metabolism
D-Arginine and D-Ornithine metabolism
Pantothenate and CoA biosynthesisPhenylpropanoid biosynthesisArachidonic acid metabolism� Linolenic acid metabolismAlanine, aspartate and glutamate metabolismPolyketide sugar unit biosynthesis
Tyrosine metabolism
Purine metabolism
PC1 (14 %)
PC
2 (9
. 2%
)
Fig. 6. Functional dysbioses of the gut microbiome in type 2 diabetes (T2D) patients. Metabolic pathways were superimposed on the principal component analysis plotbased on Euclidean distances, and the pathways responsible for the separation are shown. , Healthy controls (n 13); , T2D patients (n 40). Sphere width isproportional to the mean relative abundance of the function across all samples. The two components explain 14·0 and 9·2% of the variance, respectively. P= 0·03;permutation test with pseudo F ratios. , , Centroids for each group with indication of standard errors on each coordinate axis.
Taurine and hypotaurine metabolismPurine metabolismValine, leucine and isoleucine metabolismCysteine and methionine metabolism
Biosynthesis of unsaturated fatty acids
Alanine, aspartate and glutamate metabolism
D-Glutamine and D-Glutamate metabolism
Glycolysis / Gluconeogenesis
Sphingolipid metabolism
Arachidonic acid metabolism
Polyketide sugar unit biosynthesisHistidine metabolism
� Alanine metabolismOxidative phosphorylation
Glycosphingolipid biosynthesisD-Alanine metabolism
Cyanoaminoacid metabolism
PC1 (22.3 %)
PC
2 (1
4.9
%)
Fig. 7. Impact of Ma-Pi 2 dietary intervention on the functional configuration of the gut microbiome in type 2 diabetes (T2D) patients. Metabolic pathways were superimposed onthe principal component analysis plot based on Euclidean distances in T2D patients before (T0, ) and after (T1, ) the Ma-Pi 2 diet (n 21). The two components explain 22·3and 14·9% of the variance, respectively. P=0·007; permutation test with pseudo F ratios. , , Centroids for each group with indication of standard errors on eachcoordinate axis.
Gut microbiota and diet in type 2 diabetes 91
Dow
nloaded from https://w
ww
.cambridge.org/core . IP address: 54.39.106.173 , on 01 Feb 2020 at 07:50:32 , subject to the Cam
bridge Core terms of use, available at https://w
ww
.cambridge.org/core/term
s . https://doi.org/10.1017/S0007114516001045

an ecological advantage for Enterobacteriaceae in an inflamedgut(39), whereas glycosphingolipids are powerful bacterialmodulators of the host inflammatory response(40). Thus, thereduction in abundance of these pathways further suggeststhe potential of Ma-Pi 2 diet to counteract the ongoing bloomof pro-inflammatory pathobionts in T2D. Finally, the Ma-Pi 2diet favoured the increase of GM functions involved in thebiosynthesis of unsaturated fatty acids and essential aminoacids, showing an added potential to promote the recovery ofmetabolic control and a balanced nutritional status in T2Dpatients.In conclusion, both Ma-Pi 2 and CTR diets showed the
potential to support the recovery of GM-host mutualism in T2Dpatients, favouring the restoration of fibrolytic SCFA-producingGM components, thus promoting metabolic control of T2Dpatients. Differently from the CTR diet, the Ma-Pi 2 diet waseffective in counteracting the rise of possible pro-inflammatorymicro-organisms in T2D patients. This suggests that the Ma-Pi 2diet may have the potential to reduce GM-dependentpro-inflammatory stimuli in the gut that, increasing chronicinflammation, can lead to insulin resistance in T2D(57). Even ifdirect causation still needs to be proved, and this conclusionmust be taken with adequate caution, this peculiar propertyshown by the Ma-Pi 2 diet could partly explain the greaterimprovements in metabolic control following Ma-Pi 2 dietaryintervention compared with the CTR diet(21).
Acknowledgements
The study was carried out with internal funding.The authors’ responsibilities were as follows: F. F., M. P., P. P.
and P. B. designed the research; E. B., S. Q. and C. C. performedthe experiments; M. Soverini., S. R., M. Severgnini., C. P. andM. C. analysed data and performed statistical analysis; M. C.,S. T. and E. B. wrote the paper; P. B. and F. F. revisedand edited the draft. M. C. had primary responsibility forfinal content. All authors read and approved the finalmanuscript.The authors declare that they have no conflicts of interest.
Supplementary material
For supplementary material/s referred to in this article, pleasevisit http://dx.doi.org/10.1017/S0007114516001045
References
1. Xu Y (2013) Prevalence and control of diabetes inChinese adults. JAMA 310, 948.
2. Zhang P, Zhang X, Brown J, et al. (2010) Global healthcareexpenditure on diabetes for 2010 and 2030. Diabetes Res ClinPract 87, 293–301.
3. Zhang X, Shen D, Fang Z, et al. (2013) Human gut microbiotachanges reveal the progression of glucose intolerance. PLOSONE 8, e71108.
4. Xu Z, Malmer D, Langille MGI, et al. (2014) Which is moreimportant for classifying microbial communities: who’s thereor what they can do? ISME J 8, 2357–2359.
5. Qin J, Li R, Raes J, et al. (2010) A human gut microbial genecatalogue established by metagenomic sequencing. Nature464, 59–65.
6. Karlsson FH, Tremaroli V, Nookaew I, et al. (2013) Gutmetagenome in European women with normal, impaired anddiabetic glucose control. Nature 498, 99–103.
7. Larsen N, Vogensen FK, van den Berg FWJ, et al. (2010) Gutmicrobiota in human adults with type 2 diabetes differs fromnon-diabetic adults. PLoS ONE 5, e9085.
8. Tremaroli V & Bäckhed F (2012) Functional interactionsbetween the gut microbiota and host metabolism. Nature 489,242–249.
9. De Vadder F, Kovatcheva-Datchary P, Goncalves D, et al.(2014) Microbiota-generated metabolites promote metabolicbenefits via gut-brain neural circuits. Cell 156, 84–96.
10. Backhed F, Ding H, Wang T, et al. (2004) The gut microbiotaas an environmental factor that regulates fat storage. Proc NatlAcad Sci U S A 101, 15718–15723.
11. Tilg H & Moschen AR (2014) Microbiota and diabetes: anevolving relationship. Gut 63, 1513–1521.
12. Khan MT, Nieuwdorp M & Bäckhed F (2014) Microbialmodulation of insulin sensitivity. Cell Metab 20, 753–760.
13. Amar J, Chabo C, Waget A, et al. (2011) Intestinal mucosaladherence and translocation of commensal bacteria at theearly onset of type 2 diabetes: molecular mechanisms andprobiotic treatment. EMBO Mol Med 3, 559–572.
14. Burcelin R (2012) Regulation of metabolism: a cross talkbetween gut microbiota and its human host. Physiology(Bethesda) 27, 300–307.
15. Cani PD, Amar J, Iglesias MA, et al. (2007) Metabolicendotoxemia initiates obesity and insulin resistance. Diabetes56, 1761–1772.
16. Everard A & Cani PD (2013) Diabetes, obesity and gutmicrobiota. Best Pract Res Clin Gastroenterol 27, 73–83.
17. Karlsson F, Tremaroli V, Nielsen J, et al. (2013) Assessing thehuman gut microbiota in metabolic diseases. Diabetes 62,3341–3349.
18. Turnbaugh PJ, Hamady M, Yatsunenko T, et al. (2009) A coregut microbiome in obese and lean twins. Nature 457,480–484.
19. David LA, Maurice CF, Carmody RN, et al. (2013) Diet rapidlyand reproducibly alters the human gut microbiome. Nature505, 559–563.
20. He C, Shan Y & Song W (2015) Targeting gut microbiota as apossible therapy for diabetes. Nutr Res 35, 361–367.
21. Soare A, Khazrai YM, Del Toro R, et al. (2014) The effect of themacrobiotic Ma-Pi 2 diet vs. the recommended diet in themanagement of type 2 diabetes: the randomized controlledMADIAB trial. Nutr Metab 11, 39.
22. Craig WJ & Mangels AR, & American Dietetic Association(2009) Position of the American Dietetic Association:vegetarian diets. J Am Diet Assoc 9, 1266–1282.
23. Centanni M, Turroni S, Consolandi C, et al. (2013) Theenterocyte-associated intestinal microbiota of breast-fedinfants and adults responds differently to a TNF-α-mediatedpro-inflammatory stimulus. PLOS ONE 8, e81762.
24. Klindworth A, Pruesse E, Schweer T, et al. (2013) Evaluationof general 16S ribosomal RNA gene PCR primers for classicaland next-generation sequencing-based diversity studies.Nucleic Acids Res 41, e1.
25. Masella AP, Bartram AK, Truszkowski JM, et al. (2012)PANDAseq: paired-end assembler for illumina sequences.BMC Bioinformatics 3, 31.
26. Caporaso JG, Kuczynski J, Stombaugh J, et al. (2010)QIIME allows analysis of high-throughput communitysequencing data. Nat Methods 7, 335–336.
92 M. Candela et al.
Dow
nloaded from https://w
ww
.cambridge.org/core . IP address: 54.39.106.173 , on 01 Feb 2020 at 07:50:32 , subject to the Cam
bridge Core terms of use, available at https://w
ww
.cambridge.org/core/term
s . https://doi.org/10.1017/S0007114516001045

27. Edgar RC (2010) Search and clustering orders of magnitudefaster than BLAST. Bioinformatics 26, 2460–2461.
28. Langille MGI, Zaneveld J, Caporaso JG, et al. (2013) Predictivefunctional profiling of microbial communities using 16S rRNAmarker gene sequences. Nat Biotechnol 31, 814–821.
29. Kanehisa M, Goto S, Sato Y, et al. (2012) KEGG for integrationand interpretation of large-scale molecular data sets.Nucleic Acids Res 40, D109–D114.
30. Asnicar F, Weingart G, Tickle TL, et al. (2015) Compactgraphical representation of phylogenetic data and metadatawith GraPhlAn. PeerJ 3, e1029.
31. Lozupone CA, Stombaugh J, Gonzalez A, et al. (2013)Meta-analyses of studies of the human microbiota. GenomeRes 23, 1704–1714.
32. Marchesi JR, Dutilh BE, Hall N, et al. (2011) Towards thehuman colorectal cancer microbiome. PLoS ONE 6, e20447.
33. Morgan XC, Tickle TL, Sokol H, et al. (2012) Dysfunction ofthe intestinal microbiome in inflammatory bowel disease andtreatment. Genome Biol 13, R79.
34. Thams P & Capito K (1999) L-arginine stimulation of glucose-induced insulin secretion through membrane depolarizationand independent of nitric oxide. Eur J Endocrinol 140, 87–93.
35. Holmes E, Loo RL, Stamler J, et al. (2008) Human metabolicphenotype diversity and its association with diet and bloodpressure. Nature 453, 396–400.
36. Nicholson JK, Holmes E, Kinross J, et al. (2012) Host-gutmicrobiota metabolic interactions. Science 336, 1262–1267.
37. Sorrell TC, Muller M & Sztelma K (1992) Bacterial metabolismof human polymorphonuclear leukocyte-derivedarachidonic acid. Infect Immun 60, 1779–1785.
38. Ridley CP, Lee HY & Khosla C (2008) Evolution of polyketidesynthases in bacteria. Proc Natl Acad Sci U S A 105,4595–4600.
39. Faber F & Bäumler AJ (2014) The impact of intestinalinflammation on the nutritional environment of the gutmicrobiota. Immunol Lett 162, 48–53.
40. Wieland Brown LC, Penaranda C, Kashyap PC, et al. (2013)Production of α-galactosylceramide by a prominent memberof the human gut microbiota. PLoS Biol 11, e1001610.
41. Biagi E, Nylund L, Candela M, et al. (2010) Through ageing,and beyond: gut microbiota and inflammatory status in seniorsand centenarians. PLoS ONE 5, e10667.
42. Tong M, Li X, Wegener Parfrey L, et al. (2013) A modularorganization of the human intestinal mucosal microbiota andits association with inflammatory bowel disease. PLOS ONE 8,e80702.
43. Joossens M, Huys G, Cnockaert M, et al. (2011) Dysbiosis ofthe faecal microbiota in patients with Crohn’s disease andtheir unaffected relatives. Gut 5, 631–637.
44. Karlsson FH, Fåk F, Nookaew I, et al. (2012) Symptomaticatherosclerosis is associated with an altered gut metagenome.Nat Commun 3, 1245.
45. Jiang W, Wu N, Wang X, et al. (2015) Dysbiosis gut microbiotaassociated with inflammation and impaired mucosal immunefunction in intestine of humans with non-alcoholic fatty liverdisease. Sci Rep 5, 8096.
46. Kamada N, Seo SU, Chen GY, et al. (2013) Role of the gutmicrobiota in immunity and inflammatory disease. Nat RevImmunol 13, 321–335.
47. Qin J, Li Y, Cai Z, et al. (2012) A metagenome-wide associa-tion study of gut microbiota in type 2 diabetes. Nature 490,55–60.
48. Flint HJ, Duncan SH, Scott KP, et al. (2015) Links betweendiet, gut microbiota composition and gut metabolism.Proc Nutr Soc 74, 13–22.
49. Russell WR, Hoyles L, Flint HJ, et al. (2013) Colonic bacterialmetabolites and human health. Curr Opin Microbiol 16, 246–254.
50. Trompette A, Gollwitzer ES, Yadava K, et al. (2014) Gutmicrobiota metabolism of dietary fiber influences allergicairway disease and hematopoiesis. Nat Med 20, 159–166.
51. Segain JP, Raingeard de la Blétière D, Bourreille A, et al. (2000)Butyrate inhibits inflammatory responses through NFkappaBinhibition: implications for Crohn’s disease. Gut 47, 397–403.
52. Johnson AMF & Olefsky JM (2013) The origins and drivers ofinsulin resistance. Cell 152, 673–684.
53. Sonnenburg ED & Sonnenburg JL (2014) Starving our micro-bial self: the deleterious consequences of a diet deficient inmicrobiota-accessible carbohydrates. Cell Metab 20, 779–786.
54. Everard A, Belzer C, Geurts L, et al. (2013) Cross-talk betweenAkkermansia muciniphila and intestinal epithelium controlsdiet-induced obesity. Proc Natl Acad Sci U S A 110, 9066–9071.
55. Xu J, Lian F, Zhao L, et al. (2015) Structural modulation of gutmicrobiota during alleviation of type 2 diabetes with a Chineseherbal formula. ISME J 9, 552–562.
56. Brahe LK, Le Chatelier E, Prifti E, et al. (2015) Specific gutmicrobiota features and metabolic markers in postmenopausalwomen with obesity. Nutr Diabetes 5, e159.
57. Donath MY & Shoelson SE (2011) Type 2 diabetes as aninflammatory disease. Nat Rev Immunol 11, 98–107.
58. Schnorr SL, Candela M, Rampelli S, et al. (2014) Gutmicrobiome of the Hadza hunter-gatherers. Nat Commun 5,3654.
Gut microbiota and diet in type 2 diabetes 93
Dow
nloaded from https://w
ww
.cambridge.org/core . IP address: 54.39.106.173 , on 01 Feb 2020 at 07:50:32 , subject to the Cam
bridge Core terms of use, available at https://w
ww
.cambridge.org/core/term
s . https://doi.org/10.1017/S0007114516001045