modis burned area user guide
TRANSCRIPT

MODIS Collection 5.1 Burned Area
Product - MCD45
User’s Guide
Version 3.0.1, May 2013
Luigi Boschetti, University of Idaho
David Roy, South Dakota State University
Anja A. Hoffmann, LM University of Munich
Michael Humber, University of Maryland

Collection 5 MODIS Burned Area product
User Guide Version 3.0.1, May 2013
i
CONTACTS OF TECHNICAL RESOURCE PERSONS
Topic Contact
Data format Luigi Boschetti [email protected]
Algorithm description David [email protected]
Geotiff in ArcGIS Michael [email protected]

Collection 5 MODIS Burned Area product
User Guide Version 3.0.1, May 2013
ii
ABBREVIATIONS AND ACRONYMS
BA Burned Area
BRDF Bidirectional Reflectance Distribution Function
CMG Climate Model Grid
EOS (NASA) Earth Observing System
EOSDIS EOS Data Information System
Geotiff Georeferenced Tagged Image File Format
HDF Hierarchical Data Format
LP-DAAC Land Processes Distributed Active Archive Center
MCD45 MODIS global burned area product
MODIS Moderate Resolution Imaging Spectrometer
NDVI Normalized Difference Vegetation Index
SDS Science Data Set
Sz Sun Zenith Angle
QA Quality Assessment
Vz View Zenith Angle

Collection 5 MODIS Burned Area product
User Guide Version 3.0.1, May 2013
iii
Table of Contents
CONTACTS OF TECHNICAL RESOURCE PERSONS ............................................................................................. I
ABBREVIATIONS AND ACRONYMS ........................................................................................................................ II
1 INTRODUCTION .............................................................................................................................................. 1
2 TERMINOLOGY OF THE MODIS BURNED AREA PRODUCT ................................................................. 1
2.1 Processing Levels (from the EOS data products handbook): .......................................................................................................... 1
2.2 Tiles ............................................................................................................................................................................................................. 2
2.3 Collections ................................................................................................................................................................................................. 3
2.3.1 Collection 5.1 Global Burned Area Product (MCD45A) Improvements over the previous Collection 5.0 Product . 3
2.4 MCD45 Nomenclature ............................................................................................................................................................................ 3
3 MCD45 PRODUCT SUITE ................................................................................................................................ 3
3.1 Level 3 Monthly Tiled Product: MCD45A1 ........................................................................................................................................ 4
3.2 Geotiff subset for GIS visualization and analysis: MCD45monthly ............................................................................................... 4
3.3 Shapefile subset for GIS visualization and analysis: MCD45monthly ............................................................................................ 6
3.4 Contents of the MODIS Burned Area Product ................................................................................................................................. 6
3.4.1 MCD45A1 Science Data Sets (SDS) .......................................................................................................................................... 6
3.4.2 MCD45A1 Metadata ..................................................................................................................................................................... 8
3.4.3 Geotiffs ............................................................................................................................................................................................ 9
3.4.4 Shapefiles ......................................................................................................................................................................................... 9
3.5 Forthcoming planned formats ............................................................................................................................................................... 9
4 OBTAINING THE PRODUCTS ...................................................................................................................... 10
4.1 Downloading the products via FTP ................................................................................................................................................... 10
4.2 Data structure on FTP server .............................................................................................................................................................. 11
4.2.1 HDF files ....................................................................................................................................................................................... 11
4.2.2 Geotiff files and Shapefiles ........................................................................................................................................................ 11
5 LOADING AND PROCESSING THE PRODUCT INTO ENVI 4.8 .............................................................. 11
5.1 MCD45A1 (hdf) ..................................................................................................................................................................................... 11
5.2 MCD45monthly (Geotiff) .................................................................................................................................................................... 12
5.3 MCD45monthly (Shapefile) ................................................................................................................................................................. 12
6 LOADING, DISPLAYING AND PROCESSING THE PRODUCT IN ARCGIS ........................................... 12
6.1 MCD45monthly (Geotiff) .................................................................................................................................................................... 12
6.1.1 Area of Interest (AoI) ................................................................................................................................................................. 13
6.2 MCD45montly (Shapefile) .................................................................................................................................................................... 14
7 CAVEATS AND KNOWN PROBLEMS ........................................................................................................... 15
8 USEFUL LINKS AND TOOLS ......................................................................................................................... 15
8.1 LP-DAAC Tools .................................................................................................................................................................................... 15
9 FREQUENTLY ASKED QUESTIONS ............................................................................................................ 15

Collection 5 MODIS Burned Area product
User Guide Version 3.0.1, May 2013
iv
10 CITATION ......................................................................................................................................................... 16
11 REFERENCES .................................................................................................................................................. 16
12 ALGORITHM BACKGROUND........................................................................................................................ 19
12.1 The Bidirectional Reflectance Model-based Expectation Approach ............................................................................................ 19
12.2 Temporal Implementation .................................................................................................................................................................... 21
12.2.1 Iterative Procedure for Identification of Burned Candidates .............................................................................................. 22
13 COORDINATE CONVERSION FOR THE MODIS SINUSOIDAL PROJECTION ................................... 25
13.1 Writing the World file for a MODIS tile ........................................................................................................................................... 26
List of Appendices
Appendix 1 Algorithm Background ........................................................................................................................................................ 18
Appendix 2 Coordinate conversion for the MODIS sinusoidal projection ..................................................................................... 24
Appendix 3 Coverage of the Geotiff subsets ......................................................................................................................................... 28
List of Tables
Table 1: Regions and bounding coordinates of the Geotiff subsets. ................................................................................................. 29
List of Figures
Figure 1: MODIS tiling scheme ................................................................................................................................................................... 2
Figure 2: Coverage of the Geotiff subsets. ................................................................................................................................................ 5
Figure 3: Display of Geotiff from August 2010, Window 20. .............................................................................................................. 13
Figure 4: Export Raster data ....................................................................................................................................................................... 14
Figure 5: Display of Shapefile from October 2002, Window 20. ....................................................................................................... 15
Figure 6: Coverage of Geotiff subsets ...................................................................................................................................................... 30

Collection 5 MODIS Burned Area product
User Guide Version 3.0.1, May 2013
1
1 Introduction
Mapping the timing and the extent of fires is important as fire is a prominent change agent
affecting ecosystem structure and the cycling of carbon and nutrients as well as is a
globally-significant cause of greenhouse gas emission. Satellite data have been used to
monitor biomass burning at regional and global scale for more than two decades using
algorithms that detect the location of active fires at the time of satellite overpass and in the
last decade using burned area algorithms that map directly the spatial extent of the area
affected by fires. Previously and in the absence of accurate burned area products, burned
area assessments have been created based on calibrating the available active fire data from
regional AVHRR and global MODIS data. However several remote sensing,
environmental, and fire behavior factors limit the accuracy of such derived fire affected
area data sets.
The availability of robustly calibrated, atmospherically corrected, cloud-screened,
geolocated data provided by the latest generation of moderate resolution remote sensing
systems allows for major advances in satellite mapping of fire affected area. A
complementary MODIS algorithm defined to map fire affected area has been developed
and the first global burned area product from 2000 onwards is now being generated as part
of the MODIS Land collection 5 product suite.
This document provides practical information about the MODIS Burned Area Product
(MCD45), including product and algorithm description, ordering and download
procedures, data layer descriptions, and known problems. The guide also provides a few
examples on how to perform basic operations with the product using some widely used
software packages.
2 Terminology of the MODIS Burned Area Product
This section explains some of the standard technical terms used in the documentation of
the standard MODIS products.
2.1 Processing Levels (from the EOS data products handbook):
Level 0 - Reconstructed unprocessed instrument/payload data at full resolution;
any and all communications artifacts (e.g., synchronization frames,
communications headers) removed.
Level 1A - Reconstructed unprocessed instrument data at full resolution, time-
referenced, and annotated with ancillary information, including radiometric and

Collection 5 MODIS Burned Area product
User Guide Version 3.0.1, May 2013
2
geometric calibration coefficients and georeferencing parameters (e.g., platform
ephemeris) computed and appended, but not applied, to the Level 0 data.
Level 1B - Level 1A data that have been processed to sensor units (not all
instruments have a Level 1B equivalent).
Level 2 - Derived geophysical variables at the same resolution and location as the
Level 1 source data.
Level 3 - Variables mapped on uniform space-time grid scales, usually with some
completeness and consistency.
Level 4 - Model output or results from analyses of lower level data (e.g., variables
derived from multiple measurements).
2.2 Tiles
MODIS Level 2 and higher products are defined on a global 250 m, 500 m, or 1 km
sinusoidal grid where spatial resolution is defined by the individual products (Level 0 and 1
are granule-based, a simple unprojected segment of the MODIS orbital swath). Grids are
divided into fixed-area tiles of approximately 10 degrees x 10 degrees in size. Each tile is
assigned a horizontal (h) and vertical (v) coordinate ranging from 0 to 35 and 0 to 17
respectively (Figure 1). The tile in the upper left corner is designated as h0,v0. A detailed
description of the sinusoidal projection, and all the formulas needed for transformations
between tile and geographic coordinates is provided in Appendix II.
Figure 1: MODIS tiling scheme

Collection 5 MODIS Burned Area product
User Guide Version 3.0.1, May 2013
3
2.3 Collections
Reprocessing of the entire MODIS data archive is performed periodically so as to
incorporate better calibration, algorithm refinements, and improved upstream products
into all MODIS products. The updated MODIS data archive resulting from each
reprocessing is referred to as a collection. Later collections supersede all earlier collections.
The MCD45 MODIS Burned Area Product was not produced in Collections 1 through 4.
It was produced for the first time as part of Collection 5, and it is available for the whole
MODIS record (2000 to present).
2.3.1 Collection 5.1 Global Burned Area Product (MCD45A) Improvements over the
previous Collection 5.0 Product
The Collection 5.1 product generation algorithm improves on the Collection 5.0 algorithm
by:
- correction of a known issue related to the handling of the input MODIS thermal band
data, which was causing omission errors on surfaces with temperatures greater than 327.7
K.
- removal of all MODIS band6 (mid-IR, 1550-1750 nm) multi-temporal tests, which were
causing omission errors over certain forest and agricultural areas.
- introduction of mono-temporal spectral tests to reduce burned commission errors
primarily associated with agriculture.
- ingest of the latest Collection 5.1 MODIS land cover product that has improved
accuracy and is generated at 500m rather than 1km resolution
- refinement of the “Burned Area Pixel QA” science data sets to include new setting: QA
= 5 to indicate burned areas detected in agriculture, which should be treated as low
confidence because of the inherent issues in mapping agricultural burned areas reliably.
2.4 MCD45 Nomenclature
All MODIS products are identified by an alphanumeric code of three letters and two
numbers. The three letters define the data source, while the two numbers identity uniquely
the product. The burned area product is named MCD45: MCD indicates that both
MODIS Aqua and Terra data are used as input, and 45 is the identifier of the burned area
product.
3 MCD45 Product Suite
Three different versions of the MODIS burned area product are available:

Collection 5 MODIS Burned Area product
User Guide Version 3.0.1, May 2013
4
1. The official MCD45A1 in HDF-EOS format, which is available as part of the MODIS
suite of global land products.
2. The re-projected monthly Geotiff version available from the University of Maryland.
3. The re-projected monthly Shapefile version available from the University of Maryland.
3.1 Level 3 Monthly Tiled Product: MCD45A1
The MCD45A1 Burned Area Product is a monthly Level 3 gridded 500 m product
containing per-pixel burning and quality information, and tile-level metadata. Product users
are provided with a variety of quality assessment information and a single summary quality
assessment score for each pixel. A detailed description of the product is provided in
section 4.
All the standard MODIS products adopt a nomenclature that provides information about
the spatial and temporal coverage of the product, as well as about the version of the
product. An example filename of the product is:
MCD45A1.A2000306.h16v07.051.2006360205845.hdf
which can be read as:
a) MCD45A1 = MODIS level 3 Monthly tiled burned area product
b) A2000306 = year and Julian date of the starting day of the month covered by the
product: 306 is the Julian date of Nov 1, hence 2000306 means that the product
covers November 2000.
c) h16v07 = spatial extent: the file covers tile h16v07
d) 051 = version identifier. 051 indicates Collection 5.1
e) 2006360205845= processing day and time (year 2006, Julian day 360, 20h58'45'')
This naming convention ensures that files always have a unique name: if a tile is
reprocessed the last number, indicating the day and time in which the file was processed,
will be different, thus avoiding any confusion with obsolete data.
The Julian day is defined as a dating system that divides the year into 12 months and 365
days (leap year 366 days) and a table can be found for example here:
regular years: http://www.quadax.com/Support/Julian2009.pdf
leap years: http://www.quadax.com/Support/Julian2008.pdf
3.2 Geotiff subset for GIS visualization and analysis: MCD45monthly
A user-friendly Geotiff version of the MCD45 product is derived from the standard
MCD45A1 hdf version by University of Maryland. The Geotiffs are reprojected in Plate-

Collection 5 MODIS Burned Area product
User Guide Version 3.0.1, May 2013
5
Carrée projection and cover a set of sub-continental windows (Figure 2). A table
containing the regions covered and bounding coordinates of the 24 windows (plus one
sub-window) is available in Appendix III.
Figure 2: Coverage of the Geotiff subsets.
A high resolution version of the map, as well as a table with the bounding coordinates, is
available in appendix III.
The Geotiffs follow a naming convention similar to the official MCD45A1 product.
However, as the Geotiffs are obtained by mosaicing, resampling and reprojecting several
tiles of the original product, the processing time is not available.
An example of filename of the product is:
MCD45monthly.A2000306.Win01.051.burndate.tif
MCD45monthly.A2000306.Win01.051.ba_qa.tif
which can be read as:
a) MCD45monthly = monthly Geotiff version of MCD45A1
b) A2000306 = year and Julian date of the starting day of the month covered by the
product: 306 is the Julian date of Nov 1, hence 2000306 means that the product
covers November 2000.
c) Win01 = spatial extent: the file covers window 1 (Alaska)

Collection 5 MODIS Burned Area product
User Guide Version 3.0.1, May 2013
6
d) 051 = version identifier. 051 indicates Collection5.1
e) burndate/ba_qa = content of the file: unlike hdf, Geotiff files contain a single layer.
At the moment, two layers of the original product are available as Geotiffs:
"burndate" and "QA". See 3.4.3 for details.
3.3 Shapefile subset for GIS visualization and analysis: MCD45monthly
A shapefile version of the MCD45 product is derived from the monthly Geotiff version by
the University of Maryland. The shapefiles are available with the same projection (Plate-
Carrée) and geographic extent as the Geotiff sub-continental windows (Figure 2).
The shapefile naming convention is identical to the Geotiff naming convention. Each
shapefile consists of multiple files which must remain in the same location relative to one
another. An example of a shapefile, as available from the University of Maryland FTP,
includes the following:
MCD45monthly.A2000306.Win01.051.burndate.shp
MCD45monthly.A2000306.Win01.051.burndate.shx
MCD45monthly.A2000306.Win01.051.burndate.prj
MCD45monthly.A2000306.Win01.051.burndate.dbf
which can be read as:
a) MCD45monthly = monthly shapefile version of MCD45A1
b) A2000306 = year and Julian date of the starting day of the month covered by the
product: 306 is the Julian date of Nov 1, hence 2000306 means that the product
covers November 2000.
c) Win01 = spatial extent: the file covers window 1 (Alaska)
d) 051 = version identifier. 051 indicates Collection5.1
e) burndate = content of the file. Only the “burndate” layer is available in the
shapefile format. See 3.4.4 for details.
3.4 Contents of the MODIS Burned Area Product
The following text describes the content of the files; some of the layers of the product require
knowledge of how the algorithm used for the production works; the detailed description of the
algorithm can be found in Appendix I.
3.4.1 MCD45A1 Science Data Sets (SDS)
The product is distributed in the standard MODIS land format (HDF), and includes the following
ten data Science Data Sets (i.e. layers), defining for each 500m pixel:

Collection 5 MODIS Burned Area product
User Guide Version 3.0.1, May 2013
7
1. Burn date (2 bytes): Approximate Julian day of burning from eight days before the
beginning of the month to eight days after the end of the month, or a code indicating
unburned areas, snow, water, or lack of data.
0 - unburned
1-366 - approximate Julian day of burning
900 – snow or high aerosol
9998 - water bodies (internal)
9999 - water bodies (seas and oceans)
10000 - not enough data to perform inversion throughout the period
2. BA pixel QA (1 byte): Confidence of the detection (1 (most confident) to 4 (least
confident)).
1 - most confidently detected pixels, regardless of direction in time (forward,
backward or both), passing test (4) described in appendix 1.
2 - pixels where backward and forward direction in time predict the same
change, passing test (5) described in appendix I.
3 - pixels selected in the first stage of the contextual analysis.
4 - pixels selected in the second stage of the contextual analysis.
5 - detections over agricultural areas, according to the MCD12 land cover mask.
Users are advised not to use those detections in any quantitative analysis, due to
the low accuracy of burned area detection when fire is due to agricultural
practices.
3. Number of Passes (1 byte): Number of observations where the temporal consistency
test is passed.
4. Number Used (1 byte): Number of observations used in the temporal consistency test.
5. Direction (1 byte): Direction in time in which burning was detected (forward, backward
or both).
1 - forward
2 - backward
3 - both
6. Surface Type (1 byte): Information describing the land cover type and properties. The
information is stored in the individual bits of the layer.
bit 0 (1=yes, 0=no): - water (NDVI < 0.1 and b7 < 0.04)
bit 1 (1=yes, 0=no) - low NDVI (NDVI < 0.1)

Collection 5 MODIS Burned Area product
User Guide Version 3.0.1, May 2013
8
bit 2 (1=yes, 0=no) - shallow, ephemeral, deep inland water (QA from MOD09
= 3, 4, 5 AND NDVI <0.1)
bit 3 (1=yes, 0=no) - cloud (from MOD09 internal cloud mask)
bit 4 (1=yes, 0=no) - cloud shadow (from MOD09 internal cloud mask)
bit 5 (1=yes, 0=no) - view and solar zenith angle mask (Vz > 65 threshold or Sz
> 65)
bit 6 (1=yes, 0=no) - high view and solar zenith angle (Vz > 50 and Sz > 55 )
bit 7(1=yes, 0=no) - snow OR [high aerosol (from MOD09 QA) AND high
view / solar zenith (Vz > 55 and Sz > 55)]
Example: if the Surface Type value of a pixel is 18, the corresponding binary number is
01001000; as bits 1 and 4 are set to 1, it means low NDVI and cloud shadow detected.
7. Gap Range 1 (2 bytes): Information describing the largest number of consecutive
missing/cloudy days (if any) in the time series and the start day of the missing/cloudy
period.
bits 0-8 - Julian day of the start of the gap
bits 9-13 - number of missing days including the start day
Example: if the pixel value is 3372, the corresponding binary number is 001101001011000.
The first nine bits (001101001) represent the number 300, the four following bits (0110)
represent the number 6. Hence a six day gap starting at Julian day 300.
8. Gap Range 2 (2 bytes): Information describing the second largest number of consecutive
missing/cloudy days (if any) in the time series and the start day of the missing period.
bits 0-8 - Julian day of the start of the gap
bits 9-13 - number of missing days including the start day
3.4.2 MCD45A1 Metadata
In addition to the mandatory metadata required by the EOS Data Information System (EOSDIS)
Core System (ECS), a set of product specific, tile-level metadata are included to enable the burned
area product to be archived and ordered via ECS DAAC ordering systems.
The metadata report for each tile includes:
The percentage of land pixels detected as burned.
The percentage of pixels not processed due to insufficient cloud-free data.
The percentage of pixels in each of the “BA pixel QA” categories.
The number of pixels detected in each direction in time (forward, backward or
both).
Collection 5 MODIS Burned Area product
User Guide Version 3.0.1, May 2013
9
3.4.3 Geotiffs
Only two SDSs (layers) are available in Geotiff format. As explained in 3.2, for each month two files
are available, one for each SDS:
1. Burn date (2 bytes): Approximate Julian day of burning within the month, or a code
indicating unburned areas, snow, water, or lack of data. Unlike the HDF version of the
product, the GEOTIFFS do not include any overlap between consecutive months.
The temporal filtering is described in Roy et al., 2008.
0 - unburned
1-366 - approximate Julian day of burning within the month
900 – snow or high aerosol
9998 - water bodies (internal)
9999 - water bodies (seas and oceans)
10000 - not enough data to perform inversion throughout the period
-32768 - pixel not covered by any MODIS tile
2. BA pixel QA (1 byte): Confidence of the detection (1 (most confident) to 4 (least
confident)).
1 - most confidently detected pixels, regardless of direction in time (forward,
backward or both), passing test (4) described in Appendix 1.
2 - pixels where backward and forward direction in time predict the same
change, passing test (5) described in section 4.1
3 - pixels selected in the first stage of the contextual analysis
4 - pixels selected in the second stage of the contextual analysis
3.4.4 Shapefiles
Only the “Burn date” SDS is available in shapefile format. Burn date values are stored in the
“burndate” field of the shapefile. Unlike the burn date value in the Geotiff version, the shapefile
burn date values include only the approximate Julian day of burning within the month, with values
ranging from 1-366. All other values are discarded in the shapefile version of the MCD45monthly
product. For the discrimination between unburned and unmapped areas, users are
recommended to download the HDF or GEOTIFF version of the product
3.5 Forthcoming planned formats
1. MCD45 Climate Model Grid (CMG) Aggregated Burned Area Product

Collection 5 MODIS Burned Area product
User Guide Version 3.0.1, May 2013
10
This product is currently under development. Data format information will be included at the time
of product release.
2. MCD45 Yearly Synthesis Burned Area Product
This product is currently under development. Data format information will be included at the time
of product release.
4 Obtaining the products
All MODIS products are available free of charge. The MODIS Burned Area Product is available for
ordering from the Land Processes Distributed Active Archive Center (LP-DAAC) using the EOS
Data Gateway web interface located at:
http://reverb.echo.nasa.gov
Additionally, an ftp server is maintained by the University of Maryland, mostly to provide support to
the science users who need to download systematically large volumes of data.
4.1 Downloading the products via FTP
The MODIS burned area product is available for download via ftp from the website
http://modis-fire.umd.edu/
We request users to fill in a user online form for statistical purposes and in order to obtain username
and password for the server. The form is available under
http://modis-fire.umd.edu/form.asp
You are asked to enter your name, affiliation and a short description of the intended use of the
product. A username and password is sent to your given e-mail address. Once you have received
your username and password you can start retrieving the data either in HDF or Geotiff format.
For downloading the data via FTP you can use your current web browser such as the FTP extension
of Firefox or Internet Explorer. However we recommend using special FTP software for
downloading large amounts of data. You can use freely available software such as FileZillaClient or
SmartFTP, which has the advantage that you can schedule your download to start at a later time and
if you download multiple sources, it will try to download different portions from them to speed up.
http://filezilla-project.org/download.php
http://www.smartftp.com/
Whichever program you will use for data download you will need to connect to the given ftp site
that is:
ftp://ba1.geog.umd.edu

Collection 5 MODIS Burned Area product
User Guide Version 3.0.1, May 2013
11
4.2 Data structure on FTP server
The HDF, Geotiff, and shapefile data sets are available on the same FTP server. However, the
subdirectory structure is different and is described in the following paragraphs.
4.2.1 HDF files
The file system on the ftp server is structured to organize the data hierarchically by year and by
month. All the data from the same month is located in a directory identified by the year and month
as:
/Collection51/HDF/YYYY/DDD/
where:
YYYY is the year
DDD is the julian day of the beginning of the month
For example, the directory /Collection51/HDF/2001/182 contains all the Collection 5.1
tiles (named with the convention explained in 3.1) of the product for July 2001.
4.2.2 Geotiff files and Shapefiles
The file system on the ftp server is structured to organize the data hierarchically by window, and
then by year. All the data for the same window from the same year is located (for Geotiff files and
shapefiles, respectively) in a directory identified as:
/Collection51/TIF/WinXX/YYYY/
/Collection51/SHP/WinXX/YYYY/
where:
XX is the number of the window (figure 2)
YYYY is the year
For example, the directory /Collection51/TIF/Win01/2001 contains all of the Collection
5.1 Geotiff files for months of 2001 for window 01 (Alaska).
5 Loading and processing the product into ENVI 4.8
5.1 MCD45A1 (hdf)
HDF MODIS products are only partially supported in ENVI.
To open them, instead of the File -> Open Image File menu, it is necessary to select
File -> Open External Files -> Generic Formats -> HDF

Collection 5 MODIS Burned Area product
User Guide Version 3.0.1, May 2013
12
Opened as generic HDF, the files lose any geographic information. To restore it, it is necessary to
enter manually the projection parameters.
Alternatively, it is possible to download and install the MODIS conversion toolkit developed by
EXELIS:
http://www.exelisvis.com/language/en-US/UserCommunity/CodeLibrary.aspx
5.2 MCD45monthly (Geotiff)
The Geotiff files are fully compatible with ENVI. To open them, it is possible to go simply through
the File -> Open Image File menu.
5.3 MCD45monthly (Shapefile)
Shapefiles are not directly supported in ENVI, rather they are converted to the ENVI Vector File
(.evf) format, then displayed on the screen. To load a shapefile, select
Vector -> Open Vector File -> Change file formats to Shapefile or All -> Select Shapefile
When prompted to set “Import Vector Files Parameters”, set the desired layer name and output file
location and select “OK”. Do not adjust the projection information, the default values correspond
to the Plate-Carrée projection used by the Geotiff files.
Use the “Available Vectors List” (Vector -> Available Vectors List) to overlay the vector on an
existing display or display it in its own window.
6 Loading, displaying and processing the product in ArcGIS
Handling EOS-hdf files is not straightforward in ArcGIS. For the users of the official EOS-HDF
product, we recommend to perform any scientific analysis in other software packages (e.g. ENVI)
and then export to ArcGIS in a different format such as Geotiff.
6.1 MCD45monthly (Geotiff)
The Geotiffs can directly be loaded into ArcGIS through
-> Add Layer
In order to display the burned areas only, under
> Layer Properties> Unique Values >Symbology
Set the color to “No Color” for the following Values:
0 - unburned
900 – snow or high aerosol
9998 - water bodies (internal)

Collection 5 MODIS Burned Area product
User Guide Version 3.0.1, May 2013
13
9999 - water bodies (seas and oceans)
10000 - not enough data to perform inversion throughout the period
-32,768 – no data
ArcGIS will display the burned area in Julian days of the given month in either individual
colors or in the same color depending on your settings. Figure 3 shows an example of
MCD45monthly.A2010213.Win20.005.burndate.tif
Figure 3: Display of Geotiff from August 2010, Window 20.
Each burn day of the month is shown in different colors
6.1.1 Area of Interest (AoI)
In order to reduce file size of the regional Geotiff and focus on a specific region an “Area of
Interest (AoI)” can be subset.
->Display desired AoI
->Right mouse click data layer
->Data -> Export Data

Collection 5 MODIS Burned Area product
User Guide Version 3.0.1, May 2013
14
The “Export Raster Data” window will open (figure 4). Check both data frames options to current
and choose Format (TIFF).
Figure 4: Export Raster data
6.2 MCD45montly (Shapefile)
The Shapefiles can directly be loaded into ArcGIS through
-> Add Layer
To change the appearance of the file, select
Layer Properties -> Symbology -> Graduated Colors
Optionally, to remove the outlines of the data, right click a symbol in the Graduated
Colors panel and select “Properties For All Symbols”, then set “Outline Color” to “No
Color”.

Collection 5 MODIS Burned Area product
User Guide Version 3.0.1, May 2013
15
Figure 5: Display of Shapefile from October 2002, Window 20.
Left: True-color (R, G, B) Landsat 7 scene acquired October 30, 2002 at path 98, row 71.
Right: MCD45monthly October Shapefile superimposed over the burned area. Older burned areas
are shown in blue tones, newer burns are shown in red tones.
7 Caveats and Known Problems
The MODIS instrument had a prolonged outage in June 2001. As a consequence, not enough input
data is available for the production of MCD45A1 for that month.
8 Useful Links and Tools
8.1 LP-DAAC Tools
A comprehensive set of tools for handling, converting and reprojecting MODIS products in hdf
format is available at:
https://lpdaac.usgs.gov/tools
9 Frequently Asked Questions
I cannot order the MCD45A1 product for June 2001. Why is it not online?
The MODIS instrument had a prolonged outage in June 2001. As a consequence, not
enough input data is available for the production of MCD45A1 for that month.
I downloaded some MCD45A1 data in hdf format. When I open it, I see several layers.
Which one shall I start looking at?

Collection 5 MODIS Burned Area product
User Guide Version 3.0.1, May 2013
16
For most of the users, the relevant information is the location of the burned pixels, and the
day of burning. This data is contained in the first layer (SDS in the MODIS jargon), called
'burndate'.
When I try to open a file in ENVI, I get an error message "unsupported MODIS
product"?
You can either open the file as generic HDF with:
File -> Open External Files -> Generic Formats -> HDF
or install the MODIS conversion toolkit from the EXELIS website:
http://www.exelisvis.com/language/en-US/UserCommunity/CodeLibrary.aspx
I received the username and password for the ftp server, I clicked on the link and
nothing happens. What shall I do?
FTP servers do not work like normal webpages. You need an ftp client (a list is given in
paragraph 4.1) and you need to read careful the documentation of the ftp client to
understand how to download data.
10 Citation
The MODIS burned area product, and the details of the algorithm, are described in the following
papers. They should be referenced when using the MODIS burned area product:
D.P. Roy, L. Boschetti, C.O. Justice, J. Ju. 2008. The Collection 5 MODIS
Burned Area Product - Global Evaluation by Comparison with the MODIS Active
Fire Product. Remote Sensing of Environment, 112, 3690-3707. (PDF file, 4.5MB)
Roy, D.P., Jin, Y., Lewis, P.E., Justice, C.O. 2005. Prototyping a global algorithm
for systematic fire-affected area mapping using MODIS time series data. Remote
Sensing of Environment, 97:137-162. (PDF file, 4MB)
Roy D.P., Lewis P.E., Justice C.O. 2002. Burned area mapping using multi-
temporal moderate spatial resolution data - a bi-directional reflectance model-based
expectation approach. Remote Sensing of Environment, 83:263-286. (PDF file, 2.3 MB)
11 References
Journal Articles

Collection 5 MODIS Burned Area product
User Guide Version 3.0.1, May 2013
17
W. Lucht, Viewing the Earth from multiple angles: Global change and the science of
multiangular reflectance, Reflection Properties of Vegetation and Soil with a BRDF Data
base, Eds. M. von Schonermark, B. Geiger, and H.P.Roser, Wissenschaft und
Technik Verlag, Berlin, 2004.
W. Lucht and P.E. Lewis, ”Theoretical noise sensitivity of BRDF and albedo
retrieval from the EOS-MODIS and MISR sensors with respect to angular
sampling”, International Journal of Remote Sensing, vol. 21, pp. 81-98, 2000.
W. Lucht and J.L. Roujean, “Consideration in parametric modeling of BRDF and
albedo from multi-angular satellite sensor observations”, Remote Sensing Reviews, vol.
18, pp. 343-379, 2000.
D.P. Roy, L. Giglio, J. Kendall and C.O. Justice, “Multitemporal active-fire based
burn scar detection algorithm,” International Journal of Remote Sensing, vol 20, pp. 1031-
1038, 1999.
D.P. Roy, P.E. Lewis and C.O. Justice, “Burned area mapping using multi-
temporal moderate spatial resolution data – a bi-directional reflectance model-based
expectation approach,” Remote Sensing of Environment, vol. 83, pp. 263-286, 2002.
D.P. Roy, Y. Jin, P.E. Lewis and C.O. Justice, “Prototyping a global algorithm
for systematic fire affected area mapping using MODIS time series data,” Remote
Sensing of Environment, vol. 97, pp. 137-162, 2005.
C.B. Schaaf, F. Gao, A.H. Strahler, W. Lucht, X. Li, T. Tsang, N. Strugnell, X.
Zhang, Y. Jin, J.-P. Muller, P.E. Lewis, M. Barnsley, P. Hobson, M. Disney,
G. Roberts, M. Dunderdale, R.P. d'Entremont, B. Hu, S. Liang, J. Privette,
and D.P. Roy, ”First Operational BRDF, Albedo and Nadir Reflectance Products
from MODIS,“ Remote Sensing of Environment, vol. 83, pp. 135-148, 2002.
E.F. Vermote, N.Z. El Saleous and C.O. Justice, “Operational atmospheric
correction of the MODIS data in the visible to middle infrared: First results” Remote
Sensing of Environment, vol. 83, pp. 97– 111, 2002.
P.J. Zarco-Tejada, C.A. Rueda and S.L. Ustin, “Water content estimation in
vegetation with MODIS reflectance data and model inversion methods” Remote
Sensing of Environment, vol. 85, pp. 109– 124, 2003.

Collection 5 MODIS Burned Area product
User Guide Version 3.0.1, May 2013
18
Appendix 1
Algorithm Background

Collection 5 MODIS Burned Area product
User Guide Version 3.0.1, May 2013
19
12 Algorithm Background
Burned areas are characterized by deposits of charcoal and ash, removal of vegetation, and alteration
of the vegetation structure (Roy et al. 1999). The MODIS algorithm to map burned areas takes
advantage of these spectral, temporal, and structural changes. The algorithm detects the approximate
date of burning at 500 m by locating the occurrence of rapid changes in daily surface reflectance
time series data. It is an improvement on previous methods through the use of a bidirectional
reflectance model to deal with angular variations found in satellite data and the use of a statistical
measure to detect change probability from a previously observed state (Roy et al. 2005). The
algorithm maps the spatial extent of recent fires only and excludes fires that occurred in previous
seasons or years.
The bidirectional reflectance model-based change detection algorithm developed for the MCD45
product is a generic change detection method that is applied independently to geolocated pixels over
a long time series (weeks to months) of reflectance observations (Roy et al. 2002, Roy et al. 2005).
Reflectance sensed within a temporal window of a fixed number of days are used to predict the
reflectance on a subsequent day. A statistical measure is used to determine if the difference between
the predicted and observed reflectance is a significant change of interest. Rather than attempting to
minimize the directional information present in wide field-of-view satellite data by compositing, or
by the use of spectral indices, this information is used to model the directional dependence of
reflectance. This provides a semi-physically based method to predict change in reflectance from the
previous state.
12.1 The Bidirectional Reflectance Model-based Expectation Approach
Methods have been developed to model the BRDF with a limited number of parameters and then to
estimate the model parameters from a finite set of remotely sensed observations (Lucht 2004). The
semi-empirical RossThick-LiSparse reciprocal BRDF model is used for the MODIS global burned
area product as it performs robustly in the global MODIS BRDF/albedo product (Schaaf et al.
2002). Like other linear kernel-driven models it allows analytical model inversion with an estimate of
uncertainty in the model parameters and linear combinations thereof (Lucht and Roujean 2000,
Lucht and Lewis 2000). At each geolocated pixel the three parameter RossThick-LiSparse reciprocal
BRDF model is inverted against m 7 reflectance observations sensed in a temporal window of
n ( 16) days duration. The BRDF model parameters are used to compute predicted reflectance and
uncertainties for the viewing and illumination angles of a subsequent observation. A Z-score is used
as a normalized measure related to the probability of the new observation belonging to the same set
as that used in the BRDF model inversion:

Collection 5 MODIS Burned Area product
User Guide Version 3.0.1, May 2013
20
,,,,newZ (1)
we
122
where:
Z is the Z-score value,
,,new is the new reflectance observation,
,, is the model predicted reflectance at wavelength computed by
analytical inversion of the BRDF model against previous reflectance
observations,
and ' are the viewing and illumination vectors respectively of the new
reflectance observation,
is a fixed pre-assigned estimate of the noise in ,,new defined by
Vermote et al. (2002),
e is the root mean squared of the residuals of the BRDF inversion (used as an
estimate of noise in the observations and the lack of ability of the model to fit
the measurements), and
w is the 'weight of determination' of ,,new (Lucht and Lewis 2000).
Z is adaptive to the viewing and illumination angles of the new observation, as well as the angular
distribution, amount of noise, and number of observations used in the BRDF inversion. The Z-
score is computed for MODIS bands 2 and 5 as these bands are both sensitive to burning and
experience a decrease in reflectance post-fire. A new observation is considered as a burn candidate
if:
( 2bandZ< - threshZ
) OR ( 5bandZ< - threshZ
) (2)
where:
bandZ is the Z-score defined (1) and
threshZ is a fixed wavelength independent threshold
and if:
,,5band-
,,7band >
,,5bandnew -
,,7bandnew (3)
AND

Collection 5 MODIS Burned Area product
User Guide Version 3.0.1, May 2013
21
,,2band-
,,7band >
,,2bandnew -
,,7bandnew
where ,,new is the new reflectance observation and ,, is the model predicted
reflectance computed by analytical inversion of the BRDF model against m 7 previous
reflectance observations. The justification for equation (3) is that burning causes a reduction in band
2 and 5 reflectance but less change in band 7 reflectance, whereas persistent cloud, shadow, or soil
moisture changes would have a similar effect in both bands. Band 2 helps to remove changes
associated with increasing plant water content which is negatively related to band 5 and 7 reflectance
but not band 2 reflectance (Zarco-Tejada et al. 2003). In this work Zthresh = 3.0 to detect only
those reflectance changes that fall outside of the expected reflectance variation modeled from
previous values (the probability that Z < -3.0 is ~0.0013).
12.2 Temporal Implementation
The computation (equations 1-3) is repeated independently for each geolocated pixel, moving
through the reflectance time series in daily steps to detect change. A temporal constraint is used to
differentiate between temporary changes, such as shadows, undetected residual clouds, soil moisture
changes and data artifacts, that pass (1) – (3) from fire-affected areas that have persistently lower
post-fire reflectance.
Gaps in the reflectance time series, for example due to cloud cover or bad quality input data, reduce
the temporal frequency of Z-score calculations as they reduce the number of observations available
for prediction and the number of windows that have sufficient observations for BRDF inversion.
To reduce the impact of gaps, the duration of the BRDF inversion window is allowed to increase
and the Z-score is computed not just for the subsequent day but for several subsequent days. The
duration of the BRDF inversion window is allowed to increase, from a minimum of n = 16 days up
to a maximum of (n + nextra) days, until there are at least 7 observations. When there are fewer than 7
observations no inversion is performed. In this way, more BRDF inversions may be performed in
the presence of missing data, providing more opportunities for detecting burning events. At each
window containing 7 or more observations the BRDF parameters are used to compute Z-scores for
the non-missing observations sensed on the following Ssearch days. If within the following Ssearch days a
burn candidate is found, i.e. criteria (1) - (3) are met, then the Z-scores continue to be computed for
Stest days after the first burn candidate.
For each inversion window, the day that the first burn candidate was detected (Dayfirst), the
maximum of its band 2 and 5 Z-scores (Zfirst), and the total number of observations over the
subsequent Stest days that were considered (Nused) and detected as burned (Npass), are derived.
Different Dayfirst candidates may be detected due to sensitivity of the adaptive window duration and
multi-date prediction to gaps in the time series. In addition, the same geolocated pixel may burn on
separate dates. The results from the different inversion windows are ranked with respect to Npass and
Collection 5 MODIS Burned Area product
User Guide Version 3.0.1, May 2013
22
then Nused to provide results in order of the most evidence of persistent burning. If there are results
with equal Npass and Nused values then the one with the greatest Zfirst is ranked as more persistent.
Searching both forward and backward in time allows burn candidates to be detected in the Ssearch
days preceding or following periods of persistently missing data. This also allows burn candidates to
be detected in the first and last Ssearch days of the time series. Results for the forward and backward
directions are derived independently. When searching backward in time, an increase in reflectance in
the appropriate MODIS bands is searched for rather than a decrease in reflectance.
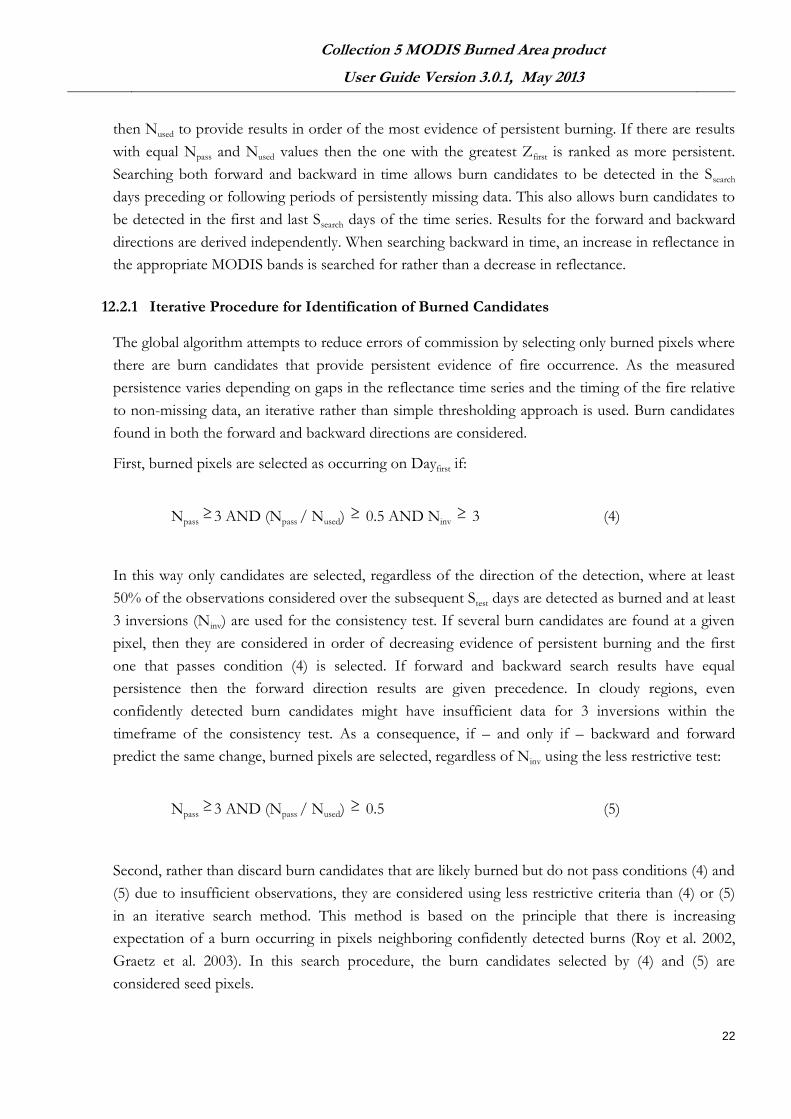
12.2.1 Iterative Procedure for Identification of Burned Candidates
The global algorithm attempts to reduce errors of commission by selecting only burned pixels where
there are burn candidates that provide persistent evidence of fire occurrence. As the measured
persistence varies depending on gaps in the reflectance time series and the timing of the fire relative
to non-missing data, an iterative rather than simple thresholding approach is used. Burn candidates
found in both the forward and backward directions are considered.
First, burned pixels are selected as occurring on Dayfirst if:
Npass 3 AND (Npass / Nused) 0.5 AND Ninv 3 (4)
In this way only candidates are selected, regardless of the direction of the detection, where at least
50% of the observations considered over the subsequent Stest days are detected as burned and at least
3 inversions (Ninv) are used for the consistency test. If several burn candidates are found at a given
pixel, then they are considered in order of decreasing evidence of persistent burning and the first
one that passes condition (4) is selected. If forward and backward search results have equal
persistence then the forward direction results are given precedence. In cloudy regions, even
confidently detected burn candidates might have insufficient data for 3 inversions within the
timeframe of the consistency test. As a consequence, if – and only if – backward and forward
predict the same change, burned pixels are selected, regardless of Ninv using the less restrictive test:
Npass 3 AND (Npass / Nused) 0.5 (5)
Second, rather than discard burn candidates that are likely burned but do not pass conditions (4) and
(5) due to insufficient observations, they are considered using less restrictive criteria than (4) or (5)
in an iterative search method. This method is based on the principle that there is increasing
expectation of a burn occurring in pixels neighboring confidently detected burns (Roy et al. 2002,
Graetz et al. 2003). In this search procedure, the burn candidates selected by (4) and (5) are
considered seed pixels.

Collection 5 MODIS Burned Area product
User Guide Version 3.0.1, May 2013
23
In the first set of iterations, non-seed pixels where burn candidates were detected that did not pass
conditions (4) or (5) are accepted as burned if they have two or more adjacent seed neighbors and if:
Dayfirst - Dayfirst_seed < Ngap AND Npass 2 AND (Npass / Nused) 0.25 (6)
where Dayfirst, Npass, and Nused are the values for the burn candidate that did not pass conditions (4) or
(5) and Dayfirst_seed is the mean Dayfirst value of the two to eight adjacent seed pixels. The Ngap
constraint ensures that only burn candidates that occur temporally as well as spatially close to the
neighboring seed pixels are considered. This procedure is repeated in an exhaustive iterative manner
with the pixels that passed condition (6) being considered as seeds for the next iteration until no
more burn candidates that pass (6) can be included. As with condition (4), if several burn candidates
are found at a given pixel then they are considered in order of decreasing evidence of persistent
burning until (6) is met. Again, if forward and backward search results have equal persistence then
the forward direction results are given precedence.
In the second part of the procedure, the residual burn candidates not selected in the previous steps
are considered if at least three neighbors have been selected. The average day of burning of the
neighbors is computed, and the pixel is accepted if the backward

Collection 5 MODIS Burned Area product
User Guide Version 3.0.1, May 2013
24
Appendix 2
Coordinate conversion for the MODIS
sinusoidal projection

Collection 5 MODIS Burned Area product
User Guide Version 3.0.1, May 2013
25
13 Coordinate conversion for the MODIS sinusoidal projection
Most software packages do not support fully the MODIS projected data; this appendix
provides some useful formulas for:
defining the MODIS map projection and associating a World file to a MODIS tile
calculating the image coordinates of a geographic point (direct problem)
calculating the geographic coordinates of a specific point of an image (inverse
problem).
The MODIS data are re-projected using an equiareal sinusoidal projection, defined on a
sphere of radius
=6371007.181 m,
and with the Greenwich meridian as the central meridian of the projection.
Defining (x, y) as the East and North coordinate in meters of a point in the map space, and
(, ) its latitude and longitude in degrees, the direct formulas is:
(1)
(2)
and the inverse formulas derive from (1) and (2) through simple mathematical passages:
(3)
(
)
(4)
The range of x and y can be determined easily:
xmin = x(=0, =-180) =- 20015109m (5)
xmax= x(=0, =180) = 20015109m (6)
ymin =y(=-90, =0) = -10007554m (7)
ymax=y(=90, =0) = 10007554m (8)
For the distribution of MODIS data, the sinusoidal map space is partitioned into 36 x 18
tiles of fixed location, each of them corresponding to 1200 x 1200 "1km" pixels, or 2400 x
2400 "500m" pixels or 4800 x 4800 "250m" pixels.
Equations 1 and 2 allow the conversion from the geographic space, to the map space.
However, to pass from the map space to the image coordinates we need a few more steps.
Each pixel is identified not by two, but by four coordinates: (i,j) being the column, row
coordinates of the pixel within the tile, and (h,v) being the horizontal and vertical
coordinates of the tile.
As 5 though 8 provide the range of x and y, the size t of the grid defining the tiles can be
calculated as:
Collection 5 MODIS Burned Area product
User Guide Version 3.0.1, May 2013
26
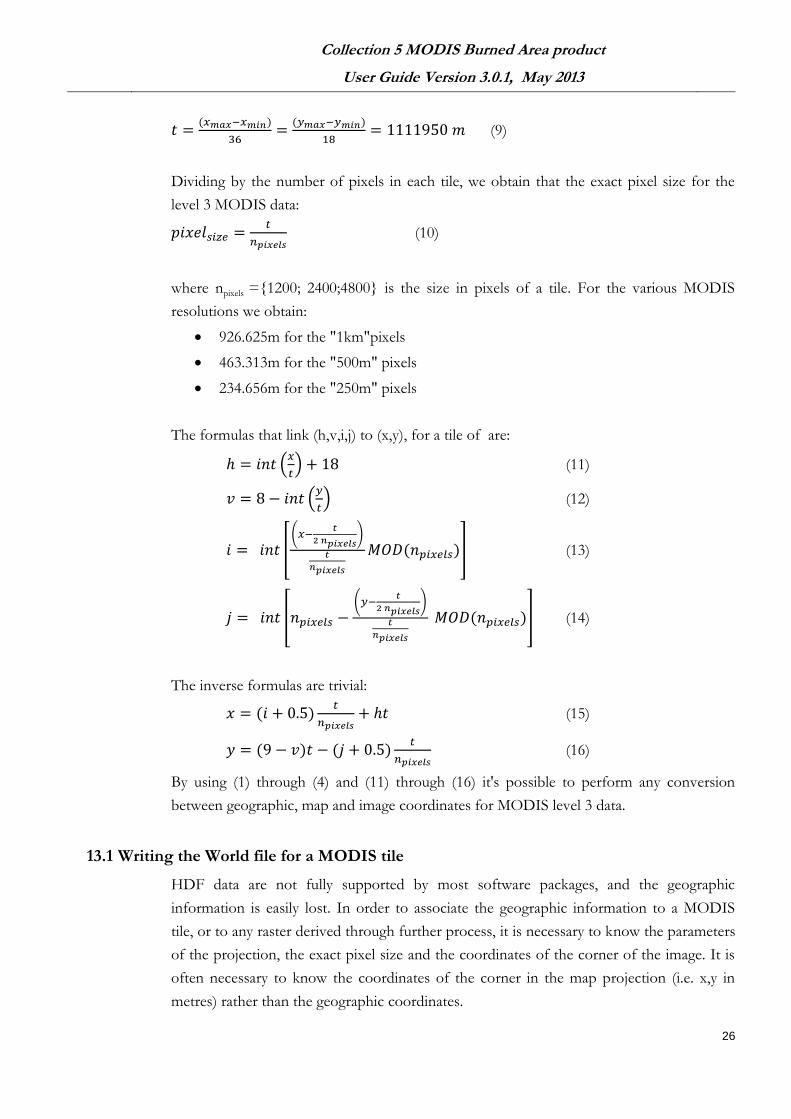
(9)
Dividing by the number of pixels in each tile, we obtain that the exact pixel size for the
level 3 MODIS data:
(10)
where npixels ={1200; 2400;4800} is the size in pixels of a tile. For the various MODIS
resolutions we obtain:
926.625m for the "1km"pixels
463.313m for the "500m" pixels
234.656m for the "250m" pixels
The formulas that link (h,v,i,j) to (x,y), for a tile of are:
(
) (11)
(
) (12)
[(
)
] (13)
[ (
)
] (14)
The inverse formulas are trivial:
(15)
(16)
By using (1) through (4) and (11) through (16) it's possible to perform any conversion
between geographic, map and image coordinates for MODIS level 3 data.
13.1 Writing the World file for a MODIS tile
HDF data are not fully supported by most software packages, and the geographic
information is easily lost. In order to associate the geographic information to a MODIS
tile, or to any raster derived through further process, it is necessary to know the parameters
of the projection, the exact pixel size and the coordinates of the corner of the image. It is
often necessary to know the coordinates of the corner in the map projection (i.e. x,y in
metres) rather than the geographic coordinates.

Collection 5 MODIS Burned Area product
User Guide Version 3.0.1, May 2013
27
A widely used format in GIS applications to store the map information is the World File.
A world file is a text file containing the pixel size, the rotation information and the
coordinates of the upper left corner. The world file has the same name as the file
containing the data, and an extension made by the first and third letter of the original
extension, plus the letter "w". For instance, 'filename.tif' will be accompanied by
'filename.tfw' and 'filename.gif' will be accompanied by 'filename.gfw'
For a generic MODIS (h,v) tile, the six lines of the world file are:
line 1: pixel size, from (10)
line 2: 0
line 3: 0
line 4: negative of the pixel size, from (10)
line 5: upper left x coordinate, from (15) with i=0
line 6: upper left y coordinate, from (16) with j=0
For example, the world file for tile h08v05 is:
463.3127166
0
0
-463.3127166
-11119273.541
4447570.423

Collection 5 MODIS Burned Area product
User Guide Version 3.0.1, May 2013
28
Appendix 3
Coverage of the Geotiff subsets

Collection 5 MODIS Burned Area product
User Guide Version 3.0.1, May 2013
29
Table 1: Regions and bounding coordinates of the Geotiff subsets.
Window # Coverage
Min Lon
Max Lon Min Lat Max Lat
1 Alaska -180 -140.5 50 70
2 Canada -141.5 -50 40 70
3 USA (Conterminous) -125 -65 23 50
4 Central America -118 -58 7 33
5 South America (North) -82 -34 -10 13
6 South America (Central) -79 -34 -35 -10
7 South America (South) -77 -54 -56 -35
8 Europe -11 35 33 70
9 West and North Africa -19 5 0 37.5
10 Central and North Africa 5 25 0 37.5
11 East Africa and Arabian Penisula 25 65 0 37.5
12 Southern Africa (North) 8.5 48 -15 5.5
12B Tanzania 29.5 40.6 -12 -0.6
13 Southern Africa (South) 10 41 -35 -15
14 Madagascar 42 59 -27 -10
15 Russia and Central Asia 1 35 90 33 70
16 Russia and Central Asia 2 90 145 33 70
17 Russia (Kamachatka) 145 180 40 70
18 South Asia 60 93 5 36
19 South East Asia 90 155 -10 33
20 Australia 112 155 -45 -10
21 New Zealand 165 179 -48 -33
22 Azores -31.6 -24.8 36.8 40
23 Cape Verde Island -25.5 -22.5 14.6 17.5
24 Hawaii -161 -154 18 24

Collection 5 MODIS Burned Area product
User Guide Version 3.0 October 2012
30
Figure 6: Coverage of Geotiff subsets