modelling mining and oil projects & fiscal regimes -...
TRANSCRIPT

© Alistair Watson & OpenOil CC BY-SA 4.0
PLACEMENT TEST
PRESENTATION (ADAPTED)
Alistair Watson: [email protected] +44(0)787 965 7669
Modelling Mining and Oil Projects & Fiscal Regimes

© Alistair Watson & OpenOil CC BY-SA 4.0
GOOGLE HANGOUT NOVEMBER 2015
Alistair Watson: [email protected] +44(0)787 965 7669
Modelling Mining and Oil Projects & Fiscal Regimes
SERIES 1 SESSION 1

© Alistair Watson & OpenOil CC BY-SA 4.0
Agenda1. Economic rent: why mining and oil are special
2. What drives commodity prices & why they are volatile
3. Mining• Mining project lifecycle
• Mineral valuation
• Cost categories for modelling
• Case study 1: Building an industry cost-curve
• Case study 2: Building a single-period mining model
• Mining fiscal regimes
• Case study 3: Adding a fiscal regime to the single-period model
• Investor decision making: NPV and IRR
• Case study 4: Building an annualized model
• Case study 5: building in the fiscal regime
• Case study 6: Evaluating results
4. Oil & Gas• Life cycle of an oil project
• Oil (and other hydrocarbons) valuation
• Oil project cost categories
• Case study 1: Building a single-period model
• Oil & Gas fiscal regimes
• Case study 2: Adding a production sharing regime to the single-period model
• Case study 3: building an annualized model
• Case study 4: Implementing the production sharing fiscal regime
• Case study 5: Evaluating results
• Case study 6: Expected Net Present Value
Week 1
Week 2
3

© Alistair Watson & OpenOil CC BY-SA 4.0
Agenda (continued)5. Modelling best practices
6. Where to from here?◦ Building fully fledged models
◦ Resources available on-line• Example models (FARI etc.)
• Online Excel training
• AUSIMM and other modelling standards
◦ Process for evaluating projects in your country
4

© Alistair Watson & OpenOil CC BY-SA 4.0
Industry Characteristics
5

© Alistair Watson & OpenOil CC BY-SA 4.0
• Projects exploit a finite resource
• Long, costly exploration periods
• Significant geological, technical, political, environmental risks
• Large up-front investments
• Sophisticated management and specialized technology
• Prices (mostly) set on international markets; price volatility
• High costs of abandonment
• Significant environmental impact & risks
• High community impact
Common to mining and oil & gas
6

© Alistair Watson & OpenOil CC BY-SA 4.0
Economic rent
• Deposits vary in size, location & quality. Each therefore has a different production cost
• Investors needs to earn at least the production cost plus an acceptable return on investment
• Prices for most commodities are set on international markets. The price needs to be high enough so that the highest-cost project necessary to meet world demand is made just viable
• But that means lower cost projects will make super profits – this is “Economic Rent”: the surplus return above the minimum return necessary to induce the investment
• Economic Rent could (in theory) be captured by the resource owner - not by the extractor – without deterring the investment
• The trouble is, economic rent is (1) Unknown in advance; (2) Uncertain; and (3) Volatile
• Also, to invest in risky exploration investors need to earn enough profit on successful projects to cover failed exploration
• So, “Economic Rent” is a subtle, somewhat subjective concept, but with profound implications for fiscal regime design
7

© Alistair Watson & OpenOil CC BY-SA 4.0
Feasibility study: Mineral Resources
Development plan: Resources reclassified as Mineral Reserves
Remote sensing; regional
geochemistry; airborne geophysics; seismic surveys
Exploration process
Acquire rights
Initial exploration
Identify targets
Exploration drilling
Appraisal drilling
Feasibility study
Development planning
8

© Alistair Watson & OpenOil CC BY-SA 4.0
Mining project life cycleP
rod
uct
ion
Co
sts
Exploration$5 - 20MM
Operating Cost
Appraisal$20 – 50MM
Reclamation workcommences during production period
Initial Development$50MM – 3.0Bn (?)
Further Development phases
Production Phase 1
Production Phase 2
Production Phase 3
Operating Costs
Time
9

© Alistair Watson & OpenOil CC BY-SA 4.0
(basic) Cost categoriesExploration Searching for deposits
AppraisalDelineating the size and characteristics of a discovered deposit: Evaluating technical and economic viability
Development costs Building the project
Operating costs Producing the mineral: Fixed versus Variable with production
Overheads Fixed costs of managing production
Sustaining capitalReplacing equipment periodically. Treated as capital cost for tax purposes
Rehabilitation and Decommissioning
Costs of clean up during and after production
"Capital” versus “Operating” costs:• Capital costs have a benefit beyond a single year, and therefore usually have to be depreciated for tax purposes. • Operating costs are recurring costs with no lasting benefit, so are expensed immediately for tax
Most economic analysis is done using cashflows where the distinction does not matter, except to calculate tax payments
Capital expenditure often referred to as “Capex”. Operating Expenditure as “Opex”
10

© Alistair Watson & OpenOil CC BY-SA 4.0
GOOGLE HANGOUT NOVEMBER 2015
Alistair Watson: [email protected] +44(0)787 965 7669
Modelling Mining and Oil Projects & Fiscal Regimes
SERIES 1 SESSION 2

© Alistair Watson & OpenOil CC BY-SA 4.0
Recap on last weekKey extractive industry characteristics
Economic Rent concept
Lifecycle of a mining project
Cost categories
12

© Alistair Watson & OpenOil CC BY-SA 4.0
This sessionDrivers of commodity prices
Constructing an industry “cost curve”
Mining model case study: single period model
Mining model case study: adding a simple fiscal regime
13

© Alistair Watson & OpenOil CC BY-SA 4.0
Commodity Prices
14
© Alistair Watson & OpenOil CC BY-SA 4.0
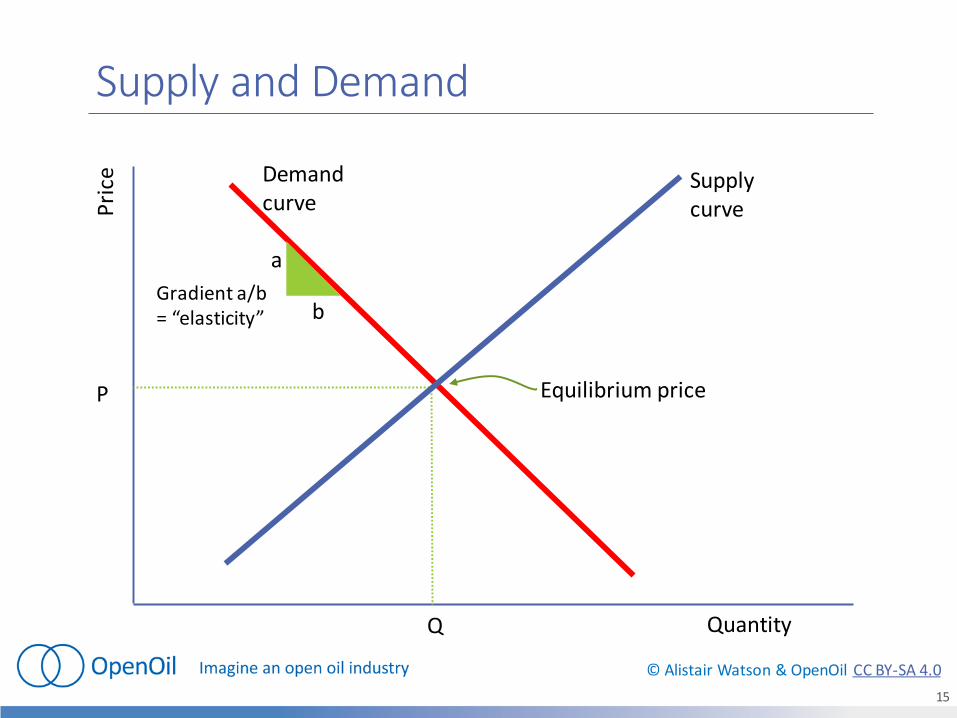
Quantity
Pri
ce
P
Q
Supply curve
Demand curve
Equilibrium price
Gradient a/b = “elasticity”
a
b
Supply and Demand
15

© Alistair Watson & OpenOil CC BY-SA 4.0
What determines the shape of the Supply and Demand curves
Demand Supply
Sho
rt T
erm
• Prices and demand curves for end-use products
• Availability & price of substitutes
• Cost to switch
• Flexibility in mine production e.g. putting mines on care and maintenance in price slump
• Opec (oil)
Lon
g te
rm
• Prices and demand curves for end-use products
• Availability & price of substitutes
• Cost to switch
• Depletion of existing mines• Geology: unexploited resources
and cost to find and extract• Opec Cartel (for oil)• Government policy: e.g.
• Access to resources• Fiscal regimes (cost to extract)• Carbon reduction policies• Nuclear power plant usage• Etc.
16

© Alistair Watson & OpenOil CC BY-SA 4.0
Inelastic demand
Quantity
Pri
ce
P
Q
Supply curve
Inelastic Demand
P1Small decrease in supply, large increase in price
Q1
17

© Alistair Watson & OpenOil CC BY-SA 4.0
Inelastic supply
Quantity
Pri
ce
P
Q1
Inelastic Supply
Demand
P1Small increase in demand, large increase in price
Q
18

© Alistair Watson & OpenOil CC BY-SA 4.0
Does this help explain recent oil prices?
Quantity
Pri
ce
P
P1
Increase in short term supply (US production; growing inventories)
Slowing of demand increase from Asian economies
11
2
2
Massive reduction in price required to clear the market
19

© Alistair Watson & OpenOil CC BY-SA 4.0
The “Lower for Longer” view on oil
Quantity
Pri
ce
P1
Implies prices may not return to recent highs for quite a while…
Supply curve has flattened due to Shale
P2
Demand growth resumes
20

© Alistair Watson & OpenOil CC BY-SA 4.0
Commodity prices are a function of marginal costs
Goldman Sachs paper suggests long dated (futures) prices for oil andcopper are set consistent with marginal costs for highest cost producer
Source: Goldman Sachs Global Economics Paper No: 194 Commodity Prices and Volatility: Old Answers to NewQuestions. http://www.goldmansachs.com/korea/ideas/global-growth/commodity-prices-doc.pdf
21

© Alistair Watson & OpenOil CC BY-SA 4.0
But it's not simple…Marginal cost is volatile, depending on the shape of the supply curve
For oil, policy decisions by Opec (reducing or increasing supply); US and othergovernments
Commodities increasingly used as investments: Particularly Gold, Oil, Copper
Impact of speculators (though much debated…)
… All of which leads to price volatility
0
20
40
60
80
100
120
140
2001
2002
2003
2004
2005
2006
2007
2008
2009
2010
2011
2012
2013
2014
2015
2016
2017
2018
US$
Bb
lAxis Title
Brent Crude Oil
Brent history (monthly averages) Futures ICE 24Sept2015
22

© Alistair Watson & OpenOil CC BY-SA 4.0
0
100
200
300
400
500
600
1980
1981
1982
1983
1984
1985
1986
1987
1988
1989
1990
1991
1992
1993
1994
1995
1996
1997
1998
1999
2000
2001
2002
2003
2004
2005
2006
2007
2008
2009
2010
2011
2012
2013
2014
2015
2016
2017
2018
2019
Real terms 2014 Commodity Price Indices (2005 = 100)
Crude oil
Copper
Aluminium
Iron Ore
Nickel
Zinc
Lead
Uranium
Gold
Forecast
Source: IMF WEO Database Oct 2014. 2005 = 100; adjusted using US CPI
Real-terms 2014 Commodity Prices
Steep price increase resulting
from rapid Asian growth & perceived shortages
Declining prices: lack of
investment
Supply response:
investment
Prices
fall
23

© Alistair Watson & OpenOil CC BY-SA 4.0
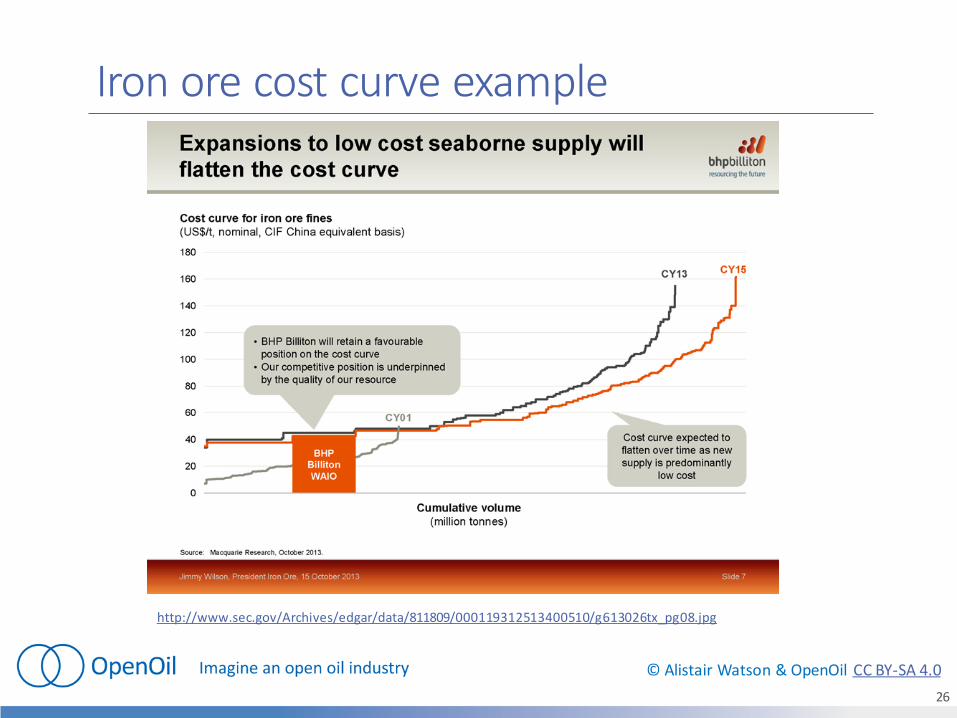
Iron ore cost curve example
http://www.bing.com/images/search?q=iron+ore+cost+curve&id=AE5391761DC3976D4885155D9B61F418A28B03FC&FORM=IQ
FRBA#view=detail&id=AE5391761DC3976D4885155D9B61F418A28B03FC&selectedIndex=0
24

© Alistair Watson & OpenOil CC BY-SA 4.0
Remember this?
25
© Alistair Watson & OpenOil CC BY-SA 4.0
Iron ore cost curve example
http://www.sec.gov/Archives/edgar/data/811809/000119312513400510/g613026tx_pg08.jpg
26

© Alistair Watson & OpenOil CC BY-SA 4.0
Coal example
http://www.iea.org/etp/resourcestoreserves/
27

© Alistair Watson & OpenOil CC BY-SA 4.0
http://www.commodityintelligence.com/7-11Feb11.htm
Copper example
28

© Alistair Watson & OpenOil CC BY-SA 4.0
Copper example
How can costs be negative? Answer: by-products
29
© Alistair Watson & OpenOil CC BY-SA 4.0
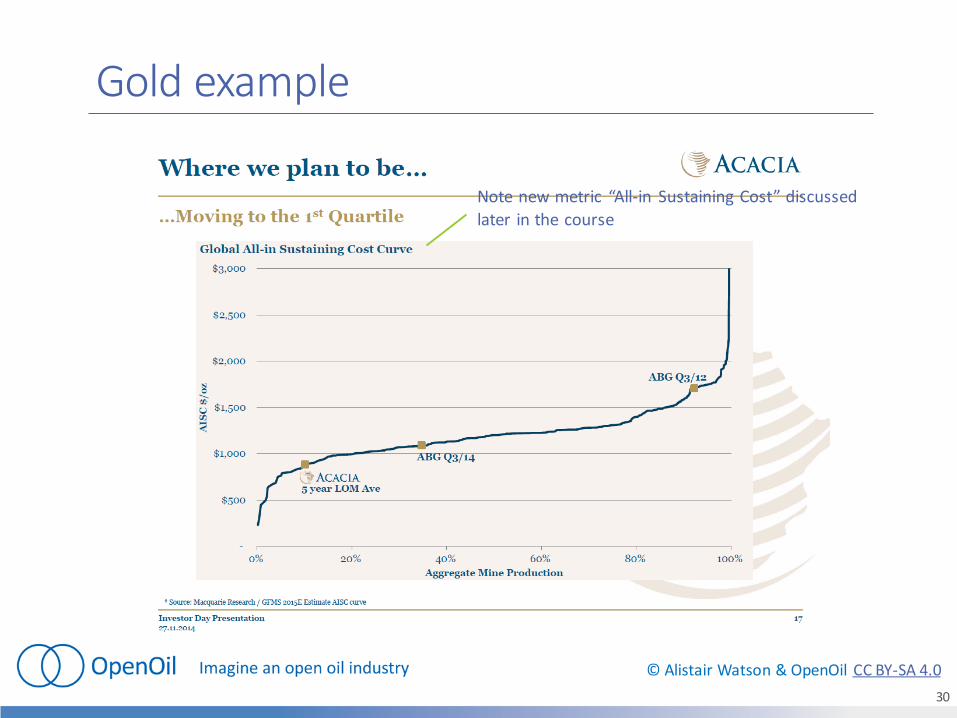
Gold example
Note new metric “All-in Sustaining Cost” discussed
later in the course
30

© Alistair Watson & OpenOil CC BY-SA 4.0
Oil
http://www.iea.org/etp/resourcestoreserves/
Price today
31

© Alistair Watson & OpenOil CC BY-SA 4.0
Oil
http://s3.amazonaws.com/zanran_storage/www.sais-jhu.edu/ContentPages/137274942.pdf
32

© Alistair Watson & OpenOil CC BY-SA 4.0
33
Case study 1Constructing an industry cost curve

© Alistair Watson & OpenOil CC BY-SA 4.0
Constructing a cost curveImagine a particular mineral which can be produced by only 10 projects in the world.
◦ For simplicity, let’s assume these projects are all either in production, or capable of immediate startup
The projects have the following production capacity and unit cost. The unit costs include return on investment the projects need to earn
34
Source data
Project Production Unit cost
A 100 4.00
B 125 3.00
C 10 9.00
D 50 8.00
E 20 10.00
F 200 2.00
G 50 5.20
H 100 2.75
I 150 2.50
J 45 7.00

© Alistair Watson & OpenOil CC BY-SA 4.0
35

© Alistair Watson & OpenOil CC BY-SA 4.0
Cost curve cast study (questions)1. If global demand for the mineral is 675 million tonnes, what does the price
need to be to ensure production is sufficient?
2. At this price, what profit margins do projects F, make? What profit (as a % ofrevenue) does project A make?
3. If demand increased to 725 million tonnes, what would that imply for theprice?
4. If demand decreased to 575 million tonnes, what would that imply for theprice?
5. With demand 675 and price $4.00, what are the implications of Project Iexpanding production to 250?
36

© Alistair Watson & OpenOil CC BY-SA 4.0
Of course its not that simple…Projects in production need only to cover current (cash) costs
Undeveloped projects need a price high enough to cover investment plus return
◦ Each therefore has a different concept of “break-even” (We discuss this later in petroleum case study)
Companies will take a short term loss and hope for a price recovery
Stockpiles
Producers use Hedging to lock in a price different from the current spot price, may enable them to ride out a temporary downturn
37
© Alistair Watson & OpenOil CC BY-SA 4.0
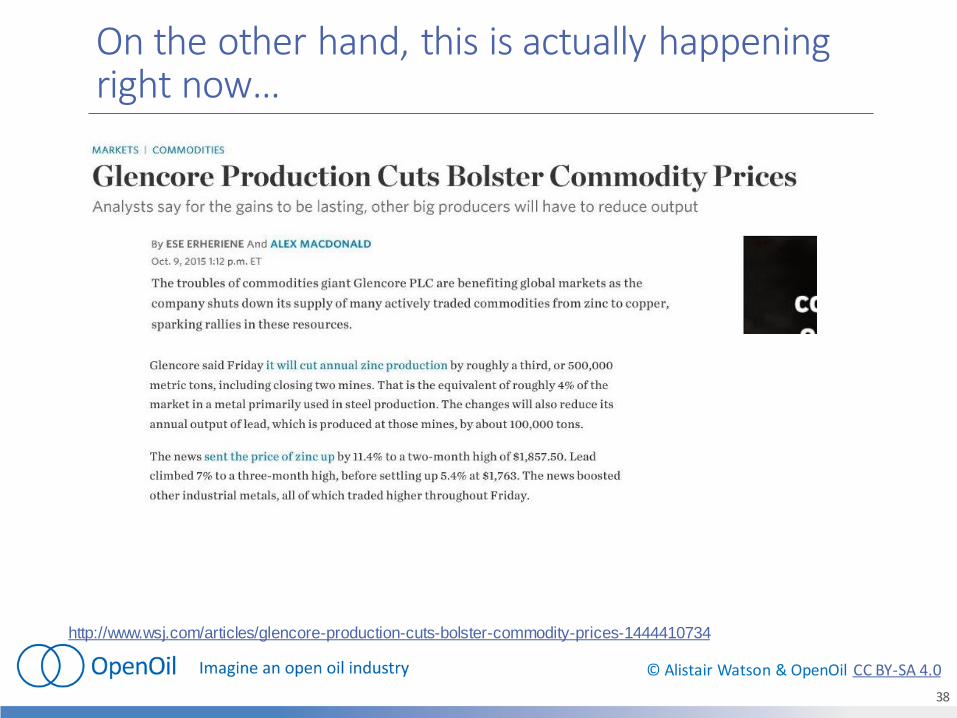
38
On the other hand, this is actually happening right now…
http://www.wsj.com/articles/glencore-production-cuts-bolster-commodity-prices-1444410734
© Alistair Watson & OpenOil CC BY-SA 4.0
GOOGLE HANGOUT NOVEMBER 2015
Alistair Watson: [email protected] +44(0)787 965 7669
Modelling Mining and Oil Projects & Fiscal Regimes
SERIES 1 SESSION 3

© Alistair Watson & OpenOil CC BY-SA 4.0
RecapFirst two sessions:
Characteristics; economic rent; lifecycle of a mining project; cost categories; industry cost curves
This session:
Mineral valuation for a specific project
Single-period mining model
Mining Fiscal regimes
40
© Alistair Watson & OpenOil CC BY-SA 4.0
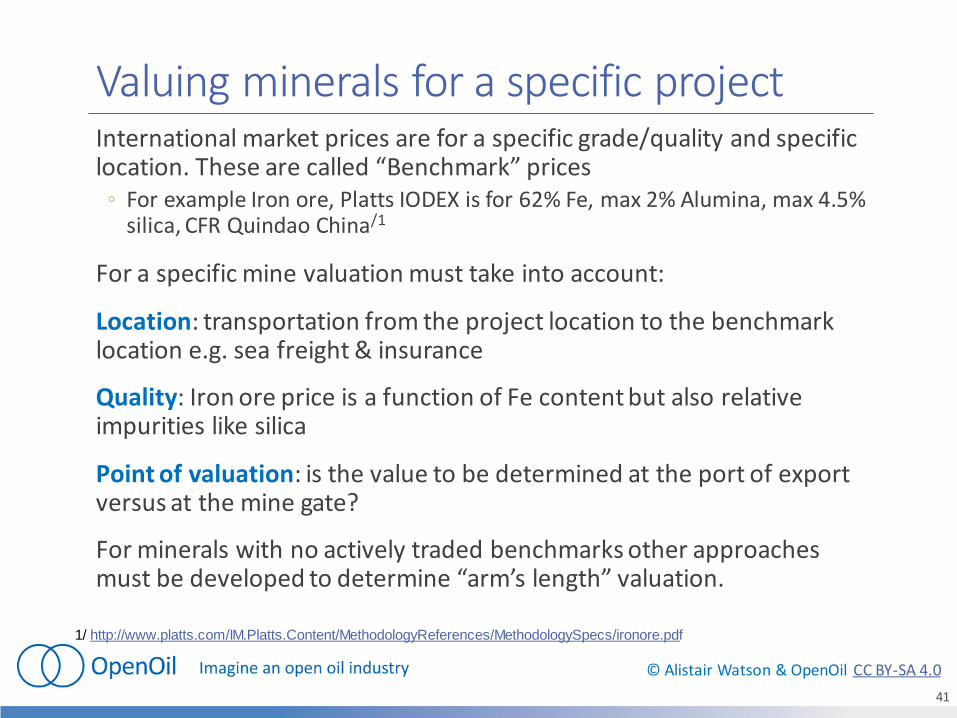
Valuing minerals for a specific project International market prices are for a specific grade/quality and specific location. These are called “Benchmark” prices
◦ For example Iron ore, Platts IODEX is for 62% Fe, max 2% Alumina, max 4.5% silica, CFR Quindao China/1
For a specific mine valuation must take into account:
Location: transportation from the project location to the benchmark location e.g. sea freight & insurance
Quality: Iron ore price is a function of Fe content but also relative impurities like silica
Point of valuation: is the value to be determined at the port of export versus at the mine gate?
For minerals with no actively traded benchmarks other approaches must be developed to determine “arm’s length” valuation.
41
1/ http://www.platts.com/IM.Platts.Content/MethodologyReferences/MethodologySpecs/ironore.pdf

© Alistair Watson & OpenOil CC BY-SA 4.0
Mineral valuation: coal example
PortFinal
Market
Rail
ShipMiningTreat-
ment
Fair Market Value
FOB (Free on Board)
mine
FMV. FOB Port Benchmark price
CFR (Cost and
Freight)
Value of coal in final market Coal price benchmark
- Shipping costs Shipping benchmark
+ Other selling costs (insurance etc.) Arm’s length charges
= Fair Market Vale FOB Port Calculated
- Port handling Arm’s length charges by port
- Rail costsArm’s length charges by rail company or actual costs incurred
= Fair Market Value FOB Mine Calculated
42

© Alistair Watson & OpenOil CC BY-SA 4.0
Building a single-period model
Mining Model Case Study 1
43

© Alistair Watson & OpenOil CC BY-SA 4.0
Project “X”
Stylized mining project
Generic bulk mineral product, measured and sold in Tonnes
Significant transport costs
Similar to a coal or iron ore project
Relatively opex intensive
Mine PortRailway (3rd party)
International Market
44
© Alistair Watson & OpenOil CC BY-SA 4.0
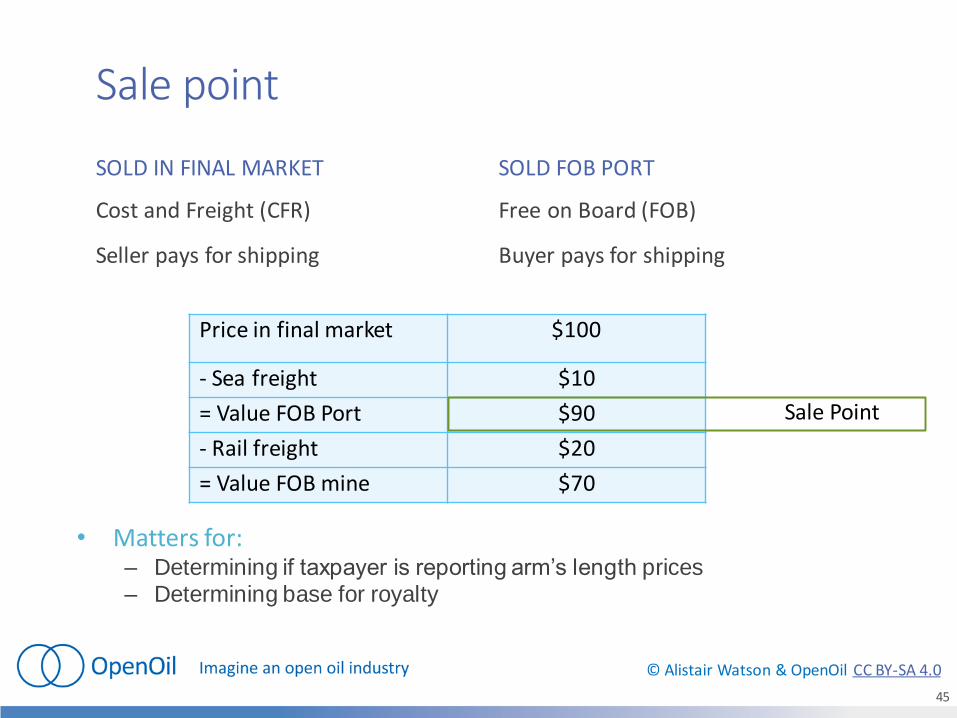
Sale point
SOLD IN FINAL MARKET
Cost and Freight (CFR)
Seller pays for shipping
SOLD FOB PORT
Free on Board (FOB)
Buyer pays for shipping
Price in final market $100
- Sea freight $10
= Value FOB Port $90
- Rail freight $20
= Value FOB mine $70
• Matters for:– Determining if taxpayer is reporting arm’s length prices– Determining base for royalty
Sale Point
45

© Alistair Watson & OpenOil CC BY-SA 4.0
Project assumptions
• Each item here could be broken down further: detailed cost sub-categories etc.
• Choice depends on modelling objective and access to data• Focus in this course is on fiscal regime modelling: even this aggregated level of detail
will give us plenty to analyse
Project Assumptions
Total production M Tonnes 100 11 years
Sales price: CFR $T 100
Sea freight $T 10
Sales price: FOB port $T 90
Capital costs (Capex) Operating costs (Opex)
Exploration costs: cash $M 50 Operating costs $T 30
Exploration costs: sunk $M - Overheads $M per year 5
Development capital $M 750 Rail transport $T 20
Sustaining capital * $M per year 20
* From yr 2 till 3rd year before production stops
Decommissioning costs % DevCapEx 10%
46
© Alistair Watson & OpenOil CC BY-SA 4.0
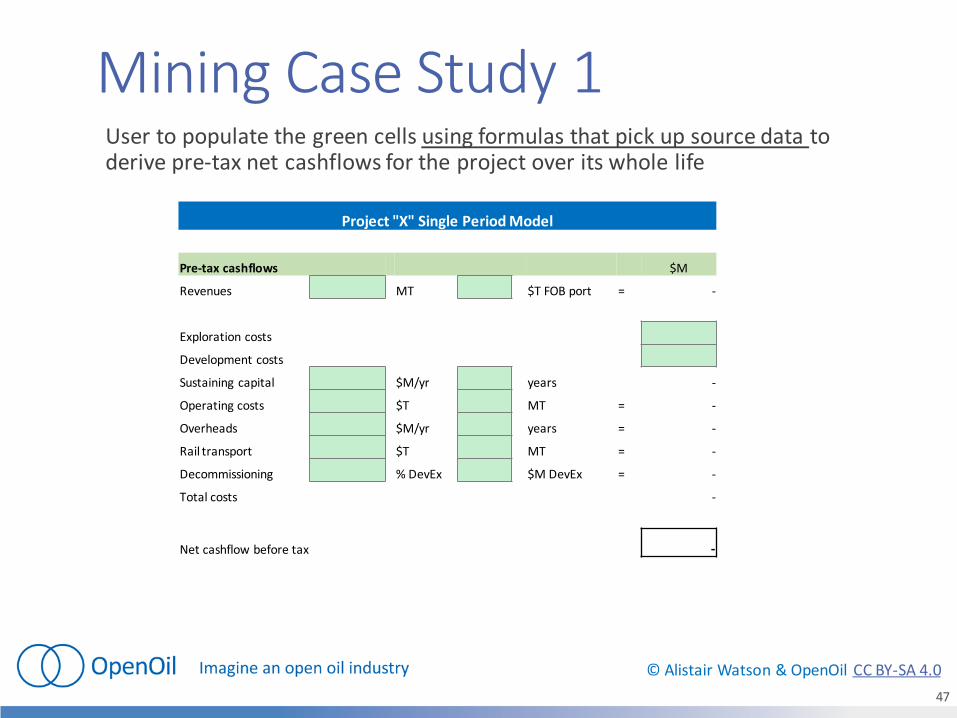
Mining Case Study 1User to populate the green cells using formulas that pick up source data to derive pre-tax net cashflows for the project over its whole life
Project "X" Single Period Model
Pre-tax cashflows $M
Revenues MT $T FOB port = -
Exploration costs
Development costs
Sustaining capital $M/yr years -
Operating costs $T MT = -
Overheads $M/yr years = -
Rail transport $T MT = -
Decommissioning % DevEx $M DevEx = -
Total costs -
Net cashflow before tax -
47
© Alistair Watson & OpenOil CC BY-SA 4.0
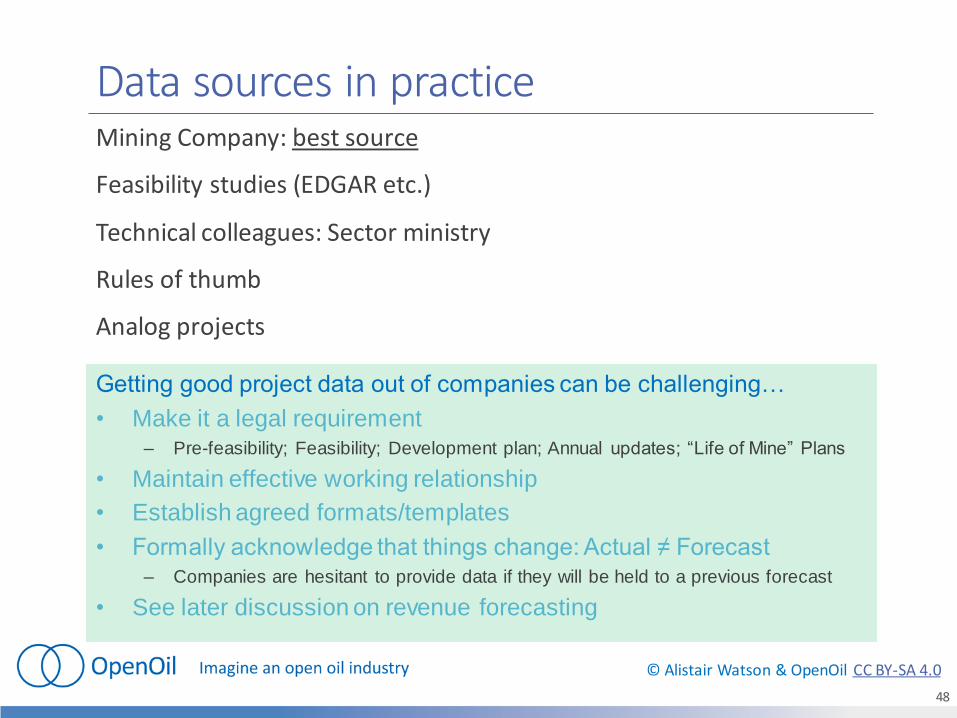
Data sources in practiceMining Company: best source
Feasibility studies (EDGAR etc.)
Technical colleagues: Sector ministry
Rules of thumb
Analog projects
Getting good project data out of companies can be challenging…
• Make it a legal requirement– Pre-feasibility; Feasibility; Development plan; Annual updates; “Life of Mine” Plans
• Maintain effective working relationship
• Establish agreed formats/templates
• Formally acknowledge that things change: Actual ≠ Forecast– Companies are hesitant to provide data if they will be held to a previous forecast
• See later discussion on revenue forecasting
48

© Alistair Watson & OpenOil CC BY-SA 4.0
Is this a good project?It looks pretty good, but…
What else do we need to know:
1. Fiscal regime: how much does the government take?
2. …?
49

© Alistair Watson & OpenOil CC BY-SA 4.0
Mining fiscal regimes
50

© Alistair Watson & OpenOil CC BY-SA 4.0
Government fiscal regime objectives
• Maximize Revenues
• Attract exploration investment
• Ensure discovered projects go ahead (neutrality)
• Incentives to maximize production at minimum cost (efficiency)
• Capture an increasing share from more profitable projects (progressivity)
• Stability
http://www.imf.org/external/np/pp/eng/2012/081512.pdf
IMF paper
51

© Alistair Watson & OpenOil CC BY-SA 4.0
Fiscal mechanisms Royalty A share of the value of production
3-5% pretty common, rates often vary by mineral
Income tax A share of profit, determined under tax rules30% rate pretty common
Resource Rent Tax Special tax designed to capture a share of economic rent. Uncommon but often recommended by the IMF
Import duties % of the value of imports
Value Added Tax % of sales (output VAT) and % of costs (input VAT)Under properly functioning VAT the consumer should bear the cost – not the mining company. But in practice…
State participation Government owned company owns a share in the project
Others Withholding taxes on subcontractorsWithholding taxes on dividends and interest
52

© Alistair Watson & OpenOil CC BY-SA 4.0
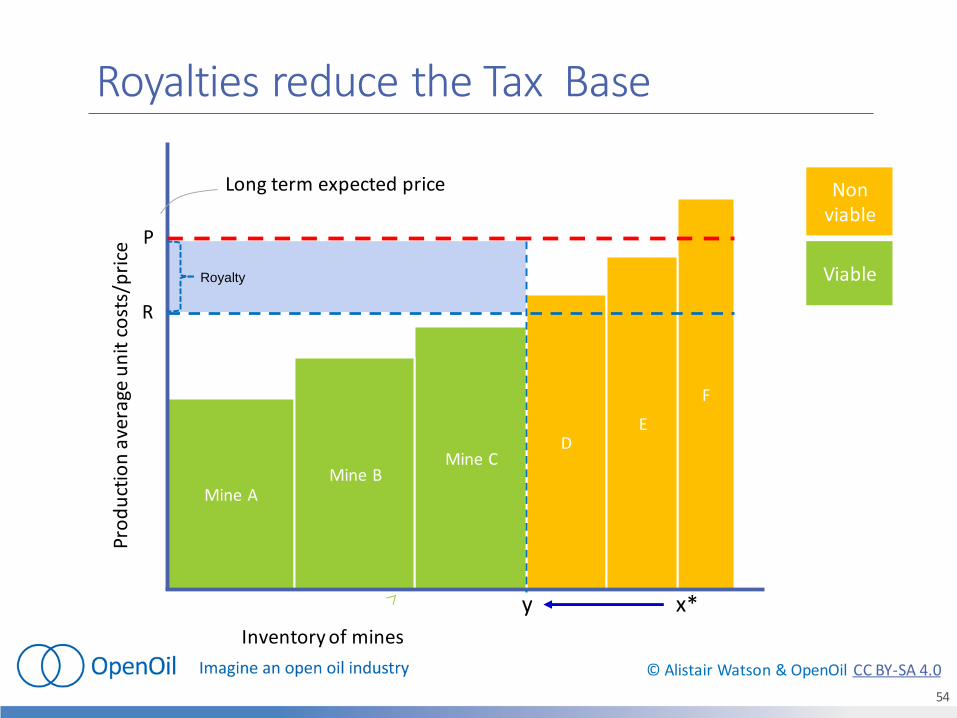
RoyaltiesUsually percent of gross revenue (or unit fee)
Widely applied
Early, dependable income
Distorts production and investment decisions
Limited rent capture
Regressive, not progressive
Internationally accepted at modest levels
Administratively simple?
53
© Alistair Watson & OpenOil CC BY-SA 4.0
F
DE
Mine C
Mine AMine B
Royalties reduce the Tax Base
Inventory of mines
Pro
du
ctio
n a
vera
ge u
nit
co
sts/
pri
ce
P
Non viable
Viable
Long term expected price
R
x*y
54
Royalty

© Alistair Watson & OpenOil CC BY-SA 4.0
Profit based fiscal mechanismsProfit = Revenues minus Costs
Revenues = valuation of minerals sold (or produced?)
Costs = which costs are deductible, and when
For example, with income tax
• Operating costs deductible when incurred
• Capital costs deductible over time via depreciation
So, depreciation rules matter
• Faster depreciation = income tax paid later
• Slower depreciation = income tax paid sooner
55

© Alistair Watson & OpenOil CC BY-SA 4.0
Further detail on mechanismsIncome taxes: need for special rules
◦ Mineral valuation
◦ Ring fencing
◦ Depreciation
◦ Loss carry forward
◦ Decommissioning
Resource Rent Taxes◦ Additional tax that applies only to profits (or cashflows) earned in excess of a
threshold rate of return
◦ Increasingly common in Mining
◦ Parameters needed:◦ Threshold rate of return
◦ Resource Rent Tax Rate
56

© Alistair Watson & OpenOil CC BY-SA 4.0
“Fiscal Regime”
A “Fiscal Regime” is the combination of all of the mechanisms thatdetermine how project benefits are shared between government(resource owner) and the mining company (the extractor)
General IMF advice for developing economies: fiscal regimes shouldinclude:
1. Modest Royalty: guarantee some revenue
2. Income tax with mining specific rules
3. A progressive mechanism; such as
◦ Resource Rent Tax; or
◦ Variable Income tax
57

© Alistair Watson & OpenOil CC BY-SA 4.0
Generic Mining Fiscal regime
Recettes totales
RedevanceCoûtsBénéfices
Taxe de Rente Eco (éventuelle)
Revenu imposable
Impôt sur le revenu
Bénéfice après impôt
Recettes totales
Bénéfices Coûts RedevanceCoûts
Recettes totales
RedevanceCoûtsBénéfices
Recettes totales
RedevanceCoûts
Taxe de Rente Eco (éventuelle)
Bénéfices
Recettes totales
RedevanceCoûts
Revenu imposableTaxe de Rente Eco (éventuelle)
Bénéfices
Recettes totales
RedevanceCoûts
Bénéfice après impôt
Revenu imposableTaxe de Rente Eco (éventuelle)
Bénéfices
Recettes totales
RedevanceCoûts
Impôt sur le revenu
Bénéfice après impôt
Revenu imposableTaxe de Rente Eco (éventuelle)
Bénéfices
Recettes totales
RedevanceCoûtsBénéfices
Recettes totales
CoûtsBénéfices
Recettes totales
RedevanceCoûtsBénéfices
Recettes totales
Taxe de Rente Eco (éventuelle)
RedevanceCoûtsBénéfices
Recettes totales
Revenu imposableTaxe de Rente Eco (éventuelle)
RedevanceCoûtsBénéfices
Recettes totales
Bénéfice après impôt
Revenu imposableTaxe de Rente Eco (éventuelle)
RedevanceCoûtsBénéfices
Recettes totales
Income tax
Profit after tax
Taxable incomeResource RentTax (if any) /1
RoyaltyCostsProfit
Total revenues
58
1/ Assuming the RRT is deductible
© Alistair Watson & OpenOil CC BY-SA 4.0
BUILDING IN THE FISCAL REGIME
Case Study 2
59

© Alistair Watson & OpenOil CC BY-SA 4.0
Case study 2: building fiscal regime into single period model
Add simple fiscal regime to single period model:
◦ 5% Royalty
◦ 30% Income tax
60

© Alistair Watson & OpenOil CC BY-SA 4.0
Is This a Good Project?After government fiscal share it still looks pretty good, but…
How do we know how much net cashflow is enough?
◦ Just $1? $100; $1million; $50 million?
Simple net cashflow is not enough information
Consider 2 projects identical except one produces 100MT over 5 years and another over 10 years. They have the same net cash flow after tax. Would a mining company be indifferent between these?
No, they would prefer earning that net cashflow in 5 rather than 10 years.
We need a way of taking into account Timing and Risk
This is done through Net Present Value calculations
61

© Alistair Watson & OpenOil CC BY-SA 4.0
Next sessionNPV and IRR
Annualized model
62