modelling buoyancy regulation in fishes with swimbladders
TRANSCRIPT
Ecological Modelling 185 (2005) 309–327
Modelling buoyancy regulation in fishes with swimbladders:bioenergetics and behaviour
Espen Stranda, ∗, Christian Jørgensena, Geir Huseb
a University of Bergen, Department of Biology, P.O. Box 7800, N-5020 Bergen, Norwayb Institute of Marine Research, P.O. Box 1870, Nordnes, N-5817 Bergen, Norway
Received 18 June 2004; received in revised form 13 December 2004; accepted 17 December 2004
Abstract
We present a bioenergetic model for buoyancy regulation that incorporates the restrictions and costs of swimbladder regulationwith four means of hydrodynamic lift production: hovering, swimming with extended pectoral fins, swimming with adjusted tiltangle, and body lift. Previous models addressing vertical migration in fish with swimbladders have either assumed no energeticcost or a static cost of vertical migration. In this model, parameterised for Atlantic codGadus morhua, existing theory andexperimental data on bioenergetics, physiology, and hydromechanics are integrated. Trade-offs and limitations were investigatedfrom a behavioural perspective. Regulation of swimbladder volume is energetically cheap but slow. Because of the asymmetry inabsorption and secretion rates with depth, fish that perform vertical migrations regularly will often be negatively buoyant and willtherefore experience additional energy costs associated with hydrodynamic lift production. Hovering was optimal for slightly
mal tiltavingtial inpatternsrally or
ion;
-eptre
negatively buoyant fish, whereas tilted compensatory swimming was optimal in all other situations. The predicted optiangle was approximately 7, and increased for small fish and for fish that were close to neutrally buoyant. The energetic sfrom tilting was small for cod, and potential conflicts with other behaviours may determine when tilting would be preferennature. Swimbladder volumes and the corresponding energetic costs were calculated for constructed vertical migrationand on a set of depth data from a free-living cod. For the free-living cod, the model predicted that the fish would be neutnegatively buoyant, with the swimbladder being up to 40% smaller than the optimal volume.© 2005 Elsevier B.V. All rights reserved.
Keywords: Atlantic cod (Gadus morhua); Bioenergetics model; Buoyancy regulation; Physoclist swimbladder; Tilt angle; Vertical migratTarget strength
∗ Corresponding author. Tel.: +47 55 58 44 38;fax: +47 55 58 44 50.
E-mail address:[email protected] (E. Strand).
1. Introduction
Living tissue is, with the exception of lipids, heavier than water. Aquatic organisms that intend to utilisthe free water masses will therefore have to adosome mechanism by which to control buoyancy. Natu
0304-3800/$ – see front matter © 2005 Elsevier B.V. All rights reserved.doi:10.1016/j.ecolmodel.2004.12.013
310 E. Strand et al. / Ecological Modelling 185 (2005) 309–327
displays a variety of solutions to this problem, rangingfrom constant activity via large deposits of lipids andoils, to elaborate gas-filled structures (Jobling, 1995;Schmidt-Nielsen, 1997). The degree to which someof these adaptations require energy or restrict the be-havioural repertoire outlines the magnitude of the se-lection pressures that have shaped them (Harden Jones,1951, 1952; Alexander, 1971, 1990, 2003; Schmidt-Nielsen, 1997).
The swimbladder found widely among teleost fishesis one solution to the buoyancy challenge. Blood-borne gases are secreted into a gas-filled cavity througha reaction that requires energy, but maintenance isenergetically cheap once the gases are inside (e.g.Scholander, 1956; Prosser, 1973; Harden Jones andScholes, 1985). The physical properties of gases, how-ever, pose some problems. First, vertical movementsmake the contained gases change volume. This meansthat the amount of gases inside the swimbladder has tobe adjusted to maintain neutral buoyancy after a changeof depth. Second, gases have to be kept from escapingthe swimbladder despite a pressure gradient that is pro-portional to depth and therefore steep at great depths(Lapennas and Schmidt-Nielsen, 1977; Ross, 1979).Third, the fish will need an organ capable of fillingthe swimbladder with gas against the pressure gradi-ent found between the gasses dissolved in blood andthe gasses inside the swimbladder. Gases dissolved inseawater are at best in equilibrium with sea surfaceconditions. The swimbladder is thus like a pressureb iono ondi-t thei
fisht thes ivet seafl dy-n eenh wn-w tm toralfi liftw tilt-i canb ergyt
Buoyancy regulation has hitherto not been mecha-nistically quantified in behavioural models studying thetrade-offs involved in vertical migration. Earlier mod-els have either assumed the cost of vertical migrationsproportional to depth change (e.g.Rosland and Giske,1994; Strand et al., 2002), assumed no cost (e.g.Clarkand Levy, 1988), and have furthermore not identifiedthe constraints imposed by a swimbladder. To improvethe ecological realism of such models, this work piecestogether knowledge from three research areas: swim-bladder physiology, hydrodynamics of lift, and bioen-ergetics.
Comparisons between species have sketched thebroad perspective of advantages and disadvantageswith the different means of buoyancy regulation.Changes in swimbladder volume are constrained bytime and depth, and hydrodynamic lift by the energyrequirements. The model presented here describes theprocesses involved in buoyancy control: swimbladdervolume changes, hovering, swimming with fins as hy-drofoils and with a tilt angle. These different modesof buoyancy regulation have different rates, differentenergetic costs, and different constraints, and havebeen well-studied separately (Alexander, 1971; Blake,1979; Harden Jones and Scholes, 1985; Vogel, 1994).By formulating them in a common bioenergetics frame-work, the trade-offs between the swimbladder and hy-drodynamic forces as means of buoyancy regulationcan be compared. The model can answer two lines ofquestions: (1) on the shorter time-scale, which types ofb icalc hata uoy-a canb sh,a s ofc o bes re asa thea peso icfi
ents,a pont ine.T cies-su most
alloon, where filling will be slower and reabsorptf gases faster at greater depths. These two c
ions have implications for the vertical behaviour ofndividual.
Because swimbladder adjustments take time,hat move vertically will often be at a depth wherewimbladder volume is too large or too small to ghe fish neutral buoyancy. If the fish cannot lie at theoor, it has to generate lift, up or down, by hydroamic means. Bottom-dwelling fish can often be sovering, waving their pectoral fins to create a doard current (Blake, 1979; Alexander, 2003). Fish thaove forward through the water can use their pec
ns as hydrofoils (‘wings’), and in addition createith the caudal fin, by other body features, or by
ng. Hydrodynamic lift can be generated fast ande altered quickly, but generally requires more en
han a swimbladder (Alexander, 1990, 2003).
ehaviour are possible with regard to the physiologonstraints involved, and (2) in the longer run, wre the energetic costs of the different modes of bncy regulation. Insights from this last approache used to interpret field data from free-ranging find the bioenergetics currency allows comparisonosts and benefits of different foraging behaviours ttudied. By implementing the model presented hesubmodel in behavioural models, questions into
daptive nature of foraging behaviour and other tyf behaviour involving vertical migrations in pelagsh can be investigated.
Fish have adapted to a great range of environmnd the constraints that a swimbladder forces u
he general physoclist fish will be hard to examo better investigate the model’s properties, spepecific values for Atlantic cod (Gadus morhua) weresed. This is the physoclist species that has been

E. Strand et al. / Ecological Modelling 185 (2005) 309–327 311
extensively investigated with regard to swimbladderfunction (e.g.Tytler and Blaxter, 1973; Harden Jonesand Scholes, 1985; Arnold and Greer Walker, 1992).Cod are known to perform vertical migrations (e.g.Brunel, 1965; Beamish, 1966; Metcalfe and Arnold,1997; Godø and Michalsen, 2000), but the energeticcost of this behaviour with regard to variations in buoy-ancy has been poorly investigated. The model was ap-plied to a time series of vertical positions recorded forcod by data storage tags (Godø and Michalsen, 2000)in order to illustrate the dynamics of the presentedmodel’s predictions.
2. Model description
The equations that describe buoyancy control in thismodel are intended for recalculation over several time-steps. For every time-step, the following proceduretakes place: (1) the fish’ depth is used as input; (2) leak-age from the swimbladder is calculated based on thisdepth; (3) the buoyancy experienced by the fish at theactual depth is estimated based on the new state of itsswimbladder (change of depth and leakage); (4) maxi-mum rates for secretion and absorption of gases are cal-culated. The required secretion/absorption takes placewithin these limits; (5) the buoyancy not accounted forby changes in swimbladder volume has to be generatedby hydrodynamic forces, i.e. through increased swim-ming at the optimal tilt angle, or by hovering; (6) them im-m
2
ughaTl lutesi ther callyd ting-o el-s st (m in-t and.A ceed
that of arterial blood several-fold, and gases thus dif-fuse into the pressurised swimbladder (Scholander andvan Dam, 1954; Kuhn et al., 1963; Steen, 1963a).During ascents, physoclist fish will reabsorb the ex-cess gas inside the swimbladder through a particularlyvascularised area called theoval (Fange, 1953; Steen,1963b). The rate of absorption is limited, however, andrapid ascents can thus be dangerous to physoclist fish,as the swimbladder may expand beyond control or burst(Harden Jones, 1952; Tytler and Blaxter, 1973).
In this model, leakage and the maximum sustain-able rates of secretion and absorption are based on gascomposition with emphasis on oxygen, while the en-ergetic cost of secretion is calculated based on physi-cal work and a biological efficiency factor. Whereverphysically dissolved gases are involved, all gases inthe swimbladder are assumed to have the same physicalproperties as oxygen. This approximation can be partlyjustified since the next two components, CO2 and N2,have a higher and lower solubility, respectively. Fur-thermore, other gases (Ar, Ne, He) can be found in theswimbladder to varying degrees, and the gas composi-tion will hence change in a complex manner resultingfrom past vertical behaviour. The equations relating tohaemoglobin-bound oxygen use a partial pressure ofoxygen in the swimbladder that is a constant fractionof the hydrostatic pressure. Because CO2 has a highersolubility than O2, this will tend to underestimate ab-sorption rates during the initiation of absorption (whenCO2 would have been removed faster), but will slightlyo nr rei ,1 abo-r rop-e notf ando odelc ionsi lad-d ntsm er.
per,a umeo hism ope-f ved.S
etabolic costs of secretion and compensatory swing are summarised.
.1. The swimbladder
Physoclist fish have the ability to secrete gas throgas gland on the swimbladder wall (Prosser, 1973).he gas gland produces lactic acid and CO2, which
ower the pH and increase the concentration of son the blood. Direct and indirect effects effectuateelease of haemoglobin-bound oxygen and physiissolved gases through the Bohr, Root, and salut effects (Jobling, 1995; Schmidt-Nielsen, 1997; Pter, 2001). In addition, the arterial blood supply flowhrough a counter-current vascular arrangementreteirabile) that multiplies blood gas tensions and ma
ains pH and solute concentrations in the gas gls a result, gas tension in the gas gland may ex
verestimate rates after the majority of CO2 has beeemoved (which means that N2 would have been momportant for the overall rate of absorption) (Steen963band references therein). The model can be elated to incorporate gases with different physical prties, but at this point such a level of detail was
ound worthwhile. The partial pressure of oxygenther gases would then become dynamic, and the mould thus also shed light on how behavioural decis
nfluence the actual gas composition of the swimber. Although a full modelling of all gas componeay be possible, it is beyond the scope of this papSI units have been preferred throughout this pa
lthough it may seem awkward to measure the volf the swimbladder of a small cod in cubic metres. Takes the equations easier to read, and will thus h
ully enhance understanding of the concepts involeeTable 1for details on all variables.

312 E. Strand et al. / Ecological Modelling 185 (2005) 309–327
Table 1Variables and parameters used in the model for buoyancy regulation
Description Value Unit
Variablesϕ Tilt angle – DegreesΩ Energy conversion efficiency during swimming 0.05–0.20 –Absmax Maximum rate of O2 absorption – mol s−1
Act Increase in energy expenditure during swimming – –B Buoyancy force – NBL Body length – mCout Cardiac output – m3 s−1
Esec Energy used for gas secretion – J s−1
FL Pectoral fin length (at right angle from body) – mL; D Lift and drag force, subscript referring to fin, body and tilt
angle (ϕ)– N
Leakage Oxygen leakage from swimbladder – mol s−1
M Body mass – kgMRHOVER Metabolic cost of hovering – J s−1
MRPECT Additional metabolic cost of extended fins – J s−1
Secmax; Sec Maximum O2 that can be secreted into swimbladder; actualO2 secreted
– mol s−1
SMR; TMR; AMR Standard metabolic rate; total metabolic rate including findrag; active metabolic rate (measured metabolism-SMR)
– J s−1
P Hydrostatic pressure 1 + (z/10) atmSs Swimbladder surface area – m2
Thrust Power produced during swimming NU; UH Fish swimming speed; horizontal component – m s−1
Umax Maximum sustainable swimming speed – BL s−1
Vn; Vs Neutral swimbladder volume; current swimbladder volume – m3
z; zc Depth; critical depth – m
Parametersα; β Intercept and slope for allometric function for SMR 0.397; 0.828 –γ Fin beat angle during hovering RadiansδO2 Fraction oxygen in secreted gases 0.63 –ρf ; ρw Fish tissue density; water density 1081; 1026 kg m−3
Hb Fraction of haemoglobin available for O2 binding (in oval) 0.15 –a/b Length to width ratio of swimbladder 10 –Crete; Coval Fraction of cardiac output torete; to oval 0.10; 0.25 –Eeff Energy conversion efficiency during secretion 0.10 –F (T) Temperature function for SMR 0.502 at 5C –G Oxygen conductance 1.5× 10⁻⁹ m3 O2 m−2 atm−1 s−1
g Gravitation constant 9.81 m s−2
HGROUND Energy saving during hovering due to ground effect ≤1 –[L/D]body The lift-to-drag coefficient for body 0.75 –O2a O2 content of arterial blood by volume 0.10 –O2sol Solubility of O2 0.04 m3 O2 m3 blood−1 atm−1
P0 Pressure at surface 1 atmR Universal gas constant 8.206× 10⁻⁵ m3 atm mol−1 K−1
8.3144 J mol−1 K−1
Reff Rete efficiency 0.20 –T Ambient temperature 278.15 K
Species-specific values refer to Atlantic cod (Gadus morhua). Variables and parameters without dimension are denoted ‘–’ in the unit column.

E. Strand et al. / Ecological Modelling 185 (2005) 309–327 313
2.2. Neutral buoyancy
A submerged fish has neutral buoyancy when it dis-places a volume of water with a mass equal to its bodymass (Archimedes’ principle). The volume of a swim-bladder giving neutral buoyancy (Vn; m3) to a fish withbody massM (kg) can then be calculated given the den-sity of the fish tissue (ρf ; kg m−3) and the density ofwater (ρw; kg m−3):
Vn = M(1 − (ρw/ρf ))
ρw(1)
both ρw and ρf can be modelled as variables to re-flect heterogenic environments and ontogenetic andseasonal changes for the particular species (discussedin e.g.Ona, 1990).
The amount of gas (mol) in the swimbladder wascalculated using Boyle’s law (Harden Jones, 1951;Alexander, 1959). If the actual swimbladder volume(Vs; m3) differs fromVn, the fish will experience posi-tive or negative buoyancy force (B; N):
B = (Vs − Vn)ρwg (2)
whereg is the gravitation constant (9.81 m s−2).
2.3. Swimbladder leakage
A swimbladder will need constant refilling due todiffusion into surrounding tissues (Denton et al., 1972;Lapennas and Schmidt-Nielsen, 1977; Ross, 1979).O : theo icha e andl l.,1p sur-r ag olate(e isc ume(r
S
w el-l at
which oxygen leaks from the swimbladder (Leakage;mol s−1) is:
Leakage= GSs(P − P0)
RT(4)
whereG (m3 O2 m−2 atm−1 s−1) is the oxygen conduc-tance of the swimbladder wall,R (m3 atm mol−1 K−1)the universal gas constant, andT (K) the temperaturein Kelvin.
2.4. Secretion
The equations for gas secretion are based on work byHarden Jones and Scholes (1985). It is assumed that thediffusion barrier between the gas gland and the swim-bladder is so little that the rate-limiting step is the trans-port of oxygen and multiplication of partial pressuresin the rete and the gas gland. As a consequence, secre-tion will be independent of depth. The model calculatesthe maximum rate of secretion (Secmax; mol s−1), as afunction of cardiac output (Cout; m3 s−1), the fraction ofCout diverted to therete(Crete; dimensionless) (Pelsterand Scheid, 1992), the volume fraction of O2 in arterialblood (O2a; dimensionless) measured atP0 (1 atm), andan efficiency factor of therete(Reff; dimensionless):
Secmax = CoutCreteO2aReffP0
RTδO2
(5)
where δO is the fraction of oxygen in the secretedg -p att thee owa aseC st staticC nedw illg ndt
i ture)op
W
xygen diffusion is dependent on three variablesxygen permeability of the swimbladder wall, whgain is dependent on its species-specific guanin
ipid content (Denton et al., 1972; Wittenberg et a980); the swimbladder surface area (Ss; m2); and theressure gradient between the swimbladder andounding tissues (P− P0; atm). The swimbladder ofeneral teleost is assumed to be formed as a prcigar-shaped) ellipsoid with polar radiusa (m) andquatorial radiusb (m). The swimbladder surfacealculated based on the current swimbladder volVs) and a and b (a= ((Vs3(a/b)2)/(4))1/3 when theatioa/b is known):
s = 2πb2(
1 + (a/b) arcsin(e)
e
)(3)
heree (dimensionless) is the eccentricity of theipse given bye=
√(1− b2/a2). Hence, the rate
2
ases. It is likely that bothCout andCretevary in a comlex fashion. At high exercise levels, it is likely th
he rete experiences a reduction in blood flow asxercising muscles are given priority. Similarly, at lctivity levels, it is possible that the fish can increout, and thus blood flow to therete, when it need
o speed up absorption or secretion. Therefore, aout estimated for a typical cruising speed combiith a staticCreteas the maximum measured value wive a good approximation of maximum blood flow a
hus maximum secretion rate.The minimal amount of work (W; J) required to
sothermally compress (i.e. at constant temperane mol of gas at temperatureT from pressureP1 toressureP2 is (Glasstone and Lewis, 1964):
= RT ln
(P2
P1
)(6)
314 E. Strand et al. / Ecological Modelling 185 (2005) 309–327
It is further necessary to divide the minimum en-ergy with an efficiency factor for converting biologicalchemical energy into mechanical energy (Eeff, dimen-sionless).Eeff includes the effects and energetic costsfor the Bohr, Root, and salting-out effects, productionof lactate, and the pentose-phosphate pathway (Pelsteret al., 1989, 1994). If these effects were to be mod-elled explicitly, it would be necessary to know the costand contribution of each of these effects. A precise setof equations to describe these processes thus requiresfurther experimental research; in this model the focusis set on the overall energetic cost of secretion.Esec(J s−1) is thus the required energy to secrete the gases:
Esec= SecRT ln
(P
P0
)E−1
eff (7)
whereP is the hydrostatic pressure andP0 the com-bined partial pressures of the gases in arterial blood,assumed constant (1 atm). Sec is the amount of gasessecreted and always less than or equal to Secmax. Thedepth at which the leakage rate equals the maximumgas secretion rate is termed the critical depth (zc; m),and was calculated by finding the pressure at whichleakage from Eq.(4) equals maximum secretion fromEq.(5) (P= l + z/10):
zc = 10SecmaxRT
GSs(8)
2.5. Absorption
im-b forgt gena ftd pres-s terialb st ved.T binc them -ib
A
where O2sol the solubility of oxygen (m3 O2 m−3
blood atm−1) andHb is the fraction of availablehaemoglobin binding sites (dimensionless). TheδO2 in-cludes the other gases that follow physically dissolvedoxygen.
2.6. Hydrodynamic lift
When neutral buoyancy cannot be achieved by theswimbladder alone, lift (up or down) has to be createdby hydrodynamic forces in order to avoid sinking orfloating. Experimental studies have shown that largecod, by using their pectoral fins as hydrofoils whileswimming freely, can compensate for 70–90% of thelift from the swimbladder (Ona, 1990). This model con-siders four distinct methods to create hydrodynamiclift: hovering without moving through the water, bodylift, changing the tilt angle, and using the pectoral finsas hydrofoils. Hovering requires that the fish is station-ary and cannot be combined with the other methodsfor hydrodynamic lift. The last three methods requirethat swimming speed and tilt angle are calculated si-multaneously to find the most energy-efficient way toproduce the required lift. An overview over the hydro-dynamic forces considered is shown inFig. 1.
The energetic cost of lift production has to be addedto the standard metabolic rate SMR (J s−1). The totalmetabolic rate (TMR; J s−1) will then be either:
TMR = SMR+ MRHOVER + Esec (10a)
it
T
i cc lc ise im-m thatbt bolicc
M
est ring
Physoclist fish have a particular area on the swladder wall called the oval, which is specialisedas absorption (Fange, 1953; Steen, 1963b). There are
hree major variables that influence the rate of oxybsorption (Steen, 1963b). First, only the fraction o
he cardiac output that flows through the oval (Coval;imensionless) can absorb oxygen. Second, theure gradient between the swimbladder and the arlood (in this model calculated asP− P0) determine
he amount of gas that can be physically dissolhird, available oxygen-binding sites on haemogloan transport additional oxygen. By adoptingethod ofHarden Jones and Scholes (1985), the max
mum oxygen absorption rates (Absmax; mol s−1) cane calculated as:
bsmax = CoutCovalP0
RT
[O2sol(P − P0)
δO2
+O2aHb
](9)
f the fish is hovering, and where MRHOVER (J s−1) ishe metabolic cost of waving the pectoral fins; or:
MR = SMR+ AMR + MRPECT+ Esec (10b)
f the fish is swimming. AMR (J s−1) is the energetiost of swimming and MRPECT(J s−1) is the additionaost of lift production via the pectoral fins. AMRquivalent to measured metabolic rate during swing minus the standard metabolic rate. For a fisheats a pair of fins of lengthFL (m) through an angleγ
o create a force equal to the buoyancy, the metaost will be (Alexander, 2003):
RHOVER = HGROUND
√|B|3
2WF2Lγ
(11)
HGROUND (dimensionless) is a factor that includhe energetic saving that can be obtained if hove

E. Strand et al. / Ecological Modelling 185 (2005) 309–327 315
Fig. 1. Schematic drawing of the forces acting on a fish with swim-bladder. (a) The forces acting on a negatively buoyant fish swimminghorizontally. Thrust will equal drag at constant velocity. Lift is cre-ated by using the pectoral fins as hydrofoils (Lfin) and by the generalbody surface (Lbody). (b) When the fish is tilting, the thrust vectorcan also produce lift (L). This will also affect the efficiency withwhich the pectoral fins and the body can create lift.
takes place close to the bottom (less than the length ofthe pectoral fins above solid substrate; (Blake, 1979).HGROUND takes a value <1 when the fish is negativelybuoyant and close to the bottom and 1 for all other situ-ations.Blake (1979)calculated potential savings in therange 30–60% for the mandarin fishSynchropus pic-turatus. We have assumed that hovering is a potentialoption only for negatively buoyant fish.
The fish can also change its tilt angleϕ. TheThrust(N) will then have a vertical component, which willgive a lift Lϕ (N):
Lϕ = sinϕThrust (12)
To find the thrust vector, we use the relationshippower = force× velocity. Since power here is equal tothe metabolic rate associated with swimming, we have:
Thrust= AMRΩ
U(13)
whereU (m/s) is the swimming speed that the fishwould have had if neutrally buoyant and swimmingwith the same metabolic cost. When the fish is tilting,
part of the thrust vector is directed downward, and thehorizontal velocity, which is the fish’ speed throughthe water that can generate other types of lift, will beUH = cosϕU. A closer inspection of available literatureon the metabolic cost of swimming revealed that swim-ming efficiency increased with swimming speed (e.g.Sepulveda and Dickson, 2000; Dickson et al., 2002;Nauen and Lauder, 2002). It was necessary to intro-duce the factorΩ (dimensionless), which is the bio-logical efficiency of converting chemical energy to apropelling force. It is here modelled as a function ofU2 (reasons for the parameterΩ and its mathematicalformulation are given in Section4):
Ω = Ωmin +(Ωmax −Ωmin
U2max
) (U
BL
)2
(14)
whereΩmin andΩmaxare minimum and maximum val-ues forΩ, respectively, andUmax is the maximum sus-tained swimming speed measured in BL s−1. Typically,Ω would scale betweenΩmin = 0.05 andΩmax= 0.20.Defining Ω in this way preservesDbody as a func-tion of U2–2.5, and letsΩ scale with body size in ac-cordance with the biological interpretation. For mostspeciesUmax decreases with body size and increaseswith temperature.
Given that the fish maintains a constant speed, thehorizontal component of the thrust vector will be equalto the body dragDbody (N):
D
cel ivest de-s oralfi -r heb
L
w rt avelt ub-s -t
body = cosϕThrust (15)
Many fish utilize also the body drag to produift, e.g. through having a dorsal curvature that ghe overall body a wing shape, or by specificallyigned appendages. Holding the lift from the pectns aside, we define body liftLbody (N) as the noneversible (always working only upward) lift from tody:
body =[L
D
]bodyDbody cosϕ (16)
here[LD
]body is a positive lift-to-drag coefficient fo
he body as a whole. A perfectly designed fin can hift-to-drag coefficients up to 5 (Alexander, 1971), buthe value for the whole body will for most fish be stantially lower. Note that sinceDbody is always posiive, Lbody will also be a non-negative value.

316 E. Strand et al. / Ecological Modelling 185 (2005) 309–327
The pectoral fins can be extended as hydrofoils,which will increase the drag but also be very efficientat producing lift. We assume that the pectoral fins be-come less efficient at producing lift when the tilt angleincreases;Lfin/cos is therefore used in the equation.The extra energy required to produceLfin (N) lift is then(Alexander, 1990, 2003):
MRPECT = (Lfin/ cosϕ)2
ΩπρwUHF2L
(17)
The number 4 in the denominator in Alexander’soriginal equation is cancelled by our use of fin lengthFL, which is only half the span of the pectoral fin hy-drofoil and when squared produces a 4 also in the nu-merator.
We now assert that the vertical forces have to sumto zero:
B = Lϕ + Lbody + Lfin (18)
The best combination of tilt angleϕ and swimmingspeedU can now be iterated from the set of equationsby minimizing the sum of AMR and MRPECT. Theresulting cost of swimming to create hydrodynamic liftcan then be compared to the energetic cost of hoveringto see which option is favourable in energetic terms.
2.7. An example: Atlantic cod
To test this description of buoyancy control, themodel was parameterised for Atlantic cod (G. morhua).F beeno luesf one,t t yete pha-s them ail-a st ex-p ands ;H Dick-s re-d arep ngeo
n-s -r
to width ratio (thea to b ratio in Eq. (3)) was esti-mated to be 10.Scholander (1956)found that O2 madeup on average 63% of the secreted gases in cod, thusδO2 = 0.63. The energy converting efficiency duringsecretion was set toEeff = 0.10 (Alexander, 1971). Theoxygen content of arterial fish blood was set to 10% byvolume (O2a= 0.10,Prosser, 1973; Harden Jones andScholes, 1985). Steen (1963a)obtained experimentallya reteefficiency of 20% in the eel (Anguilla anguilla),thusReff = 0.20. These parameters describe secretion inaccordance with the experiments inHarden Jones andScholes (1985).
The total metabolic cost (TMR; Eq.(10b)) wascalculated based on a general bioenergetic modelby Hewett and Johnson (1992)with cod parameters(Hansson et al., 1996):
SMR = αMβF (T ) (19a)
AMR = SMR Act (19b)
Act = 3.2U1.5
BL(19c)
whereαMβ is a weight dependent andF(T) a tempera-ture dependent function of metabolism withα= 0.397,β = 0.828, andF(T) = 0.502 at 5C (seeHansson et al.,1996for details). Act (dimensionless) is the incremen-tal cost of activity and is estimated based on measure-ments of oxygen consumption during swimming (U)for cod in the range 0.24–1.91 kg (expressed on thef en,1
mW ofb to ac
C
yl ng-i romA
F
hwdB
or some parameters, experimental values had notbtained for cod, and we were forced to use va
rom other species. In a model as complex as thishere will necessarily be biological parameters noxperimentally determined. For this reason, emis was put on matching the overall output fromodel’s different components with data where avble, and uncertain parameters were tuned againerimental studies on cod swimbladder dynamicswimming physiology (e.g.Tytler and Blaxter, 1973arden Jones and Scholes, 1985; Sepulveda andon, 2000). To help visualize the sensitivity of the picted output from the model, many of the resultslotted for fish of various sizes and over a wide raf swimbladder volumes.
A value of 1081 kg m−3 was used for cod tissue deity (Harden Jones and Scholes, 1985). Based on Xay pictures of cod (Clay and Horne, 1994), the length
orm used inWare, 1978; Schurmann and Steffens997; Webber et al., 1998; Reidy et al., 2000).
Cardiac output (Cout, m3 s−1) based on data froebber et al. (1998)was calculated as a function
ody mass and the metabolic rate correspondingruising speed of 0.4 BL s−1:
out = 9.07× 10⁻⁷TMR − 3.79× 10⁻⁸M (20)
Pectoral fin length (FL) was calculated from bodength (BL) using a relationship obtained for cod rang from 10 to 105 cm (based on unpublished data f.G.V. Salvanes;n= 400,R2 = 0.98):
L = 0.1374BL+ 0.0039 (21)
Following Alexander (2003), the angle throughich the fin beats when hovering was set toγ = ra-ians. Maximum sustainable swimming speed (Umax;L s−1) was modelled to fall from 1.8 BL s−1 in 0.2 kg

E. Strand et al. / Ecological Modelling 185 (2005) 309–327 317
cod and stabilise at 1.2 BL s−1 in cod > 3 kg(based ondata fromSchurmann and Steffensen, 1997; Webber etal., 1998; Reidy et al., 2000):
Umax = 0.8e−M + 1.2 (22)
The parametersG (the oxygen conductance of theswimbladder wall),Crete, and Coval (the proportionof cardiac output that can be directed to the reteand the oval, respectively) have to our knowledgenot been measured for cod.Harden Jones and Sc-holes (1985)measured rates of absorption and se-cretion in cod, and these parameters were chosen tomatch their experimental results. The blood flow to theoval (Coval) was measured in anaesthetized eel (An-guilla vulgaris) by Steen (1963b)and found to bein the range 6–28%.Crete has to our knowledge notbeen measured. Since theretewith its counter-currentvascular structure is much more elaborate than theoval, we usedCoval = 0.25 andCrete= 0.10, two valuesthat provided good fit with the experimental data oncod fromHarden Jones and Scholes (1985). Lapennasand Schmidt-Nielsen (1977)measured oxygen con-ductanceG between 1.5× 10⁻⁹ and 1.5× 10⁻⁸ m3
O2 m−2 atm−1 s−1 in the deep-dwelling Conger eel(Conger oceanicus) and five teleosts utilising shal-lower habitats compared to cod. A value in the lowerrange,G= 1.5× 10⁻⁹, was chosen so that a 2-kg codwould have a critical depthzc ≈ 533 m. The model’spredictions of net secretion rates and critical depthsao sonso u-t m( on( th,o er-t epthc -g derw hed.G nt int
r-s m-p ep inedf dy
Fig. 2. Swimbladder dynamics as a function of depth in a modelparameterised for codGadus morhua. (a) Absolute leakage (dottedline), secretion (dashed line), and absorption (solid line) as a func-tion of depth, expressed in (mol kg−1 s−1). The grey area is thedifference between leakage and maximum secretion and is thus themaximum net secretion possible at that depth, (b) Net secretion andabsorption, both including the effects of leakage, measured in vol-ume (l kg−1 s−1). The calculations were made for a 2-kg Atlanticcod. Note the logx-axes.
surface and body shape, and resulted in a slight asym-metry in the energetic cost between creating positiveand negative lift.
To our knowledge, no study has ever combined mea-sures of different aspects of buoyancy regulation to adegree that can be used as a set of independent datato validate the model described above. That would re-quire simultaneous measures of gas rates, buoyancy,swimming speed and mode, and metabolic rate. Rather,
re sensitive to the numerical value ofG; any choicef G should therefore be accompanied by comparif critical depths with the species’ vertical distrib
ion. Cod is regularly found down to depths of 400Godø and Michalsen, 2000), and because secretiby volume) is very slow close to the critical depur choice ofG implies that the cod over its entire v
ical range has a swimbladder that responds to dhange within reasonable time (Fig. 2a). Data on ontoenetic changes in the gas conductivity of swimbladall tissue has, to our knowledge, not been publisas conductivity was therefore assumed consta
his model.We assumed
[LD
]body = 0.75, which is the conve
ion of drag over the fish body to a vertical lift coonent (discussed inVogel, 1994, pp. 239–240); tharameter has to our knowledge not been determ
or fish). This included lift produced by the overall bo

318 E. Strand et al. / Ecological Modelling 185 (2005) 309–327
swimbladder dynamics and hydrodynamic lift genera-tion has to be tested separately against experimentaldatasets, and the combination of the two in a bioen-ergetic framework can at present only be shown, nottested. To compensate this, we have tried to use pa-rameter values from published experiments and strivedto make our thoughts and assumptions as clear to thereader as possible. We have also taken two approachesto demonstrating the benefits from combining swim-bladder dynamics and hydrodynamic lift generation.First, we show estimates for the energetic cost of buoy-ancy control for a series of constructed patterns for dielvertical migration for a 2-kg cod. Each migration pat-tern was simulated for 6 days to stabilize, and resultswere shown for the last 24-h period only. Second, wevisualise the model using 12 months of data on verti-cal positions collected from a 3-kg cod carrying a datastorage tag (resolution 2 h, interpolated to time-steps of15 min, fromGodø and Michalsen, 2000). The cod wastagged on the 21 March 1996. To assure that any possi-ble handling wounds would have healed, three weeks,starting at 22 October 1996, were selected for visuali-sation.
3. Results
Several authors have studied different modes ofbuoyancy regulation (e.g.Steen, 1963a; Alexander,1 994T f thed im-b siblei h. Iti eg-u ndse uralm
3
forg dento wew ,a mec
The processes that describe leakage and absorptionof gases from the swimbladder depend on the differ-ence in partial pressure between the swimbladder (athydrostatic pressure) and the surrounding tissues in-cluding blood (in equilibrium with sea surface con-ditions at best). As this pressure difference increaseswith depth, the rates for these two processes will alsoincrease (Fig. 2a). The absolute gas secretion rate is, onthe other hand, unaffected by depth (Fig. 2a). Conse-quently, the net rate of gas secretion, which is how fastthe swimbladder can be filled, decreases with depth (theshaded area inFig. 2a). Note that these rates are max-imum rates, and we assume full regulatory flexibilitywithin these limits.
The pattern of volume changes is different from se-cretion and absorption rates, due to the increasing hy-drostatic pressure with depth (Fig. 2b). Although moregas molecules (measured in mol) can be absorbed withdepth, the volume that can be absorbed is almost in-dependent of depth except for slow changes close tothe surface. Overall, the volume that can be absorbedis much larger than the volume that can be secretedper unit time (the axis inFig. 2b is logarithmic; ab-sorption volume is 10–10,000 times larger than thesecretion volume depending on depth). Maximum netsecreted volume declines rapidly with depth and ap-proaches zero where leakage and secretion rate canceleach other. This asymmetry between absorption andsecretion means that fish will more often be negativelythan positively buoyant (noted byAlexander, 1966;T er,1 llys andb
rk sorp-t thep -b thin± udy.O inede et size,a agea pthi
theb tion
972; Harden Jones and Scholes, 1985; Vogel, 1).he results presented here provide the basics oifferent modes, but focus on the link between swladder dynamics and hydrodynamics made pos
n our paper by the common bioenergetics approacs in the linking of the different modes of buoyancy rlation in a common currency that our work transcearlier work and creates a basis for future behavioodels and field data interpretation.
.1. Swimbladder dynamics
The swimbladder is subject to the physical lawsases, which make swimbladder dynamics depenn both depth and body size. To clarify the picture,ill describe how rates, in mol s−1, vary with depthnd then focus on how this is translated into voluhanges and affect the behavioural repertoire.
ytler and Blaxter, 1973; Arnold and Greer Walk992). In addition, filling the swimbladder is radicalower at greater depths, which will affect the costsenefits of vertical behaviour.
Harden Jones and Scholes (1985)present to ounowledge the best experimental data set on abion and secretion in cod. We have carefully chosenarameter values ofCrete andCoval so that the swimladder dynamics of our model match their data wi10% over the range of depths included in their stur estimates are also very similar to those obtaxperimentally byTytler and Blaxter (1973). Becaushe surface:volume ratio decreases with increasing
larger fish will have a relatively lower gas leakcross the swimbladder wall. As a result, critical de
ncreases with body size (Fig. 3).Energy is required to pressurise gases in
lood to fill the swimbladder. When gas secre

E. Strand et al. / Ecological Modelling 185 (2005) 309–327 319
Fig. 3. Size dependence of critical depth and leakage across theswimbladder wall. The surface-to-volume ratio of the swimbladderchanges as a cod grows in size. As an effect, the relative amount ofgas leaking across the swimbladder wall decreases with body size(grey line). Critical depth, i.e. the depth at which maximum secretionequals gas leakage, will thus increase with body size (black line).
is at its maximum, the estimated energetic cost is0.0017 J kg−1 s−1. This corresponds to 1.0% of thestandard metabolism and is, as will be shown below,close to negligible compared to the energy required forswimming.
3.2. Hydrodynamic lift
If neutral buoyancy can not be achieved through theswimbladder alone, the fish must depend on hydrody-namic lift to maintain its position in the water column.The present model assumes that lift is produced eitherby hovering, or by swimming at the optimal tilt an-gle, which would combine pectoral fin lift, body lift,and lift from the tilted thrust vector. Lift created byhydrodynamic forces is independent of depth. We willpresent results for fish of varying body mass, and forlift production corresponding to swimbladder volumesranging from−100% (empty swimbladder) to +100%(double size) of the optimal volume. We will first focuson hydrodynamic lift created during swimming, beforewe turn to hovering as an alternative and compare thetwo.
The more the swimbladder volume deviates from theoptimal volume, the higher was the estimated compen-satory swimming speed (Fig. 4a). The compensatoryswimming speed also increased with fish size whenmeasured in m s−1, but when measured in BL s−1 it didnot vary with body mass. Each half ofFig. 4a had the
Fig. 4. Properties of hydrodynamic lift production when the swim-bladder volume deviates from optimal. The left-to-right axis is theswimbladder volume, where 0% corresponds to the optimal volumethat would have resulted in neutral buoyancy. Negative buoyancy(sinking) is to the left; positive buoyancy (floating) to the right. Fishsize (kg) increases from 0.2 kg in front to 5.0 kg in the back. (a) Com-pensatory swimming speed, expressed in body lengths per second(BL s−1). (b) The values taken by the energy conversion efficiencyΩ between the fish’ oxygen consumption and the physical work re-quired to overcome drag.Ω increases with increasing swimmingspeeds up to maximum sustainable swimming speed, where it wouldreach a maximum of 0.20. (c) The optimal tilt angle at different levelsof buoyancy and fish size. Panels (a) and (b) assume that the fish wasswimming at the optimal tilt angle.
expected concave-up shape: the deviation in swimblad-der volume is proportional to the required lift, which isproportional to drag, which again is a function ofU2–3.This was achieved by the energy conversion efficiency
320 E. Strand et al. / Ecological Modelling 185 (2005) 309–327
Ω (Fig. 4b), which scales with swimming speed from0.05 (at zero swimming speed) to a maximum value of0.20 (at the maximum swimming speed; see Section4for details).
Close to neutral buoyancy, fish will have a low en-ergy conversion efficiencyΩ. They will therefore userelatively more energy for swimming at the speed thatcreates sufficient drag for lift production, which in turn
will favour a steeper tilt angle (Fig. 4c). The optimaltilt angle increased also for small fish. This is becausesmaller fish have a higher maximum sustainable swim-ming speed (Eq.(22)) and will hence achieve a rela-tively lower energy conversion efficiencyΩ. For mostcombinations of size and buoyancy, the optimal tilt an-gle was found to be around 7 for both positive andnegative buoyancy.
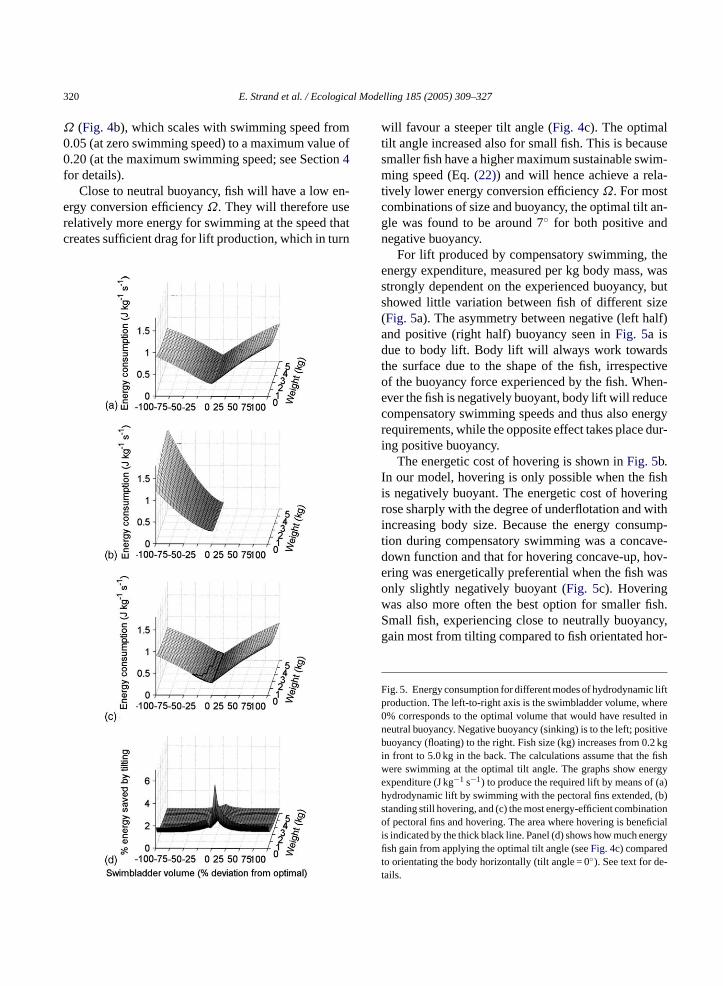
For lift produced by compensatory swimming, theenergy expenditure, measured per kg body mass, wasstrongly dependent on the experienced buoyancy, butshowed little variation between fish of different size(Fig. 5a). The asymmetry between negative (left half)and positive (right half) buoyancy seen inFig. 5a isdue to body lift. Body lift will always work towardsthe surface due to the shape of the fish, irrespectiveof the buoyancy force experienced by the fish. When-ever the fish is negatively buoyant, body lift will reducecompensatory swimming speeds and thus also energyrequirements, while the opposite effect takes place dur-ing positive buoyancy.
The energetic cost of hovering is shown inFig. 5b.In our model, hovering is only possible when the fishis negatively buoyant. The energetic cost of hoveringrose sharply with the degree of underflotation and withincreasing body size. Because the energy consump-tion during compensatory swimming was a concave-down function and that for hovering concave-up, hov-ering was energetically preferential when the fish wasonly slightly negatively buoyant (Fig. 5c). Hoveringw fish.S ncy,g or-
F c liftp ere0 ed in
n itiveb .2 kgi fishw ergye (a)h , (b)s ationo ficiali ergyfit -tas also more often the best option for smallermall fish, experiencing close to neutrally buoyaain most from tilting compared to fish orientated h
ig. 5. Energy consumption for different modes of hydrodynamiroduction. The left-to-right axis is the swimbladder volume, wh% corresponds to the optimal volume that would have resulteutral buoyancy. Negative buoyancy (sinking) is to the left; posuoyancy (floating) to the right. Fish size (kg) increases from 0
n front to 5.0 kg in the back. The calculations assume that theere swimming at the optimal tilt angle. The graphs show enxpenditure (J kg−1 s−1) to produce the required lift by means ofydrodynamic lift by swimming with the pectoral fins extendedtanding still hovering, and (c) the most energy-efficient combinf pectoral fins and hovering. The area where hovering is bene
s indicated by the thick black line. Panel (d) shows how much ensh gain from applying the optimal tilt angle (seeFig. 4c) comparedo orientating the body horizontally (tilt angle = 0). See text for deails.

E. Strand et al. / Ecological Modelling 185 (2005) 309–327 321
izontally (in percentage change between tilting andnon-tilting) (Fig. 5d). Larger fish gain relatively lessthan small fish independent of buoyancy level. How-ever, the absolute amount of energy saved by tilting(kJ kg−1 s−1) increases for all size classes with bothdecreasing and increasing buoyancy.
3.3. Ecological implications
Hydrodynamic forces stemming from swimmingand lift from the swimbladder often complement eachother in producing lift; the swimbladder being slowto adjust but energetically cheap to operate while hy-drodynamic forces have the opposite properties. Toshow how these two modes of lift production work to-gether, we show the estimated energetic cost for variousvertical migration patterns inFig. 6. The example as-sumes that cod stayed at 200 m depth during daytimeand migrated to shallower waters during the night tofeed (this behaviour is representative for cod, see e.g.Godø and Michalsen, 2000). The vertical movementwas set to take always 1 h, so that 11 h were spent atthe top and the bottom of the vertical range (exam-ples are shown inFig. 6a). Because gases are absorbedmuch faster than they are secreted, the cod was closeto neutrally buoyant at the top of the vertical range.At the daytime depth, cod became progressively morenegatively buoyant as the vertical migration distance in-creased (Fig. 6b). Consequently, hydrodynamic forceshad to compensate for negative buoyancy through in-c sti iond ert encec vol-u t fallw
3
ap-p in-d raget to nted.I cy att y isn me
Fig. 6. A constructed example of diel vertical migration in cod andthe corresponding predictions of swimbladder volume, swimmingspeed and energetic cost from a model paramterised for codGadusmorhua. (a) Examples of constructed diel vertical migration patternsfor which buoyancy regulation were simulated for a 2-kg cod. Thepattern was simulated for 6 days to stabilise; only the results for thelast 24-h period are shown, (b) Mean swimbladder volume and com-pensatory swimming speed to create the required lift at the daytimedepth as a function of the vertical migration distance. At the top ofthe vertical range, swimming speed was close to zero and the swim-bladder volume virtually optimal, (c) The energetic cost of buoyancyregulation separated by the periods spent at the bottom (day) and top(night) of the vertical migration profile.
to stabilize. The model was not sensitive to the choiceof initial swimbladder volume. Estimated swimbladdervolumes were between−40 and 0% deviation from op-timal volume (Fig. 7b). Calculated energy expenditure,
reased swimming (Fig. 6b), and the energetic concreased rapidly with increasing vertical migratistance (Fig. 6c). During night, fish that stay clos
o the surface experience a lower leakage and hheaper maintenance of the optimal swimbladderme, which is the reason that the energetic cosith migration distance (Fig. 6c).
.4. Application to field data
The model predictions were further explored bylying it to a set of observed vertical positions of anividual cod recorded over one year using a data sto
ag (Godø and Michalsen, 2000, Fig. 7a). Only a subsef three weeks starting 22 November 1996 is prese
t was assumed that the fish had neutral buoyanhe start of the period and the first simulated daot shown to allow the simulated swimbladder volu

322 E. Strand et al. / Ecological Modelling 185 (2005) 309–327
Fig. 7. (a) The observed vertical position of one Atlantic cod over a period of three weeks (data fromGodø and Michalsen, 2000). (b) The model’sprediction of the cod’s experienced swimbladder volume expressed in percent deviation from the optimal swimbladder volume that would havegiven neutral buoyancy. The cod was assumed to be neutral at time 0 and the first day is not shown to allow the swimbladder volume to stabilise.The horizontal line is optimal swimbladder volume. (c) The corresponding energy consumption (J kg−1 s−1) due to standard metabolic rate, thecost of gas secretion, and activity metabolism caused by compensatory swimming speed when the swimbladder volume deviated from optimal.The standard metabolic rate (SMR) is identifiable as the baseline (swimbladder volume optimal and thus no need for compensatory swimming).(d) The black bars indicate when the model predicted that hovering would have been an energetically favourable option.
including secretion and compensatory swimming, isshown inFig. 7c. The standard metabolic rate (SMR)is recognisable as the baseline for energy expenditure.Late on day 17, the cod went down to around 100 m andstayed there for several days with only short verticalmigrations to shallower depths. The model estimatedthat secretion slowly filled the swimbladder, and pre-dicted decreasing compensatory swimming speeds thatwould lead to a steady decrease in energy expenditure.After approximately 2 days, the swimbladder had at-tained optimal volume. Hovering was not enabled inthis simulation, but the energetic cost of hovering wascalculated for comparison. The black bars inFig. 7d in-
dicate when the model predicted that hovering wouldhave been energetically favourable. As expected, hov-ering was only favourable when the fish was close toneutrally buoyant; in total 50% of the time.
4. Discussion
The presentation of this model is based on parametervalues for cod. In a strict sense, the results apply only tocod. However, throughout this discussion of buoyancyregulation we try to establish a wider perspective, aim-ing at making general points with validity for a broad

E. Strand et al. / Ecological Modelling 185 (2005) 309–327 323
range of fish species that have physoclist swimbladders.More precise predictions will require that the model isre-parameterised for the relevant fish species. It shouldbe possible to apply an adjusted version of the modelto some physostome fish by allowing the fish to expelair if it becomes positively buoyant. It is also unclearto what extent physostome fish are capable of secretinggas (Moyle and Cech, 1988; Nøttestad, 1998).
4.1. The swimbladder
There are complex changes in the available be-havioural repertoire of physoclist fishes with increas-ing depth. For example, frequent vertical movementswill lead to negative buoyancy because absorption isfaster than secretion, an effect that is amplified ongreater depths. This is mainly due to the fact that netgas secretion is reduced while gas absorption is fasterwith increasing depth. Ontogenetic differences also im-pact swimbladder characteristics in many ways. Duringgrowth, the surface to volume ratio of the swimblad-der decreases. This reduces the relative gas leakagefrom the swimbladder, giving larger fish a comparativeadvantage at greater depths. To what extent such anontogenetic shift is involved in shaping the vertical po-sitioning strategies of different-sized fish is, however,difficult to estimate as so many other important aspectsof evolution can affect behaviour (e.g. predation risk,food accessibility).
Note also that the rates calculated are maximumr lcu-l sio-l edw yt -e ha se-c au-t derv lityw
4
ate ur-r cods be-
comes progressively more negatively buoyant at greaterdepths (Alexander, 1971; Harden Jones, 1981; Arnoldand Greer Walker, 1992; Godø and Michalsen, 2000).This tendency towards negative buoyancy was also ev-ident when the model was applied to constructed dielvertical migration patterns and field data. Calculationsmade on the observed behaviour from the tagged codindicated that most of the time was spent with a swim-bladder volume between−40 and 0% deviation fromthe optimal volume, and the cod was never signifi-cantly positively buoyant. With this in mind, our focushas been to model situations close to neutral buoyancyand with underflotation up to−40% as realisticallyas possible; the model thus sketches a coarser land-scape of energy usage for the less used behaviours.The model also presupposes a physiologically intactswimbladder in all situations. If the swimbladder’sfunctionality is compromised, e.g. by rupture duringrapid ascents, certain limitations must be defined in themodel.
A 2-kg cod that swims at a speed of 0.25 BL s−1,which is the average swimming speed measured in free-ranging cod (due to e.g. food search, horizontal migra-tions) (Løkkeborg, 1998), would, without increasingits energy budget, be able to freely deviate within 89and 106% of optimal swimbladder volume. Adapted to100 m, this means that moving between 93 and 114 mwould be without additional energetic costs. For a codadapted to 300 m, this range would extend from 282 to
andr-d upme-
tion.ga-osthe
iumsur-
allsi-
thissalvideis
ates and that regulation takes place within the caated limits, analogous to nervous control with phyogical constraints. The swimbladder wall is providith stretch receptors (Qutob, 1962) and innervated b
he autonomous nerve system (Wahlqvist, 1985; Schwrte et al., 1997). Although this would imply that fisre unable to deliberately plan whether or not torete or absorb gas, it would instead allow fish toonomously and continuously adjust their swimbladolume towards neutral buoyancy with great flexibiithin the calculated limits.
.2. Negative versus positive buoyancy
First, it would be instructive to establish to whxtent over- or underflotation occur in nature. Cent interpretations of empirical data conclude thattays neutral near the top of its vertical range and
338 m.Buoyancy can be both positive and negative,
creating a lift to overcome it may turn out to be diffeent depending on whether the force has to be createor down. Three aspects suggest that there is an asymtry: (1) gas absorption is much faster than gas secreA fish is therefore likely to spend much more time netively than positively buoyant, and should thus be mefficient at counteracting negative buoyancy. (2) Tlift generated by a wing that moves through a medis dependent among other factors on wing shape,face area, and angle of attack (Vogel, 1994). Althoughthe pectoral fins of cod are highly manoeuvrable indirections, the posterior part of the fin base is potioned more ventrally than the anterior fin-base:gives the fins a positive angle of attack. (3) Dorcurvature and flattened fish bodies may also prolift merely by moving forward through the water. Thasymmetry is included in the parameter
[LD
]body, which

324 E. Strand et al. / Ecological Modelling 185 (2005) 309–327
in a broad interpretation includes the effects of point2 and 3 above. As a result, it is energetically cheaperto produce positive lift, which is the common situationsince fish are most often negatively buoyant.
4.3. Energy conversion
There is a paradox in the way active metabolicrate scales with swimming speed that became appar-ent during the work trying to solve the equations fordrag involved in this paper. Body drag is most likelyto be proportional toU1.5–2.0(Vogel, 1994). Power isforce× velocity, which means that active metabolicrate (AMR; J s−1) required to overcome body dragat a given swimming speed, should be proportionalto Dbody× U, i.e. proportional toU2.5–3.0. Paradoxi-cally, measures of metabolic rate at increasing swim-ming speeds show that metabolic rate is proportional toU1.0–1.5, notU2.5–3.0(Schurmann and Steffensen, 1997;Webber et al., 1998; Reidy et al., 2000; Sepulveda andDickson, 2000). This suggests that fish are more effi-cient in converting chemical energy into physical workat higher swimming speeds.
Digital particle image velocimetry can preciselymeasure the force exerted on water, and has recentlybeen applied on swimming fish (e.g.Drucker andLauder, 1999). For chub mackerelScomber japonicusswimming at constant speed in a flow tunnel, thrustwas found to be a function ofU2.5 (Nauen and Lauder,2002). Metabolic rate should then be proportional toU f ac-t ck-e ofU al.,2 ra-tL -sa ex-p theml ncet eralo ingsla mo-t hich
elasticity can be brought into play by the undulatingfish body.Ω would typically be higher in fish specieswell-adapted to prolonged or fast swimming.
4.4. Tilt angle
Tilting has strong implications for fisheries sciencebecause target strength changes with the exposed cross-sectional area of the swimbladder (MacLennan andSimmonds, 1992). Herring, for example, undertake ex-tensive vertical migrations during overwintering, andthese migrations are associated with large changes intilt angle (Huse and Ona, 1996). Our results show thattilting could save energy, although our model predictedenergy savings of only 0.5–6%. This is consistent withthe relatively small optimal tilt angle of around 7 pre-dicted by the model. Since tilting probably will bein conflict with common behaviours such as forag-ing, transport, and predator avoidance, it may be seenmostly during periods of rest or inactivity, or duringoverwintering as in the case of herring.
Another feature that changes target strength of fishis changes in swimbladder volume caused by verticalmigration (Nakken and Olsen, 1977; Ona, 1990). Thisis a problem during acoustic abundance measurementsof cod at times when the cod spends a considerablepart of the day off the bottom (Rose and Porter, 1996).In such cases, the swimbladder volume and thus tar-get strength (the acoustic reflection measured by anechosounder) will often be reduced deeper down sincec rti-c cans ro-v glew ionw derv sc es inb
ash ilta gu-l ont ner-g ev-e ofb likep ual
3.5. However, a regression on measurements oive metabolic rate in another study on chub marel revealed that metabolic rate was a function1.1 (Sepulveda and Dickson, 2000; Dickson et002). A closer look on the data reveal that the
io Ω between physical work per time (Nauen andauder, 2002) and metabolic rate (Sepulveda and Dickon, 2000) increased from 0.05 at 1.2 BL s−1 to 0.20t 2.2 BL s−1. Such an increased efficiency canlain the discrepancy between the theoretical andeasured relationships between AMR andU. We used
ower swimming speeds for cod in our model sihe chub mackerel is a faster swimmer, but the genbservation that efficiency increases with swimmpeed was preserved the way we modelledΩ. The bio-
ogical interpretation of an increasingΩ may embodyn enhanced efficiency as the number of recruited
or units increases, as well as the mechanisms by w
od is usually neutrally buoyant at the top of the veal range. Both tilt angle and swimbladder volumeignificantly influence target strength. Our model pides predictions of swimbladder volume and tilt anhen the vertical behaviour is known. In combinatith equations relating target strength to swimbladolume or shape (e.g.Ona, 1990), these predictionan be used to improve estimates and uncertaintiiomass estimates.
This model considers hovering and using finsydrofoils (including body lift and changing the tngle) as the only alternatives to swimbladder re
ation. Analogous to the effects of gait transitionshe energetic cost of terrestrial locomotion, more eetically feasible solutions may apply at different lls of under- or over-flotation. An alternative modeuoyancy regulation is suggested by the sawtoothrofile sometimes seen during tracking of individ
E. Strand et al. / Ecological Modelling 185 (2005) 309–327 325
fish on echograms. This pattern probably stems fromvoluntary floating/sinking interspersed with periods ofmore or less vertical swimming (Huse and Ona, 1996).Weihs (1973)suggested that a glide (downwards) andswim (upwards) mode of behaviour during horizon-tal migrations could be energetically advantageous forcontinuously underflotated fish, such as fish withoutswimbladders (e.g.Scombrids). This type of behaviour,however, is to our knowledge not reported for cod, butcould be favoured in situations when fish experiencesbuoyancy outside its normal range, or when e.g. fastswimming required for hydrodynamic lift productionwould make the fish conspicuous to predators.
4.5. Interpretation of field data
The calculated swimbladder volumes and energy ex-penditure for the cod equipped with a data storage tagshow how the present model can aid interpretation ofobserved behavioural patterns (Fig. 7a–d, Godø andMichalsen, 2000). The cod was likely to have foragedat times, and thus actively swimming more or less re-gardless of the state of its swimbladder throughout theperiod of recording. The predicted swimbladder vol-ume dynamics and corresponding energy expendituredo not take other possible activities into consideration.Interestingly, the application of this model to observeddepth positions opens up for a systematic analysis ofthe energetic implications of different categories of be-haviour. Coupling this information with the knowledgeo rentg olog-i ointt pedt
5
t isp studyb cale greeu es-t d ge-o e-s eticsd ith
estimates of swimming speed can aid interpretation ofactual and optimal behaviour.
The presented model makes explicit ways in whichenergetic costs and physiological constraints associ-ated with buoyancy control influence on behaviour. Therapidly increasing hydrostatic pressure with depth af-fects how readily the swimbladder can accommodateto depth changes. As the swimbladder responds moreslowly, compensatory swimming can create lift, butwill also increase the overall cost of buoyancy regu-lation. The relative importance of the swimbladder andcompensatory swimming will thus shift with depth, andthe implications for behaviour will vary.
This model synthesises available information aboutthe swimbladder and hydrodynamic buoyancy regula-tion. While some aspects of fish buoyancy regulationare well understood, it is evident that other aspects re-quire more research. Especially, both experimental andtheoretical studies of swimbladder volume during nat-ural behaviour and the hydrodynamics of swimmingincluding drag and lift are needed. The paradoxical re-lationship between metabolic rate and swimming speedsuggests that metabolic efficiency increases with swim-ming speed. The crudely modelled efficiency factorΩ in this paper suggests a type of solution that mayaid disentangling this complex relationship. The re-cent advances in thrust measures using digital parti-cle image velocimetry (e.g.Drucker and Lauder, 1999)are promising and may provide a more accurate de-scription of this phenomenon. However, the difficultieso ings calew dingi
A
o-v hichw nesf om-m ankt E.S.w waya 002-0 archC
f cod behaviour throughout the year and in diffeeographical areas can help us understand the ec
cal significance of these behaviours and also powards the evolutionary motivation that has shahem.
. Conclusions
According to the resolution of the time scale, iossible to use the equations described here toehaviour in varying detail. Although the numeristimates of energy consumption are to some dencertain, it will be possible to use the qualitative
imates to compare both behavioural strategies angraphical and temporal variations from longer timeries. In a more detailed perspective, the energuring daily vertical migrations in combination w
f scaling, where drag scales with absolute swimmpeed while metabolism and elastic properties sith body size, still push a mechanistic understan
nto the future.
cknowledgements
We would like to thank K. Michalsen for kindly priding us with the depth versus time data set on we were able to visualise the model, A.G.V. Salva
or data on fish fins, and I. Huse for reading and centing the manuscript. We would also like to th
wo anonymous reviewers for valuable comments.as supported by The Research Council of Nornd the European Commission contract Q5RS-20813; C.J. and G.H. were supported by The Reseouncil of Norway.

326 E. Strand et al. / Ecological Modelling 185 (2005) 309–327
References
Alexander, R.M., 1959. The physical properties of the swimbladdersof fish other than Cypriniformes. J. Exp. Biol. 36, 347–355.
Alexander, R.M., 1966. Physical aspects of swim bladder function.Biol. Rev. Camb. Philos. Soc. 41, 131–176.
Alexander, R.M., 1971. Swimbladder gas secretion and energy ex-penditure in vertically migrating fishes. In: Farquhar, G.B. (Ed.),Proceedings of an International Symposium on Biological SoundScattering in the Ocean. Maury Center for Ocean Science, Wash-ington DC, pp. 74–85.
Alexander, R.M., 1972. The energetics of vertical migration byfishes. Symp. Soc. Exp. Biol. 26, 273–294.
Alexander, R.M., 1990. Size, speed and buoyancy adaptations inaquatic animals. Am. Zool. 30, 189–196.
Alexander, R.M., 2003. Principles of Animal Locomotion. PrincetonUniversity Press, Princeton, NJ, 371 pp.
Arnold, G.P., Greer Walker, M., 1992. Vertical movements of cod(Gadus morhuaL.) in the open sea and the hydrostatic functionof the swimbladder. ICES J. Mar. Sci. 49, 357–372.
Beamish, F.W.H., 1966. Vertical migration by demersal fish in theNorthwest Atlantic. J. Fish. Res. Board Can. 23, 109–139.
Blake, R.W., 1979. Energetics of hovering in the mandarin fish (Syn-chropus picturatus). J. Exp. Biol. 82, 25–33.
Brunel, P., 1965. Food as a factor or indicator of vertical migrationsof cod in the western gulf of St. Lawrence. ICNAF Spec. Publ.6, 439–448.
Clark, C.W., Levy, D.A., 1988. Diel vertical migration by juvenilesockeye salmon and the antipredation window. Am. Nat. 131,271–290.
Clay, C.S., Horne, J.K., 1994. Acoustic models of fish: the Atlanticcod (Gadus morhua). J. Acoust. Soc. Am. 96, 1661–1668.
Denton, E.J., Liddicoat, J.D., Taylor, D.W., 1972. The permeabilityto gases of the swimbladder of the conger eel (Conger conger).J. Mar. Biol. Assoc. U.K. 52, 727–746.
D . Ef-and
s
D im-ified93–
F soclist.
G istry.
G eastmst)
H B.L.,
and
H ove-553–
Harden Jones, F.R., 1952. The swimbladder and vertical movementsof teleost fishes. II. The restiction to rapid and slow movements.J. Exp. Biol. 29, 94–109.
Harden Jones, F.R., 1981. Fish migration: strategy and tactics. In: Ai-dley, D.J. (Ed.), Animal Migration. Cambridge University Press,Cambridge, pp. 139–165.
Harden Jones, F.R., Scholes, P., 1985. Gas secretion and resorptionin the swimbladder of the codGadus morhua. J. Comp. Physiol.B Biochem. Syst. Environ. Physiol. 155, 319–331.
Hewett, S.W., Johnson, B.L., 1992. Fish Bioenergetics Model 2. Uni-versity of Wisconsin Sea Grant Institute, Madison, 80 pp.
Huse, I., Ona, E., 1996. Tilt angle distribution and swimming speedof overwintering Norwegian spring spawning herring. ICES J.Mar. Sci. 53, 863–873.
Jobling, M., 1995. Environmental biology of fishes. In: Fish andFisheries Series 16. Chapman & Hall, London, 436 pp.
Kuhn, W., Ramel, A., Huhn, H.J., Marti, E., 1963. The filling mech-anism of the swimbladder. Experimentia 19, 497–511.
Lapennas, G.N., Schmidt-Nielsen, K., 1977. Swimbladder perme-ability to oxygen. J. Exp. Biol. 67, 175–196.
Løkkeborg, S., 1998. Feeding behaviour of cod,Gadus morhua: ac-tivity rhythm and chemically mediated food search. Anim. Behav.56, 371–378.
MacLennan, D.N., Simmonds, E.J., 1992. Fisheries Acoustics. Chap-man & Hall, London, 325 pp.
Metcalfe, J.D., Arnold, G.P., 1997. Tracking fish with electronic tags.Nature 387, 665–666.
Moyle, P.B., Cech Jr., J.J., 1988. Fishes: an Introduction toIchtyology. Prentice Hall, Upper Saddle River, New Jersey,559 pp.
Nakken, O. and Olsen, K. 1977. Target strengths measurements offish. Rapp. P.-V. Reun. Cons. Int. Explor. Mer, vol. 170, pp.52–69.
Nauen, J.C., Lauder, G.V., 2002. Hydrodynamics of caudal fin loco-motion by chub mackerel,Scomber japonicus(Scombridae). J.
N egianr
O n in70,
P ns in
P d gas
P f therbon
495–
P pen-r
P aun-
Q eptor.
ickson, K.A., Donley, J.M., Sepulveda, C., Bhoopat, L., 2002fects of temperature on sustained swimming performanceswimming kinematics of the chub mackerelScomber japonicu.J. Exp. Biol. 205, 969–980.
rucker, E.G., Lauder, G.V., 1999. Locomotor forces on a swming fish: three-dimensional vortex wake dynamics quantusing digital particle image velocimetry. J. Exp. Biol. 202, 232412.
ange, R., 1953. The mechanisms of gas transport in the euphyswimbladder. Acta. Physiol. Scand. 30 (Suppl. 110), 1–133
lasstone, S., Lewis, D., 1964. The Elements of Physical ChemMacMillan & Co, London, 758 pp.
odø, O.R., Michalsen, K., 2000. Migratory behaviour of north-Arctic cod, studied by use of data storage tags. Fish. Res. (A48, 127–140.
ansson, S., Rudstam, L.G., Kitchell, J.F., Hilden, M., Johnson,Peppard, P.E., 1996. Predation rates by North Sea cod (Gadusmorhua)—predictions from models on gastric evacuationbioenergetics. ICES J. Mar. Sci. 53, 107–114.
arden Jones, F.R., 1951. The swimbladder and vertical mments of teleost fishes. I. Physical factors. J. Exp. Biol. 28,566.
Exp. Biol. 205, 1709–1724.øttestad, L., 1998. Extensive gas bubble release in Norw
spring-spawning herring (Clupea harengus) during predatoavoidance. ICES J. Mar. Sci. 55, 1133–1140.
na, E., 1990. Physiological factors causing natural variatioacoustic target strength of fish. J. Mar. Biol. Assoc. U.K.107–127.
elster, B., 2001. The generation of hyperbaric oxygen tensiofish. News Physiol. Sci. 16, 287–291.
elster, B., Scheid, P., 1992. Countercurrent consentration ansecretion in the swimbladder. Physiol. Zool. 65, 1–16.
elster, B., Kobayashi, H., Scheid, P., 1989. Metabolism operfused swimbladder of the European eel: oxygen, cadioxide, glucose and lactate balance. J. Exp. Biol. 144,506.
elster, B., Hicks, J., Driedzic, W.R., 1994. Contribution of thetose phosphate shunt to the formation of CO2 in the swimbladdetissue of the eel. J. Exp. Biol. 197, 119–128.
rosser, C.L. (Ed.), 1973. Comparative Animal Physiology. Sders, Philadelphia, 966 pp.
utob, Z., 1962. The swimbladder of fishes as a pressure recArch. Neer. Zoo. 15, 1–67.

E. Strand et al. / Ecological Modelling 185 (2005) 309–327 327
Reidy, S.P., Kerr, S.R., Nelson, J.A., 2000. Aerobic and anaerobicswimming performance of individual Atlantic cod. J. Exp. Biol.203, 347–357.
Rose, G.A., Porter, D.R., 1996. Target-strength studies on Atlanticcod (Gadus morhua) in Newfoundland waters. ICES J. Mar. Sci.53, 259–265.
Rosland, R., Giske, J., 1994. A dynamic optimisation model of thediel vertical distribution of a pelagic planktivorous fish. Prog.Ocean. 34, 1–43.
Ross, L.G., 1979. The permeability to oxygen and the guanine con-tent of the swimbladder of a physoclist fish,Pollchius virens. J.Mar. Biol. Assoc. U.K. 59, 437–441.
Schmidt-Nielsen, K., 1997. Animal Physiology: Adaptation and En-vironment. Cambridge University Press, Cambridge, 607 pp.
Scholander, P.F., 1956. Observations on the gas gland in living fish.J. Cell. Comp. Physiol. 48, 523–528.
Scholander, P.F., van Dam, L., 1954. Secretion of gases againsthigh pressure in the swimbladder of deep sea fishes. II. The retemirabile. Biol. Bull. (Woods Hole) 107, 260–277.
Schurmann, H., Steffensen, J.F., 1997. Effects of temperature, hy-poxia and activity on the metabolism of juvenile Atlantic cod. J.Fish Biol. 50, 1166–1180.
Schwerte, T., Axelsson, M., Nilsson, S., Pelster, B., 1997. Effects ofvagal stimulation on swimbladder blood flow in the European eelAnguilla anguilla. J. Exp. Biol. 200, 3133–3139.
Sepulveda, C., Dickson, K.A., 2000. Maximum sustainable speedsand cost of swimming in juvenile kawakawa tuna (Euthynnusaffinis) and chub mackerel (Scomber japonicus). J. Exp. Biol.203, 3089–3101.
Steen, J.B., 1963a. The physiology of the swimbladder in the eelAnguilla vulgaris III. The mechanism of gas secretion. Acta.Physiol. Scand. 59, 221–241.
Steen, J.B., 1963b. The physiology of the swimbladder in the eelAn-guilla vulgarisII. The reabsorbtion of gas. Acta. Physiol. Scand.58, 138–149.
Strand, E., Huse, G., Giske, J., 2002. Artificial evolution of life his-tory and behavior. Am. Nat. 159, 624–644.
Tytler, P., Blaxter, J.H.S., 1973. Adaptation by cod and saithe topressure changes. Neth. J. Sea Res. 7, 31–45.
Vogel, S., 1994. Life in Moving Fluids: the Physical Biology of Flow.Princeton University Press, Princeton, 467 pp.
Wahlqvist, I., 1985. Physiological evidence for peripheral ganglionicsynapses in adrenergic pathways to the swimbladder of theAtlantic cod, Gadus morhua. Comp. Biochem. Physiol. 80C,269–272.
Ware, D.M., 1978. Bioenergetics of pelagic fish: theoretical changein swimming speed and ration with body size. J. Fish. Res. BoardCan. 35, 220–228.
Webber, D.M., Boutilier, R.G., Kerr, S.R., 1998. Cardiac output as apredictor of metabolic rate in codGadus morhua. J. Exp. Biol.201, 2779–2789.
Weihs, D., 1973. Mechanically efficient swimming techniquesfor fish with negative buoyancy. J. Mar. Res. 31, 194–209.
Wittenberg, J.B., Copeland, D.E., Haedrich, R.L., Child, J.S., 1980.The swimbladder of deep sea fish: the swimbladder wall is alipid-rich barrier to oxygen diffusion. J. Mar. Biol. Assoc. U.K.60, 263–276.