modelling the effect of buoyancy on the transport of
TRANSCRIPT

Modelling the effect of buoyancy on the transport of anchovy(Engraulis capensis) eggs from spawning to nursery groundsin the southern Benguela: an IBM approach
C. PARADA,1,* C.D. VAN DER LINGEN,2
C. MULLON1,4 AND P. PENVEN3,4
1Department of Oceanography, University of Cape Town, CapeTown, South Africa2Marine and Coastal Management, Rogge Bay, South Africa3IGP, UCLA, 405 Hilgard Avenue, Los Angeles, CA, USA4IRD, 210 rue La Fayette, 75489 Paris, France1
ABSTRACT
An individual-based model (IBM) was used toinvestigate the effects of physical and biological vari-ables on the transport via a jet current of anchovy(Engraulis capensis) eggs from spawning to the nurserygrounds in the southern Benguela ecosystem. Astransport of eggs and early larvae is considered to beone of the major factors impacting on anchovyrecruitment success, this approach may be useful tounderstand further the recruitment variability in thiseconomically and ecologically important species. Bycoupling the IBM to a 3D hydrodynamic model of theregion2 called Plume, and by varying parameters such asthe spatial and temporal location of spawning, particlebuoyancy, and the depth range over which particleswere released, we could assess the influences of theseparameters on transport success. A sensitivity analysisusing a General Linear Model identified the primarydeterminants of transport success in the variousexperimental simulations, and model outputs wereexamined and compared with patterns observed infield studies. Model outputs compared well withobserved patterns of vertical and horizontal egg dis-tribution. Particle buoyancy and area of particlerelease were the major single determinants of transportsuccess, with an egg density of 1.025 g cm)3 maxim-izing average particle transport success and the westernAgulhas Bank being the most successful spawning
area. This IBM may be useful as a generic prototype forother upwelling ecosystems.
Key words: anchovy, eggs, individual-based model,larvae, southern Benguela, transport
INTRODUCTION
Cape anchovy Engraulis capensis is an importantcomponent of the pelagic fishery off South Africa, andhas shown large interannual fluctuations in populationsize. These population fluctuations arise from highlyvariable recruitment and are compounded by the shortlifespan of this species; anchovy mature after their firstyear and seldom live beyond 3 years. As a large pro-portion (70% on average) of anchovy caught by thepelagic fishery are recruits (6+ months; Cochrane andHutchings, 1995), large fluctuations in recruitmentstrength have serious implications for effective man-agement of this important resource.
The life history of anchovy in the southernBenguela has been relatively well studied, with par-ticular emphasis placed on examining the factorscausing variability in recruitment success (Hutchingset al., 1998). Anchovy spawn over the Agulhas Bankin austral summer between September and Februarywith a mid-season peak in November (Shelton, 1986).Eggs which require 1–4 days to hatch, depending ontemperature (King et al., 1978), and early larvae aretransported via a shelf-edge jet current to the nurserygrounds between Cape Columbine and the OrangeRiver (Shelton and Hutchings, 1982; Fig. 1). Varia-bility in the transport of eggs from spawning to nurserygrounds is considered to be among the primary deter-minants of anchovy recruitment success (Hutchings,1992; Hutchings et al., 1998). Once anchovy havegrown into juveniles (approximately 3–6 months),they migrate southwards back to the Agulhas Bankand spawn there at an age of around 1 year.
Variability in the horizontal and vertical distribu-tion patterns of recently spawned eggs could resultin differential transport to the nursery grounds andhence impact on recruitment success. Horizontal egg
*Correspondence: e-mail: [email protected]
Submitted 6 April 2001
Revised version accepted 10 July 2002
FISHERIES OCEANOGRAPHY Fish. Oceanogr. 12:3, 170–184, 2003
170 � 2003 Blackwell Publishing Ltd.

distributions are characterized by interannual variab-ility in the location of peak concentrations (van derLingen et al., 2001), whilst the pattern of verticaldistribution is likely to be strongly affected by both thedepth of spawning and by the buoyancy properties ofthe eggs themselves, as indicated in previous studies(Sundby, 1983, 1991, 1997).
In this paper we present an individual-based model(IBM) which aims to identify the importance of var-ious factors on the successful transport and hencesubsequent recruitment success of anchovy in thesouthern Benguela. Biological parameters such asspawning area, date of spawning, depth of spawningand egg buoyancy, and physical parameters includingsalinity, temperature and velocity fields, were incor-porated into the IBM. A sensitivity analysis using aGeneral Linear Model (GLM), with transport successas the dependent variable, was carried out to establishthe relative importance of the above parameters andtheir contribution to explaining the variance of themodel outputs. Finally, model outputs were comparedwith observed vertical and horizontal distributionpatterns of anchovy eggs in the southern Benguela.
MATERIALS AND METHODS
An IBM approach was used to investigate the effects ofa series of physical and biological variables on thetransport of anchovy eggs from the Agulhas Bankspawning grounds to the west coast nursery area.Outputs from a 3D hydrodynamic model of thesouthern Benguela subregion (Penven et al., 2001),including velocity, salinity and temperature fields,were used to implement the IBM, and particles rep-resenting individual anchovy eggs were trackedthrough time and space.
Overview of the Plume 3D hydrodynamic model
The ocean model of the southern Benguela upwellingsubregion, known as Plume (Penven, 2000), uses theRegional Ocean Modeling System (ROMS) (seeHaidvogel et al., 2000) that solves the free surface,hydrostatic, primitive equations of the ocean dynamicsover a variable topography using orthogonal curvilin-ear coordinates in the horizontal and stretched terrain-following coordinates in the vertical (Song andHaidvogel, 1994). The curvilinear grid is pie-shaped(Fig. 2a) to follow the southwestern corner of theAfrican continent from 28 to 40�S and from 10 to24�E. Horizontal resolution ranges from 9 km at thecoast to 16 km offshore and 20 vertical levels preservea high vertical resolution near the surface (Fig. 2b). Atthe three lateral boundaries facing the open ocean, animplicit active radiative boundary scheme (March-esiello et al., 2001), forced by seasonal time-averagedoutputs of a basin scale ocean model (Biastoch andKrauß, 1999), connects all model variables to thesurroundings (Penven et al., 2001). The model wasforced using monthly average fluxes of wind, heat andsalinity from the Comprehensive Ocean-AtmosphereData Set (3 COADS) ocean surface climatology, whichhas a spatial resolution of 0.5� (Da Silva et al., 1994).The model was started from rest and summer valueswere used for initial conditions. As the model domainis relatively small, Plume reaches an equilibrium aftera spin-up period of about 2 years (Penven et al., 2001).
The model was run for 10 years and forced by arepeated climatology (i.e. no interannual variability inthe forcing fields). Although the forcing was identicaleach year and the model was considered to be in astate of equilibrium, the highly turbulent dynamicsfound in this region would lead one to expect slightdifferences in model solutions from 1 year to the next.Such differences were found and were attributed tointrinsic mesoscale activity resulting from oceanicinstability processes in the absence of added forcedvariability (Penven et al., 2001), and this is similar to
Figure 1. Conceptual model of the anchovy’s life history(from Hutchings et al., 1998; reproduced with permission).
Modelling the effect of buoyancy on the transport of anchovy (Engraulis capensis) eggs 171
� 2003 Blackwell Publishing Ltd, Fish. Oceanogr., 12:3, 170–184.

prior studies developed in the California upwellingsystem (Marchesiello et al., 2001). A snapshot of thesurface structure of temperature (SST) and surfacecurrents output by Plume (Fig. 3) shows a high level ofrealistic, mesoscale activity and some of the mainfeatures of the southern Benguela, including the jetcurrent, the generation of Agulhas rings and theshedding of cyclonic eddies from the southern tips ofthe Agulhas Bank, Cape Peninsula and Cape Col-umbine. The average behaviour of the model and itsvariability has been checked against observed data andthe close comparison between model output and fieldobservations provides confidence in the reliability ofthe model output to reproduce typical oceanic statesfor the southern Benguela (see Penven et al., 2001 fordetails).
The configuration of Plume used for our analysisstored output data every two simulation days and wasnot intended to reproduce any true year in particularbut, rather to provide a virtual environment that had ahigh level of spatial and temporal realism for use in thebiological model. From the 8 years of post-equilibriumPlume output, we selected only 5 years (years 4–8) forcoupling to the IBM, this limitation being the result ofthe computational constraints imposed by this type ofmodelling approach that involve solving the equations
for every particular ‘individual’. These 5 years providesufficiently different scenarios to test the hypothesisthat egg buoyancy has a significant impact on trans-port success.
Overview of IBM, experiments and simulations
The IBM was used to track the movement of particlesrepresenting anchovy eggs spawned over the AgulhasBank and transported northwards to the west coastnursery grounds. Both the horizontal and verticalmovements of particles were modelled: horizontalmovements resulted from outputs of the 3D hydrody-namic model whilst vertical movement was the resultof model outputs and particle buoyancy properties,which included parameters such as density and diam-eter, water density and viscosity, and gravitationalforce. By incorporating a buoyancy property andvarying the parameters used to generate this, the IBMprovided a variety of vertical and horizontal particledistribution patterns that gave rise to differentialtransport success.
The IBM used a combination of fixed and variedparameters (Table 1). Two groups of experiments wereconducted. The first group (called Lagrangian experi-ments) excluded buoyancy and treated particles aspure Lagrangian particles, the vertical velocities of
Figure 2. (a) The pie-shaped horizontal grid of the Plume model. The thick line represents the coastline, the thin line the500-m isobath, and the grid resolution is approximately 10 km at the coast. The location of the west coast nursery grounds andthe SARP and SHutch Lines are shown. (b) Vertical S-coordinate levels of the Plume model following topography. Theresolution is 9 m for the first surface level, and approximately 1000 m for the deepest level on the oceanic plain.
� 2003 Blackwell Publishing Ltd, Fish. Oceanogr., 12:3, 170–184.
172 C. Parada et al.

which depended only on the flow-field output fromPlume. The second group of experiments (calledbuoyancy experiments) incorporated the effect ofbuoyancy, and computed particle vertical velocity as afunction of buoyancy and vertical flow-fields. Thebuoyancy properties of eggs and early larvae wereassumed to be the same, hence the buoyancy schemewas applied unchanged to all particles throughout theIBM simulations.
The configuration of experiments is shown inFig. 4. Once the model was initialized and theparameters were set for each simulation, outputs fromthe Plume model were used as inputs to the IBM. Apopulation of 5000 particles was then randomlyreleased over the Agulhas Bank spawning area, thespawning duration determining the period over whichnew individuals entered the population. Based on fieldobservations of anchovy egg distributions (Fig. 5), fourareas were selected for particle release: the WesternAgulhas Bank (WAB), the offshore Central AgulhasBank (CABOff), and the inshore (EABIn) and offshore(EABOff) regions of the Eastern Agulhas Bank. Duringthe 90-day simulation period, the position of each
particle in the Plume 3D hydrodynamic model wasmonitored. For each 2-day time step, the verticalvelocity of each particle was estimated according tothe buoyancy scheme (see below), and particles wereindividually moved to their new positions. Through-out the simulation, the IBM recorded the number andage of particles meeting the criteria for successfultransport (see next section). Each individual simula-tion was independently launched three times, eachtime being called a subsimulation.
Dependent variable: criteria of transport success
During IBM simulations the number of particles olderthan 14 days (equivalent to seven model time steps)that arrived on the west coast nursery grounds(Fig. 2a) was recorded. This value was used as thecriterion for successful transport and was taken as thedependent variable in subsequent statistical analyses.Our choice of 14 days as the successful criterion foranchovy arriving in the nursery grounds was based onthe findings of Badenhorst and Boyd (1980), whoshowed that anchovy larvae >7-mm caudal length(corresponding to an approximate age of 14 days;
Figure 3. A snapshot (1 January ofyear 5) of sea surface temperature andcurrents (arrows, only every third vectordrawn) in the southern Benguela regionsimulated by Plume.
� 2003 Blackwell Publishing Ltd, Fish. Oceanogr., 12:3, 170–184.
Modelling the effect of buoyancy on the transport of anchovy (Engraulis capensis) eggs 173

Brownell, 1983) could avoid a bongo net during theday compared with night and, hence, showed activeswimming. We therefore assumed that anchovy £7 mmcould be considered as passive particles that wouldbehave in a manner indistinguishable from eggs. Larvae£7 mm would not be able to retain themselves in thenursery area and would be subject to offshore advectiveloss; hence we considered that their transport was notsuccessful. Larvae larger than 7 mm would have suffi-ciently developed swimming capabilities to maintainthemselves within the nursery area.
The buoyancy scheme
We used the equations of Denny (1993) in which theterminal velocity is calculated by equating the forcerequired to propel a prolate spheroid moving parallelto its long axis with the weight of that prolate spher-oid. In the buoyancy scheme, the vertical velocity ofparticles are confined to the Stokes’ regime when theReynolds number is <0.5, indicating that viscositydominates over friction. It is assumed that the verticaldrag of the particle is in balance with the buoyancyforces, resulting in the terminal velocity (wpart) that isa function of gravitational force g, sea water density
qw, kinematic viscosity m (0.01 m2s)1), minor (d) andmajor (I) axes of the prolate spheroid (Table 1), andparticle density (qpart):
wpart ¼ wwater þ1
24gd2 Dq
qw
m�1 ln2I
dþ 1
2
� �ð1Þ
where Dq¼qpart)qw and wwater is vertical velocitydz
dt(where z is depth and t is time) from the Plume
model. Field measurements of the density of anchovyeggs from the southern Benguela range from 1.021 to1.027 g cm)3 (C.D. van der Lingen, unpublished data)and were used in the modelling experiments.
The equations solved in the IBM that determinethe velocities of particles in every time step are:
dxpart
dt¼ uwater ð2Þ
dypart
dt¼ vwater ð3Þ
dzpart
dt¼ wpart ð4Þ
where uwater and vwater are the east–west andnorth–south components respectively, of the velocity
Table 1. Variables and parameters used to formulate the individual-based buoyancy model.
Description
VariableWater temperatureand salinity
Plume (Penven, 2000) outputs with time step of 2 days in the model domain of theBenguela ecosystem
Water density UNESCO equations for calculation of water density as a function of water temperature,salinity, and pressure
Velocity field Hydrodynamic model output u, v, and w velocities with time steps of 2 days, used to estimatethe Lagrangian trajectory of particles at a given time
Fixed parametersSpawning duration Spawning is a constant process starting on the first day of simulation and lasting for 30 daysDeath age All particles representing eggs were set to die at age of 60 daysDuration of simulation Every simulation was run over 90 days (spawning duration + death age)Number of eggs The number of particles was set to 5000 per simulation and particles were released continuously
over the spawning durationEgg shape A prolate spheroid with a major axis of 1.4 mm and a minor axis of 0.5 mm was used
Varied parametersArea Particles were released over all four spawning areas [Western Agulhas Bank (WAB),
Central Agulhas Bank offshore (CABOff), Eastern Agulhas Bank inshore (EABIn) andEastern Agulhas Bank offshore (EABOff)] in proportion to the relative size (in km2)of each area
Date The dates of spawning were set to: 1 October, 1 November, 1 December, 1 January,1 February and 1 March
Year Years 4–8 from Plume (Penven, 2000) were used in the IBMDepth Particles were released in three depth ranges: 0–25, 25–50 and 50–75 m, and randomly
distributed in the water column over the specified rangeEgg density The range of density for the particles was set in the model to 1.021, 1.023, 1.025, 1.027
(g cm)3) and a passive Lagrangian experiment
� 2003 Blackwell Publishing Ltd, Fish. Oceanogr., 12:3, 170–184.
174 C. Parada et al.

output of the Plume model. The position of the particlesat a given time was approximated with a Eulerian for-ward solution where xpartt, ypartt and zpartt are the 3Dpositions of the particles at time t and xpartt+1, ypartt+1
and zpartt+1 are positions of particles at time t+1:
xparttþ1 ¼ xpartt þ uwaterdt ð6Þ
yparttþ1 ¼ ypartt þ vwaterdt ð7Þ
zparttþ1 ¼ zpartt þ wpartdt ð8Þ
Figure 4. Flowchart of experimentalsimulations.
Figure 5. Composite distribution map ofanchovy eggs collected using a CalVETnet during annual pelagic spawner bio-mass surveys over the period 1983–2000.Data updated from van der Lingen et al.
(2001). The locations of the WAB,CABOff and EABIn and EABOff spawninggrounds used in this IBM are shown.
� 2003 Blackwell Publishing Ltd, Fish. Oceanogr., 12:3, 170–184.
Modelling the effect of buoyancy on the transport of anchovy (Engraulis capensis) eggs 175
IBM outputs and analysis of results
A sensitivity analysis using a GLM (Drapper andSmith, 1966) and multiple analysis of variance(MANOVA) was applied to the outputs from boththe Lagrangian and the buoyancy experiments.Transport success was the dependent variable in theGLM and the varied model parameters (Table 1)were independent variables. This analysis included astudy of the frequency distribution of residuals intransport success, as well as the significance andproportion of variance explained by each of theparameters and their interactions up to the secondlevel, and hence allowed the identification of themain parameters in the IBM that impacted ontransport success. We ran a full GLM that includedall parameters and their interactions up to the sec-ond level, and parameters that explained more than5% of the variance in the model were consideredimportant.
Effect of particle density under different jet currentscenarios
Three scenarios of jet current strength and possibleoffshore advective loss were identified from analysis ofthe Plume model output, and were used to examinehow particle density affected transport success withineach category. The scenarios were identified usingaveraged transport values (m3 s)1) in the jet currentover a 3-month period subsequent to the date onwhich eggs were released. Both along-shore (north–south) and across-shelf (offshore–inshore) cumulativetransport values were computed from the Plumemodel. Six along-shore and six across-shelf transportvalues, corresponding to the six different dates for the
initiation of spawning (see Table 1), were computedfor each model year used in this analysis (years 4–8),giving a total of 60 values. Along-shore transportvalues were computed for the 90-day simulationperiod for the upper 50 m along a line 100 km inlength positioned at the location of the SardineAnchovy Recruitment Program (SARP) line (seeFig. 2a), and across-shelf transport values were com-puted for the upper 50 m along a line 100 km inlength and positioned 60 km from the coastlinebetween Cape Point and Cape Columbine. Theseboundaries were chosen to represent the transportregion and the likely vertical distribution range ofanchovy eggs (Shelton and Hutchings, 1982), andthe maximal offshore position of the jet current(Boyd and Nelson, 1998).
Comparing model output to field observations
Outputs from the IBM experiments were comparedwith patterns of vertical and horizontal anchovy eggdistributions observed in the field. Data on thevertical distribution of anchovy eggs in the southernBenguela are scarce, but IBM outputs were comparedwith vertical profiles of egg concentration along aline off the Cape Peninsula (called the SHutch Linein our model; Fig. 2a) provided by Shelton andHutchings (1982). Modelled horizontal particle dis-tributions were compared with egg data collectedfrom the SARP Line, a 60-km transect of 12 evenlyspaced stations running WSW of Slangkop Point offthe Cape Peninsula, sampled one to two times everymonth (Huggett et al., 1998). Model-derived pat-terns that compare closely with those observed innature should enable a better understanding of the
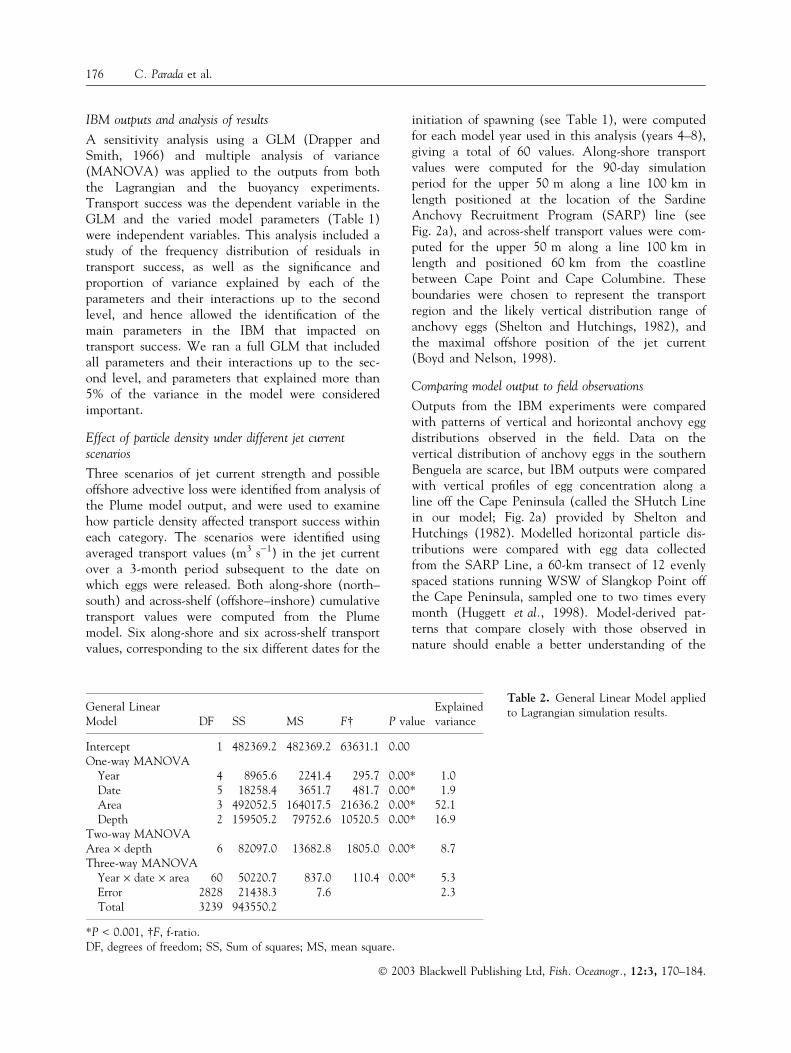
Table 2. General Linear Model appliedto Lagrangian simulation results.General Linear
Model DF SS MS F� P valueExplainedvariance
Intercept 1 482369.2 482369.2 63631.1 0.00One-way MANOVA
Year 4 8965.6 2241.4 295.7 0.00* 1.0Date 5 18258.4 3651.7 481.7 0.00* 1.9Area 3 492052.5 164017.5 21636.2 0.00* 52.1Depth 2 159505.2 79752.6 10520.5 0.00* 16.9
Two-way MANOVAArea · depth 6 82097.0 13682.8 1805.0 0.00* 8.7Three-way MANOVA
Year · date · area 60 50220.7 837.0 110.4 0.00* 5.3Error 2828 21438.3 7.6 2.3Total 3239 943550.2
*P < 0.001, �F, f-ratio.DF, degrees of freedom; SS, Sum of squares; MS, mean square.
� 2003 Blackwell Publishing Ltd, Fish. Oceanogr., 12:3, 170–184.
176 C. Parada et al.

processes that lie behind such patterns (Grimmet al., 1996).
RESULTS
Sensitivity analyses: Lagrangian experiments
Area was the primary determinant of transport success(Table 2), with the WAB and CABOff being similarlysuccessful spawning areas whilst the EABin and EABoff
were less successful (Fig. 6a). Depth of particle releasehad a less marked, but still significant effect ontransport (Table 2), with maximum success associatedwith particles released nearest the surface (0–25 m)and decreasing with depth (Fig. 6b). An importantfirst order interaction between depth and area wasobserved; successful transport from both the EABin
and EABoff only occurred for particles released nearthe surface, whereas those released from the CABOff
showed a marked decrease in transport success withincreasing depth of release and the WAB showed aslight trend of reduced transport success with in-creasing depth (Fig. 6c). Area, depth and thearea · depth interaction, together with a second orderinteraction between Year, date and area, explained83.1% of the variance of the model, with only 2.3%residual variance (Table 2). Residuals of transportsuccess from the Lagrangian experiment appeared tobe normally distributed, as required by the GLM usedfor the sensitivity analysis.
Sensitivity analysis: buoyancy experiments
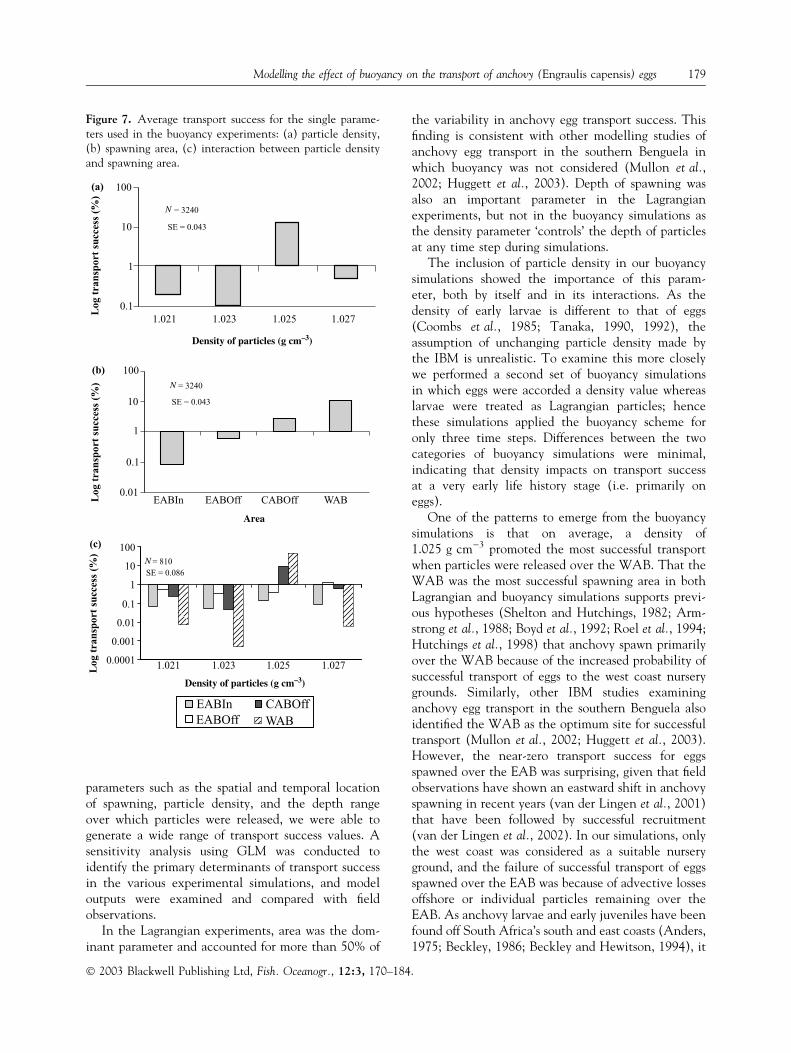
Particle density was the most important singleparameter determining transport success (Table 3),with a value of 1.025 g cm)3 resulting in the maxi-mum success (Fig. 7a). Area was another importantsingle parameter, with the WAB being the mostsuccessful spawning area and transport successdecreasing as spawning moved eastward, beingreduced for CABOff and close to zero for the inshoreand offshore regions of the EAB (Fig. 7b). Twoimportant interactions were observed; a first orderinteraction between particle density and area, and asecond order interaction between date, area andparticle density. The interaction between particledensity and area explained over one-third of thevariance in the GLM output (Table 3), indicatingthat the optimal particle density was different for thedifferent spawning areas (Fig. 7c). The parametersand interaction terms listed above, together with theinteraction between date and particle density,accounted for 86.5% of explained variance, with theerror term being 3.7% (Table 3). Visual examination
of the residuals of transport success from this cate-gory suggested a normal distribution.
Identification of scenarios and of particle density underdifferent jet current scenarios
Averaged jet current transport calculated from thePlume hydrodynamic model showed a strong linearrelationship between along- and across-shore compo-nents, with strong northwards flow associated with astrong offshore component and weak northwards flow
Figure 6. Average transport success for the single parame-ters used in the Lagrangian experiment: (a) spawning area,(b) depth of particle release, and (c) interaction betweenspawning area and depth of particle release.
� 2003 Blackwell Publishing Ltd, Fish. Oceanogr., 12:3, 170–184.
Modelling the effect of buoyancy on the transport of anchovy (Engraulis capensis) eggs 177

associated with stronger inshore transport (Fig. 8a).Years 4, 5 and 6 were characterized by strong north-wards and offshore transport, whereas inshore trans-port predominated in years 7 and 8 (Fig. 8b). Theseresults allowed the selection of three jet current sce-narios: scenario 1 being characterized by strongnorthwards and strong offshore flow (January of year5), scenario 2 by weak northwards and weak offshoreflow (December of year 6) and scenario 3 by weaknorthwards and strong inshore flow (March of year 8).The IBM simulations were run under each of thesescenarios with varied particle density values (1.021–1.027 g cm)3) but all other parameters fixed (area wasthe WAB and depth of spawning was 0–25 m).Maximum transport success was associated with par-ticles having a density of 1.025 g cm)3 in all threescenarios (Fig. 8c) but was substantially higher forscenario 1 (80%) than for scenarios 2 and 3, whichpresented similar transport success values (�40%).
Comparing model output to field observations
The distribution of eggs along the SARP Line duringAugust 1995 to July 2001 is characterized by relativelyfew eggs at the first five (inshore) stations and higherconcentrations at stations 6–12 (Fig. 9a). In generalterms, the simulation outputs from the three jet cur-rent scenarios showed similar patterns to the fieldobservations, showing low concentrations inshore andhigh concentrations offshore (Fig. 9b–d). Underscenario 1, a higher number of Lagrangian particlesand individuals having an intermediate density(1.025 g cm)3) were recorded at the SARP Line
compared with particles either lighter or denser than1.025 g cm)3 (Fig. 9b). Under scenario 2, the maxi-mum number of individuals crossing the SARP Linewas reduced by at least half compared with scenario 1,but more buoyant particles (1.021 and 1.023 g cm)3)dominated and dense particles (1.027 g cm)3) werenot recorded there (Fig. 9c). The pattern of scenario 3is similar to that of scenario 2 with lighter particlesdominant, but with the difference that Lagrangianparticles and those of intermediate density(1.025 g cm)3) were poorly represented (Fig. 9d).
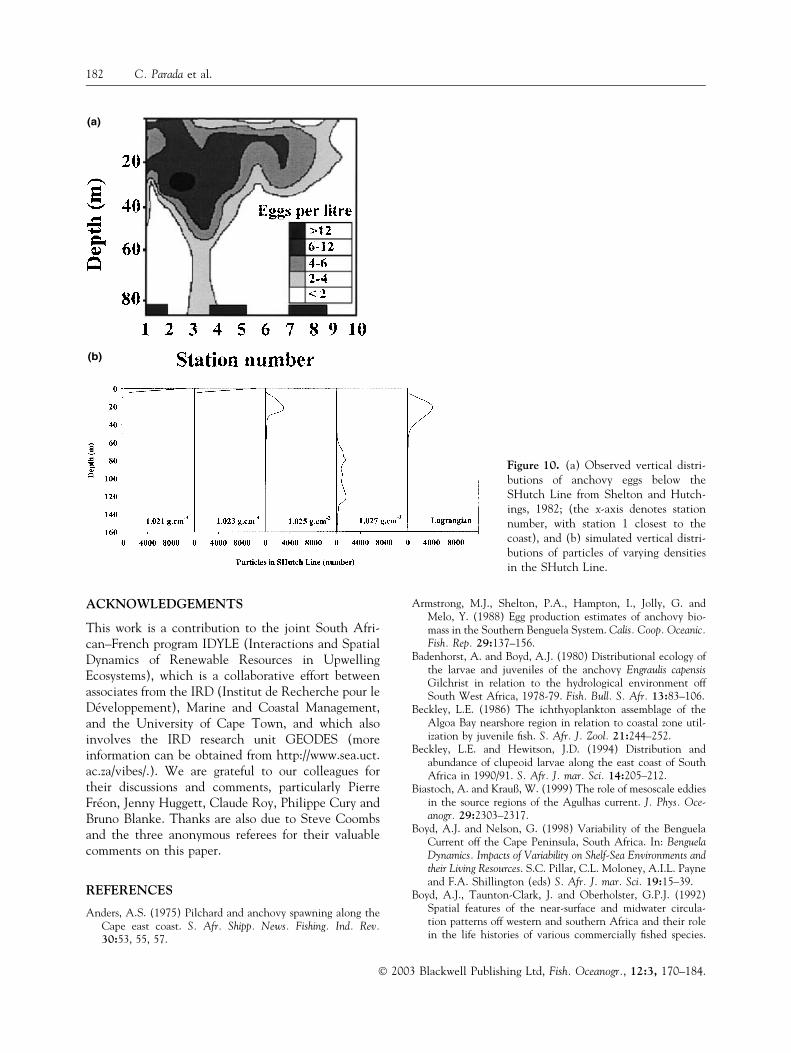
Shelton and Hutchings (1982) showed thatanchovy eggs were mostly distributed in the upper50 m of the water column, with a maximal concen-tration at 30 m depth (Fig. 10a). Modelled particlevertical distribution patterns along the SHutch Linediffered with particle density, the particles withhighest buoyancy (1.021 and 1.023 g cm)3) beingconcentrated at the surface and the most dense ran-ging between 60 and 130 m depth (Fig. 10b). In themodel, neutrally buoyant particles and those with adensity of 1.025 g cm)3 showed vertical distributionsthat most closely resembled field observations.
DISCUSSION
The IBM approach was used to investigate the effectsof various biological and physical factors on thetransport success of anchovy eggs from the spawninggrounds to the nursery area of the southern Benguelaupwelling ecosystem. By coupling the IBM to a 3Dhydrodynamic model of the region, and by varying
Table 3. General Linear Model applied to buoyancy simulation results.
General Linear Model DF SS MS F� P value Explained variance
Intercept 1 156220.2 156220.2 25645.7 0.00One-way MANOVA
Year 4 2316.4 579.1 95.1 0.00 * 0.1Date 5 40315.4 8063.1 1323.7 0.00 * 2.0Area 3 231366.9 77122.3 12660.7 0.00 * 11.5Density 3 399150.2 133050.1 21842.0 0.00 * 19.9Depth 2 7.3 3.7 0.6 0.55 0.0
Two-way MANOVADate · density 15 116460.1 7764.0 1274.6 0.00 * 5.8Area · density 9 745782.6 82864.7 13603.4 0.00 * 37.2
Three-way MANOVADate · area · density 45 241806.5 5373.5 882.1 0.00 * 12.1Error 12200 74316.0 6.1 3.7Total 12959 2003609.3
*P < 0.001, �F, f-ratio.DF, degrees of freedom; SS, Sum of squares; MS, mean square.
� 2003 Blackwell Publishing Ltd, Fish. Oceanogr., 12:3, 170–184.
178 C. Parada et al.
parameters such as the spatial and temporal locationof spawning, particle density, and the depth rangeover which particles were released, we were able togenerate a wide range of transport success values. Asensitivity analysis using GLM was conducted toidentify the primary determinants of transport successin the various experimental simulations, and modeloutputs were examined and compared with fieldobservations.
In the Lagrangian experiments, area was the dom-inant parameter and accounted for more than 50% of
the variability in anchovy egg transport success. Thisfinding is consistent with other modelling studies ofanchovy egg transport in the southern Benguela inwhich buoyancy was not considered (Mullon et al.,2002; Huggett et al., 2003). Depth of spawning wasalso an important parameter in the Lagrangianexperiments, but not in the buoyancy simulations asthe density parameter ‘controls’ the depth of particlesat any time step during simulations.
The inclusion of particle density in our buoyancysimulations showed the importance of this param-eter, both by itself and in its interactions. As thedensity of early larvae is different to that of eggs(Coombs et al., 1985; Tanaka, 1990, 1992), theassumption of unchanging particle density made bythe IBM is unrealistic. To examine this more closelywe performed a second set of buoyancy simulationsin which eggs were accorded a density value whereaslarvae were treated as Lagrangian particles; hencethese simulations applied the buoyancy scheme foronly three time steps. Differences between the twocategories of buoyancy simulations were minimal,indicating that density impacts on transport successat a very early life history stage (i.e. primarily oneggs).
One of the patterns to emerge from the buoyancysimulations is that on average, a density of1.025 g cm)3 promoted the most successful transportwhen particles were released over the WAB. That theWAB was the most successful spawning area in bothLagrangian and buoyancy simulations supports previ-ous hypotheses (Shelton and Hutchings, 1982; Arm-strong et al., 1988; Boyd et al., 1992; Roel et al., 1994;Hutchings et al., 1998) that anchovy spawn primarilyover the WAB because of the increased probability ofsuccessful transport of eggs to the west coast nurserygrounds. Similarly, other IBM studies examininganchovy egg transport in the southern Benguela alsoidentified the WAB as the optimum site for successfultransport (Mullon et al., 2002; Huggett et al., 2003).However, the near-zero transport success for eggsspawned over the EAB was surprising, given that fieldobservations have shown an eastward shift in anchovyspawning in recent years (van der Lingen et al., 2001)that have been followed by successful recruitment(van der Lingen et al., 2002). In our simulations, onlythe west coast was considered as a suitable nurseryground, and the failure of successful transport of eggsspawned over the EAB was because of advective lossesoffshore or individual particles remaining over theEAB. As anchovy larvae and early juveniles have beenfound off South Africa’s south and east coasts (Anders,1975; Beckley, 1986; Beckley and Hewitson, 1994), it
Figure 7. Average transport success for the single parame-ters used in the buoyancy experiments: (a) particle density,(b) spawning area, (c) interaction between particle densityand spawning area.
� 2003 Blackwell Publishing Ltd, Fish. Oceanogr., 12:3, 170–184.
Modelling the effect of buoyancy on the transport of anchovy (Engraulis capensis) eggs 179

suggests that these areas may also act as nurserygrounds. As eggs spawned over the EAB are not suc-cessfully transported to the west coast nursery grounds,successful recruitment of these eggs appears to dependon the occurrence of suitable nursery habitat on thesouth and/or east coasts. However, it is not possible toassess this hypothesis because the model domain isrestricted in the east. Moreover, it is difficult to sayhow representative the output of the Plume modelover the EAB is, because the eastern limit of the EABarea is too close to the boundary of the physical modeldomain, and boundary effects may prevail. Our resultsare also in contrast to those of Shannon et al. (1996),
who used a transport model based on currents derivedfrom Acoustic Doppler Current profiler that indicatedthat anchovy eggs spawned over the EAB could enterthe west coast nursery grounds.
Another strong pattern observed was the changethrough time of jet current characteristics from thePLUME simulations. Between years 5 and 8, transportchanged from having strong northwards and offshorecomponents to having weak northwards and stronginshore components (see Fig. 8b). However, year wasnot a significant model parameter, indicating that thischange in jet current characteristics did not result inmarked changes in annual average transport success.
Figure 8. (a) Average along-shore andacross-shelf transport in the region of thejet current for all simulations, (b) aver-age along-shore and across-shelf trans-port per year, and (c) transport success asa function of particle density for particlesreleased in the upper 25 m over theWAB only for each of three scenarios.Each scenario represents a single simu-lation.
� 2003 Blackwell Publishing Ltd, Fish. Oceanogr., 12:3, 170–184.
180 C. Parada et al.

This suggests that whereas strong northward transportmoves substantial numbers of eggs towards the westcoast, a large proportion of these are advected offshore.However, when the northwards transport is reduced,the associated increased inshore transport means that
most of the particles carried to the west coast make itinto the nursery area.
The vertical distributions obtained in simulationscompared well with field observations from theSHutch Line for particles having a density of1.025 g cm)3 and Lagrangian particles. In contrast,light particles (1.021–1.023 g cm)3) tend to concen-trate in the upper 5 m of the water column. Dense(1.027 g cm)3) particles are distributed between60 and 140-m, which appears to be deep comparedwith field observations from the southern Benguela,and for anchovy species elsewhere (Motos andCoombs, 1998; Moser and Pommeranz, 1999; Santoset al., 2000).
Results from the various scenarios in terms of theSARP Line indicate another important pattern,namely a relationship between particle density andaveraged jet current transport. Strong transport(scenario 1) promoted Lagrangian particles and thosewith a medium density (1.025 g cm)3), and consid-erably reduced the transport of lighter and heavierparticles. As northwards transport was reduced (scen-ario 2), the transport of lighter (1.021 and1.023 g cm)3) particles was enhanced. When north-wards transport was substantially reduced (scenario 3),only lighter (1.021 and 1.023 g cm)3) particles arrivedat the SARP Line. This suggests that when northwardsand offshore transport is strong, most of the particlesarriving at the SARP Line are those with a density of1.025 g cm)3. In contrast, when northwards and off-shore transport decreases, or under conditions ofmoderate northwards and strong inshore transport,lighter particles are more successfully transported tothe SARP Line. These results emphasize the import-ance of the interaction between buoyancy and phys-ical conditions in determining a particular transportsuccess in any given year.
The importance of particle density on transportsuccess may have been underestimated by our analysisbecause of the vertical scales used in the Plumemodel. The minimum vertical resolution in theuppermost layer of Plume is 1 m inshore and 5 moffshore, which may be too large to capture fine-scaledifferences (over scales of tens to hundreds of centi-metre) in egg vertical distributions that have beenreported for other anchovy species (Motos andCoombs, 1998; Coombs et al., 2000; Santos et al.,2000 for E. encrasicolus; Moser and Pommeranz, 1999for E. mordax). Hence it is possible that increasing thevertical resolution in the near-surface domain of themodel would have resulted in egg density becoming amore important parameter than has been the casehere.
Figure 9. Horizontal distribution of anchovy eggs along theSARP Line (a) observed [between August 1995 and July2001 (data from J. Huggett, Marine and Coastal Manage-ment, personnal communication)] and (b), (c), and (d) si-mulated results for the three jet current scenarios: scenario 1:strong northwards and strong offshore flow (January of year5); scenario 2: weak northwards and weak offshore flow(December of year 6); and scenario 3 weak northwards andstrong inshore flow (March of year 8).
� 2003 Blackwell Publishing Ltd, Fish. Oceanogr., 12:3, 170–184.
Modelling the effect of buoyancy on the transport of anchovy (Engraulis capensis) eggs 181
ACKNOWLEDGEMENTS
This work is a contribution to the joint South Afri-can–French program IDYLE (Interactions and SpatialDynamics of Renewable Resources in UpwellingEcosystems), which is a collaborative effort betweenassociates from the IRD (Institut de Recherche pour leDeveloppement), Marine and Coastal Management,and the University of Cape Town, and which alsoinvolves the IRD research unit GEODES (moreinformation can be obtained from http://www.sea.uct.ac.za/vibes/.). We are grateful to our colleagues fortheir discussions and comments, particularly PierreFreon, Jenny Huggett, Claude Roy, Philippe Cury andBruno Blanke. Thanks are also due to Steve Coombsand the three anonymous referees for their valuablecomments on this paper.
REFERENCES
Anders, A.S. (1975) Pilchard and anchovy spawning along theCape east coast. S. Afr. Shipp. News. Fishing. Ind. Rev.30:53, 55, 57.
Armstrong, M.J., Shelton, P.A., Hampton, I., Jolly, G. andMelo, Y. (1988) Egg production estimates of anchovy bio-mass in the Southern Benguela System. Calis. Coop. Oceanic.Fish. Rep. 29:137–156.
Badenhorst, A. and Boyd, A.J. (1980) Distributional ecology ofthe larvae and juveniles of the anchovy Engraulis capensisGilchrist in relation to the hydrological environment offSouth West Africa, 1978-79. Fish. Bull. S. Afr. 13:83–106.
Beckley, L.E. (1986) The ichthyoplankton assemblage of theAlgoa Bay nearshore region in relation to coastal zone util-ization by juvenile fish. S. Afr. J. Zool. 21:244–252.
Beckley, L.E. and Hewitson, J.D. (1994) Distribution andabundance of clupeoid larvae along the east coast of SouthAfrica in 1990/91. S. Afr. J. mar. Sci. 14:205–212.
Biastoch, A. and Krauß, W. (1999) The role of mesoscale eddiesin the source regions of the Agulhas current. J. Phys. Oce-anogr. 29:2303–2317.
Boyd, A.J. and Nelson, G. (1998) Variability of the BenguelaCurrent off the Cape Peninsula, South Africa. In: BenguelaDynamics. Impacts of Variability on Shelf-Sea Environments andtheir Living Resources. S.C. Pillar, C.L. Moloney, A.I.L. Payneand F.A. Shillington (eds) S. Afr. J. mar. Sci. 19:15–39.
Boyd, A.J., Taunton-Clark, J. and Oberholster, G.P.J. (1992)Spatial features of the near-surface and midwater circula-tion patterns off western and southern Africa and their rolein the life histories of various commercially fished species.
(a)
(b)
Figure 10. (a) Observed vertical distri-butions of anchovy eggs below theSHutch Line from Shelton and Hutch-ings, 1982; (the x-axis denotes stationnumber, with station 1 closest to thecoast), and (b) simulated vertical distri-butions of particles of varying densitiesin the SHutch Line.
� 2003 Blackwell Publishing Ltd, Fish. Oceanogr., 12:3, 170–184.
182 C. Parada et al.

In: Benguela Trophic Functioning. A.I.L. Payne, K.H. Brink,K.H. Mann and R. Hilborn (eds) S. Afr. J. mar. Sci.12:189–206.
Brownell, C.L. (1983) Laboratory rearing of Cape anchovy Eng-raulis capensis and South African pilchard Sardinops ocellatathrough metamorphosis. S. Afr. J. mar. Sci. 1:181–188.
Cochrane, K.L. and Hutchings, L. (1995) A structured approachto using biological and environmental parameters to forecastanchovy recruitment. Fish. Oceanogr. 4:102–127.
Coombs, S.H., Fosh, C.A. and Keen, M.A. (1985) The buoy-ancy and vertical distribution of eggs of sprat (Sprattussprattus) and pilchard (Sardina pilchardus). J. mar. Biol. Ass.U.K. 65:461–474.
Coombs, S.H., Sundby, S. and Adlandsvik, B. (2000) Modellingthe vertical distribution of eggs in relation to CUFESsampling. In: Report of a workshop on the use of the continuous,underway fish egg sampler (CUFES) for mapping spawninghabitat of pelagic fish. D.M. Checkley Jr., J.R. Hunter,L. Motos and C.D. van der Lingen (eds) GLOBECRep. 14:60–62.
Da Silva, A.M., Young, C.C. and Levitus, S. (1994) Atlas ofsurface marine data 1994. Algorithms and procedures.NOAA atlas NESDIS 6, USA: U.S. Department of Com-merce, NOAA,Vol. 1,74 pp.
Denny, M.W. (1993) Air and water: the biology and physics of life’smedia. NJ, USA: Princeton University Press, 341 pp.
Drapper, N.R. and Smith, H. (1966) Applied regression analysis.New York, USA: John Wiley and Sons, 407 pp.
Grimm, V., Frank, K., Jeltsch, F., Brandl, R., Uchmarıski, J. andWissel, C. (1996) Pattern-oriented modelling in populationecology. The Science of the Total Environment 183:151–166.
Haidvogel, D.B., Arango, H.G., Hedstrom, K.S., Beckmann, A.,Malanotte-Rizzoli, P. and Shchepetkin, A.F. (2000) Modelevaluation experiments in the North Atlantic Basin: simu-lations in nonlinear terrain-following coordinates. Dyn.Atm. Oceans. 32:239–281.
Huggett, J.A., Boyd, A.J., Hutchings, L. and Kemp, A.D. (1998)Weekly variability of clupeioid eggs and larvae in theBenguela jet current: implications for recruitment. In:Benguela Dynamics. Impacts of Variability on Shelf-Sea Envi-ronments and their Living Resources. S.C. Pillar, C.L. Moloney,A.I.L. Payne and F.A. Shillington (eds) S. Afr. J. mar. Sci.19:197–210.
Huggett, J.A., Freon, P., Mullon, C. and Penven, P. (2003)Modelling the transport success of anchovy Engraulisencrasicolus eggs and larvae in the southern Benguela: theeffect of spatio-temporal spawning patterns. Mar. Ecol. Prog.Ser. 250:247–262.
Hutchings, L. (1992) Fish harvesting in a variable, productiveenvironment-searching for rules or searching for exceptions?In: Benguela Trophic Functioning. A.I.L. Payne, K.H. Brink,K.H. Mann and R. Hilborn (eds) S. Afr. J. mar. Sci. 12:297–318.
Hutchings, L., Barange, M., Bloomer S.F. et al. (1998) Multiplefactors affecting anchovy recruitment in the spawning,transport and nursery areas. In: Benguela Dynamics. Impacts ofVariability on Shelf-Sea Environments and their Living Resources.S.C. Pillar, C.L. Moloney, A.I.L. Payne and F.A. Shillington(eds) S. Afr. J. mar. Sci. 19:211–225.
King, D.P.F., Robertson, A.A. and Shelton, P.A. (1978)Laboratory observations on the early development of theanchovy Engraulis capensis from the Cape Peninsula. Fish.Bull. S. Afr. 10:37–45.
van der Lingen, C.D., Hutchings, L., Merkle, D., van derWesthuizen, J.J. and Nelson, J. (2001) Comparative spawn-ing habitats of anchovy (Engraulis capensis) and sardine(Sardinops sagax) in the Southern Benguela upwelling eco-system. In: Spatial Processes and Management of Marine Pop-ulations. G.H. Kruse, N. Bez, T. Booth, M. Dorn, S. Hills, R.Lipicius, D. Pelletier, C. Roy, S. Smith and D. Witherell(eds) University of Alaska Sea Grant, Fairbanks, AK-SG-00-04, 185–209.
van der Lingen, C.D., Coetzee, J.C. and Hutchings, L. (2002)Temporal shifts in the distribution of anchovy spawnersand their eggs in the southern Benguela: implications forrecruitment. In: Report of a GLOBEC-SPACC/IDYLE/ENVIFISH workshop on Spatial Approaches to the Dynamics ofCoastal Pelagic Resources and their Environment in UpwellingAreas. C.D. van der Lingen, C. Roy, P. Freon, M. Barange,L. Castro, M. Gutierrez, L. Nykjaer and F. Shillington (eds)GLOBEC Rep. 16:46–48.
Marchesiello, P. McWilliams, J.C. and Shcheptkin, A.E. (2001)Open boundary conditions for long-term integration ofregional ocean models. Ocean modelling 3:1–20.
Moser, H.G. and Pommeranz, T. (1999) Vertical distribution ofeggs and larvae of northern anchovy, Engraulis mordax, andof the larvae of associated fishes at two sites in the southernCalifornia Bight. Fish. Bull. 97:920–943.
Motos, L. and Coombs, S. (1998) Vertical distribution ofanchovy eggs and field observations of incubation tempera-ture. Proceedings of the VI Colloquia of Oceanography of the Bayof Biscay. San Sebastian, April 1998. Ozeanografika No. 2,Spain: San Sebastian.
Mullon, C., Parada, C., Cury, P. et al. (2002) Individual basedmodelling (IBM) of the early stages of anchovy in thesouthern Benguela system. In: Report of a GLOBEC-SPACC/IDYLE/ENVIFISH workshop on Spatial Approaches to theDynamics of Coastal Pelagic Resources and their Environment inUpwelling Areas. C.D. van der Lingen, C. Roy, P. Freon,M. Barange, L. Castro, M. Gutierrez, L. Nykjaer andF. Shillington (eds) GLOBEC Rep. 16:87–89.
Penven, P. (2000) A numerical study of the SouthernBenguela circulation with an application to fish recruitment.These de doctorat de l’Universite de Bretagne Occidentale,Brest, France, 189 pp.5
Penven, P., Roy, C., Brundrit, G. et al. (2001) A regionalhydrodynamic model of upwelling in the Southern Benguela.S. Afr. J. Sci. 97:472–475.
Roel, B.A., Hewitson, J., Kerstan, S. and Hampton, I. (1994)The role of the Agulhas Bank in the life cycle of pelagicfishes. S. Afr. J. Sci. 90:185–196.
Santos, M., Uriarte, A. and Motos, L. (2000) A preliminaryoutlook at the relationship between CUFES and PairoVET/Bongo. In: Report of a workshop on the use of the continuous,underway fish egg sampler (CUFES) for mapping spawninghabitat of pelagic fish. D.M. Checkley Jr., J.R. Hunter,L. Motos and C.D. van der Lingen (eds) GLOBEC Rep.14:31–33.
Shannon, L.J., Nelson, G., Crawford, R.J.M. and Boyd, A.J.(1996) Possible impacts of environmental change on pelagicfish recruitment: modelling anchovy transport by advectiveprocesses in the southern Benguela. Global Change Biol.2:407–420.
Shelton, P.A. and Hutchings, L. (1982) Transport of anchovy,Engraulis capensis Gilchrist, eggs and early larvae by a frontaljet current. J. Cons. int. Explor. Mer. 40:185–198.
� 2003 Blackwell Publishing Ltd, Fish. Oceanogr., 12:3, 170–184.
Modelling the effect of buoyancy on the transport of anchovy (Engraulis capensis) eggs 183

Shelton, P.A. (1986) Fish Spawning Strategies in the VariableSouthern Benguela Current Region. PhD thesis. Cape Town:University of Cape Town, 327 pp.
Song, Y. and Haidvogel, D. (1994) A semi-implicit ocean cir-culation model using a generalized topography-followingcoordinate system. J. Comp. Physics 115:228–244.
Sundby, S. (1983) A one-dimensional model for the verticaldistribution of pelagic fish eggs in the mixed layer. Deep-SeaRes. 30:645–661.
Sundby, S. (1991) Factors affecting the vertical distribution ofeggs. ICES mar. Sci. Symp. 192:33–38.
Sundby, S. (1997) Turbulence and ichthyoplankton: influenceon vertical distributions and encounter rates. Scientia Mar.,Barcelona, 61(Suppl.1):159–176.
Tanaka, W. (1990) Change in the egg buoyancy of Japaneseanchovy Engraulis japonicus during embryonic development.Bull. Japan. Soc. Sci. Fish. 56:165.
Tanaka, W. (1992) Japanese anchovy egg accumulation atthe sea surface or picnocline – observations and model.J. Oceanogr. 48:461–472.
� 2003 Blackwell Publishing Ltd, Fish. Oceanogr., 12:3, 170–184.
184 C. Parada et al.