modeling the diffusion effects through the iron …
TRANSCRIPT

Paper No.
26
MODELING THE DIFFUSION EFFECTS THROUGH THE IRONCARBONATE LAYER IN THE CARBON DIOXIDE CORROSION OF
CARBON STEEL
S. RAJAPPA, R. ZHANG AND M. GOPALNSF, I/UCRC CORROSION IN MULTIPHASE SYSTEMS CENTER
DEPARTMENT OF CHEMICAL ENGINEERINGOHIO UNIVERSITY, ATHENS, OHIO, USA
ABSTRACT
A mechanistic model was developed for predicting carbon dioxide corrosion rates ofcarbon steel pipes in multiphase flow conditions. The model incorporates the chemistry,thermodynamics of carbon dioxide dissolution, multiphase mass transfer, electrochemicalkinetics on the metal surface and the presence of a corrosion product film. The predictedcorrosion rates show good agreement with the experimental results.
Keywords: Corrosion, pH, mass transfer coefficients, coupons, SEM
INTRODUCTION
The depletion of accessible oil resources has directed oil production to remote areas,such as the sub-sea and Alaska. The main products from the oil wells are oil and naturalgas. For sub-sea production, offshore platforms have been used to separate the oil and gaswhich are then transported onshore using single phase pipelines. It is not feasible oreconomical to separate the oil and gas at each well site and hence the mixture of oil andgas are transported together many miles to a central gathering station where the phases areseparated. The presence of carbon dioxide causes internal sweet corrosion due to theformation of weak corrosive carbonic acid with salt water. This significantly increasescorrosion rates in carbon steel pipelines. Since most pipelines are located in inaccessible
Copyright
@X998 by NACE International. Requests for permission to publish this manuscript in any form, in part or in whole must be mada in writing to NACEInternational, Conferences Division, P.O. Box 218340, Houston, Texas 77218-8340. The material presented and the views expressed in thispaper are solely those of the author(s) and are not necessarily endorsed by the Association. Printed in the U.S.A.
places, maintenance operations are very difficult and expensive. It is imperative thatproper design and operating conditions be maintained to minimize corrosion. For theselection of appropriate design parameters it is imperative to quantifi corrosion.Moreover, it is important to determine operating conditions such as temperature, pressure,velocities and oil/water fractions under which corrosion is minimized.
Corrosion occurs due to the interaction of the liquid and metal ions forming discreteelectrochemical cells. Two factors that significantly affect the rate of this reaction are themass transfer of ions fi-om the flowing liquid to the metal wall and thickness of thecorrosion product, on the surface of the metal. In order to understand the mechanismsinvolved with the formation of the iron carbonate layer, which is a significant factor incontrolling the difksion rate, an extensive literature survey is presented in the followingsection.
Corrosion Mechanisms
de Waard and Milliamsl (1975) studied the mechanisms of carbon dioxide corrosion ofcarbon steel under various conditions of pH, temperature and pressure.
Corrosion mechanisms have been investigated by Ikeda4 (1985), Videm and Dugstad5(1989), de Waard et al.’ (1991) and de Waard and Lotz7 (1993).
Dayalan et al.z (1995) proposed a mechanistic model for the carbon dioxide corrosionof steel in pipe flow. They suggested the following steps
1, Formation of reactive species in the bulk2, Transportation of reactants (bulk to surface)3. Electrochemical reactions at the surface4. Transportation of products (surface to bulk)
They suggested that three species @, HzCOS and HCOS-) undergo reduction at themetal surface and contribute to corrosion. Their study was limited to brine with 30/o NaClsolution. There was no evaluation of the corrosion product film and they limited theirwork to 2.5 cm pipelines, with no comparison with experimental data for large diameterpipelines,
In this study, the model simplification involves reducing the number of cathodicreactions relevant to the corrosion process. Only the reduction of hydrogen ions isconsidered according to Herce et al.3 (1995) since they combined the effects of fluid flowwith pH to define hydrogen ion flux which they related to corrosion rate under a variety ofcondhions. Hence, only two reactions that are of interest in this corrosion model are givenbelow and they are the oxidation of iron to the ferrous ion as the anodic reaction and thereduction of the hydrogen ion as the cathodic reaction.
2612
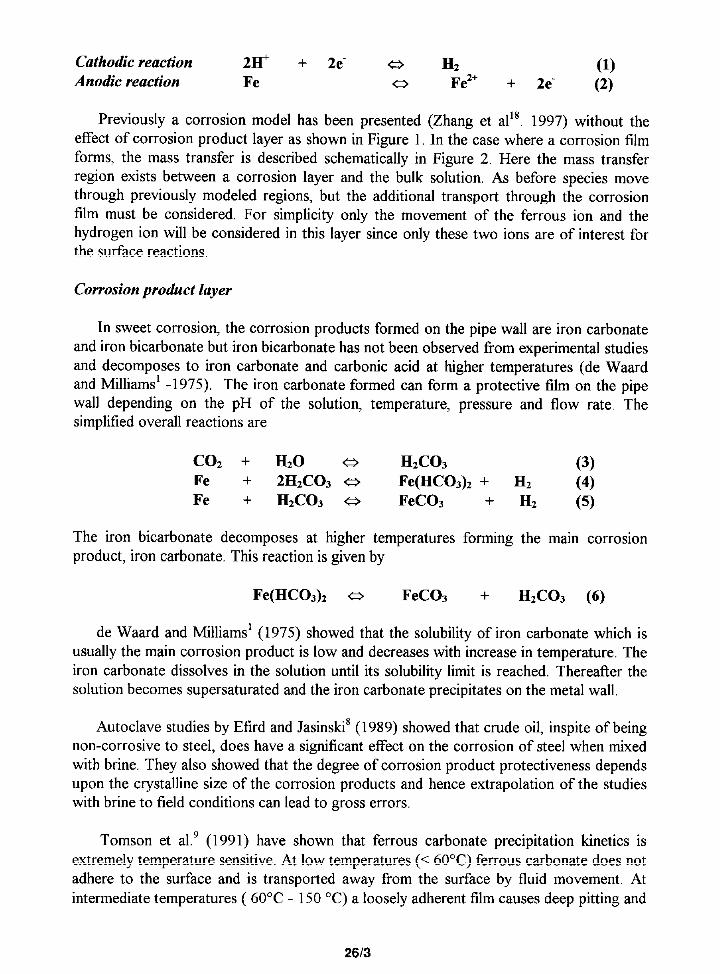
Cathodic reaction 2@ + 2e- e H, (1)Anodic reaction Fe e Fez+ + 2e- (2)
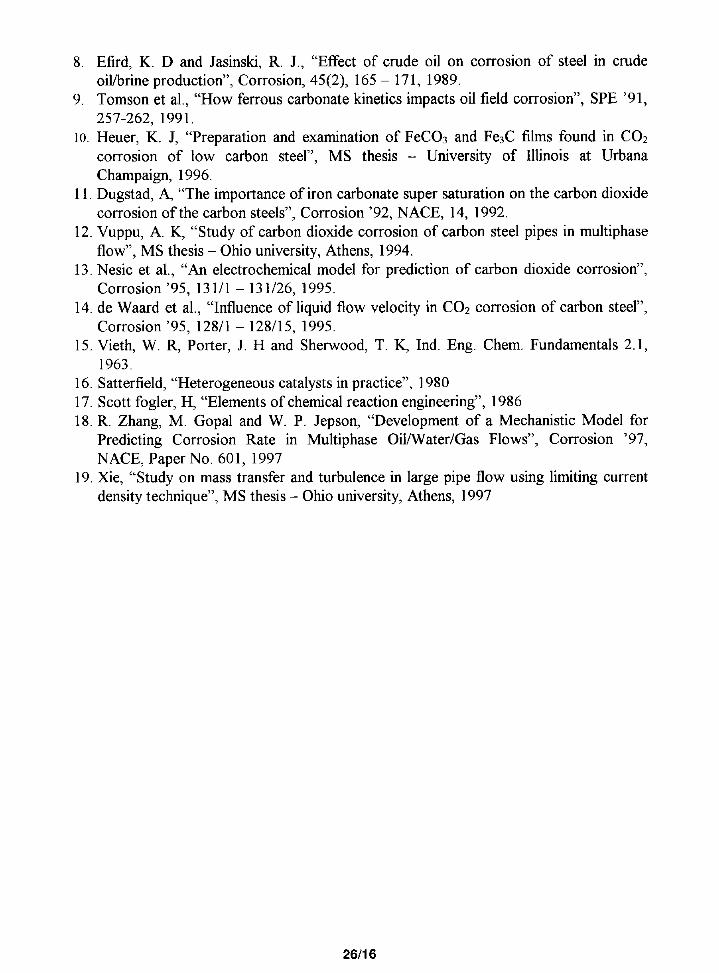
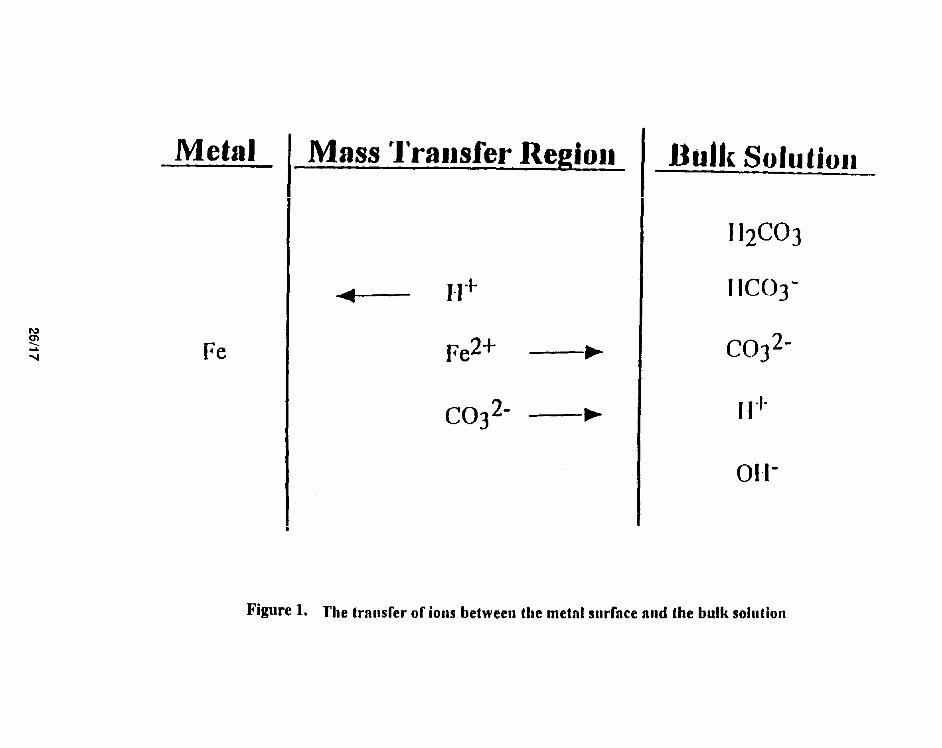
Previously a corrosion model has been presented (Zhang et ails. 1997) without theeffect of corrosion product layer as shown in Figure 1, In the case where a corrosion filmforms, the mass transfer is described schematically in Figure 2. Here the mass transferregion exists between a corrosion layer and the bulk solution, As before species movethrough previously modeled regions, but the additional transport through the corrosionfilm must be considered, For simplicity only the movement of the ferrous ion and thehydrogen ion will be considered in this layer since only these two ions are of interest forthe surface reactions.
Corrosion product layer
In sweet corrosion, the corrosion products formed on the pipe wall are iron carbonate
and iron bicarbonate but iron bicarbonate has not been observed fi-om experimental studiesand decomposes to iron carbonate and carbonic acid at higher temperatures (de Waardand Mllliamsl - 1975), The iron carbonate formed can form a protective film on the pipewall depending on the pH of the solution, temperature, pressure and flow rate, Thesimplified overall reactions are
Coz + H20 e H2C03 (3)Fe + 2H~COs ~ Fe(HCOs)z + Hz (4)Fe + H*COS = FeC03 + Hl (5)
The iron bicarbonate decomposes at higher temperatures forming the main corrosionproduct, iron carbonate. This reaction is given by
Fe(HCOs)Z e FeCO~ + HzCO, (6)
de Waard and Milliamsl (1975) showed that the volubility of iron carbonate which isusually the main corrosion product is low and decreases with increase in temperature. Theiron carbonate dissolves in the solution until its volubility limit is reached. Thereafter thesolution becomes supersaturated and the iron carbonate precipitates on the metal wall.
Autoclave studies by Efird and Jasinski8 (1989) showed that crude oil, inspite of beingnon-corrosive to steel, does have a significant effect on the corrosion of steel when mixedwith brine. They also showed that the degree of corrosion product protectiveness dependsupon the crystalline size of the corrosion products and hence extrapolation of the studieswith brine to field conditions can lead to gross errors.
Tomson et al.9 (1991) have shown that ferrous carbonate precipitation kinetics is
extremely temperature sensitive. At low temperatures (< 60”C) ferrous carbonate does notadhere to the surface and is transported away from the surface by fluid movement, Atintermediate temperatures ( 60°C - 150 ‘C) a loosely adherent film causes deep pitting and
2613

extremely high corrosion rates. At even higher temperatures (> 150°C) tight adherent filmsare formed, Quenched and tempered materials are not easily corroded as low carbonsteels, thus severe pitting may be observed in low carbon materials
Studies by Heuer10 (1996) showed that this pitting corrosion is not only dependent ontemperature but on flow rate and specimen metallurgy,
Dugstadll (1992) found that the super saturation level of iron carbonate and the pH isdependent on the water volume to steel ratio and the temperature. Protective films are noteasily formed as precipitation rate of iron carbonate is a slow and a temperature dependentprocess. Also under supersaturated conditions, it takes 20 to 40 hours to cover the metalsurface with the protective iron carbonate layer.
Vuppu12 (1994) performed studies on the characteristics of the protective ironcarbonate film formed on the metal surface under various conditions of temperature,pressure, oil/water fraction and flow conditions. He found from SEM studies, that at
temperatures below 60°C, the corrosion deposit formed under fill pipe flow conditionswas of uniform thickness with long cracks in it. The deposit turns more crystalline withincrease in temperature and pressure. Also, at intermediate oil/water compositions, thecorrosion products are loose and porous and the formation of protective iron carbonate
scales was found to occur at temperatures >70”C for brine. However for multiphaseoillsalt water flows, such formation of protective scales was not found.
Videm and Kvarekvaal (1996) showed that the most important surface changesinduced by corrosion of an initially smooth and uncorroded steel are changing the area ofthe reacting surface, carbide accumulation at the surface, formation of carbonate films,flow induced removal of corrosion films and formation and breakdown of sulfide film inenvironments with sulfides, In their experiments specimens with one surface freshlyground and another being the original cold rolled steel were used. They concluded fromtheir study that corrosion has “good memory” for what has happened earlier and thatexperiments must be strictly controlled in order not to be ruined by pre-corrosion,
Nesic et a113. (1995) shed more light on the anodic reaction mechanism in COZcorrosion of mild steel. They used potentiodynamic sweep and galvanostaticmeasurements for their electrochemical measurements. They found distinct but differentanodic mechanisms for iron dissolution in C02 solutions for both pH<4, O and for pH>5. O.In the intermediate area there seems to be a transition from one mechanism to another.
Nesic et al. (1996) explained influence of the iron content in the corrosive medium.They found that if the iron content in the test medium is high fi-om the moment ofimmersion of fi-eshly polished specimens, iron carbonate can precipitate on the metal, andthe layer is protective. If the iron content in the medium becomes high only after an initialphase of corrosion leading to the formation of a porous cementite layer, then internalacidification prevents fix-ther precipitation of iron carbonate in contact with the metal. The
2614

layer is then unprotective, and even enormous amounts of super saturations cannotsubsequently render it protective.
Heuer1° (1996) reported the effect of temperature, pressure, Froude number and oilcut on the corrosion products formed in horizontal multiphase flow. He found thatcoupons rununderfi.dl pipe flow have much thicker films than specimens exposed to slugflow. The average thickness in fidl pipe flow is about three times greater than that for slugflow. The average thickness of the corrosion product layer found on the surfaces ofcoupons exposed to slug flow conditions was about 6 to 14 microns, which is smaller thanthe average thickness for fill pipe flow conditions ( 36 to 44 microns). This indicates thepossible stripping of the protective film of corrosion products on the metal surface, due tohigher levels of shear stress and turbulence, under slug flow conditions.
Model Development
In a previous study (Zhang et al.18, 1997) the calculation of bulk concentration ofvarious ions and the calculation of pH were given.
In this case the pH was calculated using the relation
pH = -Log [ aH+ ]
For the calculation of aH+the following quadratic equation was used
1
[ 1
KICOz.aco,_fi co—aH+2+ AaH++ -YH+ Ym2j Y;H
(7)
(8)
Mass Transfer Coefficients
In order to calculate the mass transfer flux of the species it is necessa~ to computethe mass transfer coefficients of the species. In this study the following expression wasused
4.586 (z ) f Re D (Sc )“3
K., =8d
(9)
2615

where VmX= Maximum velocity in the pipe in mls,V,,~ = Average velocity in the pipe in rds
The Moody fi-iction factor can be calculated(1991)
6.9 (e/~”f “’=-l.mh[g+~ 1
by using the correlation of Haaland
(lo)
Where e = Roughness of the pipe, d = diameter of the pipe and Re = Reynolds number
Diffusion coefficient
The mass transfer coefficient requires dMimivity calculations, The difisioncoetlicients of the ions can be calculated with the aid of the Nernst - Einstein relation
~,= A,RT(11)
F’ Z,
Where Di = Diffusion coefficient, 1 = ionic conductivity, R = universal gas constant, T =
temperature (“K) and Z = charge of the ion.
From the results of Xie]9 (1997), it was found that the difisivities of D, 2D and 3D
were used for 40, 60 and 80 “C respectively for brine and oil/water flow conditions, topredict corrosion rates since mass transfer rate increases greatly with temperature.
Modeling of corrosion with corrosion product layer
The reactant ~ passes from the bulk solution to the metal surface through a masstransfer region, and the products, Fe2+ and COS2-move from the metrd surface towards thebulk solution. In the case where a corrosion film forms, there is a corrosion product layerwhich is composed of the porous media between the metal surface and the bulk solution.Species move through the bulk as before but the additional difision and transport throughthe corrosion film must be considered. For simplicity, only the movement of the ferrousion and hydrogen ion will be considered.
Assuming no chemical reaction, applying a mass balance over the differential region of
corrosion product film from z to z + Az gives that at steady state :
2616

where,
Rearranging gives
Nk = molar flux of species A at z direction (mol/m2/s)r —— radius of the pipe (m)1 —— length of the pipe (m)
NAzlz+~-NJ._ N.A+AzAz r-z
Taking the limit as Az approaches zero gives
dNAz. N.,
dz r-z
Integrating with respect to z gives
cNAZ . —
r-z
(13)
(14)
(15)
where, C = constant
At steady state, the rate of mass transfer is equal to the electrochemical reaction rate atthe metal surface. The boundary condition is described as following :
at z=O, N~=C/r=RA
where, RA = electrochemical reaction rate of species A (mol/m2/s)hence, C=RA r
& rNA, = —
r-z(16)
For Fe2+ :
26/7

_ R~.1+~N~.2+,– —
r-z(17)
where, NFe2+, =R~C2+ =
i. ——
F ——
Similarly for H+ :
where, N~+z =
RH+ =i, ——
molar flux of Fez+ (mol/m2/s)electrochemical reaction rate of Fez” (mol/m2/s) = i. /2Fanodic potential (amp/m*)Faraday constant
(18)
molar flux of ~ (mol/m2/s)electrochemical reaction rate of ~ (mol/m2/s) = iC/Fcathodic potential (amp/mz)
For steady state, i= = iC, and gives :
NH+, = -2N~,2+z (19)
The ratio of molar flux of H+and Fe2+is -2. From the anodic and cathodic reactions, it canbe seen that 1 mole Fe2+ needs 2 moles H+ to react on each other and the ionic molarfluxes of Fe2+ and ~ are in the opposite directions.
According to Fogler19(1986), the total molar flux of ~ N& , is the result of twocontributions: the molecular diffhsion flux, produced by a concentration gradient, and theflux resulting from the convection of the fluid.
N.. = -cD.~~ + x.( N., + NB,) (20)
where,N& = molar flux of A (mol/m2/s)
NBZ = molar flux of B (mol/m2/s)Dm = difisivity of A in a binary system (m2/s)XA =
c ——
P=M=
For Fe2+ :
mole fraction of Amolar density of solution (mol/m3) = p/M
density of solution (kg/m3)
molecular weight of solution (kg/kmol)
2618

& 2+
NF.z+. = - cD,r.1+~ + X#+ (N~.J., + N~~,) (21)
When Eq. 19 is substituted into Eq, 21, the following expressions were obtained :
When Eq. 17 is substituted into Eq, 23, the following expression was obtained
~ dz = -* &,e2+2F(r -z) 1 + Xpez+
(23)
(24)
Integrating with respect to z from Oto & with the boundary conditions
at z=(), xFe2+= FeS/cat z=& xp.z+= FeL/c
and integrating with respect to xF.2+from metal surface to the edge of the corrosion film,gives :
(25)
where, f)=FeL =FeS =DF.2+ =
c ——
P——
M=
Similarly for H+ :
thickness of the corrosion film (m)
Film concentration of Fez+ (mol/m3)metal surface concentration of Fez+ (mol/m3)difli.rsivity of Fez+ through corrosion film (mZ/s)molar density of solution= p /M (mol/m3)=69444 .4mol/m3 for brine
density of solution (kg/m3)molecular weight of solution (kg/kmol)
2619
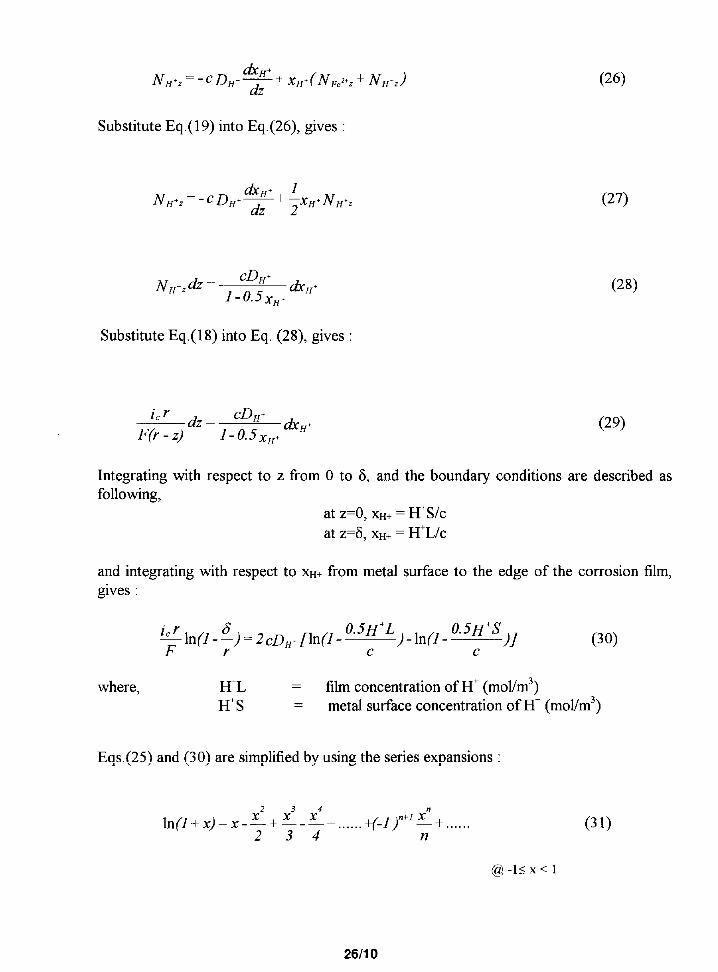
Substitute Eq.(19) into Eq.(26), gives :
NH+,dz = - CDH’ ~-,1-0.5 XX+
Substitute Eq.(18) into Eq. (28), gives :
~ dz= CD”+&“+F(r -z) I-0.5XH+
(26)
(27)
(28)
(29)
Integrating with respect to z from O to 8, and the boundary conditions are described asfollowing,
at z=o, xH+= ~S/c
at z=ti, xH+= H+L/c
and integrating with respect to xH+from metal surface to the edge of the corrosion film,gives :
(30)
where, H+L –— film concentration of H+ (mol/m3)H+S = metal surface concentration of ~ (mol/m3)
Eqs,(25) and (3 O) are simplified by using the series expansions :
ln{l+x) =x-~+ $-$+ ......+f-x+n+’ x+...... (31)n
@-l<x<l
26110
ln(l-x) =-(x+ ~+$+$+ . .. . ..-+~ +......)n
(32)
fj-l<x<l
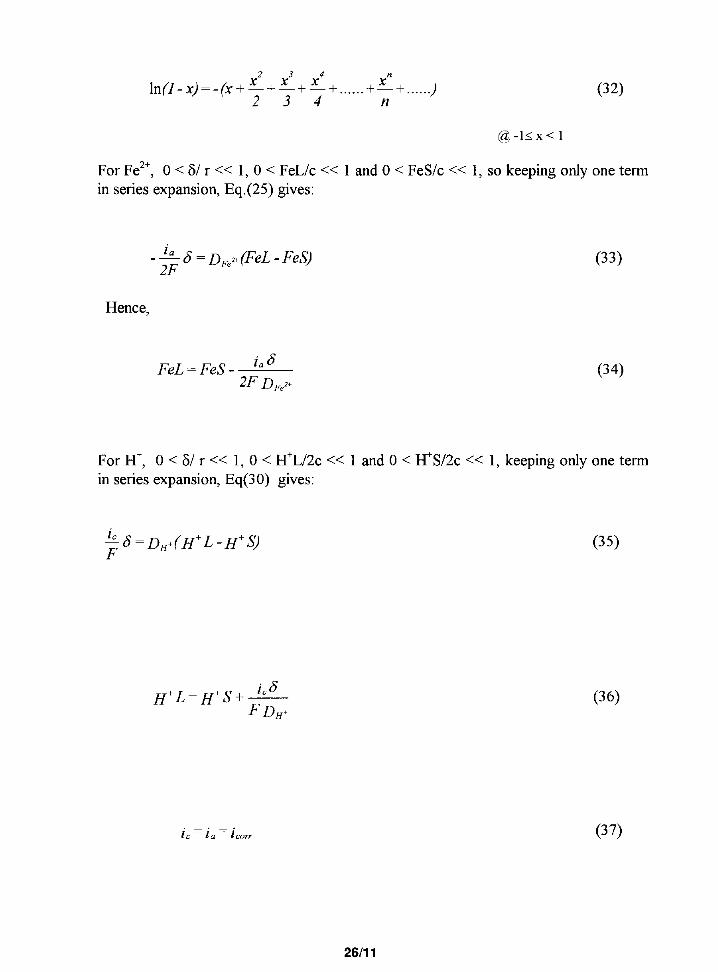
For Fe2+, 0 <6/r<< 1, 0< FeL/c <<1 and O < FeS/c <<1, so keeping ody one term
in series expansion, Eq.(25) gives:
- ~ 6 = DF,,+PeL - FeS) (33)
Hence,
i. 6FeL = FeS -—
2F D~~,+(34)
For H+, O < 5/r<< 1, 0< H+L/2c <<1 and O < H+S/2c <<1, keeping only one termin series expansion, Eq(3 O) gives:
$~=D.+(H+L-H+S) (35)
(36)
—.—.i. —i. —~co,, (37)
26/1 1

For iron, Corrosion rate (mm/year) = ic~ (amp/cm2) * (1.16 * 104) and
F KmL~+(H+b -H+L) = i.
2 F K.,,,~1+(FeL - Feb) = 10
where, Feb = bulk concentration of Fe2+ (mol/m3)FeL = Film concentration of Fe2+ (mol/m3)~b = bulk concentration of H+ (mol/m3)H+L = film concentration of H+ (mol/m3)
Dl~fusivityin porous corrosion film
(38)
(39)
According to Sattetileldlb( 1980), pore diffision may occur by bulk diflhsionsuggested that the bulk diilirsion coefficient for porous media, DIz,,H, be expressed as
He
(40)
where, e = void fraction
T= tortuosity factor
Experimental measurements on a variety of commercial catalysts show that in many
cases, values of ~ is in the range of 2 to 7, values of e va~ from about 0.3 to 0.7.
If the pores are large and gas relatively dense (or if the pores are filled with liquid), theprocess is that of bulk or ordinary, dlftlusion. In this study, the pores of corrosion productfilm are large and the corrosion film are not composed of the traditional crystals, hence,
WT = 1.0 is investigated for the porous corrosion film.
According to Fogler17(l 986), the total molar flux of & N~, is the result of twocontributions, the molecular diflision flux, produced by a concentration gradient, and theflux resulting from the convection of the fluid. If the pores of corrosion product film arewide and the film is thick, the second contribution cannot be neglected. In addition to
26/12

natural convection, forced convection exists and plays an important role in filly developedturbulent pipe flow conditions. The mass transfer in large pores is the mixture of masstransfer by diflhsion (includlng dhli.rsion through liquid and solid) and convection(combination of natural and forced convection). Incorporating mass transfer by the effects
of forced convection and ditlhsion through solid into the total molar flux, W~ = 5, 10,and 15 are tested for the porous corrosion film through increasing the rate of mass transferby diflbsion through liquid.
EXPERIMENTAL SET UP
The entire system in which the experiments were carried out is made of316 stainlesssteel and is designed to withstand a maximum pressure of 1500 psi. A predetermined oil-water mixture is stored in a 1,2 m3 tank. The liquid is pumped by a 5.2KW stainless steel,centrifugal pump into a 7.62 cm ID, 0.95 cm thick pipeline from where it flows into the 10m long, 10,16 cm ID and 0,95 cm thick test section. The test section contains twoopenings which are used for the introduction of Electrical Resistance probes and Couponholders for corrosion rate measurements and for SEM studies. The experimental setup hasbeen discussed extensively in previous papers published from the center.
RESULTS AND DISCUSSION
Experiments were conducted for a water cut of 40% at 80 ‘C and 0.79 MPa for fillpipe flow conditions (Velocity = 1.0 m/s) with various iron concentrations (100 and 200ppm).
The experiments were conducted for about 72 hours. It was seen that when thecoupons were examined under the SEM a thick layer of iron carbonate was precipitatedon the surface of the coupon as shown in Figure 3. The layer was even thicker as seen inFigure 4. when the iron content was raised from 100 to 200 ppm. It was noticed that,though the corrosion rate had reached an equilibrium value there was no marginal drop inthe corrosion rate and there was hardly any difference when the data was compared withthe data obtained from experiments conducted under very less iron concentrations. Apartfrom the coupon studies, the pH was also measured for various experiments and it wasfound that an increase in the iron concentration did not change the pH of the solution. Thisexplains the reason why there is no drop in the corrosion rates as a drop in the corrosionrate would increase the pH closer to 7.0. This fact also corroborates an importantassumption, which is made in the development of the model that the dissolution reactionof iron into the solution does not significantly affect the bulk pH.
Temperature Dependence of Corrosion Rate
It is seen that the predicted corrosion rate increases greatly with temperature for non-scaling conditions. For example, for brine, at a pressure of O.79MPa, the predictedcorrosion rates are 10.1, 18.2 and 23.9 mrdyear for 40, 60 and 80°C respectively, whilethe corresponding experimental results are 9.4, 25.47 and 22.61 mrdyr. This tendencyreveals the scaling temperature is lower than 80°C for brine.
26113
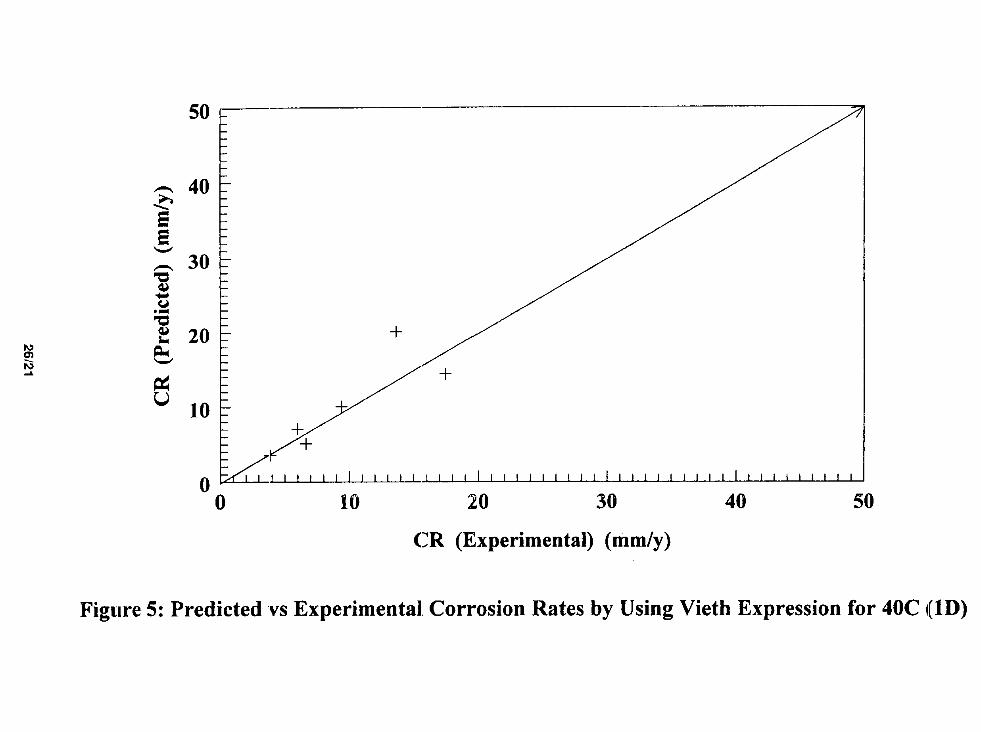
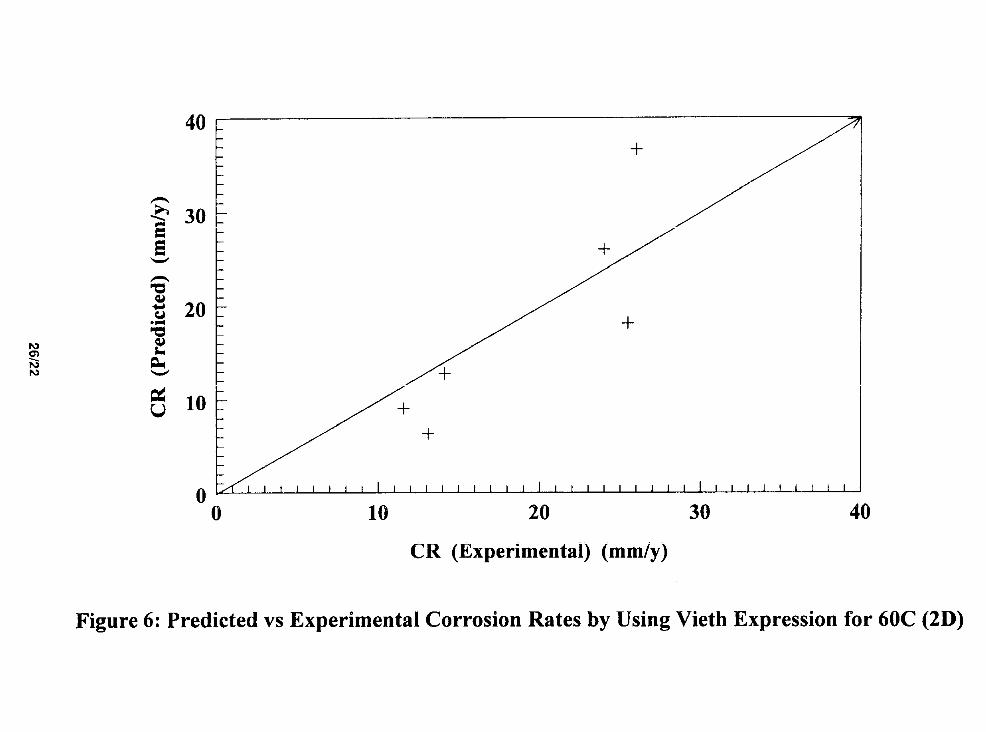
From Figure 5, it is seen that model predicts well the experimental results by using
1XD for difisivity calculations at 40°C. From Figure 6, the model results seem to slightlyunder predict the experimental data, but is reasonable compared with experimentalobservations by using 2xD for difisivity calculations at 60°C. From Figure 7, it is seen
that the model results are very close to the experimental results by using 3XD fordifisivity calculations at 80°C. except two points which are at higher pressure(0.79MPa)for oillwater flows,
Corrosionfilm effect
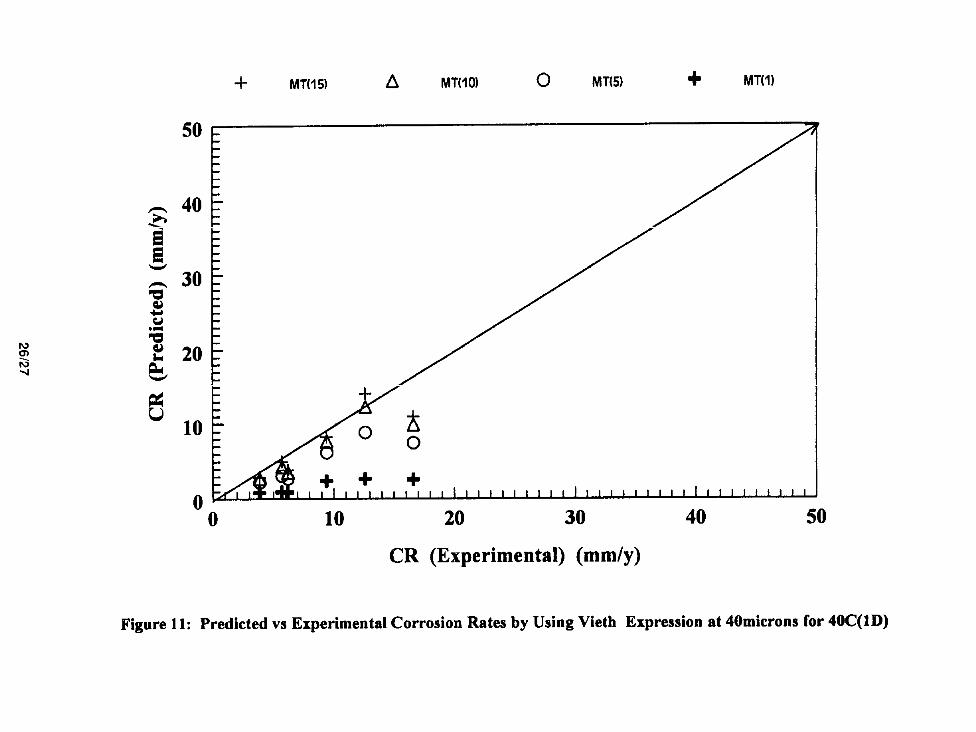
For the presence of a corrosion product film, the values of the ratio of void fraction
and tortuosity W = 1, 5, 10 and 15 are chosen, for the calculation of the diffirsivity inporous corrosion film. These vrdues are chosen due to the large pore size.
It is seen that corrosion rate increases with the value of the ratio of void fraction and
tortuosity which is represented by W, since the rate of mass transfer through the porous
product film increases with W. For example, at 40°C, film thickness of 30 microns, forbrine, at a pressure of 0.79MPa, the predicted corrosion rates are 3.0, 6.8, 8.2 and 8.7mm/year for four different values of EM(1, 5, 10 and 15) respectively, and for 20%oil-80%saltwater, at the same condition, the predicted corrosion rates are 3.5, 10.3, 13.7
and 15.3 mm/year respectively with increasing W.
From Figure 8. It can be seen that the model predicts well the experimental results at
W of 15 for 40, 60 and 80°C, at film thickness of 30 to 40 microns. The comparison with
experimental corrosion rates reveals that W of 15 can represent the total mass transferwhich includes total diffusion (difisions through both liquid and solid) and totalconvection ( both natural and forced convection) contributions through the porouscorrosion product film in which the pores are wide or large and film is thick in fillydeveloped turbulent pipe flow conditions.
Choosing the value of 8/~ of 1 results in under prediction of the experimental data. Itindicates that the diffusion contribution cannot represent the total mass transfer through
the porous film in which the pore radii is small, the convection contribution to the totalmass transfer also needs to be considered.
The effect of the film thickness on the corrosion rate was also studied. Film thicknessof 30 and 40 microns were studied. These are shown from Figure 8 through 13.
Effect of velocity
It is seen that the corrosion rate increases with velocity but the increase is not linear.The corrosion rate versus velocity plot is a curve with the slope continuously decreasingas the velocity increases which is similar to Dayalan et alz ‘s studies on the effect ofvelocity. The corrosion rate should increase nearly linearly with velocity for cases where
26/14

the corrosion processes are mass transfer controlled, Figure 14. shows the effect ofvelocity on predicted corrosion rate for 0.13 MPa carbon dioxide partial pressure, at
temperatures of 40, 60 and 80°C for ASTM seawater in 4 “ pipe. It is seen that the
corrosion process becomes reaction rate controlled at a velocity of 15 m/s for 40”C whichcan be described as the limiting velocity, which goes up with increase in temperature sincethe reaction rate increases much more quickly than the mass transfer rate. For example a
temperature rise from 40°C to 60 ‘C increases the reaction rate constants to about 10times while the mass transfer coefficient increases only about 2 times.
CONCLUSIONS
A mechanistic model is presented for the prediction of sweet corrosion in two phaseoillsalt water flows. The model incorporates the chemistry of the salt, thermodynamics ofcarbon dioxide dissolution and dissociation, two phase mass transfer, electrochemicalkinetics on the metal surface and the presence of a corrosion product film. The modelfollows the same steps as described by Dayalan2 (1995) but the number of cathodicreactions are reduced. The calculation of pH includes the activity and activity coefficientof hydrogen ion and this is related to the concentrations of other ions in solution. Masstransfer coefficients are calculated using the Veith et all’. expression as the predictedcorrosion rates calculated using this expression shows good agreement with theexperimental results but mass transfer coefficients calculated using mixture propertiesresult in under prediction of corrosion rates, The model predicts well the experimentalresults by using the value of the ratio of void fraction and tortuosity (15) for film thicknessof 30 to 40 microns, The value represents both total diffision (DifYusion through liquidand solid) and total convection (combination of natural and forced convection) throughthe porous corrosion product film in which the pores are wide or large and the film isthick.
REFERENCES
1. de Waard, C and Milliams, D. E, “Carbonic acid corrosion of steel”, Corrosion, Vol.31, N0.5, pp. 177, 1975.
2, Dayalan et al., “Modeling carbon dioxide corrosion of carbon steel in pipe flow”,Corrosion ’95, 118/1 - 118/24, 1995.
3. Herce et al., “Effects of solution chemistry and flow on the corrosion of carbon steel insweet production”, Corrosion ’95, 111/1 -11 1/26, 1995.
4. Ikeda, ~ Ueda, M and Mukai, S, “COZ behavior of carbon and Cr steels”, Advancesin C02 corrosion, Vol. 1, NACE, Houston, TX, 1985.
5. Videm, K and Dugstad, A, “Corrosion of carbon steel in an aqueous carbon dioxideenvironment. Part 1: Solution effects”, Material Performance, 63 – 67, March 1989.
6. de Waard et al., “Prediction model for COZ corrosion engineering in wet gaspipelines”, Corrosion, Vol. 47, No. 12, pp 976, 1991.
7. de Waard et al,, “Prediction model for C02 corrosion of carbon steel”, Corrosion ’93,NACE, 69, 1993.
26/1 5
8. Efird, K. D and Jasinski, R. J., “Effect of crude oil on corrosion of steel in crudeoilhine production”, Corrosion, 45(2), 165-171, 1989.
9. Tomson et al., “How ferrous carbonate kinetics impacts oil field corrosion”, SPE ‘91,257-262, 1991,
10. Heuer, K. J, “Preparation and examination of FeCOq and FesC films found in COZcorrosion of low carbon steel”, MS thesis – University of Illinois at UrbanaChampaign, 1996.
11, Dugstad, & “The importance of iron carbonate super saturation on the carbon dioxidecorrosion of the carbon steels”, Corrosion ’92, NACE, 14, 1992.
12. Vuppu, A. K, “Study of carbon dioxide corrosion of carbon steel pipes in multiphaseflow”, MS thesis – Ohio university, Athens, 1994.
13. Nesic et al,, “An electrochemical model for prediction of carbon dioxide corrosion”,Corrosion ’95, 131/1 - 131/26, 1995.
14, de Waard et al,, “Influence of liquid flow velocity in COZ corrosion of carbon steel”,Corrosion ’95, 128/1 - 128/15, 1995.
15. Vieth, W. R, Porter, J. H and Sherwood, T. K, Ind. Eng. Chem, Fundamentals 2.1,1963.
16. Sattertield, “Heterogeneous catalysts in practice”, 198017. Scott fogler, H, “Elements of chemical reaction engineering”, 198618. R. Zhang, M. Gopal and W. P. Jepson, “Development of a Mechanistic Model for
Predicting Corrosion Rate in Multiphase Oil/Water/Gas Flows”, Corrosion ‘97,NACE, Paper No. 601, 1997
19. Xie, “Study on mass transfer and turbulence in large pipe flow using limiting currentdensity technique”, MS thesis – Ohio university, Athens, 1997
26116
Mehd
Fe
Mnss Transfer Regh
co32- —>
Bldk solution
I 12C03
I lc03-
co32-
, p
oH-
Figure 1. The tr~llsfer of ions befweell tile metnl sllrf’nce nlld the bulk sollltioll
Metal
Fe
Corrosion Laver
H+
Fe2+ _~
Mass TransferRegion
4 H+
Bulk Solution
H2C03
Hco3-
co32-
H+
oH-
I%eetTect of n corrosion inyer on the trssnsport of ions between the metal surfnce
nnd the bulk solution

26/1 9
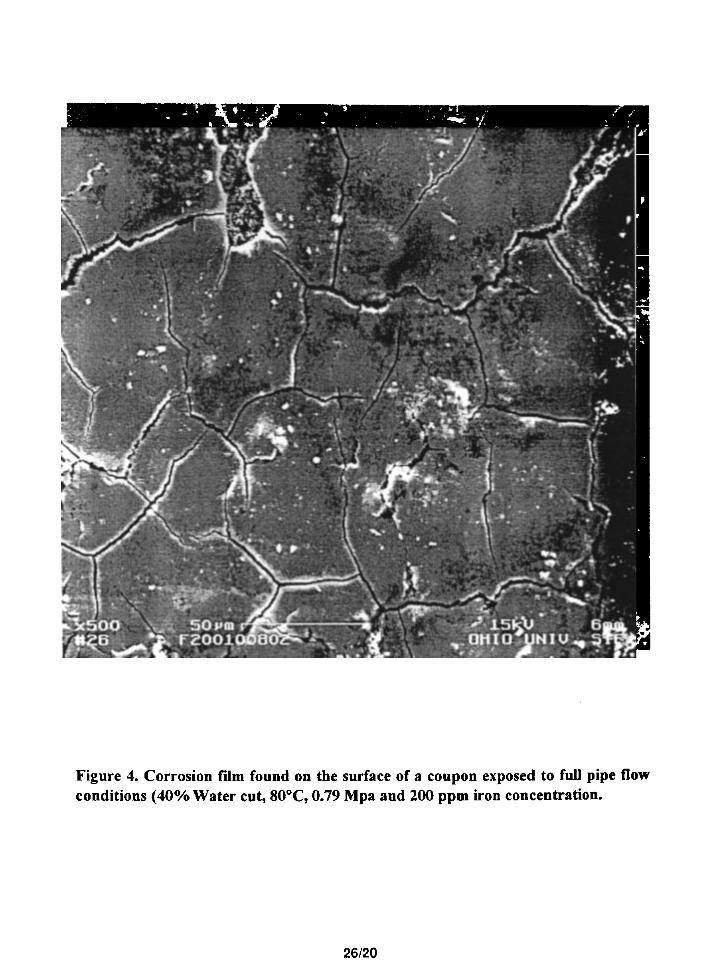
Figure 4. Corrosion fiim found on the surface of a coupon exposed to full pipe flOW
conditions (40°/0 Water cut, 80°C, 0.79 Mpa and 200 ppm iron concentration.
26/20
0mo
0mo*o0
26121
40 j-+
+
00 10 20 30 40
+
I I I I I I I I I ! I I I I I I I I I I I 1 I I I I I
CR (Experimental) (mm/y)
Figure 6: Predicted vs Experimental Corrosion Rates by Using Vieth Expression for 60C (2D)

+
owo-?
om
+
+
oNo
11111111111111111111!111
1!1111111111111111111111
10
00
gIn
o*
m
(@.U
I.U)
(p3~3!K
XId
)
o0
83
3’
26/23

+ MT(15) A Ml(IO) o Ml(5) + MT(1)
50
n“o 10 20 30 40 50
CR (Experimental) (mm/y)
Figure 8: Predicted vs Experimental Corrosion Rates by Using Vieth Expression at 30microns for 40C(1D)

+++
301+
lllllllllllfllllllllllIlllllflllllillllliill
111110
26/25

+
omo*omomo
II
III
III
1111111111111111111111111111111111111111
0
&o
26126
50
40
30
20
10
n
+ MT(15) A MT(IO) 0 MT(5) + MT(I)
“o 10 20 30 40 50
CR (Experimental) (mm/y)
Figure 11: Predicted vs Experimental Corrosion Rates by Using Vleth Expression at 40microns for 40C(1D)

o+
owo-e
+
aen
oN
-KIO
+-
Cg
II
I1111111111
II1111
IllI
II
11111111111111111111111
a
k?
26128

.
ot-lmoVJ
o
(.I@H
II)a$v~
uo!so.t.lo~
26129