modeling of cu precipitate contributions to reactor ... safety margin characterization... ·...
TRANSCRIPT
INL/EXT-17-43110
Light Water Reactor Sustainability Program
Modeling of Cu Precipitate
Contributions to Reactor Pressure Vessel Steel Microstructure Evolution
and Embrittlement
Stephanie A. Pitts Xianming Bai
Yongfeng Zhang
August 2017
DOE Office of Nuclear Energy
DISCLAIMER
This information was prepared as an account of work sponsored by an agency of the U.S. Government. Neither the U.S. Government nor any agency thereof, nor any of their employees, makes any warranty, expressed or implied, or assumes any legal liability or responsibility for the accuracy, completeness, or usefulness, of any information, apparatus, product, or process disclosed, or represents that its use would not infringe privately owned rights. References herein to any specific commercial product, process, or service by trade name, trade mark, manufacturer, or otherwise, does not necessarily constitute or imply its endorsement, recommendation, or favoring by the U.S. Government or any agency thereof. The views and opinions of authors expressed herein do not necessarily state or reflect those of the U.S. Government or any agency thereof.
INL/EXT-17-43110
Light Water Reactor Sustainability Program
Modeling of Cu Precipitate Contributions to Reactor Pressure Vessel Steel
Microstructure Evolution and Embrittlement
Stephanie A. Pitts1 Xianming Bai2
Yongfeng Zhang1
1Idaho National Laboratory, 2Virginia Tech
August 2017
Idaho National Laboratory Idaho Falls, Idaho 83415
http://www.inl.gov/lwrs
Prepared for the U.S. Department of Energy Office of Nuclear Energy
Under DOE Idaho Operations Office Contract DE-AC07-05ID14517

ABSTRACT
This report summarizes efforts during FY 2017 for developing capabilities to simulate microstruc-ture evolution and the resulting embrittlement in reactor pressure vessel steels. During operation, reactorpressure vessels undergo hardening and embrittlement due to irradiation induced defect accumulationand irradiation enhanced solute precipitation, including copper rich precipitate formation. Both defectproduction and solute precipitation begin on the atomic scale, and the effects of these irradiation defectslater manifest as as degradation in the engineering scale properties. Modeling and simulation capabil-ities are being developed at multiple scales to better understand these mechanisms and their effects onengineering-scale material response. Much of the work performed during this year and presented hereis to couple these microstructure evolution models with each other; these coupling efforts have focusedon copper rich precipitate formation and impact on macroscale embrittlement. These efforts include thedevelopment of a coupled capability with lattice kinetic Monte Carlo and rate theory models to captureirradiation enhanced diffusion in the formation of defects. In addition, a cluster dynamics model to pre-dict Cu precipitate formation was implemented in Grizzly. Finally, crystal plasticity models in Grizzly topredict the effect of Cu precipitates on reactor pressure steel hardening were improved and coupled withcluster dynamics models.
ii
CONTENTS
1 Introduction 1
2 Irradiation enhanced Cu precipitation in RPV steel alloys 22.1 Model description . . . . . . . . . . . . . . . . . . . . . . . . . . . . . . . . . . . . . . . . 22.2 Results . . . . . . . . . . . . . . . . . . . . . . . . . . . . . . . . . . . . . . . . . . . . . . 32.3 Discussion and conclusions . . . . . . . . . . . . . . . . . . . . . . . . . . . . . . . . . . . 3
3 Implementation of Cluster Dynamics Model of Cu Precipitation in Grizzly 53.1 Cluster dynamics model description . . . . . . . . . . . . . . . . . . . . . . . . . . . . . . 53.2 Model implementation in Grizzly . . . . . . . . . . . . . . . . . . . . . . . . . . . . . . . . 73.3 Code verification using two case studies . . . . . . . . . . . . . . . . . . . . . . . . . . . . 93.4 Discussions and conclusions . . . . . . . . . . . . . . . . . . . . . . . . . . . . . . . . . . 12
4 Cu precipitate induced embrittlement in crystal plasticity 134.1 Model description and implementation . . . . . . . . . . . . . . . . . . . . . . . . . . . . . 134.2 Cross slip formulation comparison . . . . . . . . . . . . . . . . . . . . . . . . . . . . . . . 144.3 Coupling to cluster dynamics CRP results . . . . . . . . . . . . . . . . . . . . . . . . . . . 164.4 Discussion and conclusions . . . . . . . . . . . . . . . . . . . . . . . . . . . . . . . . . . . 17
5 Summary 18
6 References 19
iii
FIGURES
1 Evolution of vacancy and CRP concentrations under thermal aging and irradiation conditions. 32 Time evolution of interstitial and vacancy concentration under electron and neutron irradiation. 113 Evolution of Cu precipitation formation kinetics in Fe-1.34at.%Cu under electron irradiation. 114 Evolution of Cu precipitation formation kinetics in Fe-1.34at.%Cu under neutron irradiation. 125 Comparison of deterministic and stochastic dislocation cross slip models under multiple slip
system activation loading conditions. . . . . . . . . . . . . . . . . . . . . . . . . . . . . . . 156 Comparison of deterministic and stochastic dislocation cross slip models under single slip
system activation loading conditions. . . . . . . . . . . . . . . . . . . . . . . . . . . . . . . 167 Response of coupled crystal plasticity and cluster dynamics simulation to various neutron
irradiation doses. . . . . . . . . . . . . . . . . . . . . . . . . . . . . . . . . . . . . . . . . 17
iv
TABLES
1 Cluster dyanmics model parameters for Cu precipitation in F3-1.34at.%Cu under electronand neutron irradiation. . . . . . . . . . . . . . . . . . . . . . . . . . . . . . . . . . . . . . 10
2 Crystal plasticity model parameters calibrated for Fe-0.3%Cu with experimental data [16] . . 15
v
ACRONYMS
AKMC atomic kinetic Monte CarloAPT atom probe tomographyBCC body centered cubicBWR boiling water reactorCD cluster dynamicsCDF continuous distribution functionCPFEM crystal plasticity finite element methodCRP copper rich precipitateDD dislocation dynamicsDFT density functional theorydpa displacement per atomFE finite elementFP3DM Frenkel pair three-dimensional diffusion modelLKMC lattice kinetic Monte CarloMD molecular dynamicsMNP Mn/Ni rich precipitateODE ordinary differential equationPAS positron annihilation spectroscopyPDE partial differential equationPF phase fieldPWR pressurized water reactorRPV reactor pressure vesselRT rate theorySIA Self Interstitial AtomsSPPARKS Stochastic Parallel PARticle Kinetic SimulatorTEM transmission electron microscopy
vi
1 Introduction
Maintaining the integrity of reactor pressure vessels (RPVs) is a key requirement for the safe long term oper-ation of existing reactor fleets: RPVs house the reactor core and are expensive to be replaced. That the RPVsteel remains sufficiently tough and ductile to resist crack growth under operating temperature and irradiationconditions is an important safety criterion [1]. RPVs are typically made of iron-based steels, with copper aseither an alloying element or an impurity. These alloying elements tend to form solute precipitate clusters,in the case of copper termed CRPs (copper rich precipitates), and these CRPs are considered to be one ofthe key contributors to irradiation-induced embrittlement [2, 3]. Irradiation embrittlement is characterizedby an increase in the ductile-to-brittle transition temperature (DBTT) [1], indicating a higher tendency forbrittle fracture behavior to occur at higher temperatures. The CRP formation is accelerated by interstitial andvacancy concentrations, leading to high densities of irradiation-induced precipitates. The vacancies (unoc-cupied lattice sites) and interstitials (extra atoms on lattice sites) are lattice point defects generated by highenergy neutrons during normal operation. All of these irradiation defects impede dislocation motion, re-ducing ductility and increasing the hardening and embrittlement of RPVs [4]. Increased embrittlement canincrease the propensity of RPVs to fail.
To reliably assess the safe long term operation of existing reactors, quantitative and physics-based corre-lations between irradiation dose levels and embrittlement are needed for given reactor operating conditions.Because engineering scale material properties are determined by the microstructure, the development ofthese correlations requires simulation tools to describe the evolution of the RPV microstructure under con-tinuing irradiation exposure. These microstructural features evolve with time and depend on the irradiationand thermal histories. For RPV steels the critical microstructure evolution features are those representingradiation damage and solute precipitates, including their volumetric density, size distribution, and spatialdistribution. The evolution of radiation damage, vacancy and interstitial generation, and CRP formation arephysically coupled with each other. Because the formation of CRPs is accelerated by the transient irradiation-induced vacancy concentration and because the specific characteristics of the CRPs determine the degree towhich these precipitates contribute to the macroscale embrittlement of RPV steel, a multi-scale simulationapproach is required to understand the effect of CRPs on RPV embrittlement. In previous years, simulationmodels for different length and time scale aspects of the CRP microstructure formation have been developed[5, 6, 7], and coupling among these individual simulations models is now necessary to better understand therole of copper rich precipitate formation on the microstructure evolution and resulting plastic embrittlement.
To model the formation and growth of lattice point defects, e.g. vacancies, and the CRPs, rate theory(RT) and cluster dynamics (CD) approaches are implemented while continuum mesoscale crystal plasticitymodels are used to model the impact of these defects on RPV toughness. The acceleration of CRP formationby irradiation-induced diffusion is modeled by coupling lattice kinetic Monte Carlo (LKMC) and rate theory(RT) models. The effect of specific CRP characteristics created by different irradiation doses on macroscalehardening and embrittlement is captured by coupling crystal plasticity with the results of cluster dynamicssimulations. The development of these models spans several years, and more detail on this ongoing effortcan be found in the previous Grizzly reports [5, 8, 9, 6, 7]. In this document, the effort made in FY17 tocouple individual microstructure models is summarized.
1
2 Irradiation enhanced Cu precipitation in RPV steel alloys
Two main drivers of microstructure evolution of RPV steels are the accumulation of radiation damage andthe precipitation of solute elements [10]. Under irradiation, these two effects are strongly coupled with eachother. In particular, the precipitation kinetics of alloying elements can be dramatically accelerated by irra-diation produced defects such as vacancies. This acceleration occurs because most alloying elements aresubstitution elements in BCC steels, and these substitution alloy elements diffuse by a vacancy-mediatedmechanism. The effective diffusivities of alloying elements are proportional to the transient vacancy con-centration, and, in irradiation conditions, the transient vacancy concentration is much higher than the ther-mal equilibrium concentration. Therefore, precipitation can occur with a much higher rate under irradiationcompared to the rate from thermal aging. This rate acceleration effect has to be considered to predict theprecipitation kinetics in RPV steels under neutron irradiation.
2.1 Model descriptionIn previous years, an lattice kinetic Monte Carlo (LKMC) model has been developed for alloying elementprecipitation in body centered cubic (BCC) crystal steels. This method has been used to simulate the for-mation of Cu-rich precipitates (CRPs) in model alloys during thermal aging, and the possible formation ofMn-Ni-rich precipitates (MNPs) at irradiation-induced defects [8, 6, 7]. The results of the CRP formationmodel have been benchmarked with thermal aging experiments in FeCu1.34%model alloy. One critical com-ponent that is missing in applying this model under neutron irradiation conditions is the irradiation enhanceddiffusion. The ability to include irradiation enhanced diffusion requires the transient vacancy concentra-tion: the individual vacancies responsible for alloying element diffusion under an irradiating environment.This transient concentration information can be obtained by coupling the LKMC model with the rate theory(cluster dynamics) model, and the cluster dynamics model is being developed in parallel for radiation damageaccumulation under the Grizzly project. In FY17, an effort was made to couple the LKMC and rate theorymodels.
In LKMC simulations a constant vacancy concentration (cv) is used, which differs from both the thermalequilibrium concentration and the transient concentration under irradiation, because of the limitations in timeand spatial scales of the simulation. To accommodate the use of variable vacancy concentrations, the LKMCtime needs to be converted to physical time. This conversion requires the thermal equilibrium cv for thermalaging, and the transient cv for irradiation. The relation between LKMC time and physical time is given by:
dtreal = dtKMCfvt ∗ cKMC
v
crealv(1)
Here treal is the physical time in realistic materials, and tKMC that in KMC simulations. Accordinglycrealv and cKMC
v are the realistic vacancy concentration and that in a KMC simulation. The conversion isstraightforward for thermal aging since the crealv is constant at a given temperature, and the coefficient fvtaccounts for the effect of impurity trapping [6]. Under irradiation, the vacancy concentration changes withtime without an analytical solution. Therefore, direct conversion is not feasible. Instead, the KMC time canbe correlated to the physical time by:
∫
tKMC
0fvt ∗ cKMC
v dtKMC = ∫
treal
0crealv dtreal (2)
The integrated cv ∗ dt denotes the effective vacancy diffusion in a given time period. Provided that thetransient crealv is known, numerical solution can be obtained to convert the KMC time to physical time underirradiation.
2
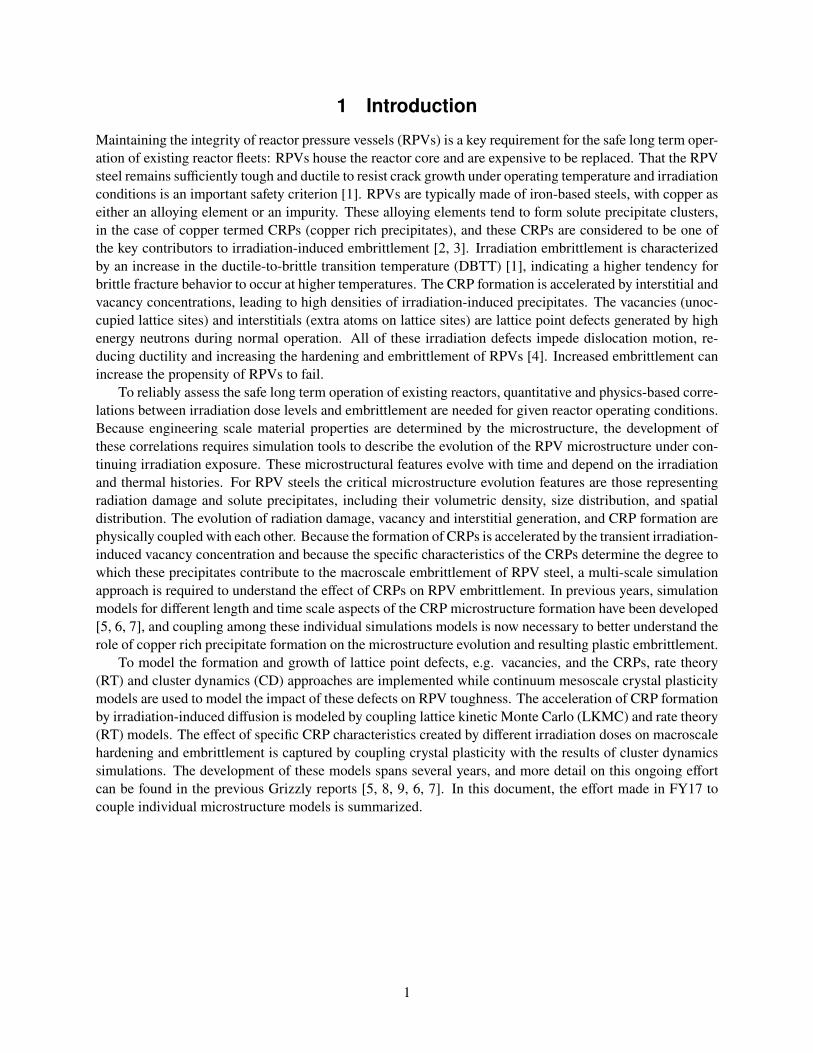
2.2 ResultsTo demonstrate this coupling, we used the vacancy concentration given by the rate theory (see Section 3)[11]. The irradiation condition is at 500oC with a dpa rate of 2.0×10⁻⁹dpa/s. We note that the existence ofCu will change the diffusion of vacancy compared to the rate in pure BCC Fe. The effect has been consideredin the rate theory. More details about the rate theory (or cluster dynamics) model are given in Section 3. Asshown in Figure 1, to reach the same effective vacancy diffusion, a significantly longer time is needed underthermal aging than under irradiation due to the much lower vacancy concentration. To further demonstratethe irradiation enhanced CRP precipitation, the previous LKMC results in a FeCu1.34% model alloy arere-plotted by converting the KMC time to the physical time under both thermal aging and irradiation. Theirradiation is at 500oC with a dpa rate of 2.0×10⁻⁹dpa/s. For thermal aging the thermal equilibrium vacancyconcentration is calculated using a vacancy formation energy of 1.60 eV. For irradiation, the transient vacancyconcentration is obtained from the rate theory. As shown in Figure 1, to reach the peak in CRP concentrationrequires approximately 50 seconds under irradiation, while it takes nearly 1 hour under thermal aging at thesame temperature to reach the peak concentration value. This result indicates the importance of includingirradiation enhanced diffusion in predicting the precipitation kinetics of alloying elements in RPV steels.
Figure 1: (left) Comparison of the time required to reach the same integrated cv ∗ t value during thermalaging and irradiation, and (right) volumetric density of CRPs with 50 or more Cu atoms as a function of timeunder irradiation. The CRPs precipitation is simulated using LKMC with a simulation cell of 28.5 by 28.5by 28.5 nm3. It contains 2M atoms with one vacancy. The KMC time is then converted to physical timeusing the vacancy concentration from the rate theory.
2.3 Discussion and conclusionsThe above results demonstrate the importance of irradiation-enhanced precipitation and the capability ofcoupling LKMC and rate theory (or cluster dynamics) to account for the enhanced precipitation due to ir-radiation. This coupling represents a critical component for predicting the precipitation kinetics of alloyingelements in an irradiating environment. Some discussion is warranted here. First, in Figure 1 the rate theorymodel rather than the more complicated cluster dynamics model is used to estimate the transient vacancyconcentration. In the former model all vacancies are regarded as individual without forming clusters, whilein the latter clusters of various sizes are considered. In general, large vacancy clusters have lower diffusivities
3
than individual ones. Therefore, using the rate theory model may over estimate the effective diffusivity. Be-cause of its much higher solving speed, the rate theory model serves well for the purpose of demonstratingthe coupling with LKMC. More realistic assessments can be obtained by using the solutions from clusterdynamics. Second, the effect of irradiation-induced segregation/precipitation of alloying elements are ig-nored here. This effect can be considered by accounting for the transient information of defect clusters intoLKMC, with the interaction between these defects and alloying elements calculated by density functionaltheory calculations or molecular dynamics simulations [12]. This capability will be demonstrated in thefuture.
4
3 Implementation of Cluster Dynamics Model of Cu Precipitation inGrizzly
Reactor pressure vessels (RPV) are exposed to long-term neutron irradiation during their service [10]. Neu-tron irradiation can induce the precipitation of alloy elements such as Cu in RPV steels. These precipitatesare typically a few nanometers in diameter. Despite their small size, they can act as strong obstacles for dis-location motion, leading to radiation hardening and embrittlement [2]. Currently it is well accepted that Cuprecipitates are the main contributor to the degradation of the mechanical integrity in RPVs. Therefore, inte-gration of a Cu precipitation model in Grizzly can provide a more science-based prediction of the radiation-induced degradation of mechanical properties in RPV compared to the traditional empirical approaches. InFY2016, the Grizzly team had developed a calibrated cluster dynamics model of Cu precipitation under ir-radiation and the model had been tested in a standalone code [7]. In FY17, the model has been integratedinto the MOOSE based Grizzly code as described below.
3.1 Cluster dynamics model descriptionThe cluster dynamics method can model the nucleation, growth, and coarsening of solute precipitation inthe same framework, and radiation effects can also be conveniently included in the model [13]. The modelimplemented in our work is mainly based on a previously published work in literature [13]. The details ofthe model are also described in a recently accepted manuscript [11]. Here the key information of the modelis presented so that the implementation methodology can be explained clearly in a self-contained manner.This description may also help future Grizzly users better understand the physical meaning of the inputparameters.
During precipitation, Cu clusters can have different sizes. In cluster dynamics modeling, the size ofeach class of cluster can be represented by the number of atoms it contains. Each class of cluster has aconcentration based on the mean field assumption. The concentration of a cluster containing n Cu atoms isrepresented by Cn. Here only Cu monomers are considered mobile. When a cluster of size n absorbs oneCu monomer, its size becomes n + 1. When a cluster of size n + 1 emits one Cu monomer through thermalemission, its size decreases to n. Therefore, the flux from cluster size n to n + 1 is:
Jn→n+1 = nC1Cn − n+1Cn+1, (3)
where n is the absorption coefficient for a cluster of size n and n+1 is the emission coefficient for a clusterof size n+ 1. Assuming all clusters (including monomers) have a spherical geometry, the radius of a cluster
of size n is rn =[
3nVat4
]1∕3, where Vat = a03∕2 is the volume per BCC Cu (or Fe because of the assumption
of coherent interface) atom and a0 is the lattice parameter for BCC Fe. The absorption coefficient n has theform
n =4(r1 + rn)DCu
Vat, (4)
where DCu is the Cu diffusion coefficient in Fe matrix. The emission coefficient is exponentially related tothe absorption coefficient by the binding energy of the Cu cluster (Eb), the Boltzmann constant (kB), and thetemperature (T ):
n+1 = n exp
[
−Ebn+1
kBT
]
. (5)
5
In Equation 5, the cluster binding energy Eb is size-dependent and related to the cluster interface energy. The binding energy for a cluster size of n + 1 is
Ebn+1 = Ω − TΔS − (36)
1∕3V 2∕3at [(n + 1)2∕3 − n2∕3], (6)
whereΩ is the mixing enthalpy andΔS is non-configurational entropy [13], respectively. The binding energyincreases with cluster size and gradually approaches a saturated value. The concentration of each cluster size(Cn) evolves dynamically with time through either absorbing or emitting a Cu monomer. The time evolutionof Cn is described by a rate theory equation,
dCndt
= Jn−1→n − Jn→n+1, (n ≥ 2). (7)
For the evolution of the concentration of the monomer (C1), the situation is more complex because itis related to all n ≥ 2 fluxes. In addition, the formation or dissociation of a di-Cu cluster involves two Cumonomers at each time. Considering the role of C1 in these processes, the time evolution of C1 can berepresented as:
dC1dt
= −2J1→2 −∞∑
n⩾2Jn→n+1. (8)
Equations 7 and 8 describe the time evolution of all cluster sizes (n = 1 - ∞). Practically, a maximumcluster size nmax is used and its flux is set to zero as the boundary condition. Solving these ordinary differentialequations (ODEs), the concentration of each cluster size (Cn) can be obtained as a function of time. SinceCu atoms form substitution alloys in Fe, the Cu diffusion in Fe is mediated by vacancies. Under irradiation,vacancy concentration can be much higher than the thermal vacancy concentration. As a result, Cu diffusionis enhanced by irradiation. The radiation-enhanced Cu diffusivity is
DirrCu = D
tℎCu ⋅
C irrvC tℎv
= DtℎCu ⋅ firr, (9)
where the superscripts tℎ and irr represent the thermal and irradiation conditions, respectively, for vacancyconcentration (Cv) and Cu diffusion coefficient (DCu). The ratio ofC irrv ∕C
tℎv = firr is the radiation-enhanced
factor for Cu diffusion. The temperature-dependent thermal diffusion coefficient of Cu can be described byDtℎCu = D
0Cu exp
(
− EmCukBT
)
, whereD0Cu andE
mCu are the prefactor and activation energy of Cu diffusion in BCC
Fe, respectively. The thermal vacancy concentration is related to the vacancy formation energy (Efv ) in Fe
and to the temperature byC tℎv = exp(
− EfvkBT
)
. The vacancy concentration under irradiation (C irrv ) depends ondefect production rate, defect reaction, and defect loss to sinks. As in Ref. [13], here a simplified rate theorymodel is used to describe the point defect evolution under irradiation. In this model, only defect produc-tion, defect recombination, and defect loss to dislocations are considered. The time evolution of interstitialconcentration (Ci) and vacancy concentration (Cv) are described by the following two rate equations,
dCidt
= G0 − kivCiCv − ziDiCid , (10)
dCvdt
= G0 − kivCiCv − zvDvCvd , (11)
where is cascade efficiency;G0 is defect production rate or irradiation dose rate; kiv is defect recombinationcoefficient between interstitials and vacancies; Dv = D0
v exp(
− EmvkBT
)
is temperature-dependent Fe vacancy
6
diffusion coefficient, where D0v and Em
v are the prefactor and migration energy for vacancy diffusion, re-spectively; A similar equation of Di = D0
i exp(
− EmikBT
)
is used for Fe interstitial diffusion coefficient; d isdislocation density; and zi and zv are the absorption efficiencies for interstitials and vacancies, respectively.Typically it is assumed zi > zv. By solving Equations 10 and 11, the time evolution of vacancies and intersti-tials under irradiation can be obtained. This then permits the calculation of radiation-enhanced Cu diffusionusing Equation 9.
3.2 Model implementation in GrizzlyThe implemented cluster dynamics model in Grizzly takes advantage of some MOOSE features such asUserObject, Actions, Postprocessor, ScalarKernel. A test problem directory was created to verify the im-plemented codes. The test input file in this directory can be easily modified to study Cu precipitation underdifferent conditions. The names of all classes start with ‘CDCu’ to indicate cluster dynamics of Cu precipi-tation. The classes implemented in Grizzly are described below.
CDCuParameters class. This class is derived from the GeneralUserObject class. As its name implies,it stores many constant parameters for the model. Most of the input parameters of the cluster dynamicsmodel are read by this class, such as T , a0, etc. The class uses the input parameters to further calculate someother parameters such as the size-dependent absorption coefficient n (Equation 4), the emission coefficientn (Equation 5), the binding energy Eb
n (Equation 6), the diffusion coefficients of a Cu atom, etc. Theseproperties are stored in this UserObject class so that it is convenient for other classes to access them.
CDCuBase class. This class is derived from the ODEKernel class. It is the base kernel class for solvingthe ordinary differential equations of the Cu cluster evolution (Equations (7) and (8)). This class accessesthe CDCuParameters class to get the necessary parameters for solving the cluster evolution equations. Notethat this base class accesses the absorption coefficient n array and the emission coefficient n array usingconstant references. Therefore all the cluster evolution kernels derived from this base class access the samememory of the two arrays in the UserObject. This approach is important when the maximum cluster size islarge because each cluster dose not need allocate its own memory for these two arrays.
CDCuC1 class. This class is derived from theCDCuBase class. It is theODE kernel for the Cumonomer(C1), which solves Equation 8. C1 couples with all other Cn clusters for n ≥ 2. Both Jacobian and OffDi-agonalJacobian functions are implemented for this class, which enable accurate preconditioning and goodconvergence.
CDCuCn class. This class is also derived from theCDCuBase class. It is theODE kernel for all n ≥ 2Cuclusters (Cn), which solves Equation 7. Each Cn only couples with its previous cluster Cn−1 and its followingcluster Cn+1. Both Jacobian and OffDiagonalJacobian functions are implemented for this class.
CDCuPrecipitation class. This class is derived from the Action class. It creates all the Variables (C1 −Cn), ScalarKernels (CDCuC1 andCDCuCn),ODETimeDerivativeKernels, and sets the initial conditions forall variables. It also creates a UserObject of the CDCuParameters type called UO_Parameters. Therefore,the setup of the cluster dynamics model is mostly conducted in this action. It greatly simplifies the syntax ofthe input file and makes the code user-friendly.
CDCuClusterAverage class. This class is derived from theGeneralPostprocessor class. It post-processesthe simulation data and outputs the time-dependent Cu monomer concentration (C1), the total volumetricnumber density of clusters (Nv), and the average cluster radius (r). For the later two quantities, only clustersof size greater than a threshold value (e.g., n > 10 in our example) are counted. This threshold cluster sizeis an input parameter. The two quantities are calculated using the following equations:
Nv = Cn∕Vat, (12)
7
r =∑nmaxn=11(rn ⋅ Cn)∑nmaxn=11 Cn
. (13)
Note that this class requires all variables (C1 − Cn) as input. We use a MOOSE function addRequired-CoupledVarWithAutoBuild to automatically create these variable names as input. However, currently onlyvariables Cn with n from 0 to (nmax − 1) can be created by this MOOSE function. Since C0 does not exist, adummy AuxVariable needs to be created in the input file. Accordingly, the results from Equations 12 and 13do not include the cluster size of nmax. If nmax is sufficiently large, Cn is small so the results should not beaffected. Nevertheless, we will find a solution to solve this minor problem in the future.
CiRateTheory andCvRateTheory classes. These two classes were previously implemented in Grizzly.In this work, we use them separately from the cluster dynamics model to solve Equations 10 and 11 to obtainthe interstitial (Ci) and vacancy (Cv) concentration under irradiation. The steady-state vacancy concentrationis used to calculate the radiation-enhanced factor for Cu diffusion, firr. This enhanced factor is used as aninput parameter for the cluster dynamics model. Note that the two classes could be directly coupled to thecluster dynamics model. If direct coupling is used, the results in the early nucleation and growth stage willchange but those in the late coarsening stage (the stage with which we are most concerned) will not beaffected. In other words, the direct coupling would not change the results at long times but make the clusterdynamics model less flexible because many other defect evolution model also can be used to calculate firr.Therefore, the current approach has more flexibility but less complexity than the direct coupling approach.
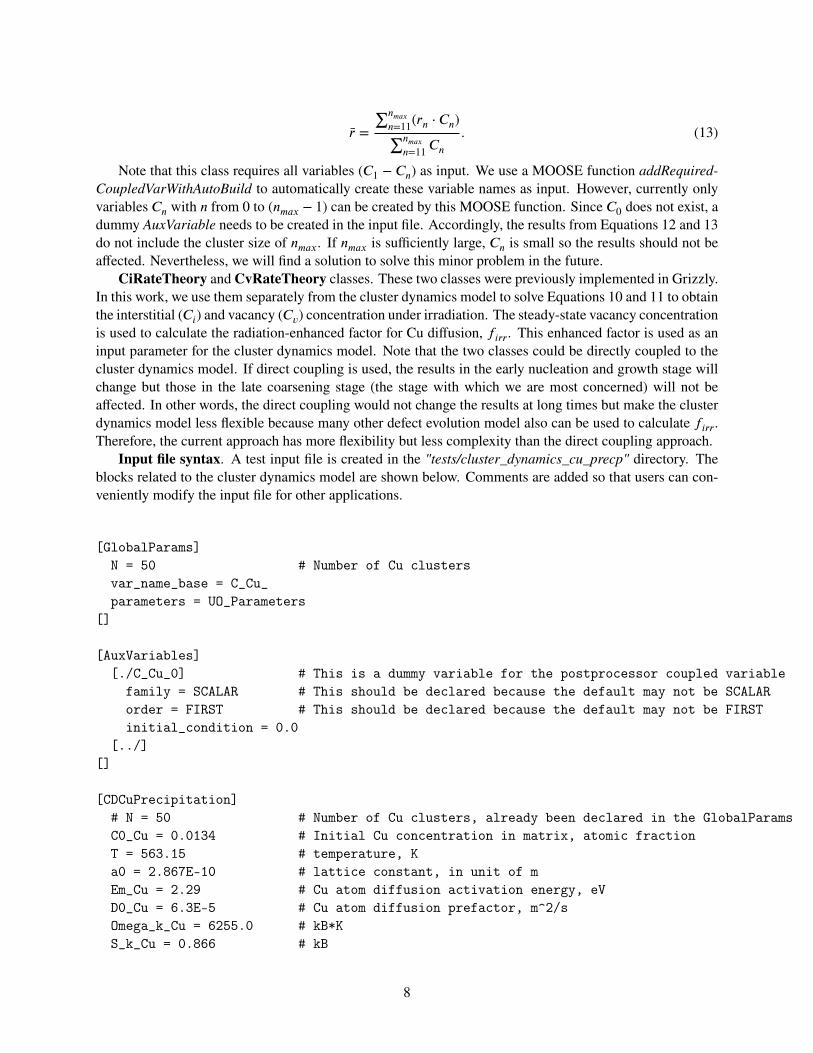
Input file syntax. A test input file is created in the "tests/cluster_dynamics_cu_precp" directory. Theblocks related to the cluster dynamics model are shown below. Comments are added so that users can con-veniently modify the input file for other applications.
[GlobalParams]N = 50 # Number of Cu clustersvar_name_base = C_Cu_parameters = UO_Parameters
[]
[AuxVariables][./C_Cu_0] # This is a dummy variable for the postprocessor coupled variable
family = SCALAR # This should be declared because the default may not be SCALARorder = FIRST # This should be declared because the default may not be FIRSTinitial_condition = 0.0
[../][]
[CDCuPrecipitation]# N = 50 # Number of Cu clusters, already been declared in the GlobalParamsC0_Cu = 0.0134 # Initial Cu concentration in matrix, atomic fractionT = 563.15 # temperature, Ka0 = 2.867E-10 # lattice constant, in unit of mEm_Cu = 2.29 # Cu atom diffusion activation energy, eVD0_Cu = 6.3E-5 # Cu atom diffusion prefactor, m^2/sOmega_k_Cu = 6255.0 # kB*KS_k_Cu = 0.866 # kB
8
E0_Interface_Cu = 0.37 # Cu-Fe interface energy, J/m^2Rad_Enhance_Diff_f = 2.5E7 # Radiation-enhanced Cu diffusion factor
[]
[Postprocessors][./nit]
type = NumNonlinearIterations[../]
[./C1]type = CDCuClusterAveragen_criti = 10 # Only n>10 clusters are used for calculating the average
# cluster radius and number densityoutput_type = C1
[../]
[./ave_r]type = CDCuClusterAveragen_criti = 10 # Only n>10 clusters are used for calculating the average
# cluster radius and number densityoutput_type = Ave_r
[../]
[./total_cluster_dens]type = CDCuClusterAveragen_criti = 10 # Only n>10 clusters are used for calculating the average
# cluster radius and number densityoutput_type = Total_Cluster_Density
[../][]
3.3 Code verification using two case studiesTwo case studies are used to verify the correct implementation of the model, which has been merged intoINL’sGrizzly repository. Case I is a previously publishedmodel of Cu precipitation under electron irradiationin a Fe-1.34at.%Cu at 290 C [13]. Case II is our recently calibrated model of Cu precipitation under neutronirradiation in a Fe-0.3at.%Cu at 300 C [11], which is closer to the realistic RPV materials and irradiationconditions than the first case. In both cases the parameters are calibrated with small angle neutron scatteringexperiments for the same alloys under the same irradiation conditions. The parameters of the two casesare summarized in Table 1. Note the parameters listed above the shaded row in Table 1 are used as inputparameters for the cluster dynamics model in Grizzly. The parameters listed below the shaded row areused as inputs for the rate theory calculations of interstitial and vacancy evolution in Grizzly. The resultingradiation-enhanced Cu diffusion factors are listed immediately above the shaded row. In both case studies,the maximum cluster size is set to 1000 for demonstration purposes. To verify the correct implementation ofthe model in Grizzly, independent simulations using our standalone code, which is solved by the SUNDIALSODE solver [14], are conducted for the same parameter sets of the two case studies.
First the time evolution of interstitial and vacancy concentration under irradiation is calculated using the
9
Parameter Case I Case II Irradiation Type Electron irradiation Neutron irradiation C1
0, initial Cu concentration 1.34 at.% 0.3 at.% a0, lattice constant of bcc Fe 2.867 Å same T, temperature 563 K (290 C) 573 K (300 C) ECu
m, activation energy of Cu thermal diffusion in Fe
2.29 eV same
DCu0, prefactor of Cu thermal diffusion
in Fe 6.3×10⁻⁵ m2/s
same
Ω, heat of mixing of Cu in Fe 6255 kB·K same ∆S, non-configurational entropy 0.866·kB same σ, interface energy for coherent Cu-Fe interface
0.37 (J/m2) same
firr, Radiation enhanced factor 2.5 × 10⁷ 7.69 × 10⁵
G0, defect production rate 2×10⁻⁹ dpa/s 1.4 × 10⁻⁷ dpa/s ε, cascade efficiency 1.0 0.4 ρd, dislocation density 1.0×10¹² m-2 5×10¹³ m-2 Ei
m, Fe interstitial migration energy 0.3 eV same Di
0, Fe interstitial diffusion prefactor 4.0×10⁻⁸ m2/s same Ev
m, Fe vacancy migration energy 1.3 eV 1.0 eV Dv
0, Fe vacancy diffusion prefactor 1.0×10⁻⁴ m2/s same riv, defect recombination radius 6.5 Å same zi, dislocation absorption efficiency for interstitials
1.2 same
zv, dislocation absorption efficiency for vacancies
1.0 same
Evf, vacancy formation energy in Fe 1.6 eV same
Table 1: Parameters of two cases studies. The Case I study is for Cu precipitation in a Fe-1.34at.%Cu at290 C under electron irradiation [13] and Case II is for Cu precipitation in a Fe-0.3at.%Cu at 300 C underneutron irradiation [11] .
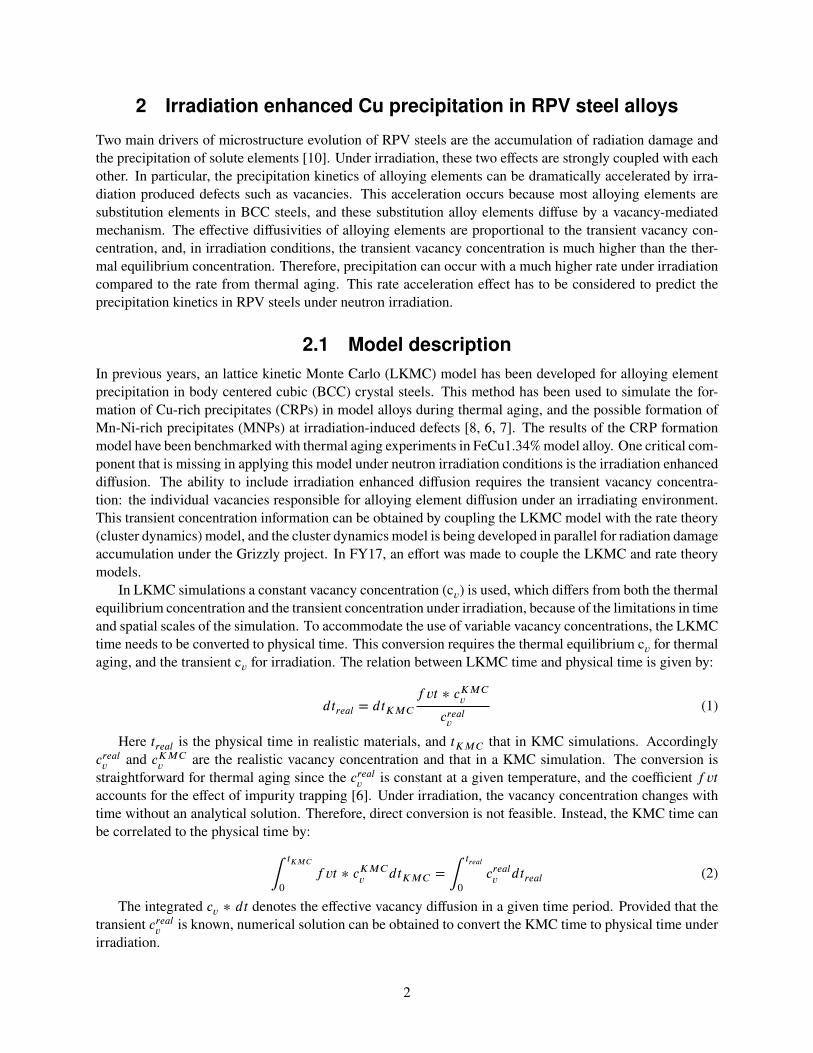
previously implemented CiRateTheory and CvRateTheory classes in Grizzly for the two case studies. Theresults are shown in Fig. 2. The steady state is reached at about 104 seconds in Case I while it is about 1second in Case II. In both cases, the vacancy concentration is higher than the interstitial concentration at thesteady state because dislocations absorb more interstitials than vacancies (the so called "dislocation bias").At the steady state, the radiation enhanced Cu diffusion factor, firr = C irrv ∕C
tℎv , is 2.5 × 10⁷ in Case I and
7.69 × 10⁵ in Case II. The enhanced factor is used as an input parameter for the cluster dynamics model ineach case study, as shown in Table 1.
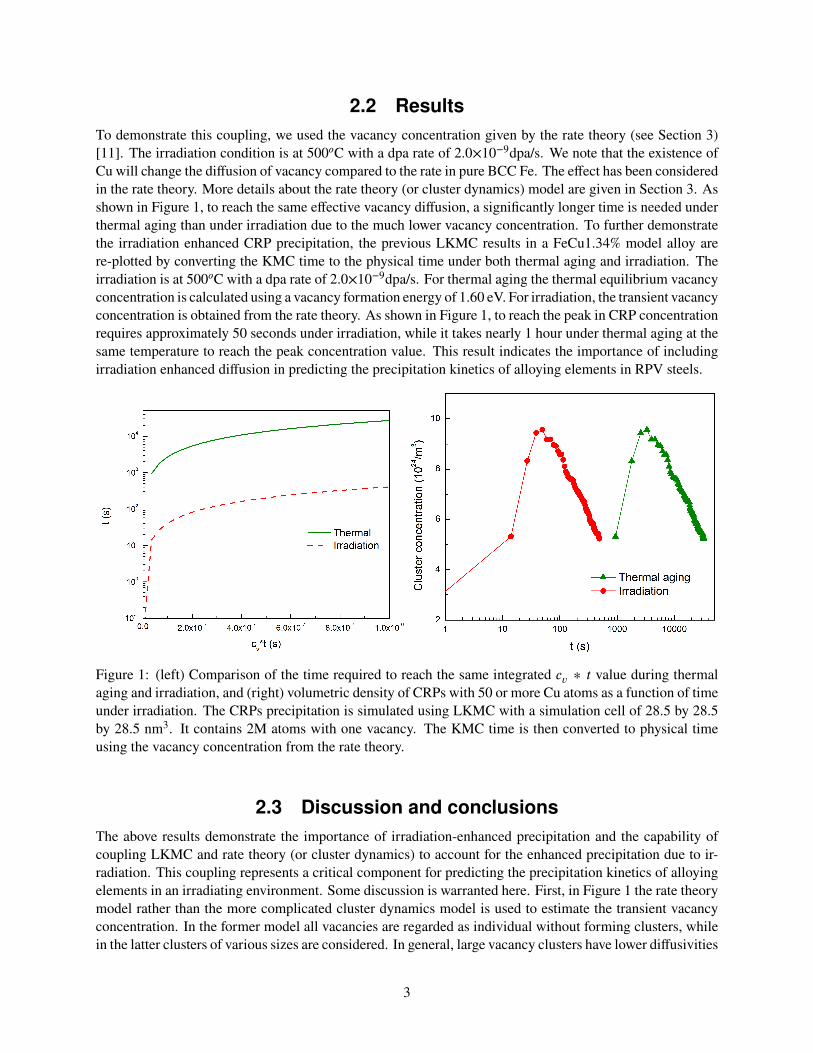
Next the Case I study of Cu precipitation is conducted in Grizzly. In this model, the alloy is Fe-1.34at.%Cu and the dislocation density is d = 1012m−2. The irradiation conditions are electron irradiationat 290 C with a dose rate of 2 × 10⁻⁹ dpa/s. The parameters have been calibrated using the cluster numberdensity and average cluster radius measured from small-angle neutron scattering experiments. Since electronirradiation only produces Frenkel pairs, the cascade efficiency is = 1.0. The time (or dose) evolution of totalCu cluster number density and average radius is shown in Fig. 3. Here only clusters having more than 10 Cuatoms are counted. Clearly, Grizzly produces results that are nearly identical to those from the standalonecode, indicating that the code implementation in Grizzly works correctly. The small difference between twocodes may be induced by different solvers and converge criteria. At long times, both cluster number densityand average radius reach saturated values. This behavior occurs simply because the maximum cluster sizeused in this demonstration case is not large enough.
10
1 0 - 4 1 0 - 3 1 0 - 2 1 0 - 1 1 0 0 1 0 1 1 0 2 1 0 31 0 - 1 3
1 0 - 1 2
1 0 - 1 1
1 0 - 1 0
1 0 - 9
1 0 - 8
Defec
t con
centr
ation
T i m e ( s )
C i C v
( b )
1 0 - 4 1 0 - 3 1 0 - 2 1 0 - 1 1 0 0 1 0 1 1 0 2 1 0 3 1 0 4 1 0 51 0 - 1 3
1 0 - 1 2
1 0 - 1 1
1 0 - 1 0
1 0 - 9
1 0 - 8
1 0 - 7
1 0 - 6
Defec
t con
centr
ation
T i m e ( s )
C i C v
( a )
Figure 2: Time evolution of the interstitial and vacancy concentration under irradiation for two case studies.The steady-state vacancy concentration is used to calculate the radiation-enhanced Cu diffusion factor ineach study. (a) Case I: Electron irradiation in a Fe-1.34at.%Cu at 290 C. (b) Case II: Neutron irradiation ina Fe-0.3at.%Cu at 300 C.
1 0 - 2 1 0 - 1 1 0 0 1 0 1 1 0 2 1 0 3 1 0 4 1 0 5
0 . 5
1 . 0
1 . 5
Avera
ge clu
ster ra
dius (
nm)
T i m e ( s )
S t a n d a l o n e c o d e G r i z z l y
1 0 - 1 0 1 0 - 9 1 0 - 8 1 0 - 7 1 0 - 6 1 0 - 5 1 0 - 4d o s e ( d p a )
( b )
1 0 - 2 1 0 - 1 1 0 0 1 0 1 1 0 2 1 0 3 1 0 4 1 0 51 0 1 5
1 0 1 7
1 0 1 9
1 0 2 1
1 0 2 3
1 0 2 5
1 0 2 7
Cu clu
ster n
umbe
r den
sity (m
-3 )
T i m e ( s )
S t a n d a l o n e c o d e G r i z z l y
1 0 - 1 0 1 0 - 9 1 0 - 8 1 0 - 7 1 0 - 6 1 0 - 5 1 0 - 4d o s e ( d p a )
( a )
Figure 3: Time (bottom axis) and dose (top axis) evolution of Cu precipitation kinetics in a Fe-1.34at.%Cuat 290 C under electron irradiation (Case I). (a) Evolution of total Cu cluster number density. (b) Evolutionof average Cu cluster radius.
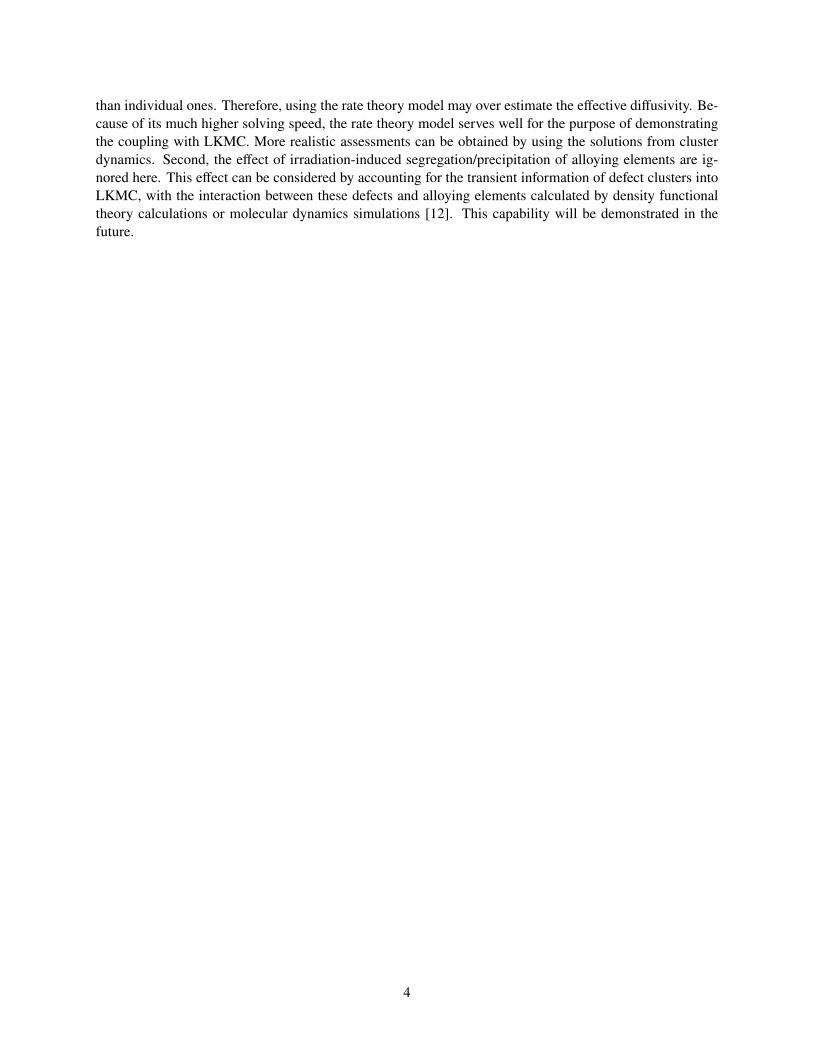
Similar to Case I, a study of Case II was also conducted using Grizzly. In this case, the alloy is a Fe-0.3at.%Cu alloy, the irradiation temperature is 300 C, the dose rate is 1.4 × 10⁻⁷ dpa/s, and the dislocationdensity is d = 5×10¹³m−2. Since both material properties and irradiation conditions are different from CaseI, the parameters need re-calibration. Our recent work [11] shows that most of the parameters from Case Ican be applied for Case II, except for the cascade efficiency and vacancy migration energy. Since neutronirradiation produces dense cascades and many defects recombine directly within the cascades, the cascadeefficiency is set to = 0.4. When Cu concentration is lower, the solute drag effect on the vacancy diffusionis also weaker. So the vacancy migration energy is changed to 1.0 eV to account for this effect. Similarto Case I, the new parameter set has been validated using the experimental data from small-angle neutronscattering experiments. The time (or dose) evolution of total Cu cluster number density and average radiusfor the Fe-0.3at.%Cu alloy is shown in Fig. 4. Again here only clusters having more than 10 Cu atoms arecounted. Again, Grizzly produces nearly identical results as the standalone code does. The discrepancy is alittle larger than that in Case I. But overall the agreement is excellent.
11
1 0 - 1 1 0 0 1 0 1 1 0 2 1 0 3 1 0 4 1 0 5
0 . 5
1 . 0
1 . 5
Avera
ge clu
ster ra
dius (
nm)
T i m e ( s )
S t a n d a l o n e c o d e G r i z z l y
1 0 - 7 1 0 - 6 1 0 - 5 1 0 - 4 1 0 - 3 1 0 - 2d o s e ( d p a )
1 0 - 1 1 0 0 1 0 1 1 0 2 1 0 3 1 0 4 1 0 51 0 1 5
1 0 1 7
1 0 1 9
1 0 2 1
1 0 2 3
1 0 2 5
1 0 2 7
Cu clu
ster n
umbe
r den
sity (m
-3 )
T i m e ( s )
S t a n d a l o n e c o d e G r i z z l y
1 0 - 7 1 0 - 6 1 0 - 5 1 0 - 4 1 0 - 3 1 0 - 2d o s e ( d p a )
( a ) ( b )
Figure 4: Time (bottom axis) and dose (top axis) evolution of Cu precipitation kinetics in a Fe-0.3at.%Cu at300 C under neutron irradiation (Case II). (a) Evolution of total Cu cluster number density. (b) Evolutionof average Cu cluster radius.
3.4 Discussions and conclusionsIn FY17, we have successfully implemented the cluster dynamics model of Cu precipitation under irradia-tion in MOOSE based Grizzly. This implementation will enable a direct coupling of the cluster dynamicsmodel with other MOOSE-based applications directly. The code takes advantages of many built-in MOOSEfeatures. It has an architecture which will enable convenient modification or expansion of the code capabilityin the future. The input file was made as simple as possible so that non-experts can easily use the code. Thecluster dynamics model can be coupled to plasticity models in Grizzly. It can also be extended to modelthe precipitation of Mn-Ni-Si clusters in the future. Currently the efficiency of the code is not as good asour standalone code, possibly due to some problems of the ODE solvers in the PETSc package (which ismainly used for solving partial differential equations (PDEs)). We will work with the MOOSE team to finda solution. An alternative solution is to implement the grouping method [15] to improve the efficiency of thecode.
12
4 Cu precipitate induced embrittlement in crystal plasticity
Irradiation-induced defects, including copper rich precipitates (CRP) and self-interstitial atom (SIA) loops,contribute to the long-term failure risks of RPV steels through embrittlement of the steel [1, 10]. Theseirradiation defects act as obstacles to dislocation motion, and the impeded dislocation motion at the mi-crostructure scale produces an increase in the yield stress and significant hardening in the plastic regime ofthe material behavior on an engineering scale. Crystal plasticity models, which predict dislocation densityevolution in an irradiation damaged microscale structure, can be used to connect microstructure evolution tomacroscale behavior predictions.
In previous years, a monolithic code crystal plasticity model was developed to predict the yield stress in-crease and plastic hardening behavior of BCC-iron with different static quantities of irradiation defects (CPRand SIA loops) from experimental data [7, 16, 17]. In FY16, this existing model was validated against exper-imental data [18] and was coupled with a microplane damage model to capture anisotropic cleavage fracture[7]. The significant changes of the RPV steel microstructure evolution, as described in previous sections ofthis report, affect the crystal plasticity simulations which use the microstructure state as initial conditions forthe model internal state variables. The coupling of the crystal plasticity model to the microscale models is acritical component of predicting macroscale property changes in response to microscale evolution, eliminat-ing the need for static initial conditions of the irradiation defects. Under the Grizzly project in FY17 an effortwas made to couple the crystal plasticity model to results from microscale dislocation dynamics and clusterdynamics models. This effort included implementing a new dislocation cross slip model to capture stochas-tic dislocation interactions from dislocation dynamics models and incorporating cluster dynamics results forCRP characteristics directly into the crystal plasticity model.
4.1 Model description and implementationDislocation density based crystal plasticity models calculate the stress and plastic strain resulting from dis-location motion, evolution, and interaction with microstructure features including other dislocations andirradiation defects. Dislocation motion, the motion of plastic slip, on each individual slip system is summedto calculate the plastic velocity gradient:
LP =∑
()s ⊗ m, where = ()mobilebvglide (14)
In the dislocation density based crystal plasticity mode, the Orowan relation is used to calculate the disloca-tion glide slip as a function of the mobile dislocation density, burgers vector, and dislocation glide velocity[19]. In a continuum crystal plasticity model, the dislocation glide velocity is modeled as a function of theapplied shear stress on the slip system and the slip system resistances; within this crystal plasticity modelwe apply an enthalpy driven flow rule [20]. The evolution of dislocations is separated into two categories,mobile dislocations:
()mobile =kmultb
√
∑
()mobile|
()| −
2Rcb()mobile|
()| − 1
bp√
()mobile + ()immobile
| ()| (15)
and immobile dislocations:
()immobile =1
bp√
()mobile + ()immobile
| ()| − kdyn()immobile|
()| (16)
In Equations 15 and 16, kmult is the coefficient for the multiplication of dislocations with the Frank-Reedgeneration mechanism, Rc is the radius of interaction between two dislocations with opposite signs on the
13
same slip plane, kdyn is the coefficient for the dynamic recovery of immobile dislocations, and d is the coef-ficient for the contribution of the total dislocation forest to the mean free glide path for mobile dislocations.Note the coupling among the trapped mobile dislocations, the third term in Equation 15, and the generationof immobile dislocations, the source term in Equation 16.
The resistance to dislocation glide velocity is divided into athermal and thermal resistance to slip in theenthalpy flow rule. Thermal resistance is an intrinsic material property from the lattice friction, and athermalresistance is a function of the microstructure of the grain. Here we have defined the athermal resistance as afunction of dislocations and CRP particles:
s()atℎermal = qdGb√
∑
A
(
()mobile + ()immobile
)
+ qcGb lg
(
12b√
N × d
)
√
N × d (17)
where resistance due to dislocations is modeled with a Bailey-Hirsch type expression and resistance due tocopper clusters is modeled in the vein of Kotrecho [18]. In Equation 17 qd is the coefficient for total dislo-cation barrier resistance to mobile dislocation glide, qc is the coefficient for the Kotrecho barrier hardeningmodel for CRPs, G is the shear modulus, N is the number density of CRP irradiation defects, and d is themean diameter of the CRP irradiation defects.
Material Model Implementation. A significant portion of the FY17 crystal plasticity effort centeredon updating the Grizzly crystal plasticity model to the current MOOSE tensor_mechanics module plug-and-play system. The code updating effort is necessary to both maintain the code as the MOOSE frame-work changes and to set the ground work for coupling to microstructure models, including cluster dynamics,through the MOOSE framework. The tensor_mechanics plug-and-play system separates the calculationof stress, strain, and the elasticity tensor into different classes. This separation enables more flexibility insimulations while reducing code duplication.
The code updating effort in FY17 recast as a StressUpdateBase type material. StressUpdateBasematerials are atypical materials in that MOOSE/Grizzly do not directly call these materials so that thesematerials can iterate to solve for internal state variables, e.g. slip increments and mobile dislocation densityincrements. A base class for general crystal plasticity, CrystalPlasticityUpdate was written to allowthe inheriting crystal plasticity classes to focus solely on implementing slip and dislocation evolution con-stitutive equations while the base class handles the iteration schemes. The use of the base class significantlyreduces the amount of code duplication in the Grizzly crystal plasticity models. The dislocation densitybased model described here is implemented as CrystalPlasticityEnthalpyFlowRuleUpdate and is un-dergoing preparation to be merged into Grizzly.
Simulation Parameters. The parameters for the StressUpdate crystal plasticity model were calibratedwith the unirradiated Fe-0.3%Cu experimental data from [16], based in part on the calibration of the FY16monolithic crystal plasticity model [7]. The parameter calibration simulations were performed on a single1x1x1 mm3 cubic grain loaded in the [1 0 0] direction (along the x-axis). In all of the crystal plasticity sim-ulations discussed in this report, an initial mobile dislocation density of 40 m−2 and an immobile dislocationdensity of 50 m−2, corresponding to the experimental data of [16], were used.
These parameters in Table 2 are similar to the values calibrated for -iron [18], excepting the parameterfor dislocation multiplication. The re-calibration of this parameter for the Fe-0.3%Cu system is supportedby the discussion in [21]: solute atoms in alloys can promote higher dislocation multiplication [18].
4.2 Cross slip formulation comparisonIn lower length scale models, such as dislocation dynamics, the probability of cross slip is calculated asa stochastic process [22] for single dislocations. At the continuum level in crystal plasticity models, the
14
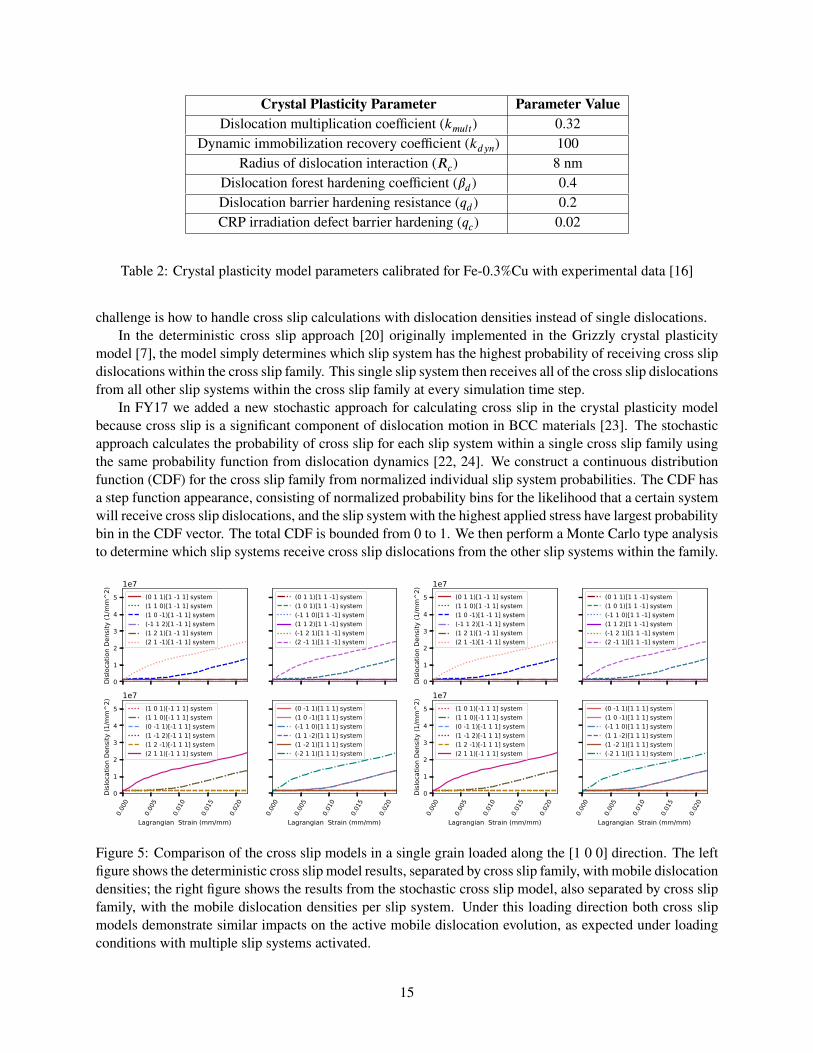
Crystal Plasticity Parameter Parameter ValueDislocation multiplication coefficient (kmult) 0.32
Dynamic immobilization recovery coefficient (kdyn) 100Radius of dislocation interaction (Rc) 8 nm
Dislocation forest hardening coefficient (d) 0.4Dislocation barrier hardening resistance (qd) 0.2CRP irradiation defect barrier hardening (qc) 0.02
Table 2: Crystal plasticity model parameters calibrated for Fe-0.3%Cu with experimental data [16]
challenge is how to handle cross slip calculations with dislocation densities instead of single dislocations.In the deterministic cross slip approach [20] originally implemented in the Grizzly crystal plasticity
model [7], the model simply determines which slip system has the highest probability of receiving cross slipdislocations within the cross slip family. This single slip system then receives all of the cross slip dislocationsfrom all other slip systems within the cross slip family at every simulation time step.
In FY17 we added a new stochastic approach for calculating cross slip in the crystal plasticity modelbecause cross slip is a significant component of dislocation motion in BCC materials [23]. The stochasticapproach calculates the probability of cross slip for each slip system within a single cross slip family usingthe same probability function from dislocation dynamics [22, 24]. We construct a continuous distributionfunction (CDF) for the cross slip family from normalized individual slip system probabilities. The CDF hasa step function appearance, consisting of normalized probability bins for the likelihood that a certain systemwill receive cross slip dislocations, and the slip system with the highest applied stress have largest probabilitybin in the CDF vector. The total CDF is bounded from 0 to 1. We then perform a Monte Carlo type analysisto determine which slip systems receive cross slip dislocations from the other slip systems within the family.
0
1
2
3
4
5
Dislo
catio
n De
nsity
(1/m
m^2
) 1e7(0 1 1)[1 -1 1] system(1 1 0)[1 -1 1] system(1 0 -1)[1 -1 1] system(-1 1 2)[1 -1 1] system(1 2 1)[1 -1 1] system(2 1 -1)[1 -1 1] system
(0 1 1)[1 1 -1] system(1 0 1)[1 1 -1] system(-1 1 0)[1 1 -1] system(1 1 2)[1 1 -1] system(-1 2 1)[1 1 -1] system(2 -1 1)[1 1 -1] system
0.000
0.005
0.010
0.015
0.020
Lagrangian Strain (mm/mm)
0
1
2
3
4
5
Dislo
catio
n De
nsity
(1/m
m^2
) 1e7(1 0 1)[-1 1 1] system(1 1 0)[-1 1 1] system(0 -1 1)[-1 1 1] system(1 -1 2)[-1 1 1] system(1 2 -1)[-1 1 1] system(2 1 1)[-1 1 1] system
0.000
0.005
0.010
0.015
0.020
Lagrangian Strain (mm/mm)
(0 -1 1)[1 1 1] system(1 0 -1)[1 1 1] system(-1 1 0)[1 1 1] system(1 1 -2)[1 1 1] system(1 -2 1)[1 1 1] system(-2 1 1)[1 1 1] system
0
1
2
3
4
5
Dislo
catio
n De
nsity
(1/m
m^2
) 1e7(0 1 1)[1 -1 1] system(1 1 0)[1 -1 1] system(1 0 -1)[1 -1 1] system(-1 1 2)[1 -1 1] system(1 2 1)[1 -1 1] system(2 1 -1)[1 -1 1] system
(0 1 1)[1 1 -1] system(1 0 1)[1 1 -1] system(-1 1 0)[1 1 -1] system(1 1 2)[1 1 -1] system(-1 2 1)[1 1 -1] system(2 -1 1)[1 1 -1] system
0.000
0.005
0.010
0.015
0.020
Lagrangian Strain (mm/mm)
0
1
2
3
4
5
Dislo
catio
n De
nsity
(1/m
m^2
) 1e7(1 0 1)[-1 1 1] system(1 1 0)[-1 1 1] system(0 -1 1)[-1 1 1] system(1 -1 2)[-1 1 1] system(1 2 -1)[-1 1 1] system(2 1 1)[-1 1 1] system
0.000
0.005
0.010
0.015
0.020
Lagrangian Strain (mm/mm)
(0 -1 1)[1 1 1] system(1 0 -1)[1 1 1] system(-1 1 0)[1 1 1] system(1 1 -2)[1 1 1] system(1 -2 1)[1 1 1] system(-2 1 1)[1 1 1] system
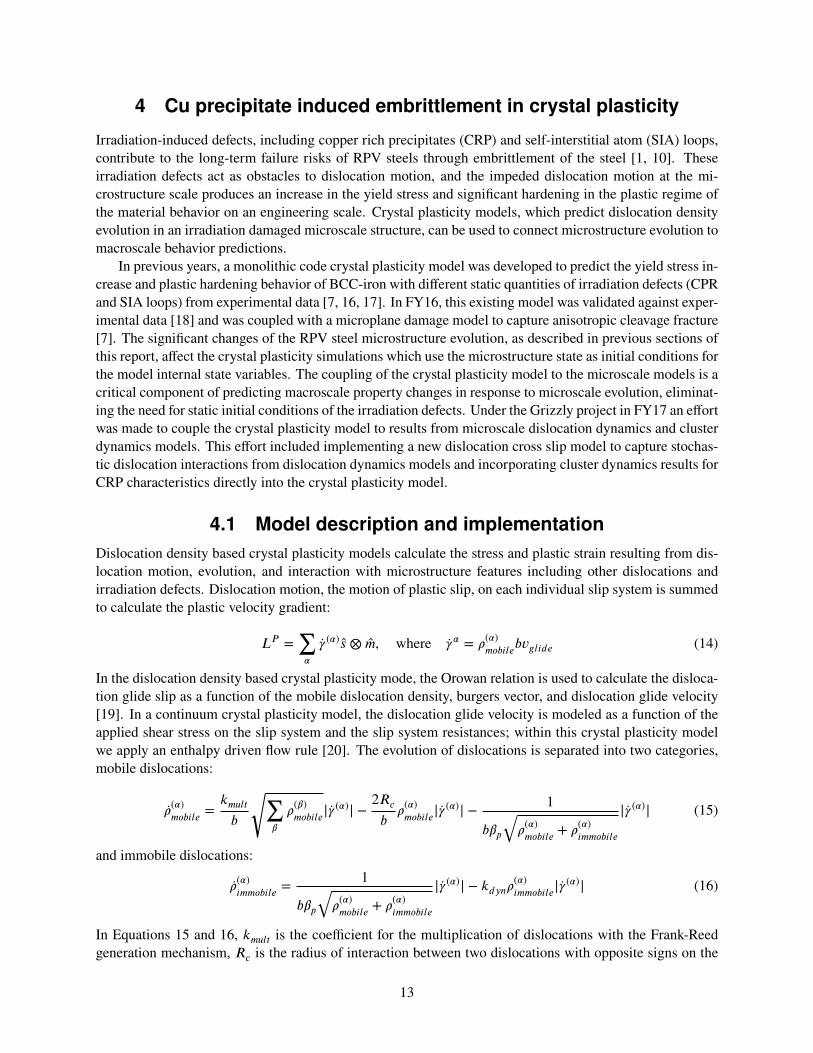
Figure 5: Comparison of the cross slip models in a single grain loaded along the [1 0 0] direction. The leftfigure shows the deterministic cross slip model results, separated by cross slip family, with mobile dislocationdensities; the right figure shows the results from the stochastic cross slip model, also separated by cross slipfamily, with the mobile dislocation densities per slip system. Under this loading direction both cross slipmodels demonstrate similar impacts on the active mobile dislocation evolution, as expected under loadingconditions with multiple slip systems activated.
15
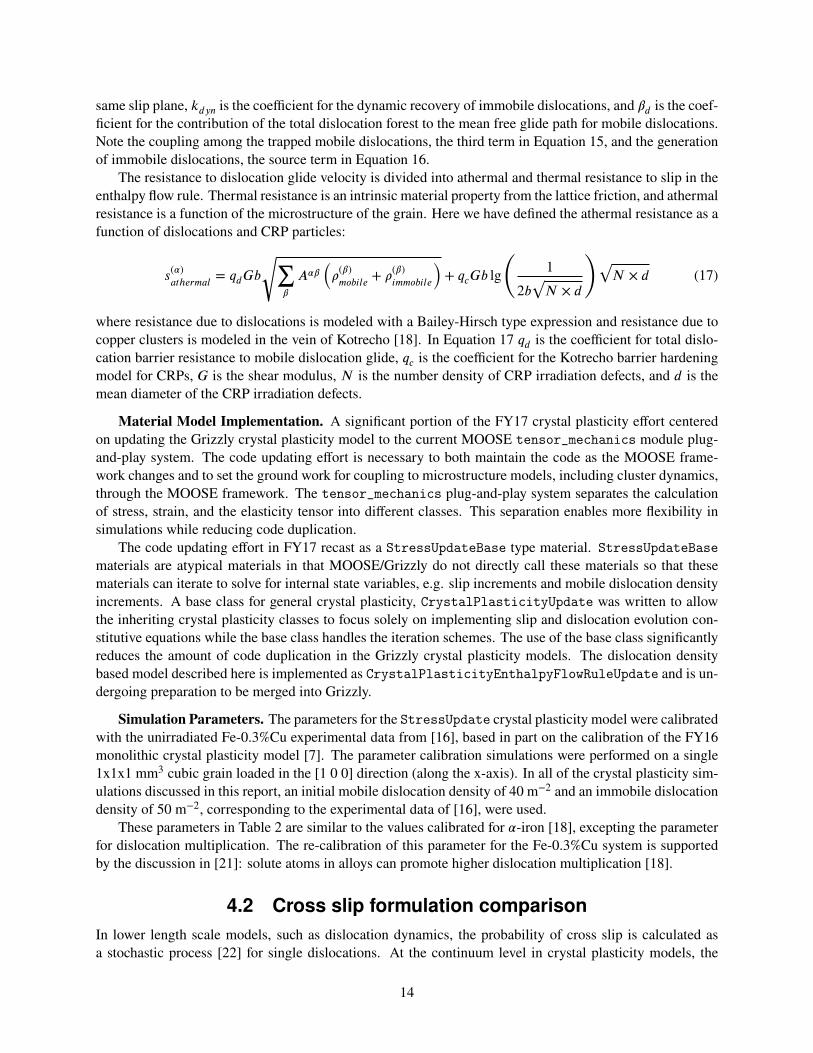
The comparison simulations of the cross slip models were performed using only 24 slip systems, a rea-sonable assumption at lower temperatures [24], to simplify the cross slip comparison figures. We ran twosets of cases to compare the cross slip models in different loading conditions: in the [1 0 0] direction (alongthe x-axis) and in the [-3 4 8] direction. The [1 0 0] loading direction actives four slip systems equally, Fig-ure 5, one in each cross slip family, while the [-3 4 8] loading direction, Figure 6, is selected to activate onlya single slip system.
-4.0e-02
-2.0e-02
0.0e+00
2.0e-02
Dislo
catio
n De
nsity
(1/m
m^2
)
(0 1 1)[1 -1 1] system(1 1 0)[1 -1 1] system(1 0 -1)[1 -1 1] system(-1 1 2)[1 -1 1] system(1 2 1)[1 -1 1] system(2 1 -1)[1 -1 1] system
(0 1 1)[1 1 -1] system(1 0 1)[1 1 -1] system(-1 1 0)[1 1 -1] system(1 1 2)[1 1 -1] system(-1 2 1)[1 1 -1] system(2 -1 1)[1 1 -1] system
0.000
0.005
0.010
0.015
0.020
Lagrangian Strain (mm/mm)
-4.0e-02
-2.0e-02
0.0e+00
2.0e-02
Dislo
catio
n De
nsity
(1/m
m^2
)
(1 0 1)[-1 1 1] system(1 1 0)[-1 1 1] system(0 -1 1)[-1 1 1] system(1 -1 2)[-1 1 1] system(1 2 -1)[-1 1 1] system(2 1 1)[-1 1 1] system
0.000
0.005
0.010
0.015
0.020
Lagrangian Strain (mm/mm)
(0 -1 1)[1 1 1] system(1 0 -1)[1 1 1] system(-1 1 0)[1 1 1] system(1 1 -2)[1 1 1] system(1 -2 1)[1 1 1] system(-2 1 1)[1 1 1] system
-3.0e-02
-2.0e-02
-1.0e-02
0.0e+00
1.0e-02
Dislo
catio
n De
nsity
(1/m
m^2
)
(0 1 1)[1 -1 1] system(1 1 0)[1 -1 1] system(1 0 -1)[1 -1 1] system(-1 1 2)[1 -1 1] system(1 2 1)[1 -1 1] system(2 1 -1)[1 -1 1] system
(0 1 1)[1 1 -1] system(1 0 1)[1 1 -1] system(-1 1 0)[1 1 -1] system(1 1 2)[1 1 -1] system(-1 2 1)[1 1 -1] system(2 -1 1)[1 1 -1] system
0.000
0.005
0.010
0.015
0.020
Lagrangian Strain (mm/mm)
-3.0e-02
-2.0e-02
-1.0e-02
0.0e+00
1.0e-02
Dislo
catio
n De
nsity
(1/m
m^2
)
(1 0 1)[-1 1 1] system(1 1 0)[-1 1 1] system(0 -1 1)[-1 1 1] system(1 -1 2)[-1 1 1] system(1 2 -1)[-1 1 1] system(2 1 1)[-1 1 1] system
0.000
0.005
0.010
0.015
0.020
Lagrangian Strain (mm/mm)
(0 -1 1)[1 1 1] system(1 0 -1)[1 1 1] system(-1 1 0)[1 1 1] system(1 1 -2)[1 1 1] system(1 -2 1)[1 1 1] system(-2 1 1)[1 1 1] system
Figure 6: Comparison of the deterministic (left figure) and the stochastic (right figure) cross slip models ina single grain loaded in the [-3 4 8] direction with cross slipped dislocation densities shown. This loadingdirection is expected to activate only a single slip system. The deterministic cross slip model (left) demon-strates limitations in this loading direction by locking the cross slip dislocation contributions to a single slipsystem while the stochastic cross slip model (right) allows the cross slip dislocation contributions to continueto evolve and therefore avoids over-hardening the crystal stress response.
The stochastic cross slip approach enables the crystal plasticity model to capture single slip system acti-vation under specific loading conditions while the deterministic approach locks the contributions of the crossslipped dislocations to specific slip systems, see Figure 6. This ability to activate a single slip system is key tothe correct fitting of material parameters within the crystal plasticity model from lower length scale models,such as dislocation dynamics, or precise experimental data when only a single slip system is activated in thetest.
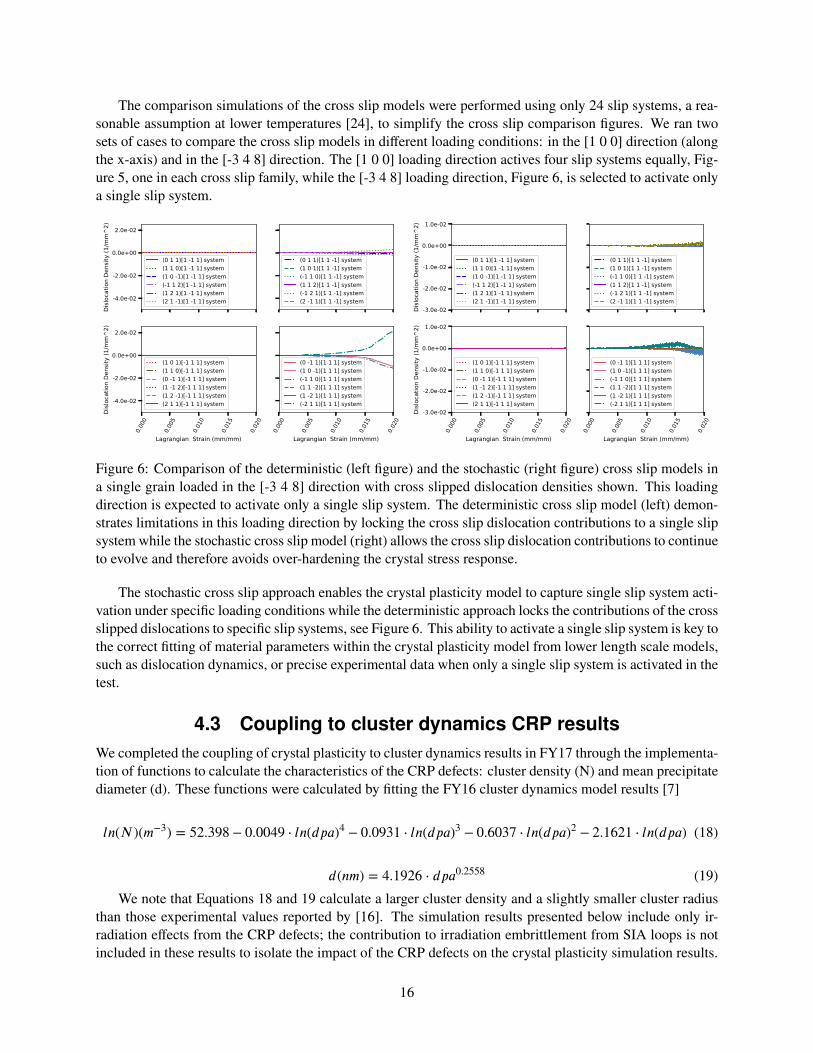
4.3 Coupling to cluster dynamics CRP resultsWe completed the coupling of crystal plasticity to cluster dynamics results in FY17 through the implementa-tion of functions to calculate the characteristics of the CRP defects: cluster density (N) and mean precipitatediameter (d). These functions were calculated by fitting the FY16 cluster dynamics model results [7]
ln(N)(m−3) = 52.398 − 0.0049 ⋅ ln(dpa)4 − 0.0931 ⋅ ln(dpa)3 − 0.6037 ⋅ ln(dpa)2 − 2.1621 ⋅ ln(dpa) (18)
d(nm) = 4.1926 ⋅ dpa0.2558 (19)We note that Equations 18 and 19 calculate a larger cluster density and a slightly smaller cluster radius
than those experimental values reported by [16]. The simulation results presented below include only ir-radiation effects from the CRP defects; the contribution to irradiation embrittlement from SIA loops is notincluded in these results to isolate the impact of the CRP defects on the crystal plasticity simulation results.
16
0.0000 0.0025 0.0050 0.0075 0.0100 0.0125 0.0150 0.0175 0.0200Effective Strain (mm/mm)
0
50
100
150
200
250
300
350
400
Effe
ctiv
e vo
n M
ises S
tress
(MPa
)
0.20 dpa0.15 dpa0.10 dpa0.05 dpaunirradiated
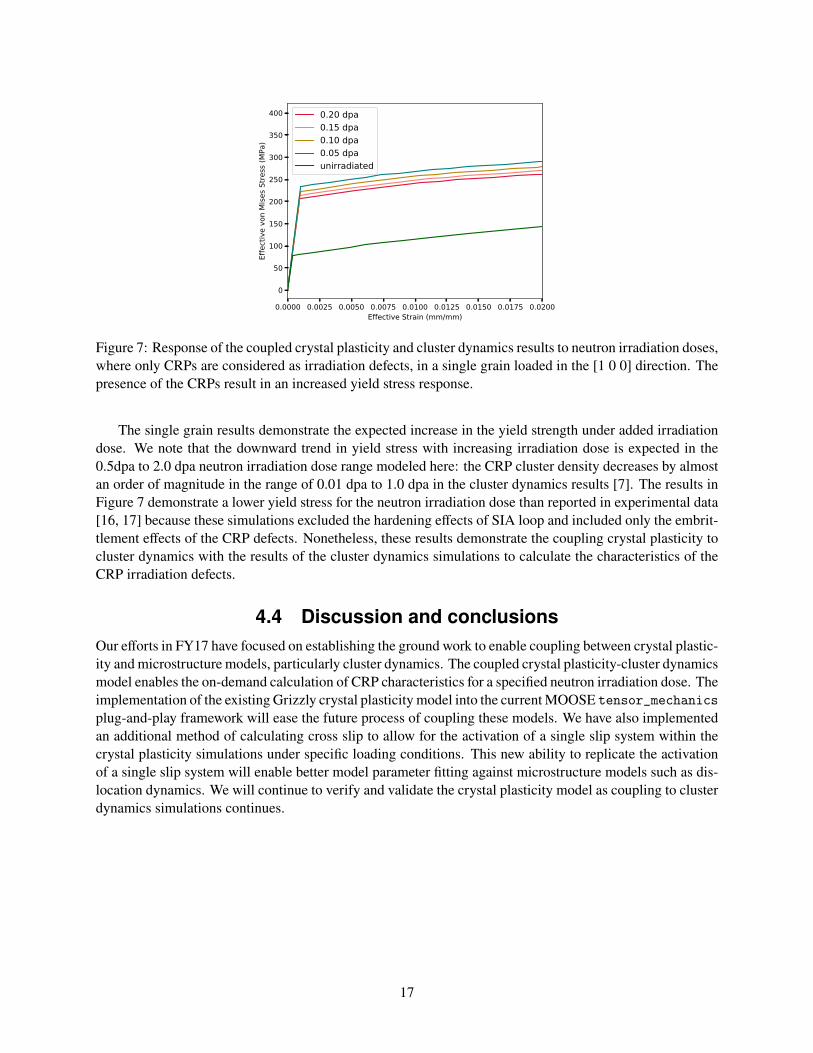
Figure 7: Response of the coupled crystal plasticity and cluster dynamics results to neutron irradiation doses,where only CRPs are considered as irradiation defects, in a single grain loaded in the [1 0 0] direction. Thepresence of the CRPs result in an increased yield stress response.
The single grain results demonstrate the expected increase in the yield strength under added irradiationdose. We note that the downward trend in yield stress with increasing irradiation dose is expected in the0.5dpa to 2.0 dpa neutron irradiation dose range modeled here: the CRP cluster density decreases by almostan order of magnitude in the range of 0.01 dpa to 1.0 dpa in the cluster dynamics results [7]. The results inFigure 7 demonstrate a lower yield stress for the neutron irradiation dose than reported in experimental data[16, 17] because these simulations excluded the hardening effects of SIA loop and included only the embrit-tlement effects of the CRP defects. Nonetheless, these results demonstrate the coupling crystal plasticity tocluster dynamics with the results of the cluster dynamics simulations to calculate the characteristics of theCRP irradiation defects.
4.4 Discussion and conclusionsOur efforts in FY17 have focused on establishing the ground work to enable coupling between crystal plastic-ity and microstructure models, particularly cluster dynamics. The coupled crystal plasticity-cluster dynamicsmodel enables the on-demand calculation of CRP characteristics for a specified neutron irradiation dose. Theimplementation of the existing Grizzly crystal plasticity model into the currentMOOSE tensor_mechanicsplug-and-play framework will ease the future process of coupling these models. We have also implementedan additional method of calculating cross slip to allow for the activation of a single slip system within thecrystal plasticity simulations under specific loading conditions. This new ability to replicate the activationof a single slip system will enable better model parameter fitting against microstructure models such as dis-location dynamics. We will continue to verify and validate the crystal plasticity model as coupling to clusterdynamics simulations continues.
17
5 Summary
In FY17, progress has been made in coupling lower-length-scale models developed to predict microstructureevolution and the resulting macroscopic property degradation in reactor pressure vessel steels. In FY17a cluster dynamics model was implemented in Grizzly for radiation damage, and an effort was couple thecluster dynamics model to lattice kinetic Monte Carlo model to capture irradiation enhanced diffusion effectsin precipitate formation. For hardening and embrittlement, effort was made to couple the dislocation-densitybased crystal plasticity model to cluster dynamics simulation results..
These accomplishments have increased the Grizzly capability for modeling microstructure evolution andproperty degradation, and also made broad impact in the research community. The research and developmentoutcome has led to the publication of one journal publication and four presentations at leading conferences,as detailed below.
Journal publications:
1. X. Bai, H. Ke, Y. Zhang, and B. W. Spencer, Modeling Copper Precipitation Hardening and Em-brittlement in A Dilute Fe-0.3at.%Cu Alloy Under Neutron Irradiation, Journal of Nuclear Materials,Accepted, 2017
Conference presentations:
1. X.M. Bai, Multiscale modeling of radiation hardening in reactor pressure vessel steels, 2017 Inter-national Conference on Plasticity, Damage, and Fracture, Puerto Vallarta, Mexico, Jan 2017, Invitedtalk.
2. X.M. Bai, H. Ke, P. Chakraborty, Y. Zhang, Cluster DynamicsModeling of Cu PrecipitationHardeningin Reactor Pressure Vessel Steels, 2017 TMS Annual Meeting, San Diego, CA, Feb-Mar 2017.
3. S.A. Pitts, W. Jiang, B.W. Spencer, H.M. Zbib, Comparison of Irradiated Steel Dislocation and DefectInteraction Models with Crystal Plasticity, Engineering Mechanics Institute Conference 2017, SanDiego CA, June 2017
4. Y. Zhang, X. Bai, M. Tonks, B. Biner, Formation of prismatic loops fromC15 phase interstitial clustersin body-centered-cubic iron, Society of Engineering Science Meeting 2017, Boston MA, July 2017
18
6 References
[1] G. Odette and G. Lucas. “Embrittlement of Nuclear Reactor Pressure Vessels”. In: Journal of Mate-rials 57 (2001), pp. 18–22.
[2] K. Farrell, T. S. Byun, andN.Hashimoto. “Deformationmodemaps for tensile deformation of neutron-irradiated structural alloys”. In: Journal of Nuclear Materials 335 (2004), p. 471.
[3] E. Meslin, M. Lambrecht, M. Hernandez-Mayoral, F. Bergner, L. Malerba, P. Pariege, B. Radiguet,A. Barbu, D. Gomez-Briceno, A. Ulbricht, and A. Almazouzi. “Characterization of neutron-irradiatedferritic model alloys and a RPV steel from combined APT, SANS, TEM and PAS analyses”. In: Jour-nal of Nuclear Materials 406 (2010), pp. 73–83.
[4] D. J. Bacon, Y. N. Osetsky, and D. Rodney. “Dislocation-Obstacle Interactions at the Atomic Level”.In: Elsevier, 2009. Chap. 88.
[5] B. Spencer, Y. Zhang, P. Chakraborty, S. B. Biner, M. Backman, B.Wirth, S. Novascone, and J. Hales.Grizzly Year-End Progress Report. Tech. rep. INL/EXT-13-30316. Idaho National Laboratory, Sept.2013.
[6] Y. Zhang, D. Schwen, H. Ke, X. Bai, and J. Hales. Mesoscale modeling of solute precipitation andradiation damage. Tech. rep. Idaho National Laboratory, Sept. 2015.
[7] Y. Zhang, P. Chakraborty, X. Bai, and D. Schwen. Lower Length Scale Model Development for Em-brittlement of Reactor Pressure Vessel Steel. Tech. rep. Idaho National Laboratory, Sept. 2016.
[8] B. Spencer, Y. Zhang, P. chakraborty, M. Backman, W. Hoffman, D. Schwen, S. B. Biner, and X. Bai.Grizzly status report. Tech. rep. Idaho National Laboratory, Sept. 2014.
[9] P. Chakraborty, S. B. Biner, Y. Zhang, and B. Spencer. Crystal Plasticity Model of Reactor PressureVessel Embrittlement in Grizzly. Tech. rep. Idaho National Laboratory, July 2015.
[10] C. English and J. Hyde. “Radiation Damage of Reactor Pressure Vessel Steels”. In: ComprehensiveNucl. Mater. 4 (2012), pp. 151–180.
[11] X. Bai, H. Ke, Y. Zhang, and B. W. Spencer. “Modeling Copper Precipitation Hardening and Embrit-tlement in A Dilute Fe-0.3at.%Cu Alloy Under Neutron Irradiation”. In: Accepted by the Journal ofNuclear Materials (2017).
[12] Y. Zhang, P. C. Millett, M. R. Tonks, X.-M. Bai, and S. B. Biner. “Preferential Cu precipitation atextended defects in bcc Fe: An atomistic study”. In: Computational Materials Science 101 (2015),pp. 181–188.
[13] F. Christien and A. Barbu. “Modelling of copper precipitation in iron during thermal aging and irra-diation”. In: Journal of Nuclear Materials 324 (2004), p. 90.
[14] SUNDIALS: SUite of Nonlinear and DIfferential/ALgebraic Equation Solvers. 2017.[15] S. I. Golubov, A. M. Ovcharenko, A. V. Barashev, and B. N. Singh. “Grouping method for the approxi-
mate solution of a kinetic equation describing the evolution of point-defect clusters”. In: PhilosophicalMagazine A 81.3 (2001), pp. 643–658.
[16] M. Lambrecht, L.Malerba, andA.Almazouzi. “Influence of different checmical elements on irradiation-induced hardening embrittlement of RPV steels”. In: Journal of NuclearMaterials 378 (2008), pp. 282–290.
[17] M. Lambrecht, E. Meslin, L. Malerba, M. Hernandez-Mayoral, F. Bergner, P. Pariege, B. Radiguet,and A. Almazouzi. “On the correlation between irradiation-induced microstructural features and thehardening of reactor pressure vessel steels”. In: Journal of Nuclear Materials 406 (2010), pp. 84–89.
19
[18] P. Chakraborty and S. B. Biner. “Crystal plasticity modeling of irradiation effects on flow stress inpure-iron and iron-copper alloys”. In: Mechanics of Materials 101 (2016), pp. 71–80.
[19] E. Orowan. “Problems of plastic gliding”. In: Proceedings of the Physical Society 52.1 (1940), p. 8.[20] A. Patra and D. L. McDowell. “Continuum modeling of localized deformation in irradiated bcc ma-
terials”. In: Journal of Nuclear Materials 432.1 (2013), pp. 414–427.[21] C. Schmidt and A. Miller. “The effect of solutes on the strength and strain hardening behavior of
alloys”. In: Acta Metallurgica 30.3 (1982), pp. 615–625.[22] H. M. Zbib, M. Rhee, and J. P. Hirth. “On plastic deformation and the dynamics of 3D dislocations”.
In: International Journal of Mechanical Sciences 40.2-3 (1998), pp. 113–127.[23] W. Püschl. “Models for dislocation cross-slip in close-packed crystal structures: a critical review”. In:
Progress in materials science 47.4 (2002), pp. 415–461.[24] D. Li, H. Zbib, X. Sun, and M. Khaleel. “Predicting plastic flow and irradiation hardening of iron
single crystal with mechanism-based continuum dislocation dynamics”. In: International Journal ofPlasticity 52 (2014), pp. 3–17.
20