modeling and experimental study of polyurethane …
TRANSCRIPT
MODELING AND EXPERIMENTAL STUDY OF
POLYURETHANE FOAMING REACTIONS
_______________________________________
A Dissertation
presented to
the Faculty of the Graduate School
at the University of Missouri-Columbia
_______________________________________________________
In Partial Fulfillment
of the Requirements for the Degree
Doctor of Philosophy
_____________________________________________________
by
Yusheng Zhao
Dr. Galen Suppes, Dissertation Supervisor
December 2015

The undersigned, appointed by the dean of the Graduate School, have examined the
dissertation entitled
MODELING AND EXPERIMENTAL STUDY OF POLYURETHANE FOAMING
REACTIONS
presented by Yusheng Zhao,
a candidate for the degree of Doctor of Philosophy,
and hereby certify that, in their opinion, it is worthy of acceptance.
Professor Galen Suppes
Professor Fu-hung Hsieh
Professor Sheila Baker
Professor John Gahl

ii
ACKNOWLEDGEMENTS
Acknowledgements, first and foremost go out to the members of my committee:
Drs. Galen Suppes, Fu-hung Hsieh, Sheila Baker and John Gahl. I would like to express
my special gratitude to my advisor, Dr. Galen Suppes for granting me the opportunity
to work on this project, and for his support, encouragement, and guidance in developing
these experiments.
This work could not have been completed without the help of my co-researchers,
and I would like to show my deepest appreciation to Rima Ghoreishi, Harith Al-
Moameri, and all the members in polyurethane foam research group for their support
and dedication.
I would like to thank the United Soybean Board for financial support of the
experimental studies used to validate the modeling work and thank FSI. Company
providing foam formulas and technology support. I also thank University of Missouri
Bioinformatics Consortium (UMBC) for providing the HPC resources to run the
computations and technical support for running jobs on the supercomputer.
I would also like to thank my parents, Gengzhen Zhao and Huifang Wu for their
unconditional love and support in my decision to pursue higher education.
Yusheng Zhao

iii
TABLE OF CONTENTS
ACKNOWLEDGEMENTS ........................................................................................... ii
LIST OF TABLES ......................................................................................................... v
LIST OF FIGURES ..................................................................................................... vii
LIST OF ABBREVIATIONS ........................................................................................ x
ABSTRACT ................................................................................................................. xii
1. INTRODUCTION .................................................................................................. 1
2. MODELING IMPACT OF CATALYST ON POLYURETHANE FOAMING
REACTIONS ................................................................................................................. 4
2.1 Introduction ..................................................................................................... 4
2.2 Mechanism of Catalysis .................................................................................. 7
2.3 Modeling ......................................................................................................... 8
2.4 Materials and Methods .................................................................................. 12
2.4.1 Materials ................................................................................................ 12
2.4.2 Experimental Design .............................................................................. 15
2.4.3 Gel/Foam Preparation and Data Collection ........................................... 15
2.5 Results and Discussion .................................................................................. 16
2.5.1 Amine Based Catalyst ............................................................................ 16
2.5.2 Tin Based Catalyst ................................................................................. 19
2.6 Conclusion ..................................................................................................... 23
3. SIMULATION OF ISOCYANATE CONCENTRATION PROFILES AND
EMISSION IN POLYURETHANE FOAMING REACTION .................................... 26
3.1 Introduction ................................................................................................... 26
3.2 Modeling ....................................................................................................... 33
3.3 Materials and Methods .................................................................................. 34
3.3.1 Materials ................................................................................................ 34
3.3.2 Experimental Design .............................................................................. 34
3.3.3 Standard Test Method for Isocyanate Groups in Urethane Materials or
Prepolymers .......................................................................................................... 35

iv
3.4 Results and Discussion .................................................................................. 37
3.4.1 Isocyanate-urethane Reaction ................................................................ 37
3.4.2 Isocyanate-epoxy Reaction .................................................................... 44
3.4.3 Isocyanate Emission............................................................................... 46
3.5 Conclusion ..................................................................................................... 51
4. MODELING IMPACT OF SURFACTANTS ON POLYURETHANE FOAM
POLYMERIZATION ................................................................................................... 53
4.1 Introduction ................................................................................................... 53
4.2 Methodology ................................................................................................. 58
4.3 Modeling ....................................................................................................... 60
4.3.1 Bubble Growth ....................................................................................... 61
4.3.2 Film Thinning ........................................................................................ 63
4.3.3 Bubble Rising......................................................................................... 66
4.4 Results and Discussion .................................................................................. 67
4.4.1 Experimental Data ................................................................................. 67
4.4.2 Preliminary Modeling Results ............................................................... 70
4.5 Conclusion ..................................................................................................... 75
5. COMPUTATIONAL STUDY ON REACTION ENTHALPIES OF URETHANE-
FORMING REACTIONS ............................................................................................ 78
5.1 Introduction ................................................................................................... 78
5.2 Methodology ................................................................................................. 84
5.3 Results and Discussion .................................................................................. 87
5.3.1 Location and Molecular Size of Isocyanate Groups .............................. 87
5.3.2 Location of Hydroxyl Groups ................................................................ 90
5.3.3 Chain Length of Hydroxyl Groups ........................................................ 92
5.3.4 Solvent Effects ....................................................................................... 94
5.3.5 Comparison to Different Models ........................................................... 95
5.3.6 Verification by Other Calculation Methods ........................................... 99
5.4 Conclusion ................................................................................................... 100
BIBLIOGRAPHY ...................................................................................................... 102
VITA .......................................................................................................................... 106

v
LIST OF TABLES
Table 2-1 Heuristics used to limit kinetic parameters degrees of freedom to a
manageable level .......................................................................................................... 11
Table 2-2 Material properties ....................................................................................... 13
Table 2-3 Amine/Tin based catalysts and their properties ........................................... 13
Table 2-4 Effective catalyst amount respect to different initial catalyst loadings due to
catalyst poisoning......................................................................................................... 20
Table 2-5 Catalyst poisoning equilibrium constants and kinetic parameters respect to
different tin based catalysts .......................................................................................... 22
Table 3-1 Summary of impact of potential reaction products ...................................... 32
Table 3-2 Recipe used for isocyanate profiling studies (poly G76-635) ..................... 37
Table 3-3 Recipes of gel reaction for evaluating iso-urethane and iso-epoxy kinetics
parameters .................................................................................................................... 38
Table 3-4 Kinetic parameters of isocyanate-urethane reaction .................................... 43
Table 3-5 Kinetic parameters of isocyanate-epoxy reaction ........................................ 46
Table 3-6 Vapor pressure of pure isocyanates .............................................................. 47
Table 3-7 Antoine Equation Constants of isocyanates ................................................. 47
Table 4-1 Foaming formulation of rigid polyurethane foam ....................................... 59
Table 4-2 Distribution of actual film thickness ............................................................ 64
Table 4-3 Modes of foam failure and current status of studies .................................... 74
Table 5-1 Heuristics for initial efforts in simulating urethane-foaming reactions ....... 78
Table 5-2 Calculated Total Corrected (Hartree) and Zero-Point Vibrational (ZPE,
kJ/mol) Energies for studies on isocyanate locations and molecular sizes .................. 88
Table 5-3 Calculated Relative Enthalpies (kJ/mol) of isocyanate-alcohol reactions, All
Corrected by ZPE. Using the reference states of zero enthalpy for the reagents, the non-
zero values as reported are heats of reaction. .............................................................. 90
vi
Table 5-4 Calculated Total Corrected (Hartree), Zero-Point Vibrational (ZPE, kJ/mol)
Energies and Relative Enthalpies (kJ/mol) for study on impact of hydroxyl locations
...................................................................................................................................... 90
Table 5-5 Calculated Total Corrected (Hartree), Zero-Point Vibrational (ZPE, kJ/mol)
Energies and Relative Enthalpies (kJ/mol) for study on impact of hydroxyl group chain
length............................................................................................................................ 92
Table 5-6 Calculated Total Corrected (Hartree), Zero-Point Vibrational (ZPE, kJ/mol)
Energies and Relative Enthalpies (kJ/mol) for study on impact of solvent effects ..... 94
Table 5-7 Comparison between molecular modeling results and experimental values
reported in literature for reactions of 4,4-MDI with alcohol to form urethane............ 95
Table 5-8 Enthalpy calculation of isocyanate-amine reaction ..................................... 96
Table 5-9 Recommended values for heat of reaction (kJ/mol) .................................... 96
Table 5-10 Calculated Total Corrected (Hartree), Zero-Point Vibrational (ZPE, kJ/mol)
Energies and Relative Enthalpies (kJ/mol) for 2,4-TDI and 1-Butanol reaction ......... 99
vii
LIST OF FIGURES
Figure 2-1 Mechanisms of amine based catalysts and metal based catalysts in PU
foaming reaction ............................................................................................................ 8
Figure 2-2 Algorithm for addition of catalysis to simulation ........................................ 9
Figure 2-3 Algorithm for fitting of kinetic parameters ................................................ 11
Figure 2-4 Example catalysts structures ...................................................................... 14
Figure 2-5 Temperature profile of V360 gel reaction and modeling results of
temperature and reaction rate ....................................................................................... 17
Figure 2-6 Modeling of temperature profiles under different catalyst loadings .......... 18
Figure 2-7 Relationship between reaction rate constants and catalyst loadings of amine
based catalyst ............................................................................................................... 18
Figure 2-8 Temperature profile of V360 gel reaction and modeling results under tin
catalyzed condition (Fomrez®UL-22) ......................................................................... 19
Figure 2-9 Relationship between reaction rate constants and catalyst loadings of tin
based catalyst (Fomrez®UL-22) .................................................................................. 21
Figure 2-10 Modeling results of V360 gel reaction with different tin based catalysts 22
Figure 3-1 Isocyanate concentration profile for reaction of poly G76-635 with PMDI
during gel reaction process .......................................................................................... 38
Figure 3-2 Long-term isocyanate concentration profile for reaction of 1-pentanol with
PMDI during gel reaction process ............................................................................... 39
Figure 3-3 Short-term isocyanate concentration profile for reaction of 1-pentanol with
PMDI during gel reaction process ............................................................................... 41
Figure 3-4 Extended time isocyanate reaction profile with fitted model for reaction of
1-pentanol with PMDI at 80°C with different catalysts............................................... 42
Figure 3-5 Extended time isocyanate reaction profile with fitted model for reaction of
1-pentanol with PMDI at 110°C with different catalysts. ............................................ 42
Figure 3-6 Isocyanate reaction profile with fitted model for reaction of poly G76-635
with PMDI at three isocyanate indices. ....................................................................... 44

viii
Figure 3-7 Isocyanate concentration profiles with fitted models for reaction of 1-petanol
and Epoxy oil with PMDI at an index of 2.0 under different temperatures. ................ 45
Figure 3-8 Partial vapor pressure of isocyanate and temperature profiles over time
during a control foaming reaction using MDI. The blue line is calculated based on
Antoine Equation and the red line is based on Clausius-Clapeyron Equation. ........... 49
Figure 3-9 Comparison of partial vapor pressure between MDI, TDI and HDI over
OSHA limit. The left graph is based on Antoine Equation and the right graph is based
on Clausius-Clapeyron Equation. ................................................................................ 49
Figure 3-10 Partial vapor pressure of isocyanate for foams with different isocyanate
indices .......................................................................................................................... 50
Figure 4-1 Macroscopic view of different stages during foaming of flexible foams .. 54
Figure 4-2 Structure of a typical silicone surfactant used in polyurethane foaming
systems ......................................................................................................................... 54
Figure 4-3 Schematic representation of typical surface tension isotherm of
water/surfactant solution .............................................................................................. 56
Figure 4-4 Four roles of surfactant in urethane foaming process ................................ 60
Figure 4-5 Algorithm for calculating bubble radius during foaming process .............. 63
Figure 4-6 Algorithm for calculating film thickness and closed cell content .............. 65
Figure 4-7 Surface tension versus ln(Csurf) in different solutions .............................. 67
Figure 4-8 Temperature profiles of foams with different concentration loadings ....... 68
Figure 4-9 Longitudinal sections of foams with different surfactant loadings ............ 68
Figure 4-10 Microscope observations of foams with different surfactant loadings .... 69
Figure 4-11 Microscope observations of foams with different mixing time ............... 70
Figure 4-12 Simulation results from MATLAB program ............................................ 71
Figure 4-13 Comparison of experimental and modeling bubble radius as mixing time
increasing ..................................................................................................................... 72
Figure 4-14 Comparison of experimental and modeling bubble radius as surfactant
amount increasing ........................................................................................................ 72
ix
Figure 4-15 Impact of blowing agent loading on single bubble rising velocity .......... 73
Figure 5-1 Plot of esterification rate constant, kA vs. average chain length, N for
CH3CH2OH + H(CH2)NCOOH ................................................................................. 82
Figure 5-2 Proposed reaction mechanisms for the alcoholysis reaction of isocyanate. (a)
Concerted mechanism, (b) Stepwise mechanism......................................................... 83
Figure 5-3 Graphical depictions of molecular models and energy profile .................. 86
Figure 5-4 Example isocyanate structures ................................................................... 87
Figure 5-5 Relationship between heat of reaction and the size of the molecule attached
to the hydroxyl ............................................................................................................. 94
Figure 5-6 Comparison between experimental data and different modeling results of
primary, secondary, single polyol and mixture polyols gel reaction ............................ 98
Figure 5-7 Comparison between experimental data and modeling results of isocyanate-
DEG reaction in presence of 0%, 10%, 20% and 30% acetophenone (from left to right
respectively) ................................................................................................................. 98
x
LIST OF ABBREVIATIONS
c Concentration
r Reaction Rate
k Reaction Rate Constant
k0 Reaction Rate Constant under the Reference Condition
A Pre-exponential Factor
Ea Activation Energy
R Ideal Gas Constant
T Temperature
cat Catalyst
Pcat Product of Tin Catalyst and Polymer
cat5 Pentamethyldiethylenetriamine (PMDETA)
cat8 Dimethylcyclohexylamine (DMCHA)
K Equilibrium Constant
H Heat of Reaction
MF Methyl Formate
OF Objective Function
MDI Methylene Diphenyl Diisocyanate
TDI Toluene Diisocyanates
HDI Hexamethylene-1,6-diisocyanate
PMDI Polymeric MDI
NMR Nuclear Magnetic Resonance
P Vapor Pressure
∆𝐻𝑣𝑎𝑝 Enthalpy of Vaporization
𝑃𝑖 Partial Vapor Pressure of Component i
𝑥𝑖 Mole Fraction of Component i
OSHA Occupational Safety and Health Administration
ppm Parts-per-million
PMDS Polydimethylsiloxane
PEO-PPO Polyethylene Oxide-co-Propylene Oxide
C Concentration of Surfactant
𝜎 Surface Tension
cmc Critical Micelle Concentration
r Bubble Radius
θ Contact Angle
F Force
𝜌 Density
g Standard Gravity
h (Eq. 4-2) Rising Height of Liquid
O.D. Outside Diameter
I.D. Inside Diameter
L Length

xi
MW Molecular Weight
Fn Functionality
W Energy Introduced by Mixing
Nc Number of Nucleation Sites
𝑝𝑏 Pressure in the Bubble
𝑝𝑎 Pressure of the Liquid at the Bubble Surface
𝜏𝑟𝑟 Radius Component of Viscous Stress Tensor in Liquid
𝑝∞ Ambient Pressure
𝜇 Newtonian Viscosity
ℎ (Eq. 4-8) Film Thickness
t Time
�̇� Angstrom
𝑉𝑅𝑒 Velocity of Film Thinning
𝑉𝑡 Overall Velocity of Film Thinning
𝜆 Characteristic Length of the Thickness Non-homogeneities
𝜖𝑡 Total Amplitude of the Thickness Non-homogeneities
Di Probability Values
V Volume
ℎ0 Initial Film Thickness
ave Average
ℎ𝑐 Critical Film Thickness
ccc Closed Cell Content
𝑉𝑟 Bubble Rising Velocity
𝑑 Bubble Diameter
Xp Ratio of Primary Alcohol
Xs Ratio of Secondary Alcohol
XHS Ration of Hindered-secondary Alcohol
DFT Density Functional Theory
PCM Polarizable Continuum Model
IEF-PCM Integral-Equation-Formalism Polarizable Continuum Model
TS Transition State
𝐻𝑡𝑜𝑡𝑎𝑙 Total Enthalpy
𝜀𝑍𝑃𝐸 Zero Point Vibrational Energy
∆𝑟𝐻0 Reaction Enthalpy
DEG Diethylene Glycol
UMBC University of Missouri Bioinformatics Consortium

xii
ABSTRACT
Polyurethanes are very important polymers and are used in a wide range of
applications. A theoretical model was developed to simulate polyurethane foaming
reactions. In the model, multiple ordinary differential equations were solved by
MATLAB program and the model was able to predict temperature, foam height and
concentration profiles. This model can provide a better understanding of fundamental
polyurethane chemistry and the foaming process.
Further modeling and experimental studies were performed to improve accuracy
and to expand capability of the simulation program. Impact of side reactions, impact of
catalyst and surfactant concentrations and impact of catalysis poisoning were taken into
consideration and included in the model. The revised model was able to predict bubble
radius, inside bubble pressure, vapor pressure of pure isocyanate as well as more
reasonable temperatures, foam height, and concentration profiles. Reaction kinetics and
thermodynamics parameters used in the simulation program were verified by
experimental and/or computational methods respectively.
The use of simulation offers a way to control the complexity and transform
materials design, just as process simulators have transformed engineering design. This
perspective presents a case that simulation is ready to change the way we research,
develop, and design polyurethane formulations.
1
1. INTRODUCTION
Chapters 2-5 of this dissertation are presented as independent works related to
simulation of polyurethane foaming reactions. These works are extensions of previous
studies on modeling reaction kinetics of polyurethane foaming process. This
dissertation work turned into four published papers and one paper under review.
A MATLAB program was developed to simulate reaction rates, component
concentrations and the temperature profiles for polyurethane foaming reactions. The
program was able to predict performance of a recipe which contains one isocyanate and
up to three polyols. In Chapter 2, the program was revised to include the impact of
catalyst types and amount of catalyst loadings. Tin based catalysts and amine based
catalysts were applied into gel and foam recipes separately to evaluate the impact of
each catalyst on both gel and blow reactions. The revised model successfully predicts
performances of diverse foam recipes and can be effective for “sensitivity studies”
useful in designing form formulations. The simulations have been validated for
estimating catalyst loadings, identifying the tradeoff between higher catalyst loadings
versus preheating of reagents, and providing insight into fundamental
mechanisms/reactions.
In Chapter 3, the program was revised to include more side reactions of isocyanate
and the ASTM titration was applied to track isocyanate concentration during reactions.
The isocyanate concentration profiles were consistent with previously published
kinetics parameters for reactions of isocyanates with alcohols as well as reactions with
urethane moieties. This work is on the use of modeling of concentration profiles in rigid

2
foams to quantify the concentration of isocyanate moieties in rigid foams from the onset
of reaction until several days after the setting of the foam. The data indicate how the
isocyanate index and epoxy co-reagents can be used to reduce isocyanate emissions.
Partial pressures of isocyanate monomers are calculated based on temperature and
isocyanate concentration profiles, these data can be used to understand and reduce
emissions in work zones.
Surfactants play an important role in forming, stabilizing, and setting urethane
foams, thus developing a simulation with the impact of surfactants can help better
predict performances of foam formulations. Chapter 4 evaluated the relationship
between surface tension and surfactant amount experimentally by using the capillary
rise method and developed a model to simulate the impact of surfactants on
polyurethane foam polymerization based on the mechanism that surfactants have a
critical role in the initial stages of gel formation and through the point where viscosity
is high enough to create resistance to support the foams. Bubble sizes were calculated
based on the number of nucleation sites, gas generation rate, surface tension and bubble
inner pressure. Since important properties of polyurethane foam, such as compressive
strength, closed cell content, and thermal conductivity can be related to the bubble sizes,
this model can be used to predict foam performance and to develop new foam
formulations.
In Chapter 5, computational calculations were performed on urethane-forming
reactions using Gaussian 09 software (ie molecular modeling) toward the goal of
providing thermodynamic parameters. Total electronic and thermal enthalpies and zero-

3
point vibrational energies of reactants and products were computed by the software and
then reaction enthalpies were calculated based on these results. The location of
functional groups has the most significant impact on reaction enthalpies while
molecular size, chain length and solvent effect have relatively less impact on reaction
enthalpies. By comparison to new experimental studies and values reported in the
literature, better-informed recommendations on which values of reaction enthalpies to
use for urethane foam process simulation were provided. The utility of computational
chemistry results succeeded in being an enabling technology to improve foam process
simulation. In turn, simulation of urethane-forming reactions is useful to bridge the gap
between fundamental computational chemistry calculations and practical applications.
This series of work provides a reliable simulation program to track important
profiles (temperature and concentration) during reactions and to predict final product
properties (density, bubble radius and isocyanate vapor pressure) of foams with various
recipes. This simulation program also provides a detail insight into fundamental
polyurethane chemistry and can be used as a tool to develop new formulations.

4
2. MODELING IMPACT OF CATALYST ON
POLYURETHANE FOAMING REACTIONS
2.1 Introduction
Polyurethane (PU) is a polymer composed of a chain of organic units joined by
carbamate (urethane) links and are formed by reaction an isocyanate with a polyol. Both
the isocyanates and polyols used to make polyurethanes contain on average two or more
functional groups per molecule. The products are thermoset foams or elastomers that
are often directly formed into final devices. The nature of this application is that
hundreds of different manufacturers have unique foam recipes. The reaction
engineering demands for this application tend to be much greater than needed to design
the large-scale thermoplastic polymerization reactors.
Current practices in this market are for foam recipes to be developed by chemists
with years of experience. The goal of this work is to change the paradigm of this
industry to a paradigm where software is used to simulate the urethane-forming
reactions, including foaming processes.
The chemistry of isocyanate is complex since it entails a variety of reactions such
as with alcohols or amines, in addition to self-additions and trans-condensations. There
are essentially hundreds of possible different reaction rate constants[1, 2] for the
reaction of the same moieties as attached to molecules of ever-increasing molecular
weight, in an environment of increasing viscosity, and in an environment of slightly
changing molecular as chemical moieties react and convert.
Catalysts have a most important role in making urethane foams[3-5]. Two kinds of

5
catalysts are widely used in polyurethane foam industry: one is amine based catalyst
and the other is metal based catalyst. Tin catalysts were introduced as a metal based
catalyst to compare with traditional amine based catalysts. Inorganic and organo-tin
compounds have found industrial use as catalysts in a very wide range of applications,
from heterogeneous oxidation catalysts based on tin(IV) oxide (as employed, for
example, in commercial gas sensor devices) to homogeneous catalysts for industrial
organic and polymeric reactions.
Manufacture of polyurethane (PU) foam is by far the most important catalytic use
in terms of tin tonnage. Tin(II) 2-ethylhexanoate (also commonly referred to as
'stannous octoate') is an important tin chemical used in PU production, although several
organotin compounds, including dibutyltin diacetate and dibutyltin dilaurate, have also
been evaluated over the years.
Although traditionally mainly used in flexible foam production, recent demand for
rigid insulation foams in 'green' buildings has greatly increased urethane usage in this
sector. It is believed that this application will be one of the high growth areas for tin
catalysts.
The impact of catalysts on polyurethane foaming reaction has been of great interest.
Research results[6-12] show that the match between the gelatinizing rate and the
foaming rate could be adjusted by specifying catalyst and changing catalyst amounts,
thus the structure and properties of the polyurethane foam could be controlled. With a
good selection of the catalyst, the desired profile in reaction, foaming, flow-ability, and
foaming properties can be obtained. Depending on concentration of catalysts in

6
foaming recipe, the activity will be different. This activity relates to the catalysis of the
gel and blow reaction, which has a great impact on the properties and functions of the
foam[13-16].
Chang[1] and Baker[17] measured rate constants for a model isocyanate-alcohol
reaction catalyzed by tertiary amines and provided relative rate constants respect to
different catalyzed conditions. Their relative reactivity data depending on catalyst
concentration indicates that the reaction rate is in direct proportion to the amount of
catalyst used. Empirically it seems that the addition of catalyst reduces activation
energy, however based on the results of Van Maris et al[10], some special amine
catalysts (such as Cyclic amines, F22 and Dibutyltindilaurate) may have a higher
activation energy than the homogeneous reaction.
The state of the art in developing new foam formulations is based on the
modification of established foam formulations by chemists who apply expertise in a
qualitative sense. It would be highly desirable to elevate this process to a science
including the simulation of the chemical reactions, physical processes, and ultimate the
foam’s physical properties. The demands for this application go beyond what has been
previously achieved in this area; the application demands full consistency of
performance of catalysts and monomers in diverse formulations. The primary method
to obtain consistency is identifying the proper and complete (from impact perspective)
set of fundamental reactions and mechanisms.
Zhao et al[18, 19] have initiated the first of several phases of modeling that includes
the capability of using polyol mixtures, impact of common side reactions, impact of

7
catalyst loading and the methodology of using primary, secondary, hinder-secondary
hydroxyl contents to characterize polyols. The introduction of metal-based catalysts is
necessary to enrich the choices in foam recipe designing. Different types and amounts
of tin based catalysts were used in this study to evaluate the catalysis effect of them and
were compared with traditional amine based catalysts. Because of their different
structures and different activation mechanisms, tin based catalysts behave different
from amine based catalysts. The goal is to have a better understanding on the difference
between amine based catalysts and tin based catalysts. The goal is to use these two
kinds of catalysts appropriately based on requirements on foam properties and to
improve the versatility of simulation for predicting temperature profile, component
concentration profiles and reaction rate profiles during urethane foam-forming
processes.
2.2 Mechanism of Catalysis
Figure 2-1 presents different mechanisms of amine based catalysts and metal based
catalysts in polyurethane foaming reactions[9].

8
Figure 2-1 Mechanisms of amine based catalysts and metal based catalysts in PU foaming reaction
In general, the tertiary amine coordinate to the positive electron charged carbon of
the NCO group or hydrogen of the OH group and forms a transition state to activate
urethane formation reaction. It is claimed that a tertiary amine can be tuned by
maximizing its ability to form a hydrogen bond with alcohol, thereby activating the O–
H bond so it can attach to the isocyanate more easily.
On the other hand, a metal-based catalyst, which acts as a Lewis acid, primarily
coordinates to the oxygen atom of the NCO group and activates the electrophilic nature
of the carbon.
2.3 Modeling
Zhao et al[18, 19] have initiated the first of several phases of modeling that will be
necessary to this work. Zhao et al’s modeling work have included simulation of up to
three polyols, a methyl formate physical blowing agent, water reaction blowing agent,
and impact of catalyst loading. This work extends those initial studies to include
modeling of homogeneous catalysts for foam forming reaction.
Figure 2-2 presents the MATLAB algorithm to simulate temperature and
concentration profiles. FoamSim is the script file that first calls upon the function
Recipe that contains the formulation. The Database function sets the kinetic and
thermodynamic parameters. MATLAB’s ODE45 function is then used to solve the
ordinary differential equations set up in the ReacSim function. This code includes use
of water reactions to form foams; the approach for using physical blowing agents is
outside the scope of this paper.

9
Figure 2-2 Algorithm for addition of catalysis to simulation
A key difference between modeling reactions of polymer-forming monomers and
simple molecules is that for monomers the kinetics is based around the concentrations
of the reactive moieties (e.g. ciso, cOH) rather than molecules. The initial gel reaction
rate and blow reaction rate equations used in the modeling are expressed as:
r𝑔𝑒𝑙 = (k + k𝑐𝑎𝑡8 ∗ c𝑐𝑎𝑡8 + k𝑐𝑎𝑡5 ∗ c𝑐𝑎𝑡5) ∗ c𝑖𝑠𝑜 ∗ c𝑂𝐻 Equation 2-1
r𝑏𝑙𝑜𝑤 = (k′ + k′𝑐𝑎𝑡8 ∗ c𝑐𝑎𝑡8 + k′𝑐𝑎𝑡5 ∗ c𝑐𝑎𝑡5) ∗ c𝑖𝑠𝑜 ∗ c𝑤𝑎𝑡𝑒𝑟 Equation 2-2
𝑘 = 𝐴 ∗ 𝑒−𝐸𝑎/(𝑅𝑇) Equation 2-3
where k and k′ respectively represent the gel reaction rate and blow reaction rate
under uncatalyzed conditions, k𝑐𝑎𝑡 A is the gel reaction rate in presence of catalyst A,
10
k𝑐𝑎𝑡 B is the gel reaction rate in presence of catalyst B, k′𝑐𝑎𝑡 A is the blow reaction
rate under the effect of catalyst A and k′𝑐𝑎𝑡 B is the blow reaction rate under the effect
of catalyst B. Arrhenius Equation (Equation 2-3) was used to include the impact of
reaction temperature on reaction rates. The goal is to accurately simulate temperature
profiles under multiple catalyst loading conditions.
Preliminary experimental data identified that the reaction rate is not in direct
proportion to the amount of tin based catalyst. The hypothesis is that catalyst poisoning
happens between tin based catalyst and another compound in the system that bonds
chemically to its active surface sites. This leads to a decreasing in the total number of
catalytic sites and the poisoned sites can no longer accelerate the reaction with which
the catalyst was supposed to catalyze. The poisoning reaction was viewed like any other
chemical reaction in this process:
Cat + P ↔ Pcat Equation 2-4
Catalyst + Poison ↔ Composite Compound
Based on this reverse reaction an equilibrium equation can be listed as:
𝐾 =𝑘𝑝
𝑘𝑝𝑟=
𝑃𝑐𝑎𝑡
𝐶𝑎𝑡∗𝑃=
𝑥
(𝐶𝑎𝑡0−𝑥)∗(𝑃0−𝑥) Equation 2-5
where K is the equilibrium constant, Cat is the amount of tin based catalyst, P is the
amount of polymer which can react with tin, and Pcat is the amount of the product of
tin and polymer. By solving the value of “x” in Equation 2-5, the effective amount of
catalyst (Cat0 − x) can be calculated.
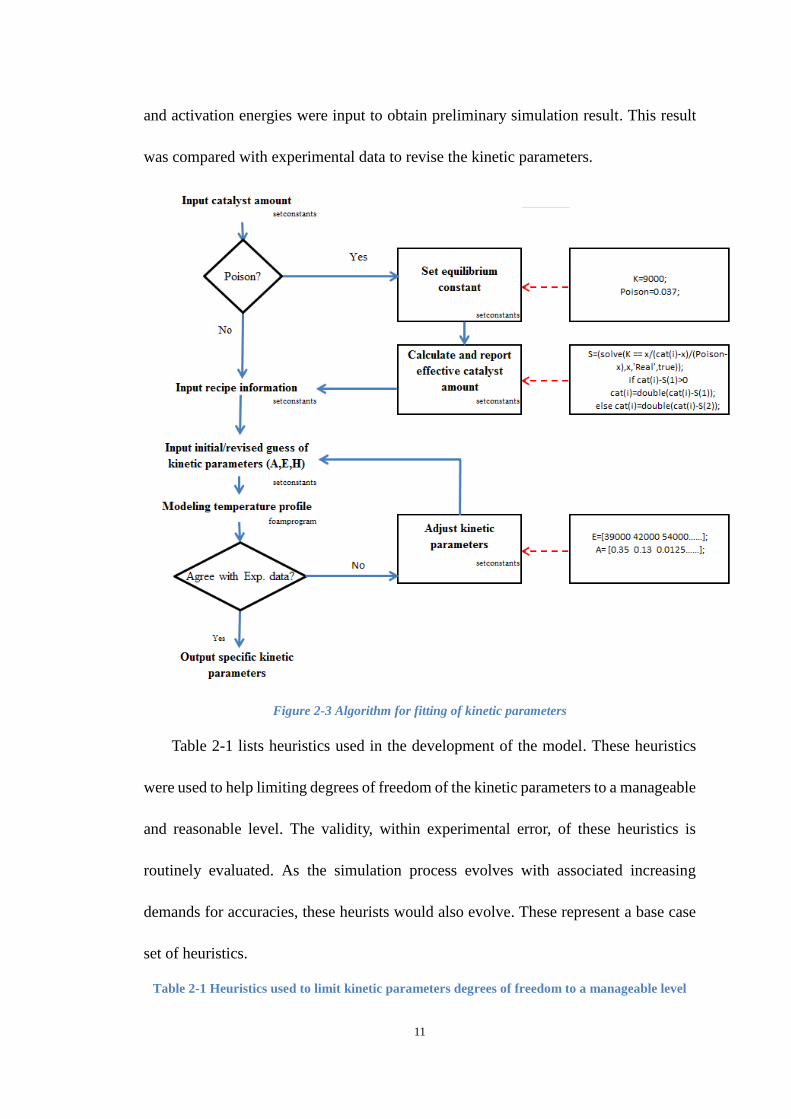
In addition to using the MATLAB program to simulate urethane-forming reactions,
the same code must be used to identify the best-fit kinetic parameters. Figure 2-3 shows
the algorithm for fitting of kinetic parameters. Initial guess of reaction rate constants
11
and activation energies were input to obtain preliminary simulation result. This result
was compared with experimental data to revise the kinetic parameters.
Figure 2-3 Algorithm for fitting of kinetic parameters
Table 2-1 lists heuristics used in the development of the model. These heuristics
were used to help limiting degrees of freedom of the kinetic parameters to a manageable
and reasonable level. The validity, within experimental error, of these heuristics is
routinely evaluated. As the simulation process evolves with associated increasing
demands for accuracies, these heurists would also evolve. These represent a base case
set of heuristics.
Table 2-1 Heuristics used to limit kinetic parameters degrees of freedom to a manageable level

12
Polyols:
Polyols consist of different ratios of primary, secondary and hinded-
secondary hydroxyl
Same type of hydroxyl in different polyols have the same reaction rate
constants (k0)
Catalytic reaction rate constants (k0) are unique to the catalyst
Catalysts:
Catalysts will not react with any components in the system
The structure and reactivity of catalysts will not change during the reaction
process
Catalysts will reduce activation energy (ΔE) relative to non-catalytic reaction
Catalysts have no impact on heat of reaction (ΔH)
There is no interaction between the catalysis impact from two or more
catalysts
Others:
Other additives (surfactant and fire retardant) have no catalysis impact on
reactions
Foam has a lower heat transfer coefficient than gel
2.4 Materials and Methods
2.4.1 Materials
RUBINATE M (Standard Polymeric MDI) was the isocyanate used in this study
and the petroleum-based polyols were Poly G76-635, Voranol 360 and Jeffol R315x
13
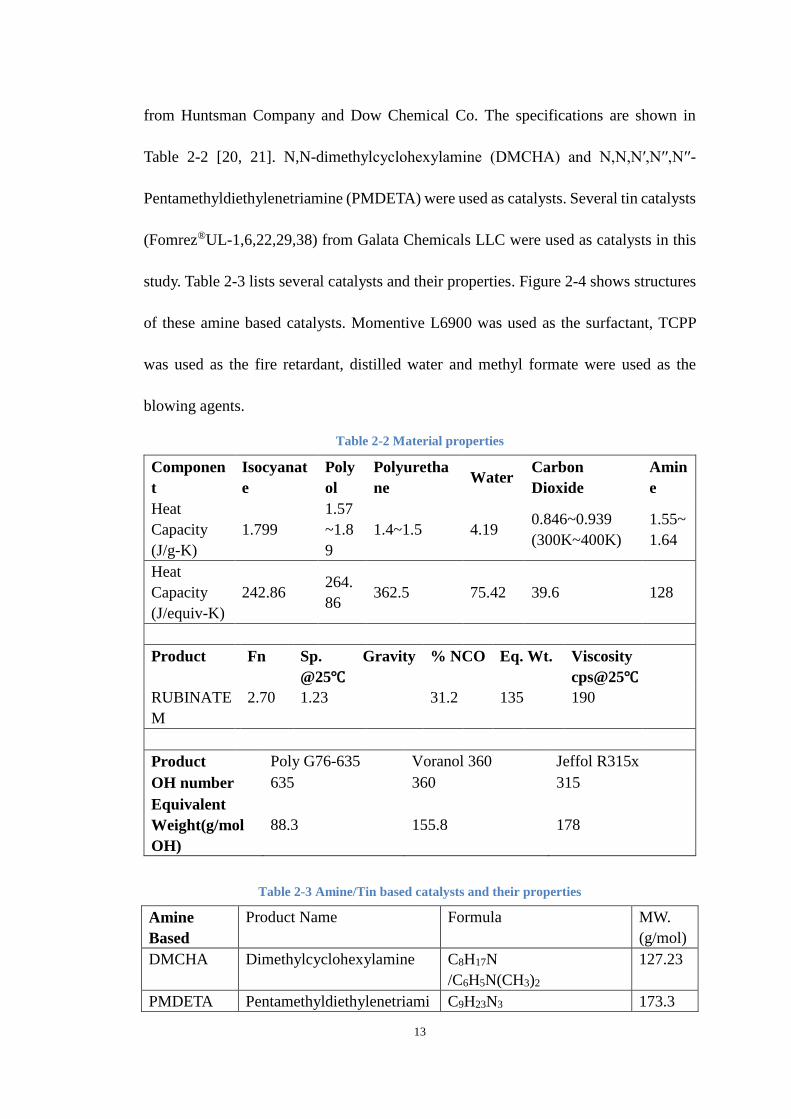
from Huntsman Company and Dow Chemical Co. The specifications are shown in
Table 2-2 [20, 21]. N,N-dimethylcyclohexylamine (DMCHA) and N,N,N′,N′′,N′′-
Pentamethyldiethylenetriamine (PMDETA) were used as catalysts. Several tin catalysts
(Fomrez®UL-1,6,22,29,38) from Galata Chemicals LLC were used as catalysts in this
study. Table 2-3 lists several catalysts and their properties. Figure 2-4 shows structures
of these amine based catalysts. Momentive L6900 was used as the surfactant, TCPP
was used as the fire retardant, distilled water and methyl formate were used as the
blowing agents.
Table 2-2 Material properties
Componen
t
Isocyanat
e
Poly
ol
Polyuretha
ne Water
Carbon
Dioxide
Amin
e
Heat
Capacity
(J/g-K)
1.799
1.57
~1.8
9
1.4~1.5 4.19 0.846~0.939
(300K~400K)
1.55~
1.64
Heat
Capacity
(J/equiv-K)
242.86 264.
86 362.5 75.42 39.6 128
Product Fn Sp. Gravity
@25℃
% NCO Eq. Wt. Viscosity
cps@25℃
RUBINATE
M
2.70 1.23 31.2 135 190
Product Poly G76-635 Voranol 360 Jeffol R315x
OH number 635 360 315
Equivalent
Weight(g/mol
OH)
88.3 155.8 178
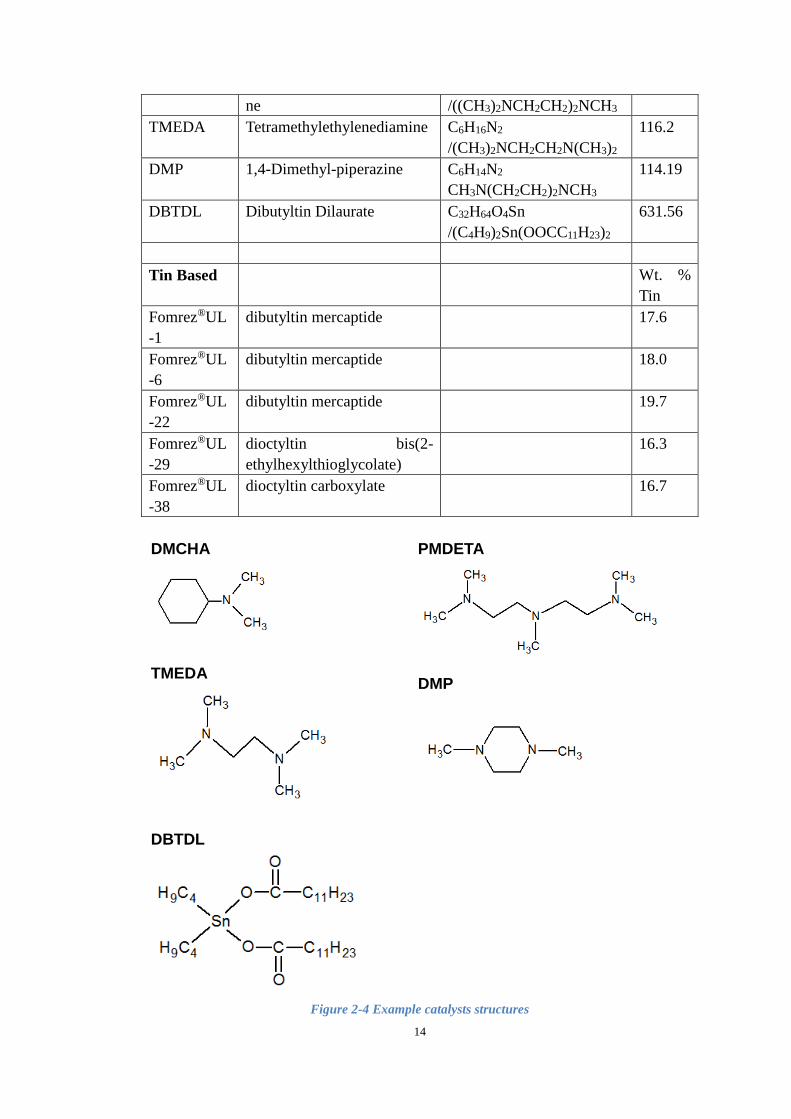
Table 2-3 Amine/Tin based catalysts and their properties
Amine
Based
Product Name Formula MW.
(g/mol)
DMCHA Dimethylcyclohexylamine C8H17N
/C6H5N(CH3)2
127.23
PMDETA Pentamethyldiethylenetriami C9H23N3 173.3
14
ne /((CH3)2NCH2CH2)2NCH3
TMEDA Tetramethylethylenediamine C6H16N2
/(CH3)2NCH2CH2N(CH3)2
116.2
DMP 1,4-Dimethyl-piperazine C6H14N2
CH3N(CH2CH2)2NCH3
114.19
DBTDL Dibutyltin Dilaurate C32H64O4Sn
/(C4H9)2Sn(OOCC11H23)2
631.56
Tin Based Wt. %
Tin
Fomrez®UL
-1
dibutyltin mercaptide 17.6
Fomrez®UL
-6
dibutyltin mercaptide 18.0
Fomrez®UL
-22
dibutyltin mercaptide 19.7
Fomrez®UL
-29
dioctyltin bis(2-
ethylhexylthioglycolate)
16.3
Fomrez®UL
-38
dioctyltin carboxylate 16.7
DMCHA
PMDETA
TMEDA
DMP
DBTDL
Figure 2-4 Example catalysts structures

15
2.4.2 Experimental Design
Blowing agents (water and MF) are taken out from the recipe for the gel reaction.
Gel reactions with different catalysts and different catalyst amount were performed
during this study.
Based on the Temperature-Time profiles, reaction rate pre-exponential factor,
activation energy and heat of reaction can be estimated. The reaction rate at the
beginning was determined by pre-exponential factor and the highest temperature during
reaction process was dependent on heat of reaction. By plotting ln(k) as a function of
1/T, a straight line was obtained and activation energy can be calculated based on the
slope. Reagent mixture was prepared with an electronic balance with an accuracy of ±
10-2 g in which the buoyancy effect was neglected, since errors in measuring mass
fractions introduced by this work were much smaller than 0.1%. When weighting the
mixture, all components were added at the same amounts throughout the experiments
except for catalysts. The same approach was applied in the study on each polyol.
Isocyanate indices in all runs were designed to lock in 1.15, however, there was
deviation in actual numbers since it was uncontrollable when adding pre-weighted
isocyanate.
2.4.3 Gel/Foam Preparation and Data Collection
The following steps were used in the foam experiments:
1. Polyols, water, catalysts, fire retardant and surfactant (B-side components) were
added into a plastic cup successively.
2. The B-side components were mixed for 10-15 seconds.
16
3. The mixture was allowed to degas for 2 min.
4. Thereafter, pre-weighed isocyanate (A-side material) was added and mixed at
the same speed for 7-10s.
5. The reacting mixture was then quickly poured into a box lined with aluminum,
and the foam was allowed to rise and sit at ambient conditions (25 ˚C) during
curing.
All the B-side chemicals were added in the foam reaction while blowing agents and
blowing catalyst were not added in the gel reaction. Since the volume of gel mixture is
much smaller than that of foam, the fluid level in wood box is too low to gather accurate
data while performing gel reaction. Instead of using wood box for both reactions, step
5 was not performed in gel reactions and temperature was directly measured in plastic
cups which could give a more accurate profile.
A high speed mixer blade (2000 rpm) attached to a floor-model drill press was used
to mix the chemicals. LabVIEW software was used to monitor the temperature of the
gel or foam reactions for the first 10 minutes with a type-k thermocouple attached
through a National Instruments SCB-68 box to a National Instruments PCI 6024E data
acquisition card.
2.5 Results and Discussion
2.5.1 Amine Based Catalyst
Experimental data and modeling results of the impact of amine based catalyst were
presented in a previous study[19]. Figure 2-5 shows the temperature profile of V360
gel reaction and the modeling results of temperature and reaction rate changes.

17
Figure 2-5 Temperature profile of V360 gel reaction and modeling results of temperature and
reaction rate
The modeling successfully simulated the temperature change during this reaction
process. The fastest reaction rate occurs at about 650s at which the temperature profile
had the largest increasing gradient.
Figure 2-6 presents modeling temperature profiles under different catalyst amount
loading conditions and Figure 2-7 presents the relationship between catalyst loading
and reaction rate constant at the beginning of the reaction.
0.00E+00
2.00E-06
4.00E-06
6.00E-06
8.00E-06
1.00E-05
1.20E-05
1.40E-05
1.60E-05
1.80E-05
2.00E-05
0
20
40
60
80
100
120
140
160
0 200 400 600 800 1000 1200 1400
Re
acti
on
Rat
e [
mo
l/m
l/s]
Tem
pe
ratu
re [
C]
Time [s]
Exp 1 Model Temp Model Reaction Rate

18
Figure 2-6 Modeling of temperature profiles under different catalyst loadings
Figure 2-7 Relationship between reaction rate constants and catalyst loadings of amine based
catalyst
Based on the results above, reaction rate constant is in direct proportional to the
amount of catalyst loading. Larger reaction rate constant gives an earlier temperature
rise and a higher peak temperature.
0
20
40
60
80
100
120
140
160
0 300 600 900 1200 1500
Tem
pe
ratu
re [
C]
Time [s]
0.09g
0.12g
0.15g
0.18g
0.00E+00
2.00E-07
4.00E-07
6.00E-07
8.00E-07
1.00E-06
1.20E-06
1.40E-06
1.60E-06
1.80E-06
0.06 0.09 0.12 0.15 0.18
Re
acti
on
Rat
e C
on
stan
t [m
ol/
ml/
s]
Catalyst Amount [g]
19
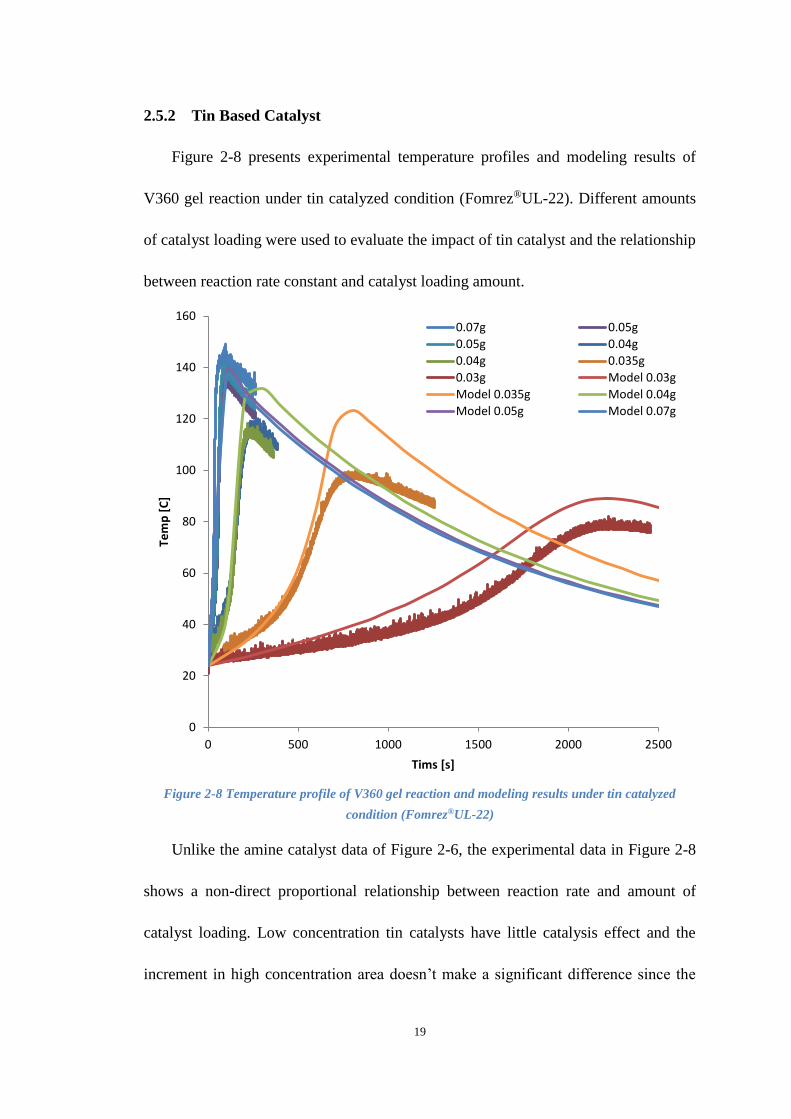
2.5.2 Tin Based Catalyst
Figure 2-8 presents experimental temperature profiles and modeling results of
V360 gel reaction under tin catalyzed condition (Fomrez®UL-22). Different amounts
of catalyst loading were used to evaluate the impact of tin catalyst and the relationship
between reaction rate constant and catalyst loading amount.
Figure 2-8 Temperature profile of V360 gel reaction and modeling results under tin catalyzed
condition (Fomrez®UL-22)
Unlike the amine catalyst data of Figure 2-6, the experimental data in Figure 2-8
shows a non-direct proportional relationship between reaction rate and amount of
catalyst loading. Low concentration tin catalysts have little catalysis effect and the
increment in high concentration area doesn’t make a significant difference since the
0
20
40
60
80
100
120
140
160
0 500 1000 1500 2000 2500
Tem
p [
C]
Tims [s]
0.07g 0.05g
0.05g 0.04g
0.04g 0.035g
0.03g Model 0.03g
Model 0.035g Model 0.04g
Model 0.05g Model 0.07g

20
reaction is already over catalyzed. Therefore, a catalyst poisoning mechanism was
introduced into this model. Equation 2-5 was used to calculate the effective catalyst
amount based on different initial catalyst loadings. Table 2-4 presents the actual
effective catalyst content respect to different initial catalyst loadings. An objective
function (OF) was introduced to minimize the difference of equilibrium constants
between the left side and the right side in Equation 2-5. Figure 2-9 shows the
relationship between catalyst loading and reaction rate constant at the beginning of the
reaction under tin catalyzed condition (Fomrez®UL-22).
Table 2-4 Effective catalyst amount respect to different initial catalyst loadings due to catalyst
poisoning
Initial Cat
Loading (g) OF Pcat (g)
Effective cat
loading In System
(g)
0.03 4.26612E-05 0.029558643 0.000441357
0.035 0.000890475 0.033818797 0.001181203
0.04 0.013654958 0.035999999 0.004000001
0.05 -0.005106865 0.036693601 0.013306399
0.06 0.00733688 0.036823464 0.023176536
0.07 -0.00217988 0.036876301 0.033123699

21
Figure 2-9 Relationship between reaction rate constants and catalyst loadings of tin based catalyst
(Fomrez®UL-22)
Different from amine based catalyst, Figure 2-9 shows that the catalysis effect of
tin based catalyst in low concentration is much weaker than that in high concentration.
Due to the catalyst poisoning the poisoned sites can no longer accelerate the reaction
with which the catalyst was supposed to catalyze, so that appropriate amount of tin
based catalyst should be used to ensure the system being catalyzed but not over
catalyzed.
Several kinds of tin based catalysts from Galata Chemicals LLC were tested in this
study. Modeling results of temperature profile were presented in Figure 2-10 and the
constants used in Equation 2-5 (K & P0) were reported in Table 2-5 respectively. k0
was reported in ml/(mol*s*g catalyst) and E was reported in J/mol.
0.00E+00
5.00E-06
1.00E-05
1.50E-05
2.00E-05
2.50E-05
3.00E-05
3.50E-05
4.00E-05
0.02 0.03 0.04 0.05 0.06 0.07 0.08
Re
acti
on
Rat
e C
on
stan
t [m
ol/
ml/
s]
Catalyst Amount [g]

22
Figure 2-10 Modeling results of V360 gel reaction with different tin based catalysts
Table 2-5 Catalyst poisoning equilibrium constants and kinetic parameters respect to different
tin based catalysts
K P0 (g) Primary Secondary
Hindered-
Secondary
k0 E k0 E k0 E
Fomrez®UL-
1 9000 0.037 - - 8000 40000 1300 50000
Fomrez®UL-
6 9000 0.037 - - 300 58000 65 82000
Fomrez®UL-
22 9000 0.037 - - 10000 46000 3000 52000
Fomrez®UL-
29 9000 0.037 - - 270 56000 60 78000
Fomrez®UL-
38 9000 0.037 - - 600 50000 150 65000
Kinetic parameters of secondary and hindered-secondary hydroxyl were evaluated
based on experimental data and the results from previous study which the ratio of

23
secondary over hindered-secondary in V360 was fixed. The model fit assumes that all
tin based catalysts having the same equilibrium constants (for poisoning) and different
kinetic parameters.
Peak temperatures of modeling results are consistently higher than that of
experimental data. This is believed to be due to the incomplete consumption of
isocyanate. Isocyanate, which has a larger density than polyols, was observed to be in
the bottom of several of the samples in an unreacted state after reaction.
When times for greater than 90% conversion take longer than about 200 seconds,
isocyanate tended to settled to the bottom of the vessel. As observed by the model lines,
the model parameters fit well for the onsets of reactions and are believed to be accurate.
Kinetic parameters of primary hydroxyl were no reported because the reaction of
primary hydroxyl with isocyanate was too fast to accurately measure by temperature
profile using the existing experimental system. Ratios of relative reaction rates[22] can
be used to estimate primary hydroxyl parameters and the change of catalyst amount had
no obvious impact on primary hydroxyl according to both simulated and experimental
results.
2.6 Conclusion
Temperature profiles of urethane gel and foam formulations were simulated using
single-polyol and single-catalyst system parameters and the simultaneous solution of
several ordinary differential equations that describe reactions and physical properties.
This work goes beyond what has been previously attained, including: accurate
simulation of mixtures of polyols based on performance of single polyols, simulation

24
of both water reaction and physical processes for gas formation, and accurate simulation
of the impact of catalysts including the impact of catalyst concentration.
These studies validate the elementary reaction mechanism where, for a limited
range of catalyst, the reaction rate is proportional to the catalyst concentration and
where the non-catalystic and catalytic reactions are assumed to occur in parallel. This
validated mechanism and the modeling method provided good agreement with
experimental data.
Based on pure component kinetic parameters this model can be used to predict the
performance of foams which have multiple combinations of isocyanate, polyols,
catalysts, chemical blowing agents (such as water), and physical blowing agents (such
as methyl formate) in recipes when parameters on pure component (e.g. single polyol)
performance are behavior. This advantage can expedite the ability to develop new foam
formulations by simulation – especially for incorporation of new bio-based polyols into
formulations.
This work extended previous work to study on the impact of tin based catalysts on
polyurethane foaming reaction that goes beyond what have previously been achieved,
including: simulating impacts of catalysts including the impact of catalyst
concentrations on reaction rates, simulating performances of tin based catalysts, and
simulating impact of catalysis poison. These studies validate the elementary reaction
mechanism where, for a limited range of tin catalyst, catalyst poisoning happens in the
system so that the poisoned sites are not able to catalyze the reaction as they are
supposed to do. After accounting for the poisoning of the catalyst, reaction rates were

25
proportional to the amount of catalyst loading. This poisoning modeling provided good
agreement with experimental data.
A next and vital step to both simulate urethane foam formation and the foam’s
physical properties is to model and simulate the viscosity profiles. Preliminary data
indicate that catalysts can have different selectivities for cross-linking reactions versus
random reactions of monomers (as characterized by temperature); this will need to be
considered as the simulation capabilities are extended.

26
3. SIMULATION OF ISOCYANATE CONCENTRATION
PROFILES AND EMISSION IN POLYURETHANE
FOAMING REACTION
3.1 Introduction
Isocyanate moieties are highly reactive with active hydrogens moieties. When this
high reactivity is put on a small molecule and/or a slightly volatile molecule it can lead
to adverse health effects. In a March 2014 report (140313) [23] the California
Environmental Protection Agency put the spotlight on residual isocyanate content of
spray foams. This could be a milestone toward eventual implementation of regulations
on use of urethane spray foam insulations.
Specific perceptions that provided motivation for this report are: a) “diisocyanates
are the leading attributable cause of asthma in the workplace” and b) “review found that
5-15% of polyurethane industry workers exhibit adverse health effects related to
isocyanates exposure”. The report specifically mentions the following isocyanates:
MDI
o Generic methylene diphenyl diisocyanate (MDI) mixed isomers,
Chemical Abstract Service Registry Number (CAS #): 26447-40-5
o 4,4’-methylenediphenyl diisocyanate, CAS #: 101-68-8
TDI
o Toluene Diisocyanates, mixed (TDI), CAS #: 26471-62-5
o 2,4-Toluene diisocyanate, CAS #: 584-84-9
o 2,6-Toluene diisocyanate, CAS #: 91-08-7

27
Hexamethylene-1,6-diisocyanate (HDI), CAS #: 822-06-0
Polymeric MDI (PMDI) is not mentioned in the report
Exposure of workers to diisocyanates in the polyurethane foam manufacturing
industry is well documented. However, very little quantitative data have been published
on exposure to diisocyanates from the use of paints and coatings. Also, spray foam
application details can vary considerably from site-to-site; and so, a fundamental
approach based on quantifying emissions from the source would be useful. Therefore,
trying to track the concentration of diisocyanates in a working zone and estimate re-
entry time for workers are quite significant.
Curtis et al. [24] evaluated emission of 2, 4-TDI, 2, 6-TDI, and isophorone
diisocyanate from a commercially available two-stage concrete coating and sealant.
Diisocyanate concentrations were determined by derivatization and analysis with UV
detection. However, the data differ significantly with the only other published emission
data from an epoxy sealant product [25].
Simulation has found acceptance in many environmental applications because of
its cost-effective implementation in applications where the size/expanse of pollution
dissipation makes it very costly to collect and analyze samples. Simulation can also be
very useful for applications where it is difficult to obtain representative samples. For
urethane spray foams the low concentrations of isocyanates in gas phases can present
sampling problems as well as the low concentrations and “trapped” nature of
isocyanates in resin phases.
This paper uses simulation of the urethane foaming process to better understand

28
isocyanate profiles in rigid foams. The simulations are based on fitting of kinetic and
physical property parameters as previously published in four published papers [19, 26-
28] and multiple papers in stages of review.
Characterizing polyurethane reactions is more complex than most polymerization
systems due to the monomers having multiple reaction moieties, the large number of
parallel reactions that can occur, the hundreds of different oligomer and polymer
products formed as reactions going to completion, and the hundreds of different
formulations in use.
In addition to polymerization and blowing reactions, urethane formulations
continue to react after setting due to the highly reactive nature of the isocyanate group.
The urethane-forming reaction is based around moieties of isocyanate and alcohol
reacting to form urethane moieties. Isocyanate reactions with water, amines, and
urethane moieties are the most common side reactions that occur.
As summarized by Equation 3-1, urethane moieties react with isocyanates to form
allophanate. Equation 3-1 is a more prominent reaction that can occur.
𝑅2𝑂𝐶𝑂𝑁𝐻𝑅1 + 𝑅3𝑁𝐶𝑂 → 𝑅3𝑁𝐻𝐶𝑂𝑁(𝑅1)𝐶𝑂𝑂𝑅2 Equation 3-1
Urethane Isocyanate Allophanate
Duff and Maciel [29] demonstrated that side reactions can play an important part in
polymer crosslinking. They demonstrated that isocyanate groups continue to react after
all the alcohol is consumed and that the reactions impact the polymer properties. Singh
and Boivin [30] found when the dimer of 2,4-tolylene diisocyanate was reacted with
alcohols at about 90°C, the corresponding diurethanes were formed, giving only traces
of allophanates. Higher temperatures in the range of 125°C to 160°C and catalysts such

29
as triethylamine and N-methyl illorpholiile appeared to be necessary for the formation
of allophanates. Querat [31] found that allophanate formation can be catalyzed by
dibutyltindilaurate, but dissociation occurs at high temperature.
The rates of dissociation of allophanates are also affected by the nature of the
nucleophilic agent (alcohol, amine). Heintz et al. [32] observed 5.2% - 7.9% conversion
by side reactions at temperatures between 122°C and 145°C. They used 1H NMR
spectroscopy at 108°C to detect allophanate nitrogen present as 1.8% of the sample’s
nitrogen content. Lapprand et al. [33] identified that allophanates comprised 10% of the
total product after 1hr of reaction at 170°C and an isocyanate index of 1. Vivaldo-Lima
et al. [34] used a model to study the polymerization process where the rate of
allophanate generation was proportional to the urethane-forming reaction.
If water is present, it can react with isocyanates to form urea, and the isocyanate
can then further react with the urea according to Equation 3-2
𝑅1𝑁𝐶𝑂 + 𝑅2𝑁𝐻𝐶𝑂𝑁𝐻𝑅3𝐾𝑒𝑞=
𝑘1𝑘−1
⇔ 𝑅2𝑁𝐻𝐶𝑂𝑁(𝑅3) 𝐶𝑂𝑂𝑅1 Equation 3-2
Isocyanate Urea Biuret
Delebecq, E., et al. found that this reaction tended to be equilibrium limited [35]. For
systems with low water contents, urea formation is negligible. Dusek found [36] side
reactions occur when isocyanate is in excess with selective catalysts. Initially, the
formation of biuret was faster than allophanate. It [35] has also shown that isocyanate
groups undergo homocyclization in addition to forming allophanates which is
characterized as dimerization (Equation 3-3) and trimerization (Equation 3-4). These
reactions happen at lower temperatures with the monomers favored at higher
temperatures.

30
𝑅1𝑁𝐶𝑂 + 𝑅2𝑁𝐶𝑂⇔𝑈𝑟𝑒𝑡𝑑𝑖𝑜𝑛𝑒 Equation 3-3
𝑅1𝑁𝐶𝑂 + 𝑅2𝑁𝐶𝑂 + 𝑅3𝑁𝐶𝑂 ⇔ 𝐼𝑠𝑜𝑐𝑦𝑎𝑛𝑢𝑟𝑎𝑡𝑒 Equation 3-4
As with the biuret-forming reaction, these reactions are equilibrium limited. When
competing with reactions that are not equilibrium-limited, the product mixture will
eventually be dominated by those products that are not equilibrium limited.
Recent work has shown that epoxy moieties can also participate in reaction
networks of urethane formulations [37, 38]. Epoxy reactions are of particular interest
for bio-based B-side components of urethane systems because they can be formed
reliably and at lower cost from bio-oils like soybean oil. Little data are available on the
rates and mechanisms of these reactions. Based on previous work [39, 40], the epoxy
could react with isocyanate through two paths including reactions with the monomer
(Equation 3-5) and oligomers (Equation 3-6).
Low isocyanate concentration:
𝑅1𝑁𝐶𝑂 + 𝑅2𝐶𝑂𝐶𝐻𝑅3 →𝑂𝑥𝑎𝑧𝑜𝑙𝑖𝑑𝑜𝑛𝑒 Equation 3-5
High isocyanate concentration:
𝐼𝑠𝑜𝑐𝑦𝑎𝑛𝑢𝑟𝑎𝑡𝑒 + 𝑅2𝐶𝑂𝐶𝐻𝑅3𝐶𝑙−→ 𝑂𝑥𝑎𝑧𝑜𝑙𝑖𝑑𝑜𝑛𝑒 Equation 3-6
Epoxy moieties also react with alcohols and water using nucleophilic substitution

31
(e.g SN1) as illustrated by Equation 3-7
and Equation
3-8.
Equation 3-7
Equation 3-8
While the isocyanate-alcohol reaction takes place at reasonable rates at ambient
temperature [41], the reactions of epoxy with alcohols require temperatures in excess
of 100 °C for most commercial processes.
Table 3-1 summarizes reactions 1-8 including whether or not the product is
equilibrium limited. The challenge of studying these reactions resides in the fact that
there are multiple parallel reactions that can occur. When the reaction is free of water,
biuret formation becomes negligible. The dimer and trimer forming reactions are of less
interest since actual urethane form formulations will tend not to have a high excess of
isocyanates, and so, the emphasis of this work is on the allophanate-forming reaction
and the reactions with epoxy. The isocyanate-alcohol reaction will dominate the other
reactions in urethane systems until the alcohols are substantially consumed (for
isocyanate index greater than 1). The allophanate-forming reaction can be followed
after the alcohol runs out.

32
Table 3-1 Summary of impact of potential reaction products
Products Equation Conclusion Importance Source
Allophanate Eq.1 Major byproduct if excess isocyanate
is present. Yes [29, 30]
Biuret Eq.2
Only presents in systems where
water is used in the formulation. It is
equilibrium limited.
No [30, 35,
36]
Uretdione
Isocyanurate Eq.3
Dimer and timer of isocyanate that
are equilibrium limited. Reactions
happen at lower temperatures with
the monomers favored at higher
temperatures
No [30, 35]
Oxazolidone Eq.5,
Eq.6
Another main reason causing
isocyanate consumed when epoxy
exists.
Yes [37, 38]
Alcohol
Product From
Epoxy
Eq.7,
Eq.8
Could be neglect due to high reality
reactivity of isocyanate-alcohol
reaction and isocyanate-epoxy
reaction
No [41]
Thus, the focus of this work is on reactions 1, 5, 6, 7, and 8. While these reactions
have previously been studied, this work not only studied on likely fates of unreacted
isocyanate and developed experimental plan to measure reaction rates of excess
isocyanate in solvents, but also optimized the model to include these side reactions and
provided isocyanate concentration profiles to evaluate isocyanate emissions.
The works done by Zhao and Ghoreishi [19, 26-28] placed a high emphasis on
model development with robust experimental methods, primarily temperature profiles,
to assist in model development based around isocyanate-alcohol reactions. Better
understandings and more accurate data on the alcohol-isocyanate reactions provide an
improved foundation for studying these other reactions. Use of temperature profiles is
particularly insightful at time ranges of 5 to 500 seconds where the response time of the
thermocouple is fast relative to the changes in temperature and where heat losses are

33
relatively low as compared to heats of reaction. The previous modeling work were
based on temperatures profiles; the objective of this work is to follow isocyanate
concentration profiles to check the accuracy of modeling work to date and to provide
insight into some of these other reactions. Use of concentration profiles (via sampling
and titration) is particularly useful at times scales greater than 5 minutes and specifically
for reactions that are sufficiently slow to allow quenching and titration without the
related time delays impacting the analyses. The results of this work are neither
presented nor intended as definitive; however, useful insight is available from the
simulations to allow for more-informed decisions.
3.2 Modeling
In this study, additional equations were added into Zhao’s model [19, 26-28].
Assuming reactions Equation 3-1 and Equation 3-6 are elementary, then the reaction
rates can be expressed as:
𝑟1 = [𝑁𝐶𝑂] × [𝑈𝑟𝑒𝑡ℎ𝑎𝑛𝑒] × 𝐴1 × 𝑒−𝐸𝑎1𝑅𝑇 Equation 3-9
𝑟6 = [𝑁𝐶𝑂] × [𝐸𝑝𝑜𝑥𝑦] × 𝐴6 × 𝑒−𝐸𝑎6𝑅𝑇 Equation 3-10
These rate expressions are based on Flory’s assumption that the inherent reaction rate
per functional group is independent of chain length and are based on the concentration
of reactive moieties rather than concentration of compounds [42]. The modeling of
these reactions is based on the solution of Ordinary Differential Equations using
MATLAB’s ODE45 function. Values of pre-exponential factor and activation energy
were fitted based on experimental temperature profiles.

34
3.3 Materials and Methods
3.3.1 Materials
RUBINATE M (Standard Polymeric MDI) was the isocyanate used in this study
and the petroleum-based polyols were Poly G76-635, Voranol 360 and Jeffol R315x
from Huntsman Company and Dow Chemical Co. N,N-dimethylcyclohexylamine
(DMCHA) and N,N,N′,N′′,N′′-Pentamethyldiethylenetriamine (PMDETA) were used
as catalysts. Momentive L6900 was used as surfactant and TCPP was used as fire
retardant.
3.3.2 Experimental Design
Gel reaction solution samples were collected and evaluated using the ASTM
D2572-97(2010) standard to measure isocyanate concentrations in 1-1 g liquid samples.
1-pentanol and 2-pentanol were chosen as reagents to prevent gel formation and allow
sampling at times up to 48 hours where typical urethane formulations would become
solid and could not be titrated. Toluene was added as a diluent to limit the temperature
increase of the reactions to temperatures more consistent with urethane systems
(pentanols have lower heat capacities than typical urethane formulation polyols).
Gel reactions were performed as summarized by Zhao et al [28]. 1 gram samples
were picked up from the reaction mixture and mixed with 30 ml of dibutylamine-
toluene to quench the reaction by both dilution and temperature reduction. The mixture
was titrated within 15 minutes after the quench. During extended-time studies, the
reactions proceed about 15 min in a beaker at near-adiabatic conditions which
commonly resulted in a peak temperature of about 130 °C at 3 minutes into the reaction.

35
After the initial 15 minutes of reaction, the alcohol had substantially reacted and heat
losses exceeded any heat of reaction. Then, 1-2 grams samples were added into test
tubes which were placed in an oven at the specific temperature for extended studies.
The samples were then titrated at 1hr, 12hr, 24hr and 48hr to detect isocyanate content.
During the initial 3 minutes of reaction, temperature profiles were followed for the
epoxy reactions. Relatively low heat transfer coefficients and relatively high heats of
reaction allowed these temperature profiles to be used to characterize the reaction
kinetics. Previous modeling work has provided rate constants and heat transfer
coefficients which are able to characterize the isocyanate-alcohol reactions. These
results provide a starting point for characterizing the reaction. Two approaches
distinguish the reactions of this study from the already-characterized isocyanate-
alcohol reactions. For time periods greater than 15 minutes and an isocyanate index of
2.0, the alcohol has reacted less than detectible limits and changes in isocyanate
concentrations can be attributed to the reactions of Table 3-1. At time less than 15
minutes, reaction temperature profiles are compared to control experiments, the
significant increase in temperature can be attributed to epoxy-related reactions.
3.3.3 Standard Test Method for Isocyanate Groups in Urethane Materials or
Prepolymers
ASTM D2572-97(2010) is the standard test method for isocyanate groups in
urethane materials or prepolymers. The urethane prepolymer is allowed to react with
an excess of di-n-butylamine in toluene. After the reaction is complete, the excess of
di-n-butylamine is determined by back titration with standard hydrochloric acid.
36
The following procedures were used in the isocyanate titration:
1. Weigh to 0.1 g a specimen containing approximately 1.1 milliequivalents of
NCO (for example, 1.0 g of prepolymer containing approximately 5% NCO)
in a 250-mL Erlenmeyer flask.
2. Add 25 mL of dry toluene (If the polymer is insoluble, add 10mL of dry,
analytical grade acetone to the toluene.), place a stopper in the flask, and swirl
by hand or on a mechanical agitator to dissolve the prepolymer. Solution may
be aided by warming on a hot plate.
3. Using a pipet, add 25.00 mL of 0.1 N di-n-butylamine solution and continue
swirling for 15 min with stopper in place.
4. Add 100 mL of isopropyl alcohol and 4 to 6 drops of bromphenol blue indicator
solution. Titrate with 0.1 N hydro-chloric acid to a yellow end point.
5. Run a blank titration including all reagents above but omitting the specimen.
Calculate the NCO content as follows (Equation 3-11):
NCO, % =[(B−V)∗N∗0.0420]
W∗ 100 Equation 3-11
where:
B = volume of HCl for titration of the blank, ml,
V = volume of HCl for titration of the specimen, ml,
N = normality of HCl,
0.0420 = milliequivalent weight of the NCO group, and
W = grams of specimen weight, g.

37
3.4 Results and Discussion
3.4.1 Isocyanate-urethane Reaction
Isocyanate titration was performed during gel reaction samples that had not gelled;
similar sampling and analysis is not possible with foam-forming samples which are
tacky. In the first step, single polyol and single catalyst were chosen to react with
isocyanate to study the fundamentals of side reactions. The isocyanate index was set at
1.5 to allow enough excess isocyanate for reaction with urethane. Table 3-2 provides
the recipe used for isocyanate profiling studies.
Table 3-2 Recipe used for isocyanate profiling studies (poly G76-635)
B-side Materials Weight/g Moles of functional groups
Poly G76-635 25.00 0.2831
Dimethylcyclohexylamine(Cat8) 0.12
Momentive L6900 0.6
TCPP 2
A-side Material
RUBINATE M 57.33 0.4247
Isocyanate Index 1.5
Figure 3-1 shows the “titration results” of isocyanate concentration to decrease
rapidly at 400 seconds when the system temperature reached about 100°C. The
isocyanate concentration tended to zero at later time stage. Even extensive effort to
crush and mix the solid polymer would not provide a better result at the higher
conversions. It was concluded that the titration samples after 400 seconds did not
completely dissolve in the toluene solvent which caused the titration results to be
unreliable.

38
Figure 3-1 Isocyanate concentration profile for reaction of poly G76-635 with PMDI during gel
reaction process
An alternative one-functional alcohol (1-pentanol) was then selected to react with
isocyanate to avoid issues related to formation of solid phases where unreacted
isocyanate was not accessible for titration. Extra toluene (20% in volume) was added
into the reactants to avoid overheating which would cause the pentanol boil. Table 3-3
lists the recipes with 1-pentanol or 1-pentanol/epoxy for isocyanate titration.
Table 3-3 Recipes of gel reaction for evaluating iso-urethane and iso-epoxy kinetics parameters
B-side Materials Weight/g Moles of functional
groups
1-pentanol
recipe
Epoxy
recipe
1-pentanol
recipe
Epoxy
recipe
1-pentanol 11.50 11.500 0.130 0.130
Epoxy oil 0.000 3.000 0.013
Cat8 0.120 0.120
Momentive L6900 0.600 0.600
TCPP 2.000 2.000
A-side Material
RUBINATE M 35.300 35.300 0.260 0.0260
Toluene (solvent) 10.440 10.440
Isocyanate Index(NCO/OH) - 2.000 2.000
0
0.05
0.1
0.15
0.2
0.25
0.3
0.35
0.4
0.45
0.5
0 200 400 600 800 1000
Iso
Co
nce
ntr
atio
n (
mo
l)
Time(s)
Run 1
Run 2
Low isocyanate concentrations may due to incomplete
dissolving of samples in titration indicator

39
To focus on the reaction between excess isocyanate and urethane, the isocyanate
index was set to be 1.9-2.0. Reacting samples were kept warm in an oven (50°C) to
reduce heat transfer to surroundings which could extend time for isocyanate to react
with urethane. The study emphasized profiles after 15 minutes where all the alcohol
had reacted to completion (in about 3 minutes) and the isocyanate concentration could
be followed over a course of hours and days in a mixture isolated from moisture in the
air.
In theory, if the reaction between isocyanate and urethane does not happen, there
should be about 0.125 moles isocyanate left in the system. Figure 3-2 shows isocyanate
titration results in 48 hours period.
Figure 3-2 Long-term isocyanate concentration profile for reaction of 1-pentanol with PMDI during
gel reaction process
The concentration of isocyanate tended to a constant value about 0.1 moles after
15 minutes. The deviations in the figure were within experimental error since the
0.095
0.096
0.097
0.098
0.099
0.1
0.101
0.102
0 500 1000 1500 2000 2500 3000 3500
Iso
Co
nce
ntr
atio
n(m
ol)
Time (min)
Run 1
Run 2

40
concentration differences were quite small (<0.5%) compare to the initial concentration
of isocyanate. It indicated that there was negligible isocyanate reaction during this 48
hour period.
The excess isocyanate apparently reacted with urethane within 15 minutes of the
urethane-forming reaction since the isocyanate concentration was lower than what
would be consumed with stoichiometric alcohol reaction. Based on these results it was
concluded that isocyanate titration must be performed in the time range between 0 to
15 minutes without catalysts and oven heating to characterize the isocyanate-urethane
reaction.
Figure 3-3 shows isocyanate titration results within 15 minutes. As illustrated by
Figure 3-2 and Figure 3-3, the polyurethane foaming reaction can be characterized into
two regimes. The first regime is where rates are dominated by the reaction between
isocyanate and alcohol moieties. An initial rapid reduction in isocyanate concentration
is observed during the first 5 minutes due to this regime (Figure 3-3). Commercial
urethane reaction processes are typically designed around having adequate reactivity
during the first two minutes of reaction to set the polymer—this is achieved through the
use of catalysts. The final value of isocyanate concentration approaches a relatively
constant value at about half of the initial isocyanate concentration which is consistent
with the isocyanate index of 2.0. The second regime applies to systems with excess
isocyanate and is dominated by the reaction between isocyanate and urethane moieties
(Figure 3-2).

41
Figure 3-3 Short-term isocyanate concentration profile for reaction of 1-pentanol with PMDI during
gel reaction process
The gel reaction kinetic parameters from previously published work [19, 26] were
used to predict isocyanate concentration modeling result without any modifications
(model line of Figure 3-3). The modeling results match the experimental titration data
well. This further validates the model and parameters which to this point were based
only on temperature profiles.
Extended time studies of the 1-pentanol system are summarized by Figure 3-4 and
Figure 3-5 at 80 ˚C and 110 ˚C where the time scale is in minutes. Model curves are
superimposed with the kinetic parameters reported in Table 3-4. The modeling results
were based on a rate expression that is first order in both isocyanate and urethane moiety
concentrations. The tertiary amine catalyst has significant influence on this reaction.
0
0.05
0.1
0.15
0.2
0.25
0.3
0 200 400 600 800 1000 1200
Iso
Co
nce
ntr
atio
n (
mo
l)
Time (s)
Modeling Result
Experiment Data

42
Figure 3-4 Extended time isocyanate reaction profile with fitted model for reaction of 1-pentanol
with PMDI at 80°C with different catalysts. C15 is the concentration of isocyanate functional groups
at 15 min of reaction. Symbols “▲”, “” and “♦” represent experiment data with Cat5, Cat8 and
blank control.
Figure 3-5 Extended time isocyanate reaction profile with fitted model for reaction of 1-pentanol
with PMDI at 110°C with different catalysts. Symbols “▲”, “” and “♦” represent experiment data
with Cat5, Cat8 and blank control.
0.4
0.5
0.6
0.7
0.8
0.9
1
1.1
0 200 400 600 800 1000 1200 1400 1600
C/C
15
Time (min)
0
0.2
0.4
0.6
0.8
1
1.2
0 500 1000 1500 2000 2500 3000 3500
C/C
15
Time (min)

43
Table 3-4 Kinetic parameters of isocyanate-urethane reaction
Catalyst loading (g) 𝒌𝟎 ml/(mol*s*g
catalyst)
E(J/mol)
Blank 0 0.000015 47250
Cat5 0.12 0.01 45000
Cat8 0.12 0.02 45000
Figure 3-6 summarizes reaction profiles for reactions of polyol G76-635 with
PMDI at different isocyanate indices. The model, based on parameters of Table 3-4, is
able to accurately account for changes in isocyanate index at values between 1.1 and
2.0.
As with the simple alcohols, the reaction parameters as previously determined from
temperature profiles effectively describe the isocyanate reaction profile for poly G76-
635, except at conversions greater than about 50%. At these higher conversions, the
polymer begins to set with very high viscosities transitioning to solid polymers. As with
the results of Figure 3-1, some of the data after 400 seconds in Figure 3-6 are influenced
by inefficient attempts at titrating isocyanate moieties trapped in solid matrices. The
model is believed to be more accurate than the titration results after 400 seconds.
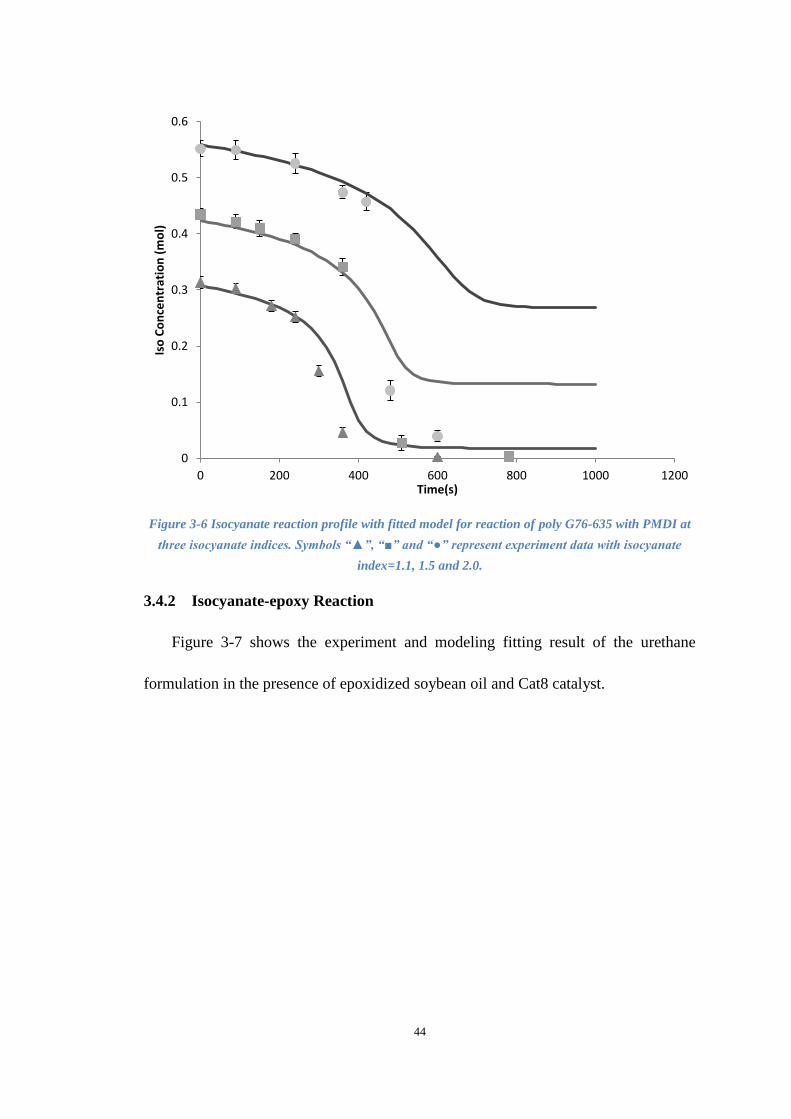
44
Figure 3-6 Isocyanate reaction profile with fitted model for reaction of poly G76-635 with PMDI at
three isocyanate indices. Symbols “▲”, “■” and “●” represent experiment data with isocyanate
index=1.1, 1.5 and 2.0.
3.4.2 Isocyanate-epoxy Reaction
Figure 3-7 shows the experiment and modeling fitting result of the urethane
formulation in the presence of epoxidized soybean oil and Cat8 catalyst.
0
0.1
0.2
0.3
0.4
0.5
0.6
0 200 400 600 800 1000 1200
Iso
Co
nce
ntr
atio
n (
mo
l)
Time(s)

45
Figure 3-7 Isocyanate concentration profiles with fitted models for reaction of 1-petanol and Epoxy oil
with PMDI at an index of 2.0 under different temperatures. Symbols “” and “■” represent experiment
data of reaction without any catalyst at 80°C and 110°C. “●” and “♦” represent experiment data with
Cat8 at 80°C and 110°C.
A comparison of the Figure 3-7 profiles with those of Figure 3-4 and Figure 3-5
illustrates that isocyanate have a greater tendency to react with epoxies than with
urethanes. This provides evidence that epoxy monomers in a urethane formulation can
lead to increased crosslinking as a result of reactions that occur during the hours and
days after the initial setting of the urethane polymer. For gel reactions with epoxy
present at 80°C, the viscosity of the mixture was observed to continuously increase
during the 48 hours of reactions. At 110°C the system remained as liquid when no
catalyst was used but formed a solid elastomer in the presence of Cat 8. No gels were
observed for the reaction mixtures at similar conditions in the absence of epoxy
moieties (ie. where isocyanates reacted with urethanes).
From a polymer device engineering perspective, an adequate amount of alcohol
0
0.2
0.4
0.6
0.8
1
1.2
0 500 1000 1500 2000 2500 3000 3500
C/C
15
Time (mins)
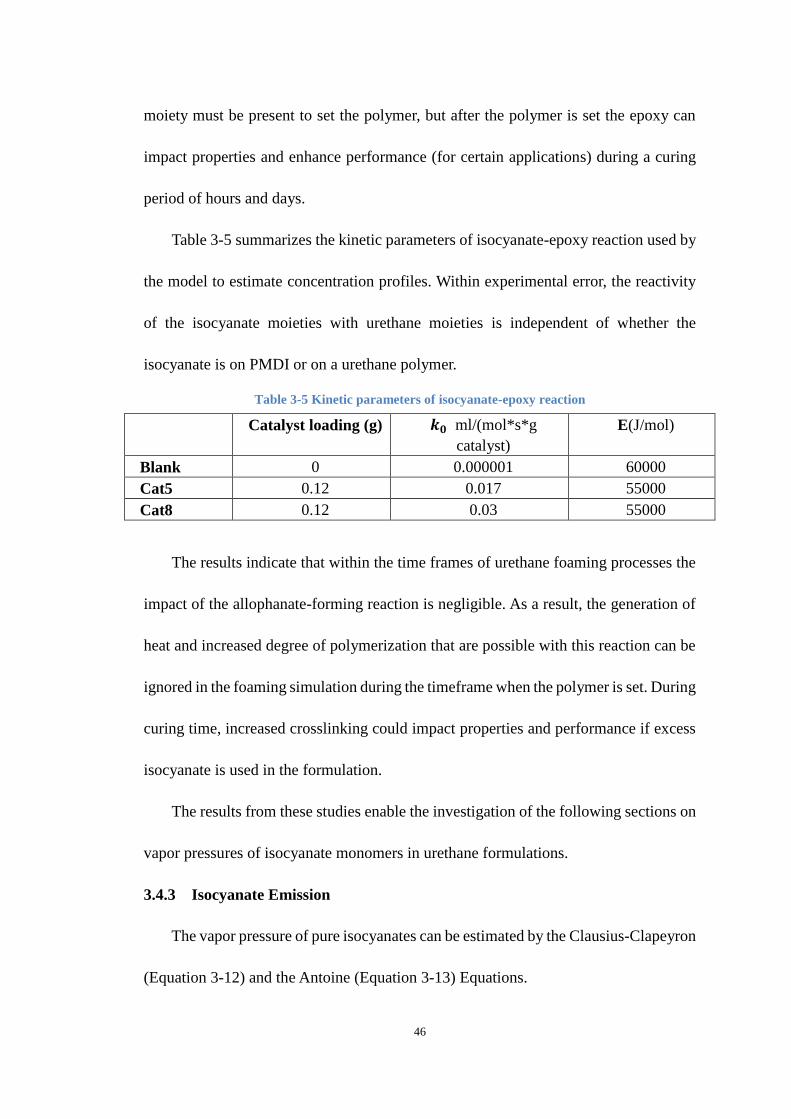
46
moiety must be present to set the polymer, but after the polymer is set the epoxy can
impact properties and enhance performance (for certain applications) during a curing
period of hours and days.
Table 3-5 summarizes the kinetic parameters of isocyanate-epoxy reaction used by
the model to estimate concentration profiles. Within experimental error, the reactivity
of the isocyanate moieties with urethane moieties is independent of whether the
isocyanate is on PMDI or on a urethane polymer.
Table 3-5 Kinetic parameters of isocyanate-epoxy reaction
Catalyst loading (g) 𝒌𝟎 ml/(mol*s*g
catalyst)
E(J/mol)
Blank 0 0.000001 60000
Cat5 0.12 0.017 55000
Cat8 0.12 0.03 55000
The results indicate that within the time frames of urethane foaming processes the
impact of the allophanate-forming reaction is negligible. As a result, the generation of
heat and increased degree of polymerization that are possible with this reaction can be
ignored in the foaming simulation during the timeframe when the polymer is set. During
curing time, increased crosslinking could impact properties and performance if excess
isocyanate is used in the formulation.
The results from these studies enable the investigation of the following sections on
vapor pressures of isocyanate monomers in urethane formulations.
3.4.3 Isocyanate Emission
The vapor pressure of pure isocyanates can be estimated by the Clausius-Clapeyron
(Equation 3-12) and the Antoine (Equation 3-13) Equations.

47
𝑙𝑛𝑃2
𝑃1=∆𝐻𝑣𝑎𝑝
𝑅(1
𝑇1−1
𝑇2) Equation 3-12
Table 3-6 lists reported vapor pressure information of different isocyanates. TDI
and HDI have much higher vapor pressure at the same temperature, indicating that they
will be more problematic during application.
Table 3-6 Vapor pressure of pure isocyanates
4,4’-MDI 2,4-TDI HDI
Vapor pressure (mmHg) 0.000005 (20°C) 0.01 (25°C) 0.05 (25°C)
Enthalpy of vaporization
(J/mol)
90000 60000 49000
log 𝑃 = 𝐴 −𝐵
𝐶+𝑇 Equation 3-13
Table 3-7 lists Antoine Equation Constants of TDI and MDI in different
temperature ranges [43, 44]. The data of HDI is not available. MDI-2 results have
higher values in vapor pressure than MDI-1, and therefore will be used in the simulation
as a worse condition.
Table 3-7 Antoine Equation Constants of isocyanates
TDI (P-bar, T-K) MDI-1 (P-bar, T-K) MDI-2 (P-mmHg, T-
C)
A 4.59647 2.41991 6.32463
B 2064.243 969.926 1923.1995
C -75.176 -253.28 165.068
T 293-443 442-530 196.12-446.87
Based on isocyanate concentration profiles and vapor pressure data over
temperature, the partial vapor pressure of isocyanate in gas phase can be estimated by
Raoult's law (Equation 3-14).
𝑃𝑖 = 𝑃𝑖∗ ∗ 𝑥𝑖 Equation 3-14
where 𝑃𝑖 is the partial vapor pressure of the component in the gaseous mixture (above
the solution), 𝑃𝑖∗ is the vapor pressure of the pure component, and 𝑥𝑖 is the mole

48
fraction of the component in the mixture (in the solution). The OSHA Permissible
Exposure Limit (PEL) of isocyanate in general industry is 0.02 ppm, about 2E-8 atm.
Figure 3-8 presents partial vapor pressure of isocyanate and temperature profiles over
time during a control foaming reaction using MDI. The results from Antoine Equation
have higher values than that from Clausius-Clapeyron Equation, and therefore can be
used to compare with published regulations as the worst case condition. It is important
to recognize that the vapor pressure profiles of Figure 3-8 are only made possible with
concentration and temperature profiles that are only possible based on both the
simulation and newly acquired kinetic parameters as reported in the previous section.
The highest emission occurred when the peak reaction temperature was reached and
the value was about 0.00025 atm. As the temperature cooled the partial vapor pressure
of isocyanate decreased and proceeded below the limitation after 4000 seconds.
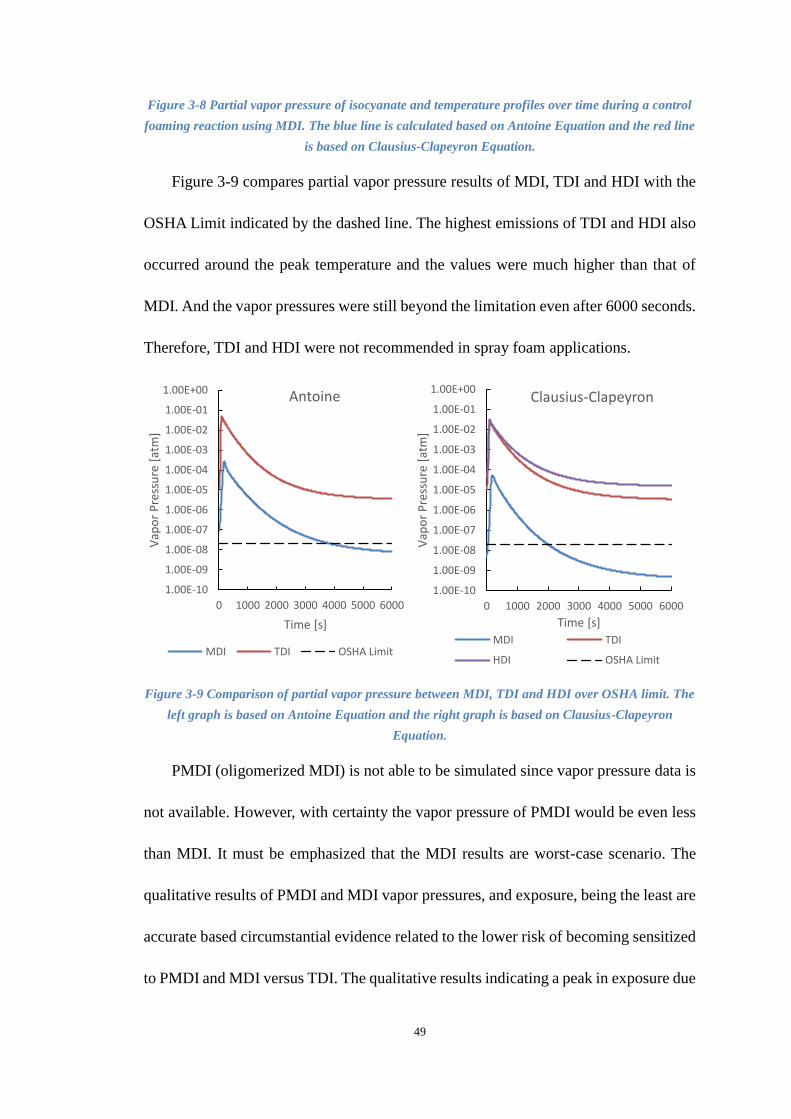
49
Figure 3-8 Partial vapor pressure of isocyanate and temperature profiles over time during a control
foaming reaction using MDI. The blue line is calculated based on Antoine Equation and the red line
is based on Clausius-Clapeyron Equation.
Figure 3-9 compares partial vapor pressure results of MDI, TDI and HDI with the
OSHA Limit indicated by the dashed line. The highest emissions of TDI and HDI also
occurred around the peak temperature and the values were much higher than that of
MDI. And the vapor pressures were still beyond the limitation even after 6000 seconds.
Therefore, TDI and HDI were not recommended in spray foam applications.
Figure 3-9 Comparison of partial vapor pressure between MDI, TDI and HDI over OSHA limit. The
left graph is based on Antoine Equation and the right graph is based on Clausius-Clapeyron
Equation.
PMDI (oligomerized MDI) is not able to be simulated since vapor pressure data is
not available. However, with certainty the vapor pressure of PMDI would be even less
than MDI. It must be emphasized that the MDI results are worst-case scenario. The
qualitative results of PMDI and MDI vapor pressures, and exposure, being the least are
accurate based circumstantial evidence related to the lower risk of becoming sensitized
to PMDI and MDI versus TDI. The qualitative results indicating a peak in exposure due
1.00E-10
1.00E-09
1.00E-08
1.00E-07
1.00E-06
1.00E-05
1.00E-04
1.00E-03
1.00E-02
1.00E-01
1.00E+00
0 1000 2000 3000 4000 5000 6000
Vap
or
Pre
ssu
re [
atm
]
Time [s]
Antoine
MDI TDI OSHA Limit
1.00E-10
1.00E-09
1.00E-08
1.00E-07
1.00E-06
1.00E-05
1.00E-04
1.00E-03
1.00E-02
1.00E-01
1.00E+00
0 1000 2000 3000 4000 5000 6000
Vap
or
Pre
ssu
re [
atm
]
Time [s]
Clausius-Clapeyron
MDI TDI
HDI OSHA Limit
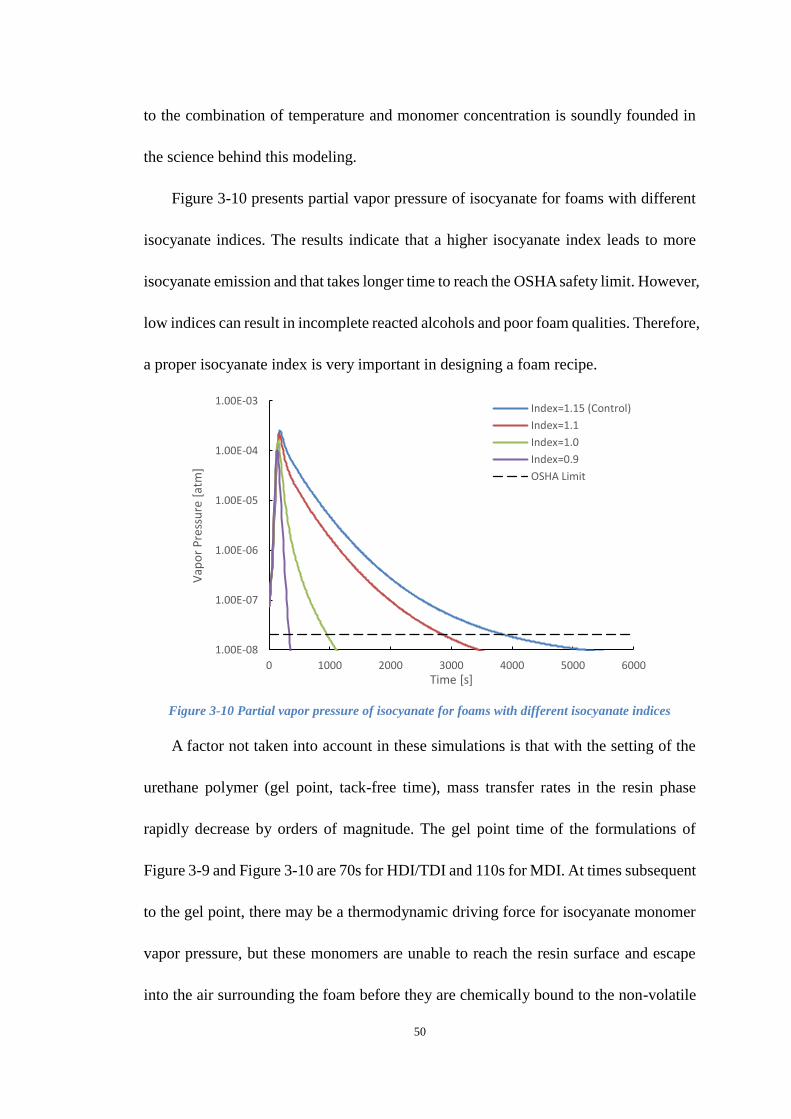
50
to the combination of temperature and monomer concentration is soundly founded in
the science behind this modeling.
Figure 3-10 presents partial vapor pressure of isocyanate for foams with different
isocyanate indices. The results indicate that a higher isocyanate index leads to more
isocyanate emission and that takes longer time to reach the OSHA safety limit. However,
low indices can result in incomplete reacted alcohols and poor foam qualities. Therefore,
a proper isocyanate index is very important in designing a foam recipe.
Figure 3-10 Partial vapor pressure of isocyanate for foams with different isocyanate indices
A factor not taken into account in these simulations is that with the setting of the
urethane polymer (gel point, tack-free time), mass transfer rates in the resin phase
rapidly decrease by orders of magnitude. The gel point time of the formulations of
Figure 3-9 and Figure 3-10 are 70s for HDI/TDI and 110s for MDI. At times subsequent
to the gel point, there may be a thermodynamic driving force for isocyanate monomer
vapor pressure, but these monomers are unable to reach the resin surface and escape
into the air surrounding the foam before they are chemically bound to the non-volatile
1.00E-08
1.00E-07
1.00E-06
1.00E-05
1.00E-04
1.00E-03
0 1000 2000 3000 4000 5000 6000
Vap
or
Pre
ssu
re [
atm
]
Time [s]
Index=1.15 (Control)
Index=1.1
Index=1.0
Index=0.9
OSHA Limit

51
urethane polymer. Once the monomers are bound to the polymer, any remaining
isocyanate moieties of the solid resin will react to extinction.
3.5 Conclusion
Reactions of isocyanates in urethane formulations subsequent to complete reaction
of alcohols were studied, and the kinetic parameters for these reactions were
incorporated into simulation software. The revised simulation allowed isocyanate
concentration profiles and isocyanate monomer partial pressures to be estimated from
start of the foaming process until hours subsequent thereof.
This work has several interesting findings going beyond what have been previously
achieved, including:
Modeling results of isocyanate concentration profiles in urethane-forming
reaction systems matched the experimental data well and indicated that the
previously reported reaction kinetics parameters were reasonable.
Allophanate-forming and other side reactions have a negligible impact on heat
generation and degree of polymerization during the first three minutes of
reaction for typical urethane production; however, their formation can impact
the polymer structure in the hours after the initial urethane-forming processes
and are likely critical in curing and obtaining peak performance from urethanes.
Reaction with active hydrogen on urethane may be as important as moisture in
air for extinction of isocyanate moiety, especially since moisture from air will
not readily penetrate the cured resin phase.

52
Reaction of isocyanate with epoxy moieties was observed to have a minor
impact in the early timeframe and have significant impacts on crosslinking and
gel formation during longer timeframes (0.5-12 hours after setting of polymer).
It indicates that epoxy co-reagents can be used to reduce isocyanate emissions.
Peak emissions of isocyanate monomers (by evaporation) occur at times of 50-
200 seconds after which emissions drop rapidly.
For MDI, vapor pressure emissions (not including what has already evaporated)
fall below OSHA limits after 4000 seconds based on a model with no resin phase
mass transfer limits. With mass transfer limits, it is likely that the emissions fall
below OSHA limits after 400 seconds.
Of the monomers MDI, TDI and HDI, MDI has advantages related to lower
vapor pressures as pertinent during application. The highest emission of MDI is
estimated to be only 0.00025 atm while that of TDI/HDI could reach 0.03-0.05
atm. PMDI will have lower emissions than MDI.
Among the most important parameters that can be selected to ensure low gas
phase isocyanate concentration are: a) choice of isocyanate (preference of
PMDI/MDI), b) a proper isocyanate index (about 1.10, the lower the better but
not less than 1.0), c) use of other additives (e.g. epoxy co-reagents), and d)
formulation to reduce peak reaction temperature.

53
4. MODELING IMPACT OF SURFACTANTS ON
POLYURETHANE FOAM POLYMERIZATION
4.1 Introduction
The polyurethane foaming process involves two competing reactions (gel reaction
and blow reaction). The gel reaction involves the reaction of an isocyanate group with
an alcohol group to give a urethane linkage. In the blow reaction, an isocyanate group
reacts with water to yield a thermally unstable carbamic acid which decomposes to give
an amine functionality, carbon dioxide, and heat [2, 45-47]. The carbon dioxide gas will
provide volume for bubble expansion and occupy over 95% of the final volume of the
foam product [48]. Figure 4-1 shows the four stages of the foaming process of flexible
foams:
(1) Bubble generation and growth,
(2) Packing of the bubble network and cell window stabilization,
(3) Polymer stiffening and cell opening,
(4) Final curing [49].
In rigid foams, most of the cells or bubbles are not broken; they resemble inflated
balloons or soccer balls, piled together in a compact configuration. Both the closed cells
and the solid resin walls contribute to the final strength of the rigid foam.

54
Figure 4-1 Macroscopic view of different stages during foaming of flexible foams
Silicone surfactants, which consists of a polydimethylsiloxane (PDMS) backbone
and polyethylene oxide-co-propylene oxide (PEO-PPO) random copolymer grafts, are
used as surfactants in polyurethane foaming systems [50]. Figure 4-2 shows the
structure of a typical silicone surfactant used in polyurethane foaming systems. It was
shown that these surfactants do not alter the reaction kinetics in the polyurethane
foaming process [51]. A foaming system in absence of these surfactants will often
experience catastrophic coalescence and foam collapse.
Figure 4-2 Structure of a typical silicone surfactant used in polyurethane foaming systems

55
These surfactants concentrate at the air-resin interface and assist with both bubble
generation and bubble/cell stabilization in the polyurethane foam-forming process. The
mechanical properties of the cured polyurethane foam, such as air permeability and
foam cell size, are affected significantly by the structure of the silicone surfactant used
in the formulation [48]. Surfactants with higher silicone content will provide lower
surface tension and thus help increase the number of air bubbles introduced during
mixing. Entrain gases (e.g. nitrogen) in the liquid serve as the starting point for foam
cell growth. As a result, the cured polyurethane foam made with higher silicone content
surfactant has a smaller bubble size. It is also shown that silicone surfactant can reduce
the cell “window” drainage rate due to the surface tension gradient along the cell
window.
The major role of silicone surfactants in rigid formulations are cell size control
(providing a fine-celled structure with a narrow cell size distribution) and
emulsification. A significant amount of gravitational and surface energy is adsorbed
during foam formation. In polyurethane foams this energy is provided by high shear
mixing and the release of chemical energy during the formation of the polyurethane.
The earliest interfacial process is the initial formation of bubbles in the liquid.
Kanner and coworkers demonstrated that there is no spontaneous nucleation of the
bubbles in polyurethane foams; the bubbles have to be stirred in [52]. These initial
bubbles are small, their diameters being on the micrometer scale. Once bubbles have
formed, they must remain stable during their growth phase. As CO2 gas is formed in
the blowing reaction, it expands these tiny bubbles. They can also expand when

56
auxiliary blowing agents such as pentane volatilize. The expansion of the bubbles
increases the overall surface area; the total surface energy absorbed can be lessened by
reducing the energy per unit area of the liquid (or equivalently, the surface tension). In
polyurethane foams, the surface tension of the liquid is reduced by the addition of
silicone surfactants. Figure 4-3 shows the surface tension isotherm which is the
dependence of 𝜎 on lnC [53], where 𝜎 is the surface tension of the solution, and C is
is the concentration of surfactant. The surface tension of the solution decreases with
increase of the concentration of surfactant molecules in the system. The concentration
at which the micelles formation starts is called critical micelle concentration (cmc). For
C lower than the cmc, surfactants are distributed between the bulk of the solution and
the surface. After C reaches cmc, all added ‘excess’ surfactants form micelles so that
the bulk concentration of the individual surfactant molecules is constant and equal to
the cmc. The surface concentration also reaches the saturation level.
Figure 4-3 Schematic representation of typical surface tension isotherm of water/surfactant solution
As the surface tension decreases, more air bubbles per unit volume of solution were
57
generated in the system. The energy required to generate the bubble surface with radius
r is 4π𝑟2𝜎. Surfactants with higher silicone/polyether ratios will give a lower surface
tension value and thus reduce bubble generation energy. As a result, a higher bubble
count was obtained after mixing for systems with a lower surface tension. For a molded
foam, at a fixed energy input, reduction of the surface tension of the liquid results in
the formation of more and necessarily smaller bubbles as the available surface area is
increased. For a free-rise foam, a reduction in surface tension can result in an increase
in foam volume and/or a decrease in bubble size. It has been shown that addition of a
silicone surfactant to a polyether polyol allows five to seven times more gas to be mixed
with the polyol than when the surfactant is absent. This increase in foam volume is
consistent with the reduction of liquid surface tension by the surfactant. The stability of
a foam is inversely proportional to the rate at which surface and gravitational energy is
released. Any process that reduces the surface area of a foam releases energy. These
processes include bubble coalescence and the diffusion of gas from smaller to larger
bubbles. Gravitational energy is released during the drainage of liquid down the foam.
For a surfactant to aid in the growth and stabilization of polyurethane foam, it must
reduce the surface tension of the foaming liquid, which is predominantly a polyether
polyol. The surface tension of these polyols ranges from 33 to 40 mN/m. This value is
so low that it cannot be further reduced by the adsorption of hydrocarbon-based
surfactants. Essentially, they are not surface active in this medium. However, silicone
surfactants can reduce the polyol surface tension to a much lower value of 21-25 mN/m
[54]. A requirement for these surfactants, allowing them to stabilize the foam, is to
58
reduce the surface tension of the liquid polyether polyols by 8-12 mN/m. The
adsorption of these surfactants at the polyol-air interface appears to yield a molecular
configuration of the surfactant where the siloxane portion is folded over itself. This
adsorption also increases the surface viscoelasticity, which aids in stabilizing the foam.
These surfactants also appear to be active at the water-polyol and urea-polyol interfaces.
This activity increases the miscibility of water in polyol and prevents a catastrophic
collapse of the foam after the onset of urea phase separation.
4.2 Methodology
Capillary rise method is used to measure surface tension of sample solutions.
Capillarity is the combined effect of cohesive and adhesive forces that causes water and
other liquids to rise in thin tubes or other constricted spaces. Inside a thin glass tube,
the adhesive force, the attraction between the water and the glass wall, draws water up
the sides of the glass tube to form a meniscus. The cohesive force, the attraction of the
water molecules to each other, then tries to minimize the distance between the water
molecules by pulling the bottom of the meniscus up against the force of gravity. A
simple relationship determines how far the water is pulled up the tube. The force
upwards due to the surface tension is given by the following relationship:
𝐹𝑢𝑝 = 𝜎 (2𝜋𝑟) cos 𝜃 Equation 4-1
In this relationship, 𝜎 is the liquid-air surface tension at 20℃ , 2πr is the
circumference of the tube, and θ is the contact angle of water on glass, a measure of the
attraction of the liquid to the walls. The opposing force down is given by the force of
gravity on the water that is pulled above the reservoir level.

59
𝐹𝑑𝑜𝑤𝑛 = 𝜌𝑔 (ℎ𝜋𝑟2) Equation 4-2
Here, 𝜌 = 1000 kg/m3 is the density of water, 𝑔 = 9.8 m/s2 is the acceleration due
to gravity, and (hπr2) is the volume of the water in the column above the reservoir.
One method to measure the surface tension of a liquid is to measure the height the
liquid raises in a capillary tube. By setting the two forces above equal, surface tension
can be calculated. For pure water and clean glass, the contact angle is nearly zero. In a
typical lab, this may not be the case, but 𝜃 is small and we assume that cos 𝜃 is close
to 1.
𝜎 =𝜌𝑔𝑟
2 ℎ
cos𝜃≈𝜌𝑔𝑟
2ℎ Equation 4-3
Water/surfactant and polyol/surfactant solutions with different surfactant loadings
were prepared and surface tension of these solutions were measured using capillary rise
method. A figure of surface tension versus ln(Csurf) was plotted to evaluate the
relationship between surface tension and surfactant concentration. Capillary tubes
(O.D.=1.00mm, I.D.=0.50mm, L=7.5cm) were used in the experiment.
Foam samples with different amounts of surfactant were prepared to evaluate the
relationship between surface tension and cell size. Foam samples with different mixing
time (5, 10, 15, 25 seconds) were also prepared and evaluated. The foam recipe was
listed in Table 4-1.
Table 4-1 Foaming formulation of rigid polyurethane foam
B-side Materials Weight/g
Polyol (MW:360, Fn:4.5) 35
Dimethylcyclohexylamine(Cat8 gelling catalyst) 0.12
Pentamethyldiethylenetriamine(Cat5 blowing catalyst) 0.32
Surfactant 0.1, 0.2, 0.4, 0.6
Fire Retardant 2
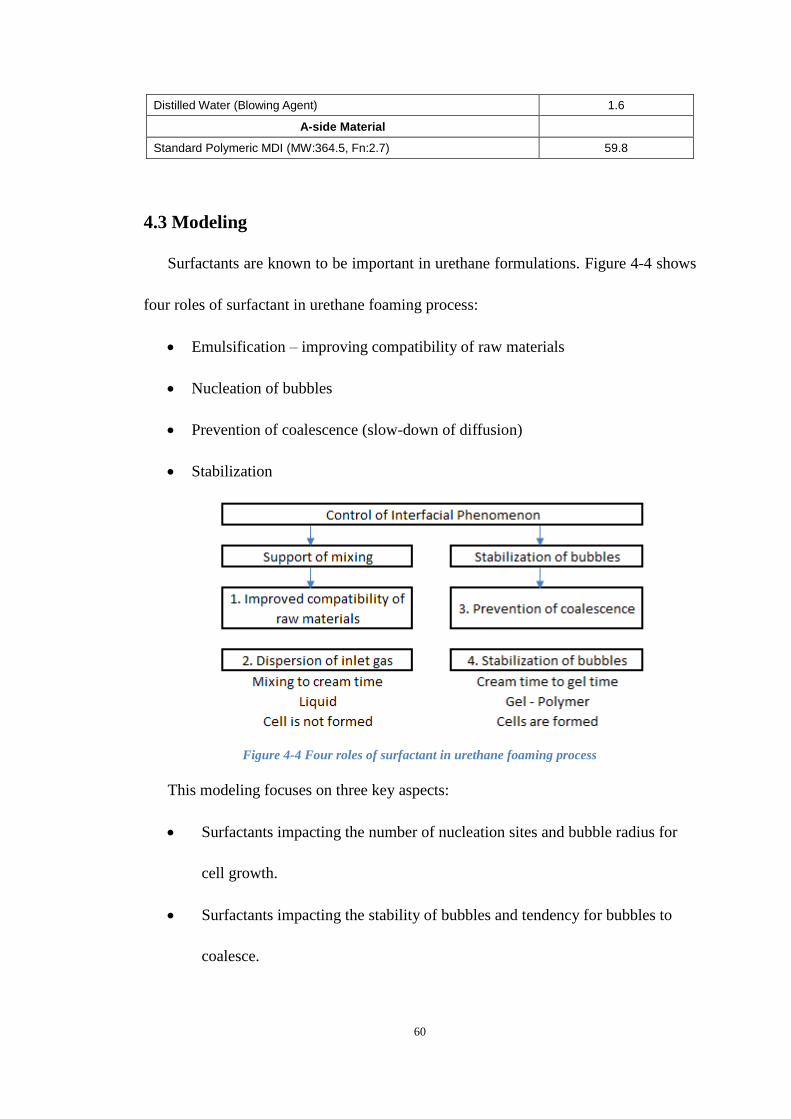
60
Distilled Water (Blowing Agent) 1.6
A-side Material
Standard Polymeric MDI (MW:364.5, Fn:2.7) 59.8
4.3 Modeling
Surfactants are known to be important in urethane formulations. Figure 4-4 shows
four roles of surfactant in urethane foaming process:
Emulsification – improving compatibility of raw materials
Nucleation of bubbles
Prevention of coalescence (slow-down of diffusion)
Stabilization
Figure 4-4 Four roles of surfactant in urethane foaming process
This modeling focuses on three key aspects:
Surfactants impacting the number of nucleation sites and bubble radius for
cell growth.
Surfactants impacting the stability of bubbles and tendency for bubbles to
coalesce.

61
Surfactants impacting the escape of bubbles through rising to the surface of
the forming foam.
4.3.1 Bubble Growth
Based on the previous research results mentioned above, several assumptions were
made in the modeling calculations: (1) Bubbles are introduced by the process of mixing
the foam components and are sufficient to account for all of the cells in the final foam.
(2) Nucleation of bubbles is essentially absent and is thermodynamically unfavorable
under the conditions of foam formation. New bubbles are not seen during the formation
of a foam. It is simpler for carbon dioxide gas to diffuse from solution to existing
bubbles than to nucleate new bubbles. (3) When bubble introduction by mixing is
deliberately held to a minimum, the rate of carbon dioxide evolution is decreased
considerably and the foam produced is grossly coarse celled.
According to the results of Kanner’s study on average bubble size distribution [52],
the initial bubble radius was found to be 3.4*10-3 cm and a cell count of 1.4*108 in the
solution with a surface tension of 25 mN/m after 10 seconds mixing at 1200 rpm. The
energy adsorbed by these generated bubbles were:
W = Nc ∗ 4 ∗ π ∗ 𝑟2 ∗ 𝜎 = 1.4 ∗ 108 ∗ 4 ∗ π ∗ (3.4 ∗ 10−3)2 ∗ 0.025 = 0.05 J
where W is the energy introduced by mixing which is in direct proportional to mixing
time at a constant stirring speed, Nc is the number of nucleation sites, r is the bubble
radius and 𝜎 is the surface tension of solutions. Assume that the same stirring
condition was applied and therefore the same energy was introduced. Then the number
of nucleation sites will be dependent on the surface tension of solutions.

62
Nc =𝑊
4∗π∗𝑟2∗𝜎 Equation 4-4
During the bubble growth process, a force balance can be written at the bubble
surface [55]:
𝑝𝑏 − 𝑝𝑎 + 𝜏𝑟𝑟 =2𝜎
𝑟 Equation 4-5
in which 𝑝𝑏 is the pressure in the bubble, 𝑝𝑎 is the pressure of the liquid at the bubble
surface, and 𝜏𝑟𝑟 is the radius component of viscous stress tensor in the liquid. The
radius component of the stress tensor within the bubble was neglected since we take the
gas viscosity to be zero. And in a Newtonian liquid:
𝑝∞ − 𝑝𝑎 = −4𝜇 ∗1
𝑟∗𝑑𝑟
𝑑𝑡 Equation 4-6
where 𝑝∞ is the ambient pressure and 𝜇 is the Newtonian viscosity. Substitution of
Equation 4-6 into Equation 4-5 results in an expression:
𝑝𝑏 − 𝑝∞ −2𝜎
𝑟= 4𝜇 ∗
1
𝑟∗𝑑𝑟
𝑑𝑡 Equation 4-7
Based on the ideal gas law, inner bubble pressure can also be obtained. Equation 4-7
was calculated in the MATLAB program in addition to the temperature and foam height
profiles [19, 26, 28]. Figure 4-5 shows the algorithm for calculating bubble radius
during foaming process.

63
Figure 4-5 Algorithm for calculating bubble radius during foaming process
4.3.2 Film Thinning
The rate of thinning of films affects the stability and lifetimes of dispersions such
as foams and emulsions. Reynolds, in his century-old investigation of the theory of
lubrication, derived the following expression for the velocity of thinning of a plane-
parallel, tangentially immobile fluid film [56],
𝑉𝑅𝑒 = −𝑑ℎ
𝑑𝑡=
2ℎ3
3𝜇𝑟2∆𝑃 Equation 4-8
where ℎ is the film thickness, 𝑡 is the time, 𝜇 is the dynamic viscosity, 𝑟 is the
radius of the film, and ∆𝑃 is the pressure drop causing the drainage. The driving force
per unit area (∆𝑃) consists of the capillary pressure, buoyancy (if present), and the
disjoining pressure that owes its origin to the London van der Waals interactions and
becomes significant only for very thin films (ℎ<1000�̇�). While numerous investigations
regarding foam and emulsion films have employed Reynold’s equation, recent
experimental studies have all concluded that Equation 4-8 is essentially incorrect for
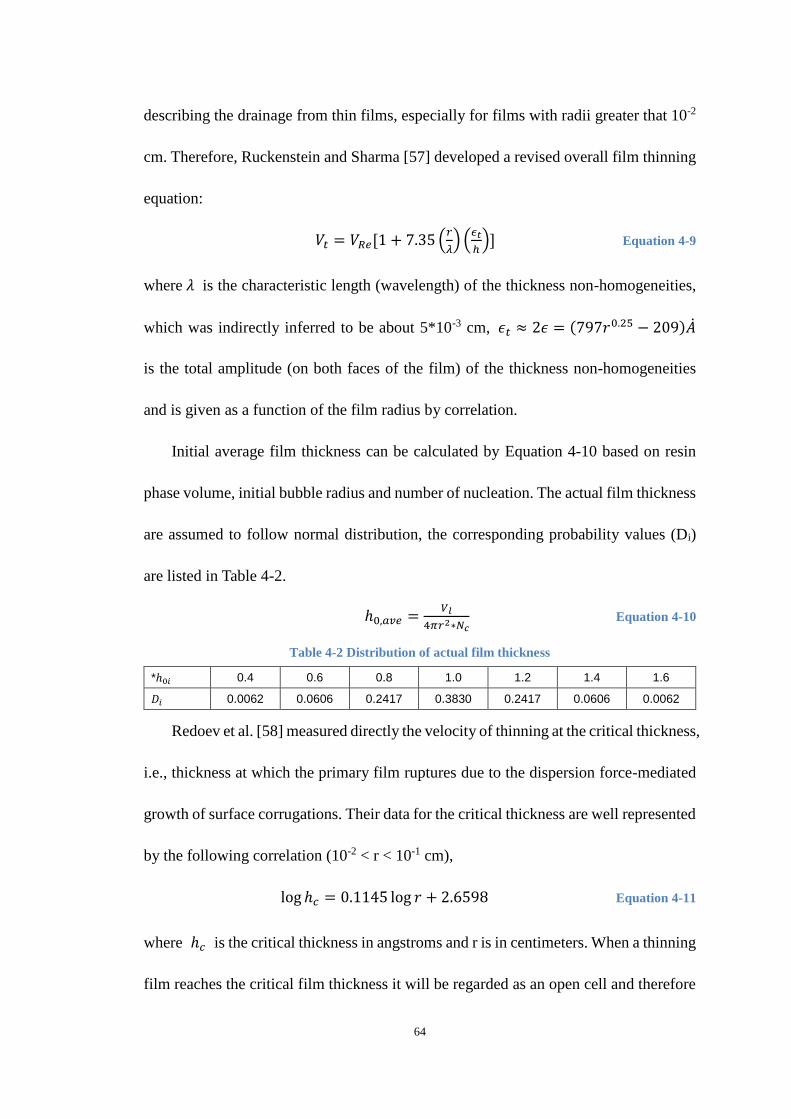
64
describing the drainage from thin films, especially for films with radii greater that 10-2
cm. Therefore, Ruckenstein and Sharma [57] developed a revised overall film thinning
equation:
𝑉𝑡 = 𝑉𝑅𝑒[1 + 7.35 (𝑟
𝜆) (𝜖𝑡
ℎ)] Equation 4-9
where 𝜆 is the characteristic length (wavelength) of the thickness non-homogeneities,
which was indirectly inferred to be about 5*10-3 cm, 𝜖𝑡 ≈ 2𝜖 = (797𝑟0.25 − 209)�̇�
is the total amplitude (on both faces of the film) of the thickness non-homogeneities
and is given as a function of the film radius by correlation.
Initial average film thickness can be calculated by Equation 4-10 based on resin
phase volume, initial bubble radius and number of nucleation. The actual film thickness
are assumed to follow normal distribution, the corresponding probability values (Di)
are listed in Table 4-2.
ℎ0,𝑎𝑣𝑒 =𝑉𝑙
4𝜋𝑟2∗𝑁𝑐 Equation 4-10
Table 4-2 Distribution of actual film thickness
*ℎ0𝑖 0.4 0.6 0.8 1.0 1.2 1.4 1.6
𝐷𝑖 0.0062 0.0606 0.2417 0.3830 0.2417 0.0606 0.0062
Redoev et al. [58] measured directly the velocity of thinning at the critical thickness,
i.e., thickness at which the primary film ruptures due to the dispersion force-mediated
growth of surface corrugations. Their data for the critical thickness are well represented
by the following correlation (10-2 < r < 10-1 cm),
log ℎ𝑐 = 0.1145 log 𝑟 + 2.6598 Equation 4-11
where ℎ𝑐 is the critical thickness in angstroms and r is in centimeters. When a thinning
film reaches the critical film thickness it will be regarded as an open cell and therefore

65
closed cell content can be calculated based on final film thickness. Figure 4-6 presents
the algorithm for calculating film thickness and closed cell content.
Figure 4-6 Algorithm for calculating film thickness and closed cell content

66
4.3.3 Bubble Rising
Within a certain center distance, the deformation and coalescence process are
similar, the rising velocity of lower bubble is greater than the upper bubble, coalescence
time of two bubbles with same diameters increases as the center distance increases.
To two bubbles with different diameters within a certain center distance, when the
bigger bubble located beneath at the initial time, the bigger bubble move upward all the
way while the smaller bubble moves upward first and then moves downward before
two bubbles coalescence. However, when the smaller bubble located beneath at the
initial time, after velocities of two bubbles become stable, the velocity of the bigger
bubble is greater than the smaller bubble, so bubble coalesce cannot happen.
The rise of a bubble in liquid is a function of several parameters viz. bubble
characteristic (size and shape), properties of gas-liquid systems (density, viscosity,
surface tension, concentration of solute, density difference between gas and liquid),
liquid motion (direction), and operating conditions (temperature, pressure, gravity) [59].
In surface tension force dominant range:
𝑉𝑟 = √2𝜎
𝜌𝐿𝑑+(𝜌𝐿−𝜌𝐺)𝑔𝑑
2 Equation 4-12
In viscosity dominant range:
𝑉𝑟 =1
18
𝑔𝑑2(𝜌𝐿−𝜌𝐺)
𝜇𝐿 Equation 4-13
where 𝑔 is the acceleration due gravity, 𝑑 is the diameter of bubble, 𝜇𝐿 is the
dynamic viscosity of liquid, 𝜌𝐿 is the density of liquid and 𝜌𝐺 is the density of gas.

67
4.4 Results and Discussion
4.4.1 Experimental Data
Surface tension was plotted as a function of ln(Csurf) in Figure 4-7. Surface tension
of solution decreased as surfactant amount increasing. Within the range of surfactant
amounts studied, surface tension was a linear function of ln(Csurf) and therefore the
surface tension can be calculated based on the concentration of surfactant in solutions
as:
σ = −1.4378 ∗ ln 𝐶𝑠𝑢𝑟𝑓 + 21.046 Equation 4-14
Figure 4-7 Surface tension versus ln(Csurf) in different solutions
Figure 4-8 presents temperature profiles of the foams with different surfactant
loadings. The results indicated surfactant had no impact on reaction kinetics and
thermodynamics which agreed with the assumption made in modeling calculation.
y = -1.4378x + 21.046R² = 0.9925
0.00
10.00
20.00
30.00
40.00
50.00
60.00
70.00
80.00
90.00
-7 -6 -5 -4 -3 -2 -1
Surf
ace
Te
nsi
on
[m
N/m
]
ln C
Water
Polyol 1
Polyol 2
Mixture

68
Figure 4-8 Temperature profiles of foams with different concentration loadings
Figure 4-9 shows the longitudinal sections of the foams with different surfactant
loadings. Obviously foam #5 had the lowest surfactant loading thus leading to the least
nucleation sites (number of bubbles). As the volume changes were the same, the
bubbles in foam #5 had the largest radius. Differences between foams #6-#8 cannot be
told easily by naked eyes and therefore microscope observations were performed
(Figure 4-10). The bubble size of foam #5 was too big to take a microscope observation
and therefore was not presented.
Figure 4-9 Longitudinal sections of foams with different surfactant loadings
0
20
40
60
80
100
120
140
160
180
0 50 100 150 200 250 300 350 400
Tem
p [
C]
Time [s]
Run 5 0.1gRun 6 0.2gRun 7 0.4gRun 8 0.6g
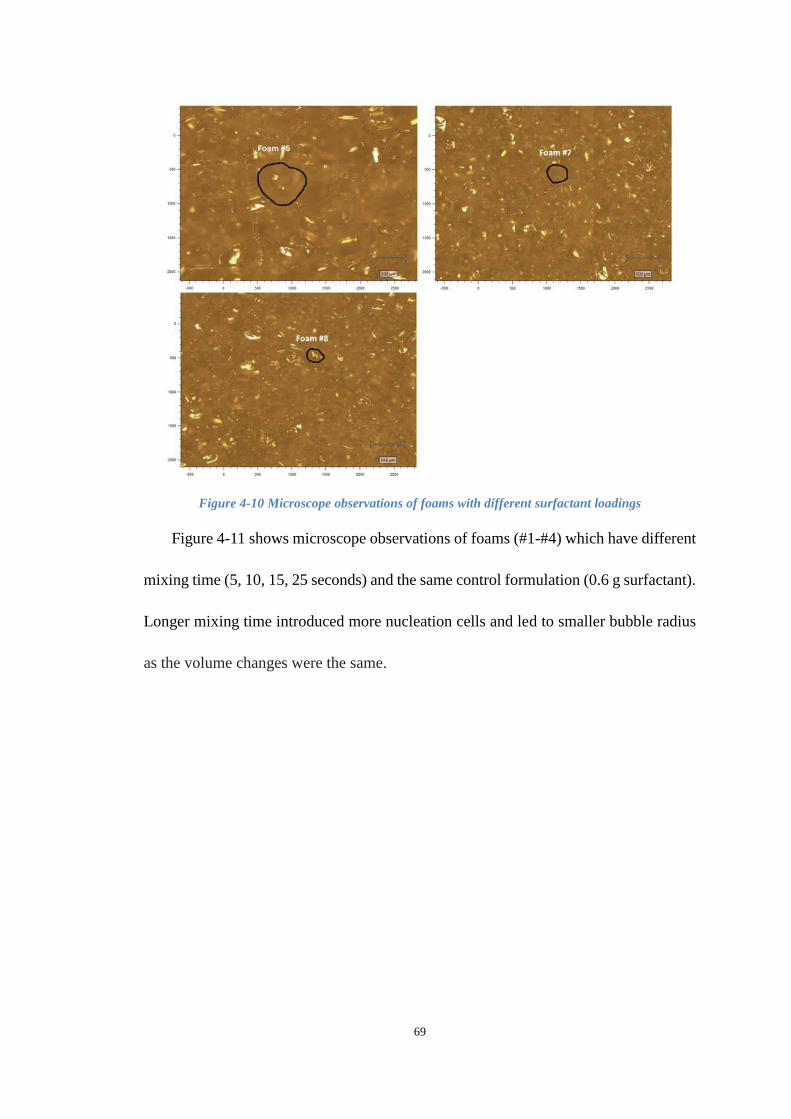
69
Figure 4-10 Microscope observations of foams with different surfactant loadings
Figure 4-11 shows microscope observations of foams (#1-#4) which have different
mixing time (5, 10, 15, 25 seconds) and the same control formulation (0.6 g surfactant).
Longer mixing time introduced more nucleation cells and led to smaller bubble radius
as the volume changes were the same.
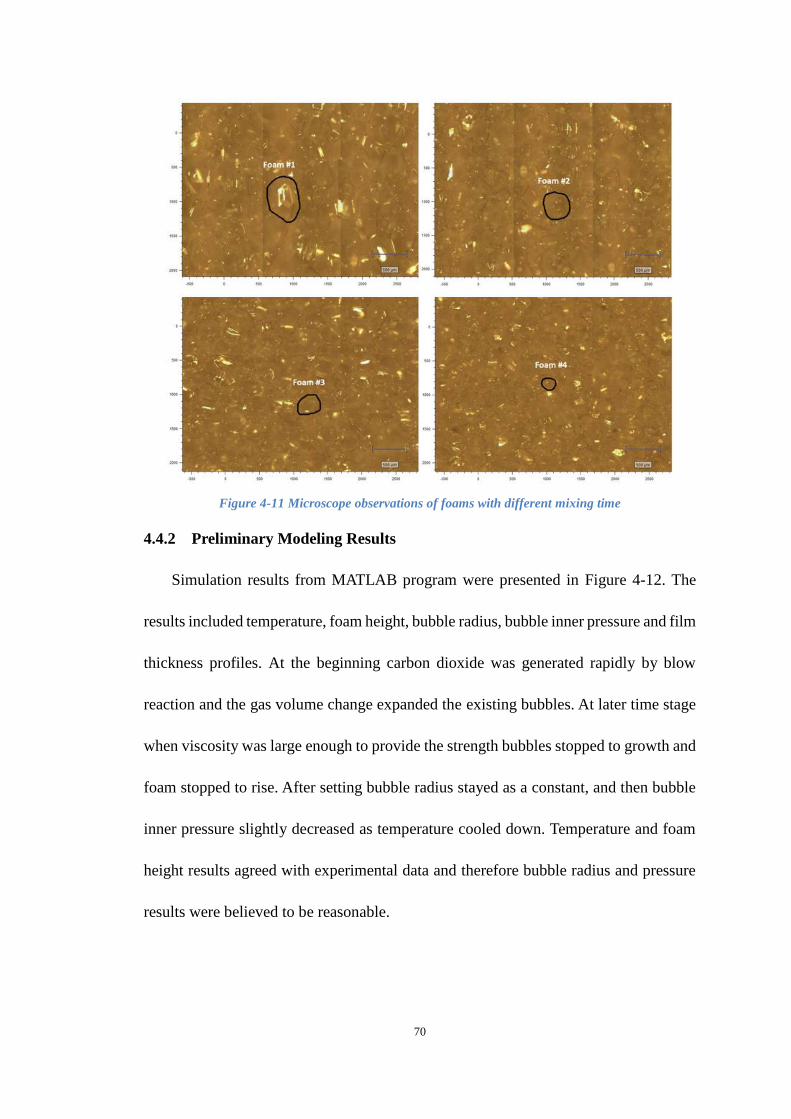
70
Figure 4-11 Microscope observations of foams with different mixing time
4.4.2 Preliminary Modeling Results
Simulation results from MATLAB program were presented in Figure 4-12. The
results included temperature, foam height, bubble radius, bubble inner pressure and film
thickness profiles. At the beginning carbon dioxide was generated rapidly by blow
reaction and the gas volume change expanded the existing bubbles. At later time stage
when viscosity was large enough to provide the strength bubbles stopped to growth and
foam stopped to rise. After setting bubble radius stayed as a constant, and then bubble
inner pressure slightly decreased as temperature cooled down. Temperature and foam
height results agreed with experimental data and therefore bubble radius and pressure
results were believed to be reasonable.

71
Figure 4-12 Simulation results from MATLAB program
Mixing time and surfactant amount were changed respectively to get simulated
bubble radius of foams #1-#8. Twenty bubbles were chosen from Figure 4-10 and
Figure 4-11 to calculate average experimental radius. Figure 4-13 shows comparison of
experimental and modeling bubble radius as mixing time increasing. Figure 4-14 shows
comparison of experimental and modeling bubble radius as surfactant amount
increasing.
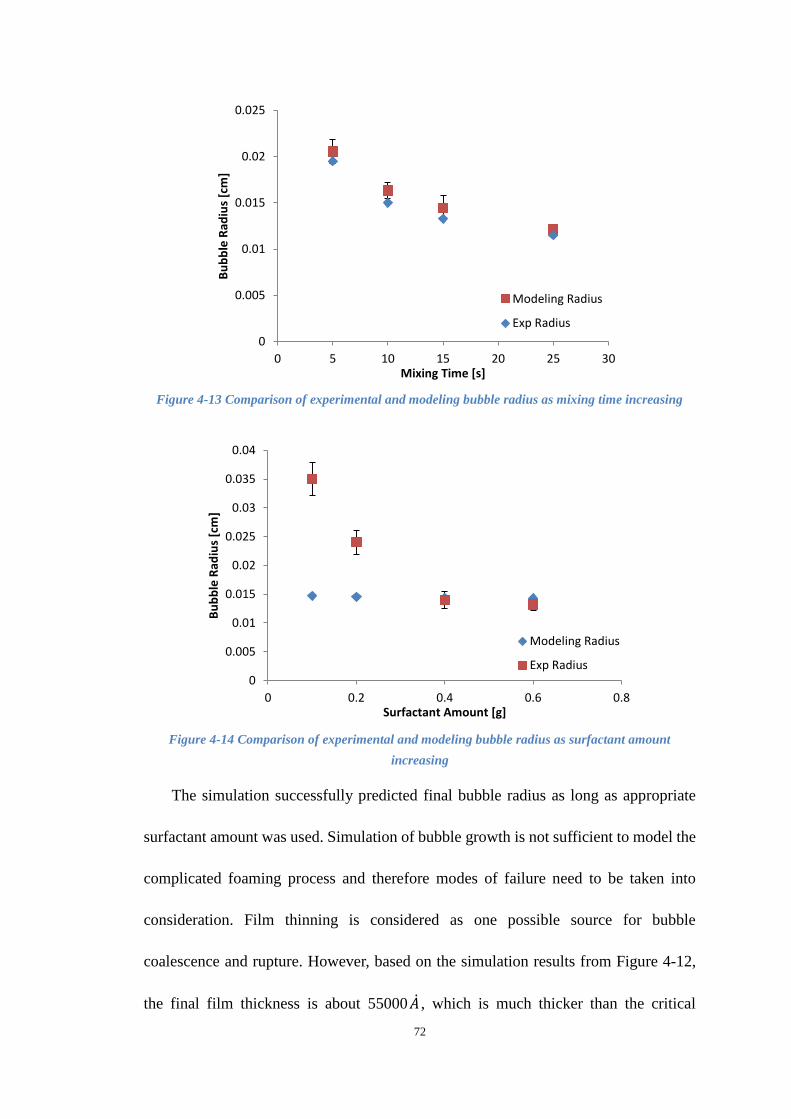
72
Figure 4-13 Comparison of experimental and modeling bubble radius as mixing time increasing
Figure 4-14 Comparison of experimental and modeling bubble radius as surfactant amount
increasing
The simulation successfully predicted final bubble radius as long as appropriate
surfactant amount was used. Simulation of bubble growth is not sufficient to model the
complicated foaming process and therefore modes of failure need to be taken into
consideration. Film thinning is considered as one possible source for bubble
coalescence and rupture. However, based on the simulation results from Figure 4-12,
the final film thickness is about 55000 �̇� , which is much thicker than the critical
0
0.005
0.01
0.015
0.02
0.025
0 5 10 15 20 25 30
Bu
bb
le R
adiu
s [c
m]
Mixing Time [s]
Modeling Radius
Exp Radius
0
0.005
0.01
0.015
0.02
0.025
0.03
0.035
0.04
0 0.2 0.4 0.6 0.8
Bu
bb
le R
adiu
s [c
m]
Surfactant Amount [g]
Modeling Radius
Exp Radius

73
thickness 281�̇�. This indicates the critical thickness is too thin to be generally reached
within the bubble radius range in this study. Experimental film thickness was measured
based on Figure 4-10 and Figure 4-11. The actual film thickness was about 50000�̇�,
which means the simulation calculation was accurate. Therefore, this mode of failure
was proved not happening in rigid foams.
Another possible reason causing foam failure may due to bubble rising during
foaming process. Bubbles close to top surface may escape from the resin phase due to
buoyancy and bubbles far from top may coalesce with each other because a larger
bubble has a faster rising velocity than a small bubble which leads them to meet and
coalesce. Moreover, if a bubble rises at a critical velocity it may rupture due to shear
force. Detailed impact of bubble rising on foam failure will be studied further. Figure
4-15 presents single bubble rising velocity versus time during foaming process and the
impact of blowing agent loading was evaluated. Table 4-3 summarizes the modes of
foam failure and current status of these studies.
Figure 4-15 Impact of blowing agent loading on single bubble rising velocity
0.00E+00
2.00E-03
4.00E-03
6.00E-03
8.00E-03
1.00E-02
1.20E-02
1.40E-02
0 50 100 150 200
Ris
ing
Ve
losi
ty [
cm/s
]
Time [s]
water=0.5gwater=1gwater=1.5gwater=2g

74
Table 4-3 Modes of foam failure and current status of studies
RELATED TO CELL SIZE (Category 1)
Course cell structure leading to poor
thermal conductivity and low
compression strength.
More/better surfactant increases the
number of cell nucleation sites
resulting in smaller gas cells in the
foam.
RELATED TO RATE OF RISE OF BUBBLES IN RESIN (Category 2)
Bubbles rise in resin “liquid” and
eventually escape through rupture of
top surface of the foam.
More/better surfactant leads to
smaller gas bubbles that rise slower
than large gas bubbles.
Simulation can be used to better
understand how viscosity and bubble
size translate to changing rise
velocities of bubbles during foaming.
Is there a critical bubble buoyancy-
driven rise velocity that leads to
failure?
Resin cures too slowly resulting in
low viscosity that allows bubbles to
rise and escape.
Rise of bubbles leads to
concentration of bubbles at top of
resin where coalescing occurs in
addition to surface rupture and
escape.
RUPTURE OF CELLS DISPERSED IN MATRIX (Category 3)
Bubble growth causing film thinning Not applied. Critical thickness is too
thin to be generally reached.
*Bubble coalescing due to different
rising velocity
Questionable. Bubble sizes and
locations need to be specified and
discussed.
*Bubble rupture due to shear force Questionable. Critical bubble rising
velocity needs to be identified.
Cascade collapse of rigid foam OR
the desired “blow” of a flexible foam.
Complex phenomena. Could be due
to pressure buildup in cells,
herniating of cells at surface of foam,
and cascade herniating-type failures
as pressures in upper cells reduce.
RELATED TO FINAL RESIN MORPHOLOGY
Resin does not adequately cure to
form a strong solid/elastic phase.
Not substantially related to
surfactant.

75
4.5 Conclusion
An initial critical analysis of how surfactants impact urethane foam-forming
processes has been performed which included a survey of literature, summary of
available theory/models, and preliminary simulations. The following conclusions are a
result of this analysis.
Surfactants reduce the surface tension of bubble-resin interfaces resulting in the
stabilization of higher concentration of bubbles and bubble nucleation sites in
resin mixtures.
The combination of adequate mixing (associated energy input) and surfactants
is necessary to form sufficient bubble nucleation sites at the onset of the
urethane-foam-forming process to form the desired fine cell structures in quality
urethane foams. Up to the limit of “adequate” mixing and surfactant loadings,
longer mixing time and higher surfactant loading leads to more bubble counts
and smaller bubble radius.
Within the appropriate range of surfactant loadings, surface tension is a linear
function of ln(Csurf) and therefore the surface tension can be calculated based on
the concentration of surfactant in solutions.
Surfactants have minimal impact on reaction kinetics and thermodynamics for
systems where solubility of the reagents is not an issue.
The MATLAB simulation successfully predicts bubble radius, inner pressure
and film thickness during foaming process in addition to temperature and foam
height profiles as long as surfactant is sufficient.
76
The critical film thickness (as predicted by Redoev’s model[58]) is too thin to
be generally reached within the bubble radius range in this study.
The mechanisms through which surfactants lead to foam failure is not well
validated in literature suggesting that the mechanisms are not well understood beyond
the basic concept that surfactants can slow down the coalescing and rupturing of
bubbles/cells in a foam. The key to better understanding the mechanisms through which
surfactants lead to successful foam formation likely lies in the analysis of modes of
foam failure and how surfactants reduce the modes of failure.
A conclusion of this analysis is that the impact of surfactants in foam formulations
can be grouped into three categories with each having different methods to critically
investigate and understand as follows:
Category 1 – Role of surfactants in forming cell nucleation sites where the role
of the surfactant is critically couples with the energy input during mixing
to form nucleation sites.
Category 2 – The surfactant plays a role in impacting nucleation sites, but after
that point the inter-relationship of cell growth, viscosity, and buoyancy
lead to a velocity for bubble rise in the system. A rise velocity beyond a
critical value could lead to failure.
Category 3 – As pressure builds in foam that is not fully set, weak spots of cells
at the top of the foam could urinate leading to either a cascade collapse
or the desire “blow” of a flexible foam.

77
Both Category 2 and Category 3 types of failures involve the complex inter-
relationship of how the cell grows during foaming, how pressure in the cell increases
during foaming, and how viscosity increases. For these types of failures, no simply
theory or model will adequately quantify the failure; simulation is needed.

78
5. COMPUTATIONAL STUDY ON REACTION
ENTHALPIES OF URETHANE-FORMING REACTIONS
5.1 Introduction
Reaction of alcohols with isocyanates to form urethanes is the basis of the
polyurethane industry [49] with annual sales in the tens of billions of dollars. The
simulation of thermosets formed in these reactions includes generating solutions under
the constraints of dozens of differential equations under material balance, energy
balance, and constitutive relationships. The many equations and the large number of
oligomers with their isomers result in a problem-solving environment where the
number of number of model parameters greatly exceed what can be reasonably obtained
from fitting parameters to experimental data.
Heuristics such as those provided in Table 5-1 provide a starting point for
simulations. These heuristics allowed for the proof-of-concept by comparison of
simulation results on temperature and foam height profiles to justify further efforts to
increase accuracy and provide increasingly useful results.
Table 5-1 Heuristics for initial efforts in simulating urethane-foaming reactions
Polyols:
Polyols consist of different ratios of primary (Xp), secondary(Xs) and
hindered-secondary hydroxyl (XHS) where the same type of hydroxyl in different
polyols have the same reaction rate constants (k0) [26]
The heat of reaction is assumed to be the same for independent of XP, XS,
and XHS
Flory’s assumption is assumed to hold where the reactivity a hydroxyl group
is independent of the size of molecule to which the hydroxyl group is attached
Catalytic reaction rate constants (k0) are unique to the catalyst [19, 60]
Catalysts:
Catalysts will not react with any components in the system
The structure and reactivity of catalysts will not change during the reaction
process

79
Catalysts will reduce activation energy (ΔE) relative to non-catalytic
reaction
Catalysts have no impact on heat of reaction (ΔH)
There is no interaction between the catalysis impact from two or more
catalysts
Others:
Use of step growth mechanisms as elementary processes can be used to obtain
reaction rate expressions for the reactivity of moieties
All isocyanate groups have the same reactivity
Other additives (surfactant and fire retardant) have no catalysis impact on
reactions
Foam has a lower heat transfer coefficient than solid resin
Foam height (density) can be estimated by assuming ideal gas behavior, a
modified Raoult’s law equilibrium and an overall efficiency in gas cell formation
[27]
Use of Xp and Xs - The reaction parameters of polyols are predominantly
influenced by the fraction of primary, secondary, and hindered-secondary hydroxyl
groups. This characterization reduces the number of parameters needed to characterize
a polyol’s reactivity and provides useful insight into how a polyol will react in a
formulation—these are more meaningful that Arrhenius parameters to most researchers
in the area.
In addition, impacts of catalysts are expected to be less dependent on the actual
polyol and more dependent on the impact of primary, secondary, and hindered-
secondary alcohols. Early work on simulation by Zhao et al has extended this approach
of characterizing reactivity base on type of hydroxyl moiety to the characterizing of the
impact of catalysts on reactivity [19, 26, 28, 60]. This approach has utility for
extrapolating the performance of a catalyst from one polyol to another.
The utility of the simulation approach resides in using physical properties and fitted
parameters to pure components (such as the fraction of primary alcohol) to perform
simulation on the multitudes of useful combinations of the components in

80
formulations/recipes. For fitting parameters such as the fraction of primary versus
secondary alcohol content, fitting parameters to experimental data can be performed
with confidence due to the reactivity of the primary alcohols being more than an order
of magnitude greater than the reactivity of the secondary alcohols. These parameters
that can be readily determined by fitting to experimental data could be characterized as
“first tier” fitted parameters.
A “second tier” of parameters that are not as readily obtained by curve fitting
emerge, but are needed to improve the accuracy of simulation, especially when
extrapolating results outside the range where accuracy has been verified. Example
second tier parameters include:
Impact of polymer size on moiety reactivity (Flory’s assumption is not impact)
Variations of heat of reaction with primary, secondary, and hindered secondary
alcohol groups.
Generalizations that can be made on the impact of catalysts (e.g. is the reduction
in activation energy the same for reactions with secondary alcohols as with
primary alcohols)
This chapter is on an approach that uses molecular modeling to determine the
sensitivity of parameters to these second tier variations in molecules. When the
molecular modeling indicates little variation in parameters, the simulation results are
put forward as verification that the first order approximations are adequate. When the
molecular modeling indicates that parameters (e.g. heat of reaction) vary by more than
about 1%, verification of the variations is pursued so as to improve the accuracy of the

81
simulation.
Reaction enthalpies and rate constants for isocyanate-alcohol reactions catalyzed
by tertiary amines were modelled by Chang [1] and Baker [17]; they reported relative
rate constants with respect to different catalyzed conditions. Baser et al developed
theoretical models for physical blowing agent blown rigid polyurethane foam formation
[46] and water-blown polyurethane foams [45]. All the above models are based on an
assumption that the reactivity of two molecules having different chain lengths (or
molecular weights) are the same as long as they have the same type of functional groups.
They reported the enthalpy of isocyanate-polyol reaction as a constant regardless of
location of functional groups, molecular size and chain length.
Other research showed the relationship between reaction enthalpy/rate constant and
chain length. Lovering et al [61] performed thermochemical studies on alcohol-
isocyanate reactions. They reacted isocyanate with n-butanol, s-butanol and i-butanol
respectively and measured the heats of reaction using a differential microcalorimeter of
the Tian-Calvet type. It was found that the heat of reaction decreased in the order normal>
iso> secondary.
More-detailed studies on the impact of molecule size on reactivity are available with
other chemistries. Figure 5-1 shows the plot of esterification rate constant, kA vs.
average polymer chain length, N for CH3CH2OH + H(CH2)NCOOH [62], the reaction
rate was linearly decreasing as the chain length number increasing from 1 to 3 and it
tended to a constant after the chain length number reaching 4 or more. The phase
transition and viscoelastic transition of polymer may influence the reaction of polymer

82
chain [63, 64], but in this study the structure of polymer chain was assumed stable.
Figure 5-1 Plot of esterification rate constant, kA vs. average chain length, N for CH3CH2OH +
H(CH2)NCOOH
Zhao [19, 28, 60] and Rima [26] have initiated an approach to simulate near-
adiabatic foam-forming reactions that included catalysis impact and treat polyols as
fraction of primary, secondary and hindered-secondary hydroxyl. Large differences in
Arrhenius parameters allowed experimental data to be used to identify parameters
specific to primary, secondary, and hindered secondary hydroxyl groups. However, the
uncertainty of the fitted parameters for enthalpies of reaction relative to data did not
justify the use of different values for the heats of reaction. The introduction of
computation study on this topic can provide more information on how sensitive the
heats of reaction are to alcohol moiety isomers.
Several computational studies have been performed on the general characteristics
0
0.0005
0.001
0.0015
0.002
0.0025
0 5 10 15 20Chain Length: N

83
of urethane formation reactions [7, 14, 65-67]. Early mechanistic studies on urethane
formation suggest that the alcoholysis reaction occurs either via a concerted mechanism
or stepwise mechanism. In the concerted mechanism, the addition of alcohol is carried
out across the N=C bond of isocyanate and immediately results in the product (Figure
5-2a). In the stepwise path, the additional of the alcohol across the C=O bond of
isocyanate yields an enol intermediate, which can tautomerize via a proton transfer to
give the urethane product (Figure 5-2b). The free energy profiles calculated by Coban
et al [68] showed that the concerted path is more likely to occur than the stepwise route.
Therefore the concerted path structures were used for calculations in this study.
Figure 5-2 Proposed reaction mechanisms for the alcoholysis reaction of isocyanate. (a) Concerted
mechanism, (b) Stepwise mechanism.
Urethane reactions have been extensively studied with PM3 semi-empirical method
[68, 69], as well as ab initio calculations [70, 71]. The most extensive semi-empirical
studies are (B3LYP/6-31 + G(d,p)) of Coban et al [68]. They used density functional

84
theory (DFT) calculations to calculate rate constant ratios (k1/k2) in which k1 is the rate
constant of the first alcohol attack on the diisocyanate molecule and k2 is the rate
constant of the second alcohol attack on the diisocyanate molecule. Raspoet et al [71]
compared experimental data and theoretical results obtained by ab initio MO
calculations. They found the bulk solvent effect, which is treated by a polarizable
continuum model (PCM), does not affect the preference of the alcohol to attach across
the N=C bond as pointed out by the gas-phase values.
This work is a computational study on the alcoholysis reaction during polyurethane
foaming process. Different aromatic isocyanates (2,4-TDI, 2,6-TDI, 2,4-MDI, 4,4-MDI)
were considered to react with 1-Butanol, 2-Butanol, and tert-Butanol; and so, to
calculate the reaction enthalpies. Impact of functional group location, molecular size
and chain length on reaction enthalpies were evaluated based on the computational
results. The impact of conformations will not be discussed in this work because it can
be neglected comparing to the impact of molecular sizes and configurations.
Computational results were used to improve the database of kinetic and thermodynamic
parameters used in simulation studies [19, 26, 28, 60].
5.2 Methodology
The Gaussian 09 package was used to speed up calculations compared to those
using Slater-type orbitals, a choice made to improve performance on the limited
computing capacities of then-current computer hardware for Hartree-Fock calculations.
The computations were performed on the HPC resources at the University of Missouri
Bioinformatics Consortium (UMBC). Chemical structures were optimized at the

85
B3LYP level using a 6-31G(d,p) basis set in the gas phase. Chemical geometries were
input and the structures were subjected to vibrational frequency analysis toward their
characterization as local minima. Throughout this paper, calculated bond length are
given in angstroms, calculated bond angles in degrees, total enthalpies in hartrees, and
zero point energies and calculated relative enthalpies, unless otherwise stated, in
kilojoules per mol.
The solvent effects were studied using a single-point Integral-Equation-Formalism
Polarizable Continuum Model (IEF-PCM) to make calculations in toluene (which is
used as a solvent in some of the experimental studies to avoid over heat) and benzene.
Hartree-Fock and MP2 were also calculated using 6-31G(d,p) basis set to verify
accuracy of the results. SPARTAN, GAMESS and MOPAC calculations will be
performed in the future study to verify the results obtained by Gaussian.
The general computation procedures can be summarized as five steps:
1. Draw chemical structures (reagents and products)
2. Optimized chemical geometries
3. Calculate total electronic and thermal enthalpies using Gaussian
4. Calculate relative enthalpies corrected by ZPEs
5. Compare reaction enthalpies of all reactions
Simulations were performed on the reactants, transition states, and products. Figure
5-3 shows the molecular models and how the reaction enthalpy was calculated from the
reactants and products.
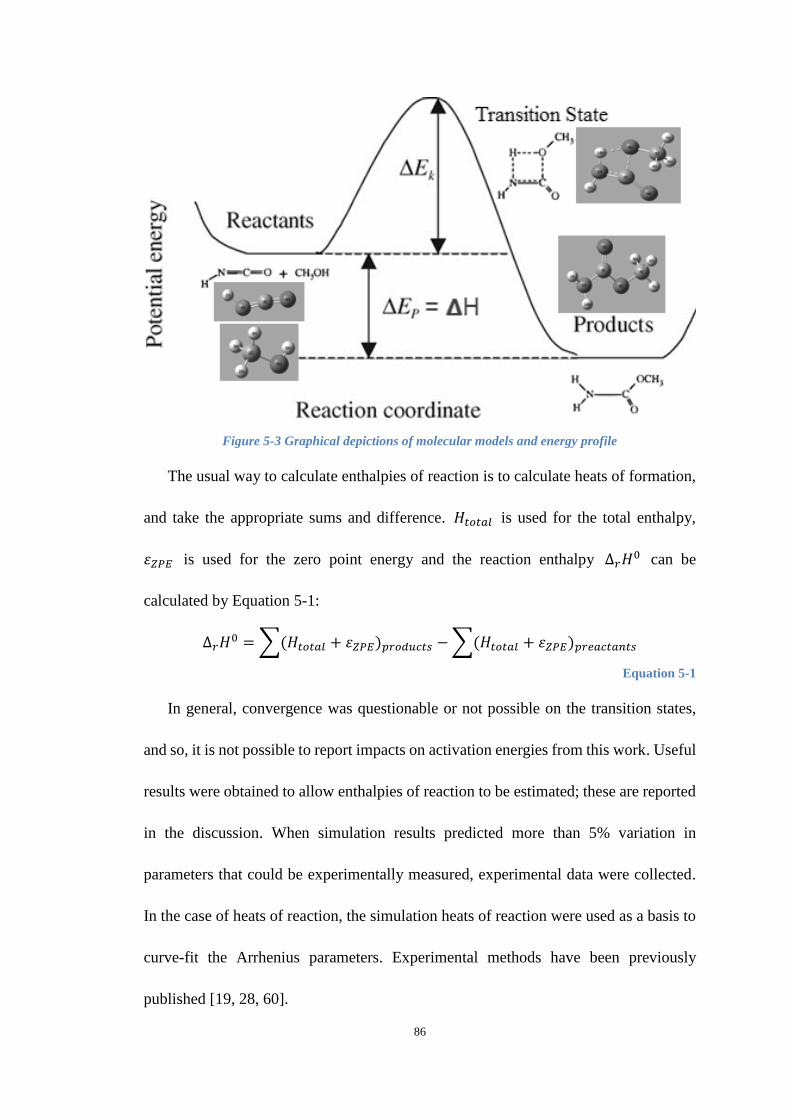
86
Figure 5-3 Graphical depictions of molecular models and energy profile
The usual way to calculate enthalpies of reaction is to calculate heats of formation,
and take the appropriate sums and difference. 𝐻𝑡𝑜𝑡𝑎𝑙 is used for the total enthalpy,
𝜀𝑍𝑃𝐸 is used for the zero point energy and the reaction enthalpy ∆𝑟𝐻0 can be
calculated by Equation 5-1:
∆𝑟𝐻0 =∑(𝐻𝑡𝑜𝑡𝑎𝑙 + 𝜀𝑍𝑃𝐸)𝑝𝑟𝑜𝑑𝑢𝑐𝑡𝑠 −∑(𝐻𝑡𝑜𝑡𝑎𝑙 + 𝜀𝑍𝑃𝐸)𝑝𝑟𝑒𝑎𝑐𝑡𝑎𝑛𝑡𝑠
Equation 5-1
In general, convergence was questionable or not possible on the transition states,
and so, it is not possible to report impacts on activation energies from this work. Useful
results were obtained to allow enthalpies of reaction to be estimated; these are reported
in the discussion. When simulation results predicted more than 5% variation in
parameters that could be experimentally measured, experimental data were collected.
In the case of heats of reaction, the simulation heats of reaction were used as a basis to
curve-fit the Arrhenius parameters. Experimental methods have been previously
published [19, 28, 60].

87
5.3 Results and Discussion
5.3.1 Location and Molecular Size of Isocyanate Groups
Figure 5-4 presents examples of isocyanates used in this study. The impact of
isocyanate group location on reaction enthalpy was evaluated by reacting isocyanate
functional groups on different locations with the same alcohol groups. MDI was
compared with TDI to evaluate the impact of molecular size on reaction enthalpy.
Figure 5-4 Example isocyanate structures
Table 5-2 lists total electronic and thermal enthalpies and zero-point vibrational
energies of all the reactants and products based on B3LYP/6-31G(d,p) geometries.
Notation 2 means the reacted isocyanate was on carbon 2 and notation 4 means the
reacted isocyanate was on carbon 4 based on the convention that the 1 carbon is where
the methyl group attaches to the aromatic ring. The corresponding relative enthalpies
(heats of reaction) were reported in Table 5-3.
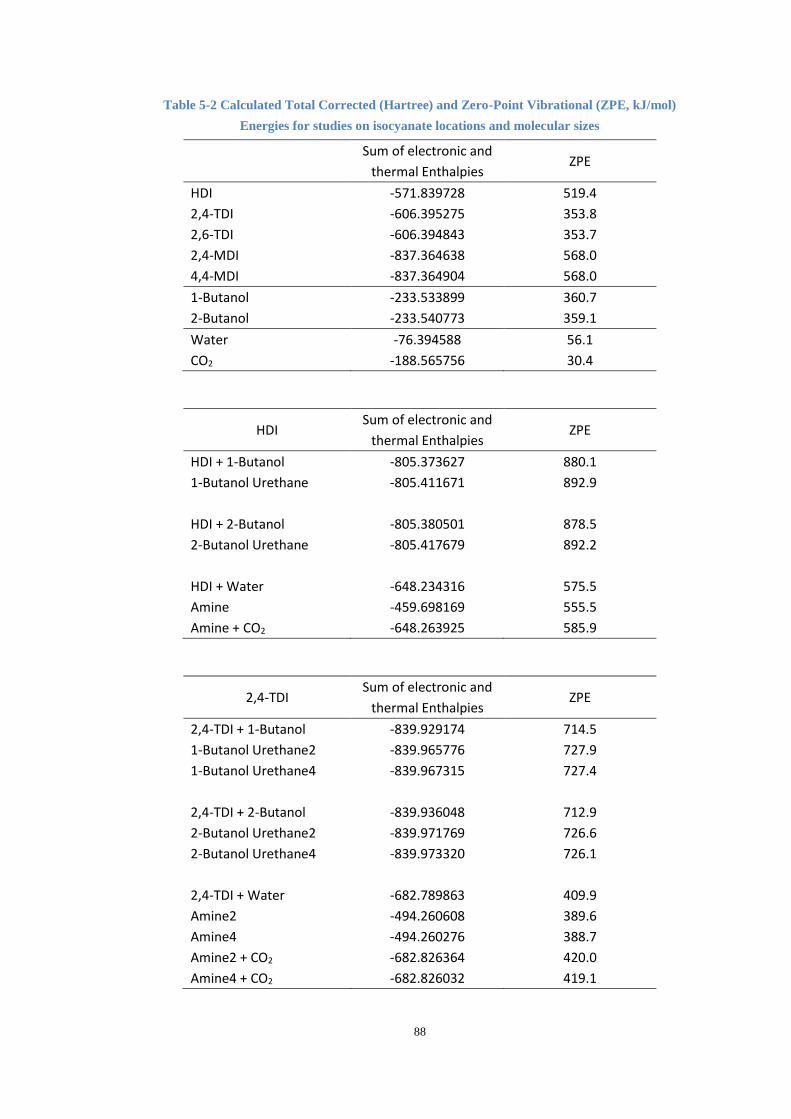
88
Table 5-2 Calculated Total Corrected (Hartree) and Zero-Point Vibrational (ZPE, kJ/mol)
Energies for studies on isocyanate locations and molecular sizes
Sum of electronic and
thermal Enthalpies ZPE
HDI -571.839728 519.4
2,4-TDI -606.395275 353.8
2,6-TDI -606.394843 353.7
2,4-MDI -837.364638 568.0
4,4-MDI -837.364904 568.0
1-Butanol -233.533899 360.7
2-Butanol -233.540773 359.1
Water -76.394588 56.1
CO2 -188.565756 30.4
HDI Sum of electronic and
thermal Enthalpies ZPE
HDI + 1-Butanol -805.373627 880.1
1-Butanol Urethane -805.411671 892.9
HDI + 2-Butanol -805.380501 878.5
2-Butanol Urethane -805.417679 892.2
HDI + Water -648.234316 575.5
Amine -459.698169 555.5
Amine + CO2 -648.263925 585.9
2,4-TDI Sum of electronic and
thermal Enthalpies ZPE
2,4-TDI + 1-Butanol -839.929174 714.5
1-Butanol Urethane2 -839.965776 727.9
1-Butanol Urethane4 -839.967315 727.4
2,4-TDI + 2-Butanol -839.936048 712.9
2-Butanol Urethane2 -839.971769 726.6
2-Butanol Urethane4 -839.973320 726.1
2,4-TDI + Water -682.789863 409.9
Amine2 -494.260608 389.6
Amine4 -494.260276 388.7
Amine2 + CO2 -682.826364 420.0
Amine4 + CO2 -682.826032 419.1

89
2,6-TDI Sum of electronic and
thermal Enthalpies ZPE
2,6-TDI + 1-Butanol -839.928742 714.4
1-Butanol Urethane2 -839.961240 727.6
2,6-TDI + 2-Butanol -839.935616 712.8
2-Butanol Urethane2 -839.967266 726.3
2,6-TDI + Water -682.789431 409.8
Amine2 -494.259986 389.8
Amine2 + CO2 -682.825742 420.2
2,4-MDI Sum of electronic and
thermal Enthalpies ZPE
2,4-MDI + 1-Butanol -1070.898537 928.7
1-Butanol Urethane2 -1070.932860 942.0
1-Butanol Urethane4 -1070.935916 941.6
2,4-MDI + 2-Butanol -1070.905411 927.1
2-Butanol Urethane2 -1070.938823 940.9
2-Butanol Urethane4 -1070.941948 940.2
2,4-MDI + Water -913.759226 624.1
Amine2 -725.227689 603.8
Amine4 -725.229052 603.1
Amine2 + CO2 -913.793445 634.2
Amine4 + CO2 -913.794808 633.5
4,4-MDI Sum of electronic and
thermal Enthalpies ZPE
4,4-MDI + 1-Butanol -1070.898803 928.7
1-Butanol Urethane4 -1070.935949 941.7
4,4-MDI + 2-Butanol -1070.905677 927.1
2-Butanol Urethane4 -1070.941951 940.4
4,4-MDI + Water -913.759492 624.1
Amine4 -725.229134 603.0
Amine4 + CO2 -913.794890 633.4

90
Table 5-3 Calculated Relative Enthalpies (kJ/mol) of isocyanate-alcohol reactions, All Corrected
by ZPE. Using the reference states of zero enthalpy for the reagents, the non-zero values as
reported are heats of reaction.
HDI 2,4-TDI 2,6-TDI 2,4-MDI 4,4-MDI
Isocyanate + 1-Butanol 0 0 0 0 0
1-Butanol Urethane2 -82.7 -72.1 -76.8
1-Butanol Urethane4 -87.1 -87.2 -85.2 -84.5
Isocyanate + 2-Butanol 0 0 0 0 0
2-Butanol Urethane2 -80.1 -69.6 -73.9
2-Butanol Urethane4 -83.9 -84.7 -82.8 -81.9
Isocyanate + Water 0 0 0 0 0
Amine2 + CO2 -85.7 -84.9 -79.7
Amine4 + CO2 -67.3 -85.8 -84.0 -83.6
In Table 5-3, the comparison between HDI, 2,4-TDI and 2,4-MDI results show that
larger isocyanate molecules lead to lower enthalpies of reaction. Isocyanate group on 4
carbons are less sterically hindered than on either 2 or 6 carbons. The heat released from
reaction with the less sterically hindered isocyanate is noticeably larger.
5.3.2 Location of Hydroxyl Groups
To evaluate the impact of hydroxyl group location (e.g. primary versus secondary)
molecular modeling was performed using isomers of pentanol. Total electronic and
thermal enthalpies and zero-point vibrational energies are provided in Table 5-4. The
corresponding relative enthalpies were reported in the table.
Table 5-4 Calculated Total Corrected (Hartree), Zero-Point Vibrational (ZPE, kJ/mol) Energies
and Relative Enthalpies (kJ/mol) for study on impact of hydroxyl locations
Sum of electronic and
thermal Enthalpies ZPE
HDI -571.839728 519.4
2,4-TDI -606.395275 353.8
4,4-MDI -837.364904 568.0
1-Pentanol -272.820618 435.6
2-Pentanol -272.827374 434.3
3-Pentanol -272.827249 434.1

91
Tert-Pentanol -272.830000 432.3
HDI
Sum of electronic and
thermal Enthalpies
(Hartree)
ZPE (kJ/mol) Calculated Relative
Enthalpies (kJ/mol)
HDI + 1-Pentanol -844.660346 955.0 0
1-Pentanol Urethane -844.698309 968.0 -86.7
HDI + 2-Pentanol -844.667102 953.7 0
2-Pentanol Urethane -844.704307 966.5 -84.9
HDI + 3-Pentanol -844.666977 953.5 0
3-Pentanol Urethane -844.703379 966.6 -82.5
HDI + Tert-Pentanol -844.669728 951.7 0
Tert-Pentanol Urethane -844.702554 964.4 -73.5
2,4-TDI
Sum of electronic and
thermal Enthalpies
(Hartree)
ZPE (kJ/mol) Calculated Relative
Enthalpies (kJ/mol)
2,4-TDI + 1-Pentanol -879.215893 789.4 0
1-Pentanol Urethane4 -879.254034 802.3 -87.2
2,4-TDI + 2-Pentanol -879.222649 788.1 0
2-Pentanol Urethane4 -879.259948 800.9 -85.1
2,4-TDI + 3-Pentanol -879.222524 787.9 0
3-Pentanol Urethane4 -879.258996 800.9 -82.8
2,4-TDI + Tert-Pentanol -879.225275 786.1 0
Tert-Pentanol Urethane4 -879.258207 798.4 -74.2
4,4-MDI
Sum of electronic and
thermal Enthalpies
(Hartree)
ZPE (kJ/mol) Calculated Relative
Enthalpies (kJ/mol)
4,4-MDI + 1-Pentanol -1110.185522 1003.6 0
1-Pentanol Urethane -1110.222663 1016.6 -84.5
4,4-MDI + 2-Pentanol -1110.192278 1002.3 0
2-Pentanol Urethane -1110.228568 1015.1 -82.5
4,4-MDI + 3-Pentanol -1110.192153 1002.1 0

92
3-Pentanol Urethane -1110.227643 1015.3 -80.0
4,4-MDI + Tert-Pentanol -1110.194904 1000.3 0
Tert-Pentanol Urethane -1110.226724 1013.0 -70.8
Both TDI and MDI results show relative magnitudes of heats of reaction in the
sequence: 1-Pentanol > 2-Pentanol > 3-Pentanol > Tert-Pentanol. Primary hydroxyl
groups have larger energy potential than secondary, and then secondary has larger
energy potential than tertiary. This result does not agree with the assumption used in
other kinetics modeling [19, 26, 28, 45, 46] in which only one reaction enthalpy was
used for all alcohol-isocyanate reactions.
The trends with the alcohols follow the trends of the isocyanates where the lower
steric hindrance of reactive moieties leads to larger heats of reaction. This is consistent
with unreacted moieties having less steric hindrance with respective higher energy
states; this leads to the release of more energy when the molecules are bound to the
urethane configuration.
5.3.3 Chain Length of Hydroxyl Groups
To evaluate the use of Floy’s assumption that the reactivity of a moiety can be
approximated as independent of the size of the molecule to which the moiety is attached,
the heats of reaction for a series of n-alcohols were estimated as reported in Table 5-5.
Table 5-5 Calculated Total Corrected (Hartree), Zero-Point Vibrational (ZPE, kJ/mol) Energies
and Relative Enthalpies (kJ/mol) for study on impact of hydroxyl group chain length
Sum of electronic and
thermal Enthalpies ZPE
4,4-MDI -837.364904 568.0
Methanol -115.668313 135.0
Ethanol -154.960831 210.5
1-Propanol -194.247438 285.6
1-Butanol -233.533899 360.7
1-Pentanol -272.820618 435.6

93
1-Hexanol -312.107241 510.6
4,4-MDI
Sum of electronic and
thermal Enthalpies
(Hartree)
ZPE (kJ/mol) Calculated Relative
Enthalpies (kJ/mol)
4,4-MDI + Methanol -953.033217 703.0 0
Methanol Urethane -953.070704 717.6 -83.8
4,4-MDI + Ethanol -992.325735 778.5 0
Ethanol Urethane -992.362932 791.8 -84.4
4,4-MDI + 1-Propanol -1031.612342 853.6 0
1-Propanol Urethane -1031.649436 866.7 -84.3
4,4-MDI + 1-Butanol -1070.898803 928.7 0
1-Butanol Urethane -1070.935949 941.7 -84.5
4,4-MDI + 1-Pentanol -1110.185522 1003.6 0
1-Pentanol Urethane -1110.222663 1016.6 -84.5
4,4-MDI + 1-Hexanol -1149.472145 1078.6 0
1-Hexanol Urethane -1149.509327 1091.4 -84.8
Figure 5-5 graphically summarizes the results of Table 5-5. The results show that
heat of reaction is not dependent on the chain length number of the molecule attached
to the hydroxyl group.
-100
-95
-90
-85
-80
-75
-70
0 1 2 3 4 5 6 7
He
at o
f re
acti
on
(kJ
/mo
l)
Chain length Number

94
Figure 5-5 Relationship between heat of reaction and the size of the molecule attached to the
hydroxyl
5.3.4 Solvent Effects
The solvent effects were studied using a single-point Integral-Equation-Formalism
Polarizable Continuum Model (IEF-PCM) to make calculations in toluene (which is
used as a solvent in some of the experimental studies to avoid over heat) and benzene.
Table 5-6 reports the solvent effects.
Table 5-6 Calculated Total Corrected (Hartree), Zero-Point Vibrational (ZPE, kJ/mol) Energies
and Relative Enthalpies (kJ/mol) for study on impact of solvent effects
Sum of electronic and
thermal Enthalpies
(Hartree)
ZPE (kJ/mol) Calculated Relative
Enthalpies (kJ/mol)
2,4-TDI -606.395275 353.8
1-Butanol -233.533899 360.7
2,4-TDI + 1-Butanol -839.929174 714.5 0
1-Butanol Urethane4 -839.967315 727.4 -87.2
2,4-TDI (T) -606.398038 353.3
1-Butanol (T) -233.536108 360.4
2,4-TDI + 1-Butanol (T) -839.934146 713.7 0
1-Butanol Urethane4 (T) -839.971750 726.3 -86.1
2,4-TDI (B) -606.397921 353.4
1-Butanol (B) -233.536013 360.4
2,4-TDI + 1-Butanol (B) -839.933934 713.8 0
1-Butanol Urethane4 (B) -839.971560 726.4 -86.2
The Results show that the presence of solvent does not have significant impact on
reaction enthalpies which matches the conclusion found by Raspoet et al [71]. In his
work as for prototypes, PCM calculations were performed in both aqueous and
methanol solution, which lead, after all, to similar results. On the whole, the role of the
surroundings was found to be less decisive than the specific action of a catalytic cluster.
And in fact, the considered reactions had been shown not to be greatly influenced by
95
the presence of a continuum that does not modify the conclusions emerging from the
study carried out for the gas phase species. Based on these, it is assumed that the results
with toluene as a solvent are accurate enough to evaluate the reaction enthalpies.
5.3.5 Comparison to Different Models
A primary finding of the molecular simulation results is that the steric hindrance
and neighboring molecule effects of reactive moieties on monomers can cause heats of
reaction to change up to 17% for urethane-forming reactions. In view of this, the
simulation values are compared to literature values and new experimental data in the
following paragraphs.
Table 5-7 shows the comparison between computational results and other results
from previous literatures for 4,4-MDI which is the most commonly used isocyanate in
the industry. Zhao et al [19, 26, 28, 60] results were from previous simulation
development. Baser and Khakhar [45, 46] solved differential equations to model the
fundamental kinetics in polyurethane foaming reaction. Lovering and Laidler [61]
gathered these results experimentally by using a differential microcalorimeter of the
Tian-Calvet type. Since Lovering’s data was measured in 1961, Zhao and Baser’s data
seem to be more reliable to be references. The polyols used in their studies have
significantly high content of hinder-secondary (tertiary) alcohol, hence their values
locate very close to tertiary result of Gaussian values.
Table 5-7 Comparison between molecular modeling results and experimental values reported in
literature for reactions of 4,4-MDI with alcohol to form urethane

96
Reaction Enthalpy
(kJ/mol)
Gaussian Zhao[60] Baser[45] Lovering[61]
Primary -84.5 -72.0 -74.9 -102.9
Secondary -81.2 -72.0 -74.9 -97.9
Tertiary -70.8 -72.0 -74.9 NR
Water -83.6 -66.0 -86.0 NR
The Gaussian values straddle the values of both Zhao et al and Baser providing a
level of confidence that the Gaussian values are both reasonable and provide an
increased sensitivity to the moiety isomer. The water reaction enthalpy from this study
is quite similar to that from Baser and the average gel reaction enthalpy. The deviation
between average computational results and literature values is about 5%.
Table 5-8 presents the reaction enthalpy calculation of isocyanate-amine reaction.
Only the HDI product result was presented because the calculations of MDI and TDI
did not converge.
Table 5-8 Enthalpy calculation of isocyanate-amine reaction
Sum of electronic and
thermal Enthalpies
(Hartree)
ZPE (kJ/mol) Calculated Relative
Enthalpies (kJ/mol)
HDI -571.839728 519.4
HDI_AMINE -459.698169 555.5
HDI + AMINE -1031.537897 1074.9 0
ISO-Amine_product -1031.568419 1087.6 -67.4
Values as recommended based on this comprehensive analysis are summarized in
Table 5-9. Hindered-Secondary alcohol is assumed to have the same reaction enthalpy
as tertiary. PMDI molecules are too large to be computed successfully in Gaussian, and
as an approximation are estimated to be 3% less than that of MDI. This assumption is
based on the conclusion that heat of reaction decreases as the chain length of isocyanate
group increasing when the chain length number is less than 3 [62].
Table 5-9 Recommended values for heat of reaction (kJ/mol)

97
PMDI MDI TDI HDI
Primary -82.0 -84.5 -87.2 -86.7
Secondary -78.8 -81.2 -84.0 -83.7
Tertiary (HS) -68.7 -70.8 -74.2 -73.5
Water -81.1 -83.6 -85.8 -67.3
Amine -67.4
Simulation results from different modeling were compared to experimental data in
Figure 5-6. Symbols are experimental data, dash lines represent the original modeling
results using values from Zhao and solid lines represent the revised modeling results
using recommended values of PMDI from Table 5-9. “◊” and “□” series represent 1-
pentanol and 2-pentanol gel reactions without catalysts, “∆” and “o” series represent
single polyol (G76-635) and mixture polyols gel reactions with catalysts respectively.
Temperature profiles of pentanol reactions were cut off at 100 ˚C because the
evaporation of toluene impacted results above this temperature. To increase the amount
of data collected before reaching 100 ˚C, toluene was used as a solvent at 20% by mass
of the mixture.
Due to volatility issues of pentanol, data was also collected using diethylene glycol.
Acetophenone was selected as a solvent due to a higher boiling point and better
compatibility than toluene. Figure 5-7 compares experimental temperature profiles and
modeling results of isocyanate-DEG reaction in presence of acetophenone as a solvent.
Symbols are experimental data, dash lines represent the original MATLAB modeling
results (-72.0 kJ/mol) and solid lines represent the revised modeling results using
Gaussian values (-82.0 kJ/mol). The Table 5-9 recommended heat of reaction for PMDI
and primary alcohols (-82.0 kJ/mol) were used in new models (SOLID LINES) to
compare with the previously reported values of Zhao et al (-72.0 kJ/mol).

98
Figure 5-6 Comparison between experimental data and different modeling results of primary,
secondary, single polyol and mixture polyols gel reaction
Figure 5-7 Comparison between experimental data and modeling results of isocyanate-DEG
reaction in presence of 0%, 10%, 20% and 30% acetophenone (from left to right respectively)
The Table 5-9 value has a clearly better fit in the absence of acetophenone solvent
0
20
40
60
80
100
120
140
160
0 200 400 600 800 1000
Tem
pe
ratu
re [
C]
Time [s]
0
20
40
60
80
100
120
140
160
180
200
220
0 200 400 600 800 1000 1200 1400 1600 1800
Tem
pe
ratu
re [
C]
Time [s]

99
and at 10% solvent. At higher solvent loadings the lower reaction enthalpy indicated by
experimental data may due to the evaporation of solvent due to the combination of
longer times and higher fractions of acetophenone.
The new data support that recommended values of Table 5-9 including the
distinction between primary, secondary, and tertiary alcohol reagents.
5.3.6 Verification by Other Calculation Methods
The computation of reaction between 2,4-TDI and 1-Butanol was repeated by
Hartree-Fock and MP2 method using a 6-31G(d,p) basis set. The molecules were too
large to be successfully calculated in higher level basis sets and QM methods. Table
5-10 reports total electronic and thermal enthalpies, zero-point vibrational energies and
corresponding relative enthalpies from three different methods.
Table 5-10 Calculated Total Corrected (Hartree), Zero-Point Vibrational (ZPE, kJ/mol) Energies
and Relative Enthalpies (kJ/mol) for 2,4-TDI and 1-Butanol reaction
Method
Sum of electronic and
thermal Enthalpies
(Hartree)
ZPE
(kJ/mol)
Calculated
Relative
Enthalpies
(kJ/mol)
B3LYP
2,4-TDI -606.395275 353.8
1-Butanol -233.533899 360.7
2,4-TDI + 1-Butanol -839.929174 714.5 0
1-Butanol Urethane4 -839.967315 727.4 -87.2
HF
2,4-TDI -602.803702 378.8
1-Butanol -232.011583 384.5
2,4-TDI + 1-Butanol -834.815285 763.3 0
1-Butanol Urethane4 -834.855365 778.1 -90.4
MP2
2,4-TDI -604.654634 355.1
1-Butanol -232.783505 371.2
2,4-TDI + 1-Butanol -837.438139 726.3 0
1-Butanol Urethane4 -837.475997 738.7 -87.0
DFT (B3LYP) and MP2 almost have the same results and Hartree-Fock result has a

100
deviation about 4%. This indicates that the computational results are repeatable and
consistent.
5.4 Conclusion
Molecular configurations for a range of reactants and products in polyurethane
foaming reaction were optimized at the B3LYP level using a 6-31G(d,p) basis set in the
gas phase. Total electronic and thermal enthalpies and zero-point vibrational energies
were computed by Gaussian 09 package on a supercomputer from UMBC. The gas
phase results were compared to calculations with solvents with the solvent causing only
minor decreases (1.2%) in the heats of reaction. The corresponding relative enthalpies
were calculated based on ZPE correction and reported in kJ/mol.
Where possible, computational results were compared using different
computational methods as a first pass on verifying accuracy of simulations. When
variations between different reagent isomers were large, the values were compared to
experimental data and values reported in literature. Values of heats of reaction vary by
up to 17%, relative values based on hydroxyl isomers (primary vs tertiary).
Recommended values for use were made based on experimental observations and these
deviations.
Based on the reaction enthalpy results, the following is concluded on heats of
reaction: 1) Isocyanate groups on carbon 4 have larger energy potentials than that on
carbon 2 and larger isocyanate molecules have lower enthalpy. 2) Primary hydroxyl
groups have larger energy potentials than secondary (about 4% larger), and secondary
have larger energy potentials than tertiary (about 15%). 3) The heat of reaction is not

101
dependent on the chain length number of the molecule attached to the hydroxyl group.
4) The presence of solvent decreases the reaction enthalpy slightly with the large
molecules self-solvating capability reducing the impact of solvents. 5) Heats of reaction
for water-isocyanate reactions were between the two values reported in the literature
and provided a basis for recommending values for use.
These studies verify that computational chemistry is a useful tool to estimate
changes in reactions due to isomeric variations of reagents or moiety locations on
reagent molecules. In a similar manner, simulation of urethane-forming reactions is
useful to bridge the gap between fundamental computational chemistry calculations and
practical applications.

102
BIBLIOGRAPHY
1. Chang, M.-C. and S.-A. Chen, KINETICS AND MECHANISM OF URETHANE REACTIONS: PHENYL
ISOCYANATE-ALCOHOL SYSTEMS. Journal of Polymer Science, Part A: Polymer Chemistry, 1987.
25(9): p. 2543-2559.
2. Tesser, R., et al., Modeling of polyurethane foam formation. Journal of Applied Polymer Science,
2004. 92(3): p. 1875-1886.
3. Pengjam, W., et al., Copper-amine complexes as new catalysts for rigid polyurethane foam
preparations. Journal of Applied Polymer Science, 2012. 123(6): p. 3520-3526.
4. Listemann, M.L., A.C. Savoca, and A.L. Wressell, Amine catalyst characterization by a foam
model reaction. Journal of Cellular Plastics, 1992. 28(4): p. 360-398.
5. Strachota, A., B. Strachotová, and M. Špírková, Comparison of environmentally friendly,
selective polyurethane catalysts. Materials and Manufacturing Processes, 2008. 23(6): p. 566-
570.
6. Farkas, A. and K.G. Flynn, The catalytic effects of 1,4-diaza [2.2.2] bicycloöctane for isocyanate
reactions. Journal of the American Chemical Society, 1960. 82(3): p. 642-645.
7. Ni, H., et al., Effect of catalysts on the reaction of an aliphatic isocyanate and water. Journal of
Polymer Science, Part A: Polymer Chemistry, 2002. 40(11): p. 1677-1688.
8. Niyogi, S., S. Sarkar, and B. Adhikari, Catalytic activity of DBTDL in polyurethane formation.
Indian Journal of Chemical Technology, 2002. 9(4): p. 330-333.
9. Silva, A.L. and J.C. Bordado, Recent developments in polyurethane catalysis: Catalytic
mechanisms review. Catalysis Reviews - Science and Engineering, 2004. 46(1): p. 31-51.
10. Van Maris, R., et al., Polyurethane catalysis by tertiary amines. Journal of Cellular Plastics, 2005.
41(4): p. 305-322.
11. Wong, S.-W. and K.C. Frisch, CATALYSIS IN COMPETING ISOCYANATE REACTIONS. I. EFFECT OF
ORGANOTIN-TERTIARY AMINE CATALYSTS ON PHENYL ISOCYANATE AND N-BUTANOL REACTION.
Journal of Polymer Science, Part A: Polymer Chemistry, 1986. 24(11): p. 2867-2875.
12. Wongkamolsesh, K. and J.E. Kresta. ORGANOTIN CATALYSIS IN URETHANE SYSTEMS. 1985.
Washington, DC, USA: ACS.
13. Bakirova, I.N. and A.S. Kirillova, Effect of organometallic catalysts on the synthesis process and
properties of molded polyurethane. Russian Journal of Applied Chemistry, 2013. 86(9): p. 1399-
1403.
14. Hongyu Fan, A.T., Galen J. Suppes, and Fu-Hung Hsieh, Properties of Biobased Rigid
Polyurethane Foams Reinforced with Fillers: Microspheres and Nanoclay. International Journal
of Polymer Science, 2012. 2012.
15. Singh, H., T.P. Sharma, and A.K. Jain, Reactivity of the raw materials and their effects on the
structure and properties of rigid polyurethane foams. Journal of Applied Polymer Science, 2007.
106(2): p. 1014-1023.
16. Thirumal, M., et al., Mechanical, morphological and thermal properties of rigid polyurethane
Foam: Effect of chain extender, polyol and blowing agent. Cellular Polymers, 2009. 28(2): p.
145-158.
17. Baker, J.W. and J.B. Holdsworth, The mechanism of aromatic side-chain reactions with special
reference, to the polar effects of substituents. Part XIII. Kinetic examination of the reaction of
aryl isoCyanates with methyl alcohol. Journal of the Chemical Society (Resumed), 1947: p. 713-

103
726.
18. Yusheng Zhao, M.J.G., Ali Tekeei, Fu-Hung Hsieh, and Galen J. Suppes, Modeling Reaction
Kinetics of Rigid Polyurethane Foaming Process. Journal of Applied Polymer Science, 2013.
19. Zhao, Y., et al., Modeling impact of catalyst loading on polyurethane foam polymerization.
Applied Catalysis A: General, 2014. 469: p. 229-238.
20. R. C. Weast, e., CRC Handbook of Chemistry and Physics. CRC Press Inc. Florida, 1990.
21. D. R. Lide, e., CRC Handbook of Chemistry and Physics. 71st Edition. CRC Press Inc. Florida, 1990-
91.
22. Shawbury, S., Shropshire, Chemistry and Technology of Polyols for Polyurethanes. Rapra
Technology Limited, 2005.
23. Priority Product Profile--Spray Polyurethane Foam Systems Containing Unreacted
Diisocyanates. March 2014, California Envirnomental Protection Agency.
24. Jarand, C.W., et al., Diisocyanate emission from a paint product: A preliminary analysis. Applied
Occupational and Environmental Hygiene, 2002. 17(7): p. 491-494.
25. Kelly, T.J., Testing of household products and materials for emission of toluene diisocyanate.
Indoor Air, 1999. 9(2): p. 117-124.
26. Ghoreishi, R., Y. Zhao, and G.J. Suppes, Reaction modeling of urethane polyols using fraction
primary secondary and hindered-secondary hydroxyl content. Journal of Applied Polymer
Science, 2014. 131(12).
27. Shen, L., et al., Density modeling of polyurethane box foam. Polymer Engineering and Science,
2014. 54(7): p. 1503-1511.
28. Zhao, Y., et al., Modeling reaction kinetics of rigid polyurethane foaming process. Journal of
Applied Polymer Science, 2013. 130(2): p. 1131-1138.
29. Duff, D.W. and G.E. Maciel, Carbon-13 and nitrogen-15 CP/MAS NMR characterization of MDI-
polyisocyanurate resin systems. Macromolecules, 1990. 23(12): p. 3069-3079.
30. Singh, P. and J.L. Boivin, Studies on the stability of the dimer of 2, 4-tolylene diisocyanate.
Canadian Journal of Chemistry, 1962. 40(5): p. 935-940.
31. Querat, E., et al., Blocked isocyanate. Reaction and thermal behaviour of the toluene 2, 4‐
diisocyanate dimer. Die Angewandte Makromolekulare Chemie, 1996. 242(1): p. 1-36.
32. Heintz, A.M., et al., Effects of reaction temperature on the formation of polyurethane
prepolymer structures. Macromolecules, 2003. 36(8): p. 2695-2704.
33. Lapprand, A., et al., Reactivity of isocyanates with urethanes: conditions for allophanate
formation. Polymer degradation and stability, 2005. 90(2): p. 363-373.
34. Vivaldo-Lima, E., et al., Modeling of nonlinear polyurethane production in batch reactors using
a kinetic-probabilistic approach. Industrial & engineering chemistry research, 2002. 41(21): p.
5207-5219.
35. Delebecq, E., et al., On the Versatility of Urethane/Urea Bonds: Reversibility, Blocked
Isocyanate, and Non-isocyanate Polyurethane. Chemical reviews, 2012. 113(1): p. 80-118.
36. Dusek, K., M. Spirkova, and I. Havlicek, Network formation of polyurethanes due to side
reactions. Macromolecules, 1990. 23(6): p. 1774-1781.
37. Lubguban, A.A., et al., Isocyanate reduction by epoxide substitution of alcohols for
polyurethane bioelastomer synthesis. International Journal of Polymer Science, 2011. 2011.
38. Hsieh, F.-H., et al., Urethane formulation. 2012, Google Patents.
39. Okumoto, S. and S. Yamabe, A computational study of base-catalyzed reactions between
104
isocyanates and epoxides affording 2-oxazolidones and isocyanurates. Journal of
Computational Chemistry, 2001. 22(3): p. 316-326.
40. Caille, D., J.P. Pascault, and L. Tighzert, Reaction of a diepoxide with a diisocyanate in bulk.
Polymer Bulletin, 1990. 24(1): p. 23-30.
41. Morgans Jr, D., K. Sharpless, and S.G. Traynor, Epoxy alcohol rearrangements: hydroxyl-
mediated delivery of Lewis acid promoters. Journal of the American Chemical Society, 1981.
103(2): p. 462-464.
42. Flory, P.J., Principles of polymer chemistry. 1953: Cornell University Press.
43. Frensdorff, H.K.A., R.K., Vapor pressure of 2,4-tolylene diisocyanate. J. Chem. Eng. Data, 1975.
20(1): p. 13-15.
44. Zalikin, A.A. and Y.A. Streoikheev, Some physicochemical constants of 4,4'-
diaminodiphenylmethane and 4,4'-diphenylmethanediisocyanate. Zhur. Priklad. Khim., 1966.
39: p. 2607.
45. Baser, S.A. and D.V. Khakhar, Modeling of the dynamics of water and R-11 blown polyurethane
foam formation. Polymer Engineering and Science, 1994. 34(8): p. 642-649.
46. Baser, S.A. and D.V. Khakhar, Modeling of the dynamics of R-11 blown polyurethane foam
formation. Polymer Engineering and Science, 1994. 34(8): p. 632-641.
47. Harikrishnan, G. and D.V. Khakhar, Modeling the dynamics of reactive foaming and film thinning
in polyurethane foams. AIChE Journal, 2010. 56(2): p. 522-530.
48. Zhang, X.D., et al., Role of silicone surfactant in flexible polyurethane foam. Journal of Colloid
and Interface Science, 1999. 215(2): p. 270-279.
49. DOW, Dow Polyurethanes Flexible Foams.
50. Hill, R.M., Silicone surfactants - New developments. Current Opinion in Colloid and Interface
Science, 2002. 7(5-6): p. 255-261.
51. Yasunaga, K., et al., Study of cell opening in flexible polyurethane foam. Journal of Cellular
Plastics, 1996. 32(5): p. 427-447.
52. Kanner, B. and T.G. Decker, Urethane Foam Formation - Role of the Silicone Surfactant. Journal
of Cellular Plastics, 1969. 5(1): p. 32-39.
53. Burlatsky, S.F., et al., Surface tension model for surfactant solutions at the critical micelle
concentration. Journal of Colloid and Interface Science, 2013. 393(1): p. 151-160.
54. Hill, R.M., Silicone surfactants. Taylor & Francis, 1999.
55. Favelukis, M. and R.J. Albalak, Bubble growth in viscous newtonian and non-newtonian liquids.
Chemical Engineering Journal, 1996. 63(3): p. 149-155.
56. Nguyen, A.V., Historical note on the Stefan-Reynolds equations. Journal of Colloid and Interface
Science, 2000. 231(1): p. 195.
57. Ruckenstein, E. and A. Sharma, A new mechanism of film thinning: Enhancement of reynolds'
velocity by surface waves. Journal of Colloid And Interface Science, 1987. 119(1): p. 1-13.
58. Radoev, B.P., A.D. Scheludko, and E.D. Manev, Critical thickness of thin liquid films: Theory and
experiment. Journal of Colloid And Interface Science, 1983. 95(1): p. 254-265.
59. Talaia, M.A.R., Terminal Velocity of a Bubble Rise in a Liquid Column. World Academy of Science,
Engineering and Technology, 2007. 28: p. 264-268.
60. Zhao, Y. and G.J. Suppes, Simulation of Catalyzed Urethane Polymerization: An Approach to
Expedite Commercialization of Bio-based Materials. Catalysis Surveys from Asia, 2014.
61. Lovering, E.G. and K.J. Laidler, Thermochemical Studies of Some Alcohol-Isocyanate Reactions.

105
Canadian Journal of Chemistry, 1961. 40.
62. Flory, P.J., Principles of Polymer Chemistry. Cornell University Press, 1953: p. 71.
63. Lu, H., State diagram of phase transition temperatures and solvent-induced recovery behavior
of shape-memory polymer. Journal of Applied Polymer Science, 2013. 127(4): p. 2896-2904.
64. Lu, H. and W.M. Huang, A phenomenological model for the chemo-responsive shape memory
effect in amorphous polymers undergoing viscoelastic transition. Smart Materials and
Structures, 2013. 22(11).
65. Huo, S.P., et al., Crosslinking kinetics of the formation of lignin-aminated polyol-based
polyurethane foam. Journal of Applied Polymer Science, 2012. 125(1): p. 152-157.
66. Modesti, M., V. Adriani, and F. Simioni, Chemical and physical blowing agents in structural
polyurethane foams: Simulation and characterization. Polymer Engineering and Science, 2000.
40(9): p. 2046-2057.
67. Paciorek-Sadowska, J., et al., Preparation of rigid polyurethane foams with powder fi ller.
Journal of Polymer Engineering, 2012. 32(2): p. 71-80.
68. Çoban, M. and F.A.S. Konuklar, A computational study on the mechanism and the kinetics of
urethane formation. Computational and Theoretical Chemistry, 2011. 963(1): p. 168-175.
69. Williams, C.I. and M.A. Whitehead, Semi-empirical study of isocyanate geometries, and β-
lactam formation through alkene-isocyanate cyclo-addition reactions. Journal of Molecular
Structure: THEOCHEM, 1999. 491: p. 93-101.
70. Berry, R.J., A.L. Wilson, and M. Schwartz, A computational study of bond dissociation enthalpies
and hydrogen abstraction energy barriers in model urethanes. Journal of Molecular Structure:
THEOCHEM, 2000. 496: p. 121-129.
71. Raspoet, G., et al., The alcoholysis reaction of isocyanates giving urethanes: Evidence for a
multimolecular mechanism. Journal of Organic Chemistry, 1998. 63(20): p. 6878-6885.

106
VITA
Yusheng Zhao is a Ph.D. candidate in Department of Chemical Engineering under
supervision of Dr. Galen Suppes. He received his B.S. in Materials Science from East
China University of Science and Technology and his M.S. in Chemical Engineering
from University of Missouri. He has published five papers as the first author during his
study in University of Missouri. Yusheng’s research has primarily focused on modeling
and experimental study of polyurethane foaming reactions. Impact of side reactions,
catalysts, and surfactants were evaluated and a MATLAB program was developed to
simulate the reaction process and to predict foam properties.