model of cocoa replanting and new planting in bahia ... · september 1988 wps 92 a model of cocoa...
TRANSCRIPT

Policy, Planning, and Resoarch
WORKING PAPERS
International Commodity Mlar'tet
International Economics DepartmentThe World BankSeptember 1988
WPS 92
A Model of Cocoa Replantingand New Planting in Bahia,
Brazil,1 966-85
Pravin K. Trivedi
In Brazil, two decades of high cocoa prices and low interest ratessparked significant growth in new planting of cocoa trees.Higher prices and low interest rates encouraged new planting;but higher prices discouraged replanting in the short term whileencouraging it in the long term.
The Policy. Planning, and Research Complex disuibutes PPR Wokuing Papers to disseminate the findings of work in progress and toencourage the exchange of ideas among Bank staff and aU others interested in development issues. These papers carry the names ofthe authors, reflect only their views, and should be used and cited accordingly. The findings, interpretations, and conclusions are theauthos' owi. They should not be attributed to the World Bank, its Board of Directors, its management, or any of its member countrics.
Pub
lic D
iscl
osur
e A
utho
rized
Pub
lic D
iscl
osur
e A
utho
rized
Pub
lic D
iscl
osur
e A
utho
rized
Pub
lic D
iscl
osur
e A
utho
rized
Pub
lic D
iscl
osur
e A
utho
rized
Pub
lic D
iscl
osur
e A
utho
rized
Pub
lic D
iscl
osur
e A
utho
rized
Pub
lic D
iscl
osur
e A
utho
rized

Polac,Pnning, and R surch I
Intaatonal Commodity Mfiarkets|
In 1966, 90 percent of the cocoa growing areas but their relationship to replanting is morein Bahia, Brazil had trees more than 30 years complex. In the short terrn, higher prices dis-old. By 1985 most of the area had been re- courage replanting, which involves uprootingplanted or supplied with new trees. and a temporary loss of revenue. But over the
long run, higher priceb increase expectations ofThroughout most of this period there were future profits and encourage replanting.
high or rising cocoa prices - and zero ornegative interest rates. High prices and low Lowering the interest rate below its realinterest rates directly encouraged new planting, level provided cocoa growers with a subsidy that
encouraged both replanting and new planting.
This paper is a product of the International Commodity Markets Division, Interna-tional Economics Department. Copies are available free from the World Bank, 1818H Street NW, Washington, DC 20433. Please contact Dawn Gustafson, room S7-044, extension 33714.
'Ce PPR Working Paper Series disseminates the fdings of work uRnideTr way in the Bank's Policy, Plaring. and ResearchComplex. An objective of the scries is to get these findings out quickly, even if presentations are less than fuDy polished.The findings, interpretations, and conclusions in these papers do not necessdrily represent official policy of the Bank.
Copyright i) 1988 by the International Bank for Reconstruction and Development/Te World Bank

CONTENTS
I. Introduction .1................................ 1
II. A descriptive factual account. . 4Planted area andproduction.. 4New planting andreplantg... 4Age distribution of tree. .5Productivity..... .... . ... . 5
III. Analytical framework .9A Formal Derivation. 9
IV. An econometric model of cocoa replanting . . 19Srecification of the NER(.) function .. 19Specification of the MCI(.) function .. 21The Results..... 23Comparison with variants .. 25Elasticity of RPBAN with respect to PRICOCO .30Interest rate effects .. 31
V. Econometric Analysis of New Planti n . .32Price elasticity of new planting .. .39
Interest elasticity .. 37
VI. Sumary and conclusions. . 40
References .. 42

ti
TABLES
Table 1 : Summary statistics on the level and percentage change in newplanting and replanting, Bahia, 1967-1985
Table 2: Estimated Age Distribution of Productive Cocoa Trees, 1936-86
Tables 3-6 : Alternative specifications ar.d tea4s of replanting equations
Tables 7-8 : Alternative spectifications and tests of new planting equations
Table 9 : Specification of productivity equation
iii
FIGURES
Figure 1 : Log of Bahia total production
Figure 2 : Log of total area under cocoa In Babia
Figure 3 : New planting of cocoa in Bahia in hectares
Figure 4 : New planting divided by total area or old area
Figure 5 : Ratio of replanting to new planting
Figure 6 : Ratic of surviving pre-1966 area to total planted area
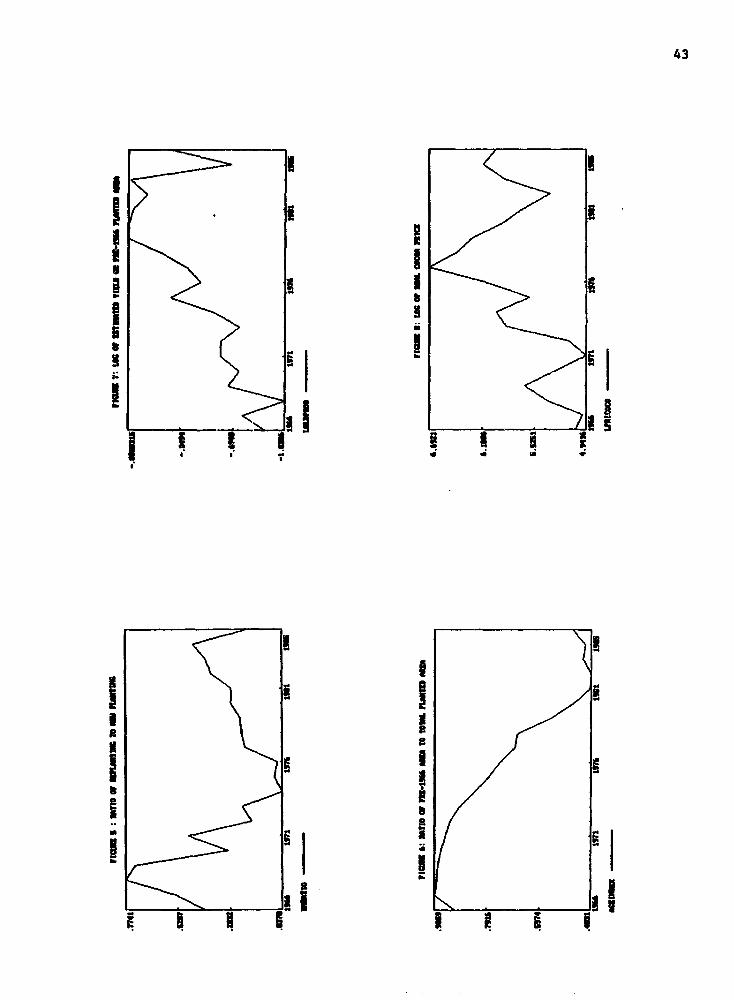
Figure 7 : Log of estimated yield on pre-1966 planted area
Figure 8 : Log of real cocoa price
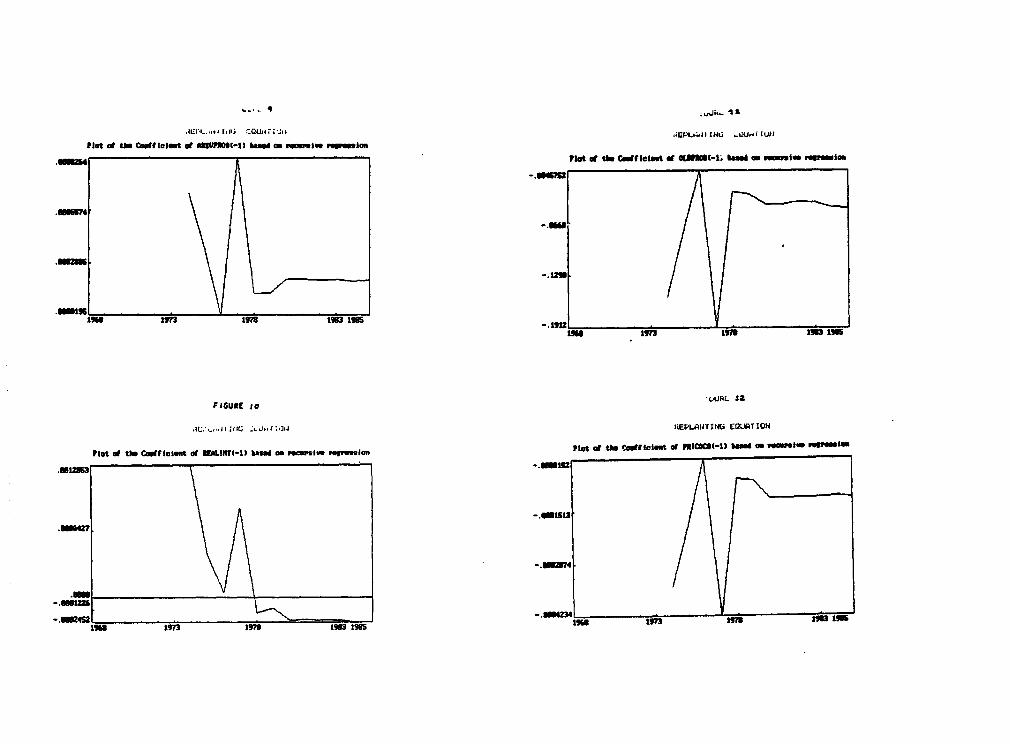
Figure 9-12: Plots of coefficients based on recursive regressionof replanting
Figure 13 : Real subsidy rate and real interest rate
Figures 14-18 : Plots of coefficients based on recursiveregression of new planting


1
A NODIL OF COCoA REPLANTING AND NEW PLANTING IN BANIA, BRAZIL : 1966-1985
I : INTRODUCTION
In 1966 approximately 90 per cent of cocoa growing area in Bahia,
Brazil, had trees more than 30 years old. From that date onwards the rate of
replanting and new planting grew more or less steadily until about 1980. The
average annual replanted and new planted hectarage during 1967-70 was about
731 and 1353 respectively, growing to 1026 and 7800 during the period 1971
to 1975, and rising still further to 4651 and 20841 during 1976-80 before
declining to 3510 and 10753 during the last five year period 1981-85. As a
result of this remarkable surge in replanting and new planting the ratio of
surviving pre-1966 cocoa area to the total planted area was just around 45
per cent in 1985. The purpose of this study is to throw light on the
factors that contributed to this post-1966 phase of extra-ordinary growth
following the stagnation of the previous two decades.
Analysis of replanting and new planting lies at the heart of the long-
term supply response. In the case of Derennials the short-term supply
elasticity is usually rather small; hence the long-term supply elasticity
depends critically on the response of replanting and new planting to price
incentives (Nerlove (1979), Binswanger et. al. (1987)). However, given the
relative dearth of suitable data on replantlng and new planting, such
studies are difficult to carry out. The heterogeneity of the planted area
and the peculiarities of perennial crop supply create challenges for both
theoretical and empirical analysis. To date there has been limited progress
in this area, due in large measure to the paucity of data on age-cohorts and

2
their productivity; see French, King and Minami (1985) and Hartley, Nerlove
and Peters (1985) for two recent examples.
Econometric equations for replanting and new planting will be derived
fros. a neo-classical cost of adjustmen. ivestment model modifled to allow
for "vintage effects", viz., differences In the productivity of trees in
different age-cohorts. This extends previous analyses. Using available data
on new planting and replanting since 1966 and average oroductivity at
different ages, and using the concepts described In Akiyama and Trivedi
(1987b), it has been possible to separate the potential output attributable
to pre-1968 and post-1966 planted area and to construct measures of
productivity on pre-1966 area1. These measures play an essential role in
explaining replanting behavior.
A fundamental difference between new planting and replanting decisions
arises from differences in the cost of adjustment. Whereas both Involve
Installation costs, replanting involves uprooting which results in a
(temporary) revenue loss whose magnitude depends upon the current and future
expected prices and on the average productivity of the uprooted trees.
Consequently high and rising prices and productivity tend to encourage new
planting and to discourage replanting.
The broad conclusion of the study is that the growth in Brazilian new
planting and replanting was a response to high and rising cocoa prices and
to zero or negative real interest rates that prevailed for most of our
sample period. That is, the evidence is consistent with the behavior implied
by the theoretical neo-classical investment model. However, in contrast to
1 This calculation, sometimes referred to as the vintage matrix methodfor calculating potential output is described in detail in Akiyama andTrivedi (1987a, 1987b).

3
new planting, the response. of replanting to variation in price is complex.
Since the immediate effect of an increase in price Is to improve the
productivity and profitability of marginal cohorts, which in turn reduces
the Incentive for uprooting and replanting, replanting Is related negatively
to price In the short-run; but over the long-term the positive effect of
improved profitabillty dominates the short-term negative effect.
The results of the analysis throw light on the efficacy of certain
policies, such as the role of Interest subsidies, intended to lead to the
rejuvenation of the cocoa sector, and on the prospects for future expansion
of this sector in Bahia.
The resainder of this paper consists of the descriptive Section II;
Section III sketches the analytical framework; Sections IV and V provide
econometric analyses of replanting and new planting respectively; Section VI
concludes.
4
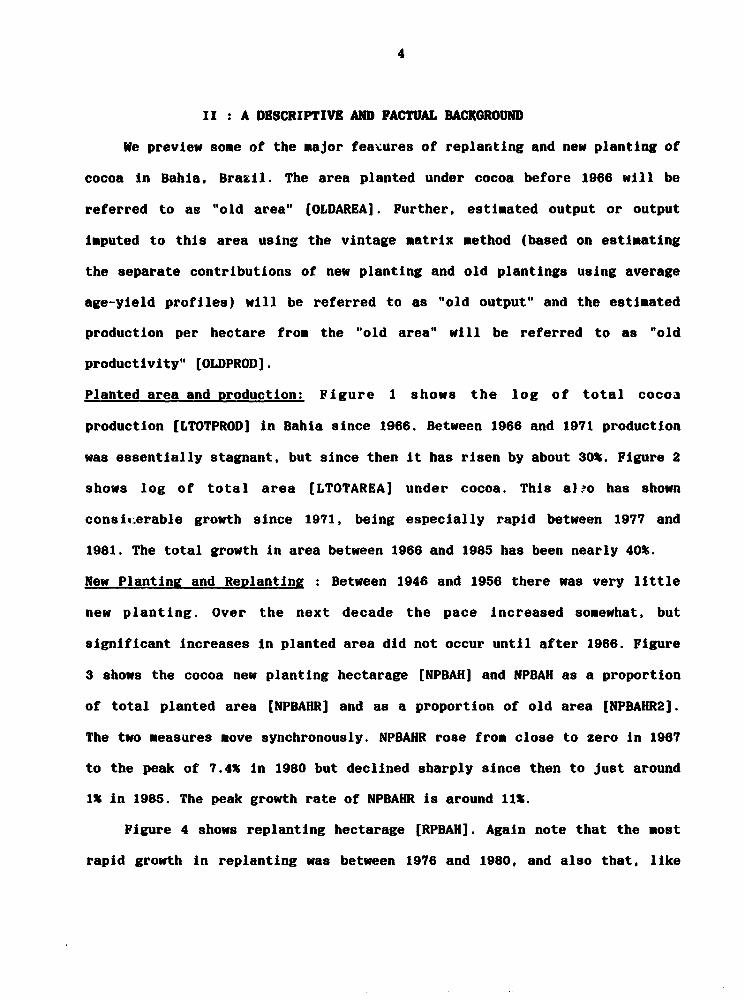
II A DESCRIPTIVE AND FACTUAL BACKGROUND
We preview some of the major features of replanting and new planting of
cocoa in Bahia, Brazil. The area planted under cocoa before 1966 will be
referred to as "old area" [OLDAREA]. Further, estimated output or output
Imputed to this area using the vintage matrix method (based on estimating
the separate contributions of new planting and old plantings using average
age-yield profiles) will be referred to as "old output" and the estimated
production per hectare from the "old area" will be referred to as "old
productivity" [OLDPROD].
Planted area and Droduction: Figure 1 shows the log of total cocoa
production [LTOTPRODJ in Bahia since 1966. Between 1966 and 1971 production
was essentially stagnant, but since then it has risen by about 30X. Figure 2
shows log of total area (LTOTAREA] under cocoa. This aJ^o has shown
consicerable growth since 1971, being especially rapid between 1977 and
1981. The total growth in area between 1966 and 1985 has been nearly 40X.
New Planting and Replanting Between 1946 and 1956 there was very little
new planting. Over the next decade the pace increased somewhat, but
significant Increases in planted area did not occur until after 1966. Figure
3 shows the cocoa new planting hectarage [NPBAHJ and NPBAH as a proportion
of total planted area [NPBAHR] and as a proportion of old area [NPBAHR2].
The two measures move synchronously. NPBAHR rose from close to zero in 1967
to the peak of 7.4X in 1980 but declined sharply since then to just around
1X in 1985. The peak growth rate of NPBAHR is around l1l.
Figure 4 shows replanting hectarage (RPBAH]. Again note that the most
rapid growth in replanting was between 1976 and 1980, and also that, like

5
new planting, replanting has declined botia absolutely and relatively since
1981.
Table 1 shows RPBAH, NPBAH and their respective growth rates for the
period 1967-1985. It is clear that new planting and replanting are rather
similar in their varlability. Figure 5 shows how the ratio of replanting to
new planting has varied over the period. From 1968 to 1976 new planting
rose, though not steadily, relative to replanting. However, between 1976 and
1984 this ter jency was reversed and replanting was almost 40% of new
planting in 194; since 1984 replanting has once again sharply declined
relative to new planting.
Age Distribution of Trees :The effect of replanting and new planting
undertaken in the last two decades has been a major rejuvenation in the age
structure of the cocoa tree stock. Table 2, derived from Knight (1976),
shows the estimated age distribution of the Bahia tree stock between 1936
and 1966. Accordingly, nearly 60% of the tree stock in 1966 was more than 40
years old. No estimates are available of the age distribution In the recent
years. As a rough index or the average age one may use the ratio of the
surviving pre-1966 planted area to total planted area [AGEINDEX]. This is
shown in Figure 6. As a consequence of the vigorous new planting and
replanting program, AGEINDEX has dropped nearly 60% in just over a decade.
Productivity Using information on the age distribution of trees planted
since 1966, together with estimated age ,ield profile data for new
plantings, the contribution of new plantJng to total production was
separated. By subtraction the contribution of old area can be derived, and

6
TABLE 1 : Sumary statistics on the level and percentage change li newplanting and replanting , 1987-1985.
Variable RPDAR MPDAR DLRPBRA DLNPBAB
Maximum 8788 31568 2.93 2.63Minimum 449 773 -1.28 -.77Mean 2572 10651 0.14 0.18Std. dev. 2465 9098 0.97 0.74
Notes : Fgures for RPBAH and NPBAH are In hectares. Those for DLRPBAH andDLNPBAH are annual percentage rates of change for RPBAH and NPBAN.respectively.
Table 2 : Estimated Age Distribution of Productive Cocoa Trees,Bahia, 1938-66
Age group, in yeare
>10 >20 >30 >40Year <20 <30 <40
1936 88 60 44 48(36.8) (25.1) (18.4) (20.1)
1946 116 88 60 92(32.7) (24.8) (16.9) (25.8)
1956 11 116 88 152(3.0) (31.6) (24.0) (41.2)
1966 33 11 116 86(8.3) (2.8) (29.0) (22.0)
Notes: Figures are thousands of hectares and (in parenthesis) percentage oftotal. Source Knight (1976).

7
division by OLDARKA yields OLOPROD. The log of OLDPROD, defined as LOLDPROD,
is shown in Figure 7. Compared with the estinates of productivity given by
Knight (1973). the yield on OLDAREA shows a dramatic rise from 367
kilos/lectare in 1967/68 to about 990 kilos/hectare in the late 1970's.
The increase ii the average productivity of old trees Is an important
phenomenon. Its source may be partly the increased use of better
agricultural practices, including the use of fertilizers, and partly the
high real cocoa prices that have prevailed through the 1970's. Figure 8
shows the log of the real cocoa price [LPRICOCO] rising dramatically between
1971 and 1976, and declining between 1976 and 1982 with a partial recovery
between 1982 and 1984.

8
III : ANALYTICAL FRANBUORK
The analytical framework for empirical anralysis is a neoclassical
investment model with convex adjustment costs. The model also incorporates a
vintage production technology, distinguishes between replanting and new
planting. It may be regarded as an extension of the type of model In Nickell
(1978) and Hayashi (1982); however, the treatment of uncertainty in our
model is still rudimentary.
Notation:
r(t) : real discount rate at t net of taxes or subsidies
ff(t) :profit or net revenue
pO(t) : real price of output net of taxes if any
F(K(t,v),L(t,v);tJ : production function for vintage v capital
K(t,v) : stock of capital of vintage v at time t, t > v.
L(t,v) : labor input combined with capital of vintage v.
R(t,v) : uprooting and replanting of vintage v capital at time t
G(R(t.v),K(t,v)l : output losses due to removal of vintage v capital
q(t) : purchase price of new capital net of grants or subsidies
C(Iv(t),K(t,v)] :installation costs of new planting or replanting.
The firm's objective is to maximize the present value of future after-
tax net receipts (y(t)J. The gross revenue function is the difference
between the value of total output of production from all economic vintages
[Po(t)EvF(K(t,v),L(t,v)] minus the total wage-bill. The convex function
G(R(t,v)),K(t,v)) denotes adjustment cost, i.e. the output costs associated
with investment at rate R(t,v). If R(t,v) is the rate of uprooting and
replanting, then G(.) can be regarded as the loss in potential real output
9
due to the reduction in the productive capital stock. Gross revenue net of
adjustment costs is p0(t)[F(.) - G(,)] - wagebill.
An alternative or an additional cost that may be included in the
revenue function is the convex cost of installation associated with new
planting, denoted by C(I(t),K(t,v)). The total cost of new investment is the
sum of the direct cost, denoted by q(t)I(t), and the installation cost
q(t)C(.). Therefore, at time t and for vintage v, the net after-tax revenue
is equal to the revenue from the output net of "lost output", minus the
wage-bill, and minus the direct cost of installation of the investment
goods. The decision problem is to choose the time paths of new planting and
replanting and labor input to maximize the present value of net after-tax
receipts, given the time-paths of prices of all inputs and output, the
technology and the capital accumulation equation.
Since the general solution to this decision problem is complex, or even
intractable, important simplifying assumptions are made. It will assumed
that a firm is either replanting (uprooting and then replacing) or
undertaking new planting, but does not simultaneously undertake both
activities. This allows us to ignore the complication arising from possible
interdependence in the cost of adjustment associated with the two types of
activities. 2 It also enables us to develop the view-point that the
essential difference between new planting and replanting as ways of
expanding productive capacity lies in the different costs of adjustment
associated with each. Specifically, it is suggested that replanting is
different from new planting because it involves higher output losses in
2 While it is difficult to judge the realism of this assumption forthe Bahia cocoa data, it will be a reasonable assumption if new planting andreplanting is undertaken by distinctly different groups of farmers.

10
addition to Installation costs.
The net revenue function for vintage v trees in period t is
w(t.v) - p0(t)(F[K(t,v),L(t,v)J - G[R(t,v),K(t,v)]) - w(t)L(t,v)
- q(t)I(t) - q(t)C[I(t),K(t,v)] (1)
where the first term on the right-hand side is the revenuo, net of output
loss due to replanting (if any) , the second term is the wage-bill, the
third term is the purchase cost of new capital, and the final term is the
installation cost of newly purchased capital.1 In the case of replanting the
last term will be omitted since no purchese of new capital (i.e. land is
involved). In the case of new planting only the output loss function Gt.]
will be omitted since no loss of potentially productive land is then
Involved. It is assumed that the functions FC.], G[.] and Ct.] are linear
homogeneous in their arguments. Further, the production function satisfies
conventional regularity conditions in that the marginal product of "Mature"
capital is positive and exhiblts diminishing returns. G].J and Ct.l are
convex cost functions such that G[ . 2 0 as R(t,v) 2 0, GRt.] > 0, ORR >
0, C[.1 2 0 as 1(t) a 0. C1[.] > 0, Ci1 > 0
Firm's total profit over all productive vintages is given by
w(t) - Ev w(t,v), v e V* (2)
where V* is the set of currently economic (and hence productive) vintages.
The stock of vintage v capital is given by
K(t,v) = K(t-l,v) - R(t,v) (3)
which assumes for simplicity that depreciation is zero and that there are no
exogenous unplanned losses.
Capital stock of vintage v capital, K(t,t) is given by
K(t,t) - I(t) - IV(t) (4)

11
By definition. replanting means removal of uneconomic vintage v capital and
replacement by trees of current vintage. That is, if the replanting option
is chosen then2
I V(t) = R(t.v). (5)
For convenience of exposition assume that the firm replantlng and new
plantlng decisions can be analyzed separately. This implies restrictions on
the structure of adjustment costs.
Define the ,agrangean function
H(t,v) - w(t,v) + l(t.v)tK(t,v) - K(t-l,v) * R(t,v)l
+ /A(t,v)(Iv(t) - R(t,v)] (6)
where (l(t,v), s(t,v)) are families of lagrange multipliers which may be
Interpreted respectively as the shadow prices of vintage v capital and
current capital replacing R(t,v). The firm's decision problem is to choose
either the replanting sequence (R(t,v)) or new planting sequence I,v (t)) so
as to unconstrainedly maximize the value of
V - E[Ea r(t+s)H(t+s)l 0(t-1)] (7)
where E denotes the operation of taking conditional expectations given the
information set Q(t-1) at t-I and the vintage v subscript is omitted for
notational convenience. Because the objective is to motivate behavioral
equations for aggregative analysis an interior solution is assumed and
corner solutions ignored. The necessary conditions for maximization (the
Ruler equations) are as follows:
Btl1(Po(t+8)FL(t+8) - w(t+s)) - 0 (8)
Et.1(PO(t+5)FK(t+5) - GK(t+s) - q(t+s)CK(t+s) + l(t+s)
- r(t)l(t+s+1)J - 0 (9)
Et_i(-Po(t+s)GR - A(t+s) + l(t+s)] = 0 (10)

12
Et-I[ -q(t+s) - q(t+s)C1 + ,(t+s)] - 0 (11)
In the Euler equations L, F K' GRP Cl, and CK denote the first partial
derivative of the respective functions with respect to the subscripted
variable. (These derivatives may themselves be separable functions of time
but this feature is omitted here for convenience).
Eliminating M(t+s) from (10) and (11) yields
l(t+s) = Et l(po(t+S)GR + q(t+s) + q(t+s)C 1 (12)
where the sight-hand side is the expected marginal cost of replanting.
Ass'iming now a constant real discount rate, say r, from (9) solve for l(t+s)
to obtain
l(t+s) - Et_E. rs[PO(t+s)(FK - GR) - q(t+s)CKJ (13)
where the right-hand side is the expected discounted present value of the
marginal revenue product of capital net of adjustment costs of capital.
Eliminating l(t+s) from (12) and (13) yields the basic equation from
which one may derive the replanting and new planting equations, viz.
Et_l{po(t+s)GR + q(t+s)(1+C,)=E, r (Po(t+s)(FK-GK)-q(t+s)CK) (14)
which can be regarded as a generalization of the familiar condition from the
adjustment cost models of investment in which the optimal rater of
investment is given by the equality of the marginal cost and present value
of benefits of investment.
The desired investment equation is a closed form solution to this
equation. However, such a closed form solution can only be derived after
imposing restrictions on the form of the production function and the
adjustment cost function and making strong assumptions about the expected
time path of prices. Specifically, a necessary condition is that the
production function is homogeneous and that the adjustment cost function Is

13
homogeneous and quadratic, (Nickell (1978)). Given these assumptions the
above equation can be solved for I(t)/K(t,v).
Linear homogeneity implies that the first partial derivatives are
functions of the ratios of their respective arguments, viz., K/L, or I/K or
R/K. A further assumption is that the functions G and R are quadratic in
their arguments such that the partial derivatives GR' CI are linear
functions of their arguments. That is, for each vintage v,
GR(t+s) = aO + a1(R(t+s)/K(t+s)) ao, a, >0 (15a)
GK(t+s) - 0 - _(R(t+s)/K(t+s)) ,o 19 >0 (15b)
CI(t+9) r0 + 'r1(Iv(t)/K(t+s)) To, t1>° (15c)
CK(t+s) 'I0 - d4IIv(t)/K(t+s)) do 81>0 (15d)
Combining (15a)-(16d) and (14) yields
Et 1 (pO(t+s)(a0 +aI(R(t+s)/K(t+s)) + q(t+s)(1+c0+cI(Iv(t+s)/K(t+s)) =Ea
r Po(t+s)(FK-.GK) - q(t+s)(do+d1(lv(t+s)/K(t+s))]). (16)
To derive an equation for R(t+s)/K(t4s), set R(t+s)-I,v(t+s), omit the term
q(t+s) from the right-hand side and solve (16) for the replanting ratio
R(t+s)/K(t+s). Under the stated assumption of linear homogeneity of F, FK
along the optimal path will be a function of relative prices alone. Even
with these assumptions a closed form solution for R/K seems unlikely to be
obtained.
To derive the equation for Iv(t+s)/K(t+s), the same approach may be
followed, omitting the terms involving G. In this case (16) simplifies to
Et_l{fq(t+s) (I+,o+,rl(](t.+s)/K(t+s) ) =
E r (Po(t+s)FK - q(t4s)(d0+dj(I(t+s)/K(t+s))]j (17)
which may be readily solved for I v(t+s)/K(t+s).
For empirical analysis the model needs modification. For the replanting

14
equations we need to modify G[.t and Cr.] to reflect the effects of relevant
exogenous variables. Specifically add to the right-hand side of (15a) and
(15b) a term involving the average productivity of capital. In general this
is of course endogenously deterained. However, under the assumption that
tree-crops display a typical biologically determined pattern of productivity
change, the output loss associated with the reduction in capital due to
replanting would be related systematically to the average product of capital
for that vintage. 'n many cases, the older the vintage the lower will be the
loss of output due to replanting. Let PROD denote average prAductivity. Then
modify (15a) to
GR(t+s) - s + a1(R(t+s)/K(t+s))+ a2PROD(t+s), o2>, (18)
which may be further modified to
3R(t+s) - ao + al(R(t+s)/K(t+s))+ a2(t+s)(PROD(O)), (18a)
if PROD has a profile that depends upon age alone.
The function CI may also be modified to take into account exogenous
variables such as implicit or explicit replanting and/or new planting
subsidies designed to affect the adjustment. Denoting by Z2 the set of such
variables , (15c) aay be rewritten as follows:
CI(t+s) - to + rl(Iv(t+s)/K(t+s))+ r2Z2. (19)
Consider soae modifications of the right-hand side of (16), interpreted as
the expected net discounted marginal productivity of Investment, referred to
-as HER for brevity. This depends upon the time-paths (p0(t+s),q(t+s),w(t+s))
and also on the discount rate r. Separate and distinct expectational
assumptions about the time-paths of prices will lead to an empirically
intractable nodel. More simply, write the MER(t+s) function in terms of
average revenue per unit of capital, denoted by AR(t+s)/K(t+s) and the

15
discount rate r(t+s):
NRR(t+e)- Et-,[ *o + *1(A4,(t+s)/K(t+s)) - 02r(t+s)J (20)
The assumption of linearity is rather special, though similar
assumptions have been made In the so-called Q-theory investment literature.
Such a specification implies that the firm takes a short-cut by forming
expectations directly in terms of revenue rather than separately
for its components. Finally substitute the above assumptions into (16) and
solve for R(t+s)/K(t+s) or I(t+s)/K(t+s). The replanting equation is
((a2p 0(t+s) + clq(t+s))(R(t+s)/K(t+s))J E StI (-aOpo(t+s)
- cZPROD(t+s) - r 2 q(t+s)Z 2 (t+s) + 00e+ 0 1(AR(t+s)/K(t+s))
- e2r(t+s)) (21)
The price variables enter this equation In a multiplicative fashion. A
linearized version of this equation is
R(t+s)/K(t+s) Et1 (-Aipo(t+s) - A2q(t+s) - A3PROD(t+s)
- c2Z2(t+s) + DI(AR(t+s)/K(t+s)) - D2r(t+s)) (22)
where all coefficients are positive a priori. Thus the replanting rate is
negatively related to the expected output price, the price of new capital
and the real interest rate and positively to the expected average revenue.
The new planting equation is simpler since the terms- arising from G[. I do
not appear. Thus we have
t(t+s)/K(t+s) = - B1q(t+s) - B2Z2(t+s) + B3 (AR(t+s)/K(t+s)-
B4r(tes)). (23)
Aefregation The derivations given above apply to planting rates
relative to the stock of a single vintage, i.e., the cohort of trees planted
in any one year. Thus the replanting rate would be the proportion of trees
In that cohort that are replanted (compare French, King and Ninami (1985)).

16
New planting could be defined relative to the size of any cohort. But data
constraints are likely to lead to aggregation of vintages. The criteria for
aggregation are likely to be case dependent. However, the use of broad age
classes has pragmatic appeal. Further, under average conditions productivity
may vary systematically with age. It seems natural in such cases to
aggregate across all age cohorts greater than (say) X years as If these were
acceptably homogeneous. The replanting rate is sometimes defined as total
replanting as a proportion of ail area older than X years. This assumes that
replanting have not occurred in younger cohorts3. Glven suitable data,
separate replanting rate for each age-class may be considered 4. In the case
of new plantings it is not obvious which aggregate stock of capital should
5be used to define the rate of new plantings
3 French, King and Minami (1985) provide examples to the contrary.
4 Often data may be available only on total replanting but it may bepossible to separate the capital stock into at least two age classes, saypre- and post-year Y. This will provide an opportunity for estimatingequations with different dependent variables.
5 One obvious alternative is to exclude only the immature vintages. Anarrower aggregate is obtained by taking all vintages considerably olderthan even the mature vintages. Since the choice is arbitrary an econometricsensitivity analysis seems desirable.

17
IV : AN ECONOKETRIC MODEL OF REPLANTING
The starting point of empirical analysis is the first-order condition
for revenue maxilmization which states that the rate of investment must be
such as to equalize the present value of net marginal expected revenue
(MER) from additional investment and the marginal cost of investment (MCI).
For exposition, write this In the form
MER(I(t),K(t,v); Z1) = MCI(I(t),K(t,v); Z2). (24)
It Is possible that the variables Z2 in the new planting and replanting
equations are different.
SDecification of MER(.) function
(1) MER per unit of investment is increasing in the expected net
marginal revenue product of capital. Given constant returns to scale the
latter can be expressed as a funct.ion of expected future taxes, wage rates
and product prices. But a separate specification for each of these, leading
to an average or marginal revenue specification, will lead to an
overparametrized model. A simpler approach is to specify an equation for
expected revenue directly.
Accordingly it will be assumed that firms base their decisions on
forecasts of gross revenue per unit capital and that the expected gross
marginal revenue product per unit of investment is linear In expected
average gross revenue which ic turn is a linear function of lagged average
gross revenue.
(2) A priori G(.) is quadratic and homogeneous and has a positive
first derivative with respect to I(t)/K(t,v). A higher rate of replanting
implies an initially smaller capital stock and higher immediate costs of
"lost output", for a given price of output. Marginal net revenue product of

i8
a unit of replanting is decreasing in the real value of "lost output", which
in turn Is Increasing in the expected real price of cocoa. For any given age
structure of capital, high expected future price implies a future demand for
a larger productive stock and a corresponding higher present opportunity
cost of replanting.
(3) The marginal product of scrapped capital is endogenouslY
determined. Economic age of capital is also endogenous. But biologically-
determined age-related changes In the productivity of capital stock
introduces an exogenous component. For example, productivity may decline
monotonically after certain age, say 40 years. Then the marginal value of
"lost output" due to replanting will be a decreasing function of the age of
the scrapped capital. Such a dependence could be captured by making expected
losses in revenue depend upon an index of age, e.g. AGEINDEX mentioned in an
earlier section.
An alternative specification would include a variable reflecting the
(unobservable) average productivity of marginal capital, i.e. capital that
earns zero quasi-rents, see Hartley, Nerlove and Peters (1986). Here it will
be assumed that the average productivity of marginal capital is linear in
the average productivity of the "old capital", i.e pre-1966 stock of trees.
A priori, "lost output" is positively related to OLDPROD; hence, the rate of
replanting will be negatively related to OLDPROD.6
(4) The expected marginal revenue is a decreasing function of the
discount rate. The higher the discount rate used in the calculation of
marginal expected revenue, the lower will be the expected revenue associated
6 Average measured productivity will generally include a componentwhich responds to price movements.

19
with replanting.
sDecification of MCIUJ) function
(5) The standard convex, quadratic and homogeneous formulation of C[.J
is modified by including the multiplicative variable I(t)/K(t,v)*RSUBRATE In
the cost function, where RSUBRATE is Intended to account for the real
subsidies per hectare given for replanting. The specific subsidy effect
modelled this way is the interest rate subsidy glven by CEPLAC to cocoa
producers In the period 1979 to 1985 . A priori, the partial derivative of
Ct.I with respect this variable Is negative, reflecting the reduction in
marginal Installation costs due to replanting subsidies.
(6) AdJustment cost models typically specify the marginal adjustment
costs to be q + C1, where q Is the unit purchase price. However, since no
such direct cost ot purchase of land Is involved for he replanting
producer, it may be omitted in our model of replanting but should be
Included In the model of new planting.
Linearizing equation (24) yields
rn + r1GREVE - r2REALINT - r3PRIE - r4OLDPROD - r5RPBAHR2 -
8;+ c2RPBAHR2 - c3RSUBRATE + ERROR (25)
where
GREVE expected gross revenue per replanted unit of capital
REALINT real interest rate as proxy for the discount rate
PRIE expected real cocoa price
OLDPROD estimated average productivity (MT/HA) on OLDAREA
RSUBRATE : real subsidy rate for replanting.
RPBAHR2 replanting divided by OLDAREA
7 CEPLAC memo; October 1987.
All coefficients are posltlve a priori.
Since this still involves unobservables additional simplifying assumptions
are required to obtain the final estimating equations in terms of
observables. GREVE is proxied by either a second-order autoregression on two
past values of the variable AREVPROD, which measures gross revenue per unit
of old capital, or more restrictively by a two-period moving average of
AREVPROD.
GREVE(t) a aIREVPROD(t-l) + a2AREVPROD(t-2)
We require a measure of expected after-tax revenue on replanted area whereas
AREVPROD measures avere.- pre-tax revenue on OLDAREA. For present purposes
this will be defined as the measure of real gross revenue per hectare of old
area (AREVPROD] as the product of PRICOCO and OLDPROD, where PRICOCO is
real price per kilo of cocoa beans, and OLDPROD is the yield per hectare.
For some purposes this calculation is deficient. First, the calculation of
OLDPROD includes even area which may be currently uneconomic to harvest.
Therefore, ARLJPROD understates the revenue per unit of harvested area.
Second, the measure of operating costs excludes the imputed cost of services
of land which is theoretically relevant. Third, the direct costs of
acquiring new land are ignored. However, this is not necessarily a serious
problem if one wishes to use AREVPROD to explain replanting and it also
happens to be the case that replanting and new planting are undertaken by
essentially different enterprises. To the replanters the cost of new land is
not a part of the costs of production and should be excluded. To the new
planters who will necessarily face such a cost, AREVPROD will overstate the
average revenue per hectare of old area. Its behavior is of course heavily
correlated with that of PRICOCO which has a direct effect and an indirect

21
effect through OLDPROD. Excluding taxes is not serious since the producer
taxes have been static for the Bahia cacoa producers. Perhaps revenue on
newly planted area may provide a better surrogate variable. On the other
hand, it can also be argued that the relevant expectations may be those
based on the past experience of those currently replanting rather than those
engaged in new planting. This would justify the use of AREVPROD.
Analogously, PRIE will be proxied by either last period's price,
denoted PRICOCO(t-1) or by a moving average of two past prices, denoted
MAPRI. This, of course, is a very simple assumption . However, the Dickey-
Fuller did not reject the hypothesis that PRICOCO is first orie'r
autoregressive with a unit root, which suggests that the "naive" forecasting
rule assumed here is actually the optimum rule.
Combining the assumptions yields the following basic replanting
equation
RPBAHR2(t) = d(ro-c ) + dr a AREVPROD(t-1) + dr a2 AREVPROD(t-2)-
dr2REALINT(t-1) - dr3bPRICOCO(t-1) - dr4OLDPROD(t-1)
+ dc3RSUBRATE(t) (26)
where d=1/(c1+r4) > 0.
In summary, the rate of replanting can be expected to rise when average
revenue on existing area has bean rising, and when the real subsidies are
increased, but will tend to fall when the real interest or the real producer
price of cocoa or the productivity of existing area rises.
8 However, using the arguments given elsewhere [see Akiyama and Trivedi(1987)1 it would appear that the relevant model of world cocoa pricedetermination is likely to be complex in terms of its informationalrequirements and a simpler assumption such as that which made above hasappeal in terms of the acknowledgement of the limited informationalresources available to the cocoa producers.

22
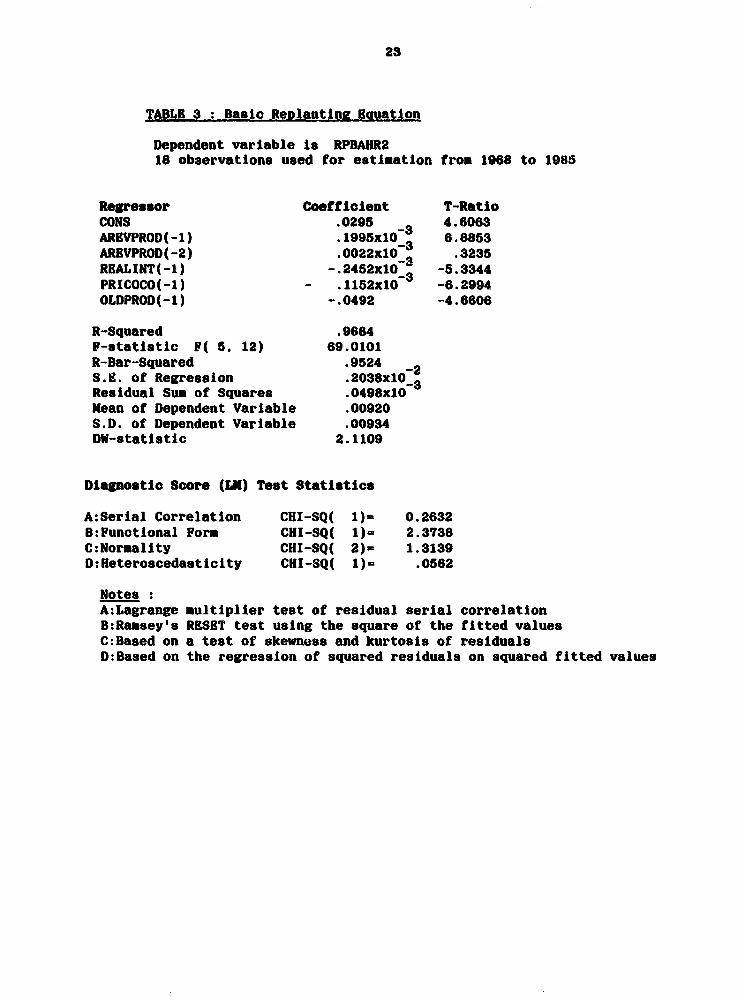
Tho Results
The estimates of the basic equation estimated for 1968-85 without the
subsidy variable RSUBRATE are given In Table 3, the variant with the subsidy
variable is In Table 4. All coefficients are well-determined and have a
priori expected signs, with the exception of AREMPROD(-2). The fit of the
equation as Judged by the R-Bar squared coefficient, the absence of serial
correlation and heteroscedasticity in the residuals and the diagnostic test
of the functional form, is good, perhaps surprisingly so. The graph of
predicted vs. actual values for the dependent variable shows no significant
episodes
23
TABLE 3 : Basic Reolantinf Eauation
Dependent variable Is RPBAHR218 observations used for estimation from 1968 to 1985
Regressor Coefficient T-RatioCONS .0295 3 4.6063AREVPROD(-1) 1995xlO 3 6.8853AREVPROD(-2) .0022xlO 3 .3235REALINT(-1) -.2452xlO 3 -5.3344PRICOCO(-1) - .1152xlO -6.2994OLDPROD(-1) -.0492 -4.6606
R-Squared .9664F-statistic F( 5, 12) 69.0101R-Bar-Squared .9524 -2S.1. of Regression .2038xlO 3Residual Sum of Squares .0498xlOMean of Dependent Variable .00920S.D. of Dependent Variable .00934DW-statistic 2.1109
Diagnostic Score (LK) Test Statistics
A:Serial Correlation CHI-SQ( 1). 0.2632B:Functional Form CHI-SQ( 1)- 2.3738C:Normality CHI-SQ( 2)- 1.3139D:Heteroscedasticity CHI-SQ( 1)- .0562
NotesA:Lagrange multiplier test of residual serial correlationB:Ramsey's RESET test using the square of the fitted valuesC:Based on a test of skewness and kurtosis of residualsD:Based on the regression of squared residuals on squared fitted values

24
unexplained by the regression. The leverage chart shows that most of the
explanatory power of the regression derives from post 1977 data. As was
noted earlier this coincides with the period of most rapid growth In
replantling.
As a part of the diagnostic checking of the equation tests of parameter
stability based on the CUSUJM and CUSUNSQ of the recursive residuals were
also carried out and these also Indicated that the basic equation was
satisfactory. Figures 9-12 provide plots of the coefficients of
10significant variables based on recursive regression . These plots show
considerable stability in the signs of the coefficienrts post 1976.
CompR ison with some variants: Before turning to an analysis of the policy
implications of the results It Is useful to compare the basic equation with
some of the variants. In one two-period moving averages of PRICOCO and
OLDPROD were used In place of the one-period lagged values; In another the
surrogate variable AGEINDEX was substituted In place of OLDPROD. In yet
another only one of the two variables REALINT and REALSUJB was tried.
First, consider the role of subsidies on Interest payments of the
replanters . Observe from Figure 13 that RSUBRATE and REALINT were
stziff'iy negatively related over the period of subsidy. Note that the period
over which the subsidies weere given was quite short compared with the sample
The results were less satisfactory when the dependent variable RPBAIRRwas used, which again suggests that deflation by OLDAREA rather than TOTAREAis more appropriate.
10 See Dufour (1982) for a survey of recursive regression techniquesfor the regression model. The calculations reported here were executed usingDATAFIT program by Pesaran and Pesaran (1987).
11 The figures for interest rate subsidies were provided by CEPLAC.

25
period. The rate of subsidy rose as REALINT fell sharply from 1977 to 1980,
and fell as REALINT rose sharply between 1981 and 1985. This strong negative
correlation, in conjunction with the absence of substantial variation in
REALINT before 1975, makes it very difficult to separate the individual
effects of the two variables. It is clear from Table 4 that REALSUB does
have a strong effect on the rate of replanting provided REALINT(-i) is
excluded from the equation. Nevertheless, since the diagnostic tests of the
resulting equation show evidence of both serial correlation and
heteroscedasticity, and, moreover, the coefficients in this variant are not
uniformly precisely determined, the basic equation of given earlier seems
preferable. To confirm this preference for the basic equation, non-nested
hypothesis tests were run to compare the two variants. The results given in
Table 5 generally favor the specification with REALINT(-1) over that with
RSUBRATE. It is emphasized that even though the REALINT specification is
favored, the available evidence is consistent with the hypothesis that the
interest rate subsidies given by CEPLAC stimulated replanting.
Now consider the specifications based on two-period moving averages of
PRICOCO and OLDPROD, denoted, respectively, by MAPRI and MAOLDPR. The
estimated equation had sharply determined coefficients, but provided no
improvement in the overa'l fit of the model. Actually there is a slight
deterioration. Once again the basic specification is favored by the non-
nested tests given in Table 6 though the margin of improvement offered by
the basic model is slight.
Finally, consider the choice between two possible determinants of "lost
output", AGEINDEX and OLDPROD. When AGEINDEX(-1) is substituted in place of

26
TABLE 4 : Replanting Equation with Subsidy Variable
Dependent variable Is RPBARR218 observations used for estimation from 1968 to 1985
Regressor Coefficient T-RatioCONS .0069743 3 1.1821ARBVPROD(-1) .0828x 0 3 2.9185AREVPROD(-2) -.0057x 0-2 -.8038RSUBRATE .1194xlO 4.1312PRICOCO(-1) -.0366xlO -1.8451OLDPROD(-1) -.9990X10 2 -1.0819
R-Squared .9532F-statistic F( 5, 12) 48.9066
R-Bar-Squared .9337S.E. of Regression .0024 3Residual Sum of Squares .0694xlOMean of Dependent Variable .0092S.D. of Dependent Variable .00934DW-statistic 2.7985
TABLE 5 : Tests for Mon-Nested Regression Models
Dependent variable is RPBAHR2Regressors for model MI: CONS, AREVPROD(-1), AREVPROD(-2),
RSUBRATE, PRICOCO(-1), OLDPROD(-1)Regressors for model K2: CONS, AREVPROD(-1), AREVPROD(-2),
REALINT(-1), PRICOCO(-1), OLDPROD(-1)
Test Statistic MI against K2 K2 against MN
COX-PESARAN TEST -4.0023 -1.3238ADJUSTED COX-PESARAN -3.0145 -. 9773DAVIDSON-MACKINNON J-Test 2.3284 .8935ADJUSTED J-Test 2.3284 .8935
Model MI: DW 2.7985 ;R-Bar-Squared .9337Model M2: DW 2.1109 ;R-Bar-Squared .9524Akaike's Information Criterion of MI versus M2= -2.9756
favours M2

27
TABLE 6 : Tests for Non-Nested Regression Models of Replanting
Dependent variable is RPBAHR2Regressors for model MI: CONS, AREVPROD(-l), AREVPROD(-2),
REALINT(-1), MAPRI, KAOLDPRRegressors for model M2: CONS, AREVPROD(-l). AREVPROD(-2),
REALINT(-1), PRICOCO(-1). OLDPROD(-1)
Teot Statistic Ml agalnst M2 M2 against MI
COX-PESARAN TEST -2.5758 -1.4636ADJUSTED COX-PESARAN -1.8761 -1.0374DAVIDSON-MACKINNON J-Test 1.6607 1.0080ADJUSTED J-Test 1.6792 .9518
Model Ml: DV 1.9375 ;R-Bar-Squared .9459 88.4834Model M2: DW 2.1109 ;R-Bar-Squared .9524 89.6325Akaike's Information Criterion of Ml versus K2 - -1.1491 favours M2
28
OLDPROD(-1), there was significant deterioration in the fit of the model,
though all coefficients retained their a priori expected signs. The non-
nested model test comparisons unequivocally support the basic specification
over the alternative.
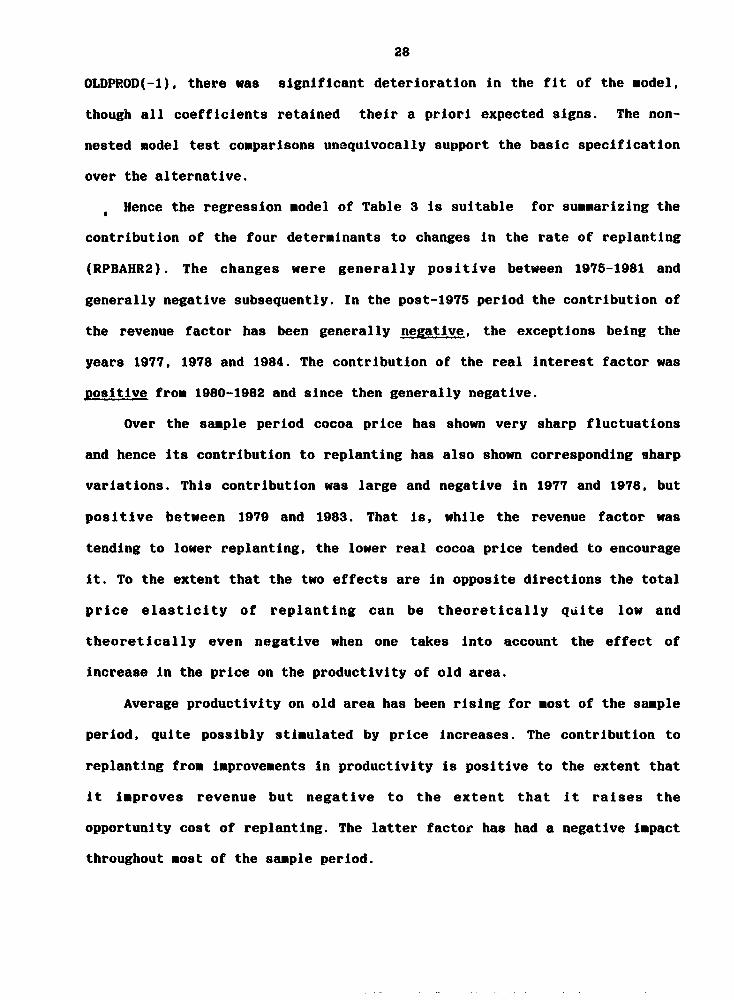
. Hence the regression model of Table 3 is suitable for summarizing the
contribution of the four determinants to changes in the rate of replanting
(RPBAHR2). The changes were generally positive between 1975-1981 and
generally negative subsequently. In the post-1975 period the contribution of
the revenue factor has been generally negative, the exceptions being the
years 1977, 1978 and 1984. The contribution of the real interest factor was
positive from 1980-1982 and since then generally negative.
Over the sample period cocoa price has shown very sharp fluctuations
and hence its contribution to replanting has also shown corresponding sharp
variations. This contribution was large and negative in 1977 and 1978, but
positive between 1979 and 1983. That is, while the revenue factor was
tending to lower replanting, the lower real cocoa price tended to encourage
It. To the extent that the two effects are in opposite directions the total
price elasticity of replanting can be theoretically quite low and
theoretically even negative when one takes into account the effect of
increase in the price on the productivity of old area.
Average productivity on old area has been rising for most of the sample
period, quite possibly stimulated by price increases. The contribution to
replanting from improvements in productivity is positive to the extent that
it improves revenue but negative to the extent that it raises the
opportunity cost of replanting. The latter factor has had a negative impact
throughout most of the sample period.
29
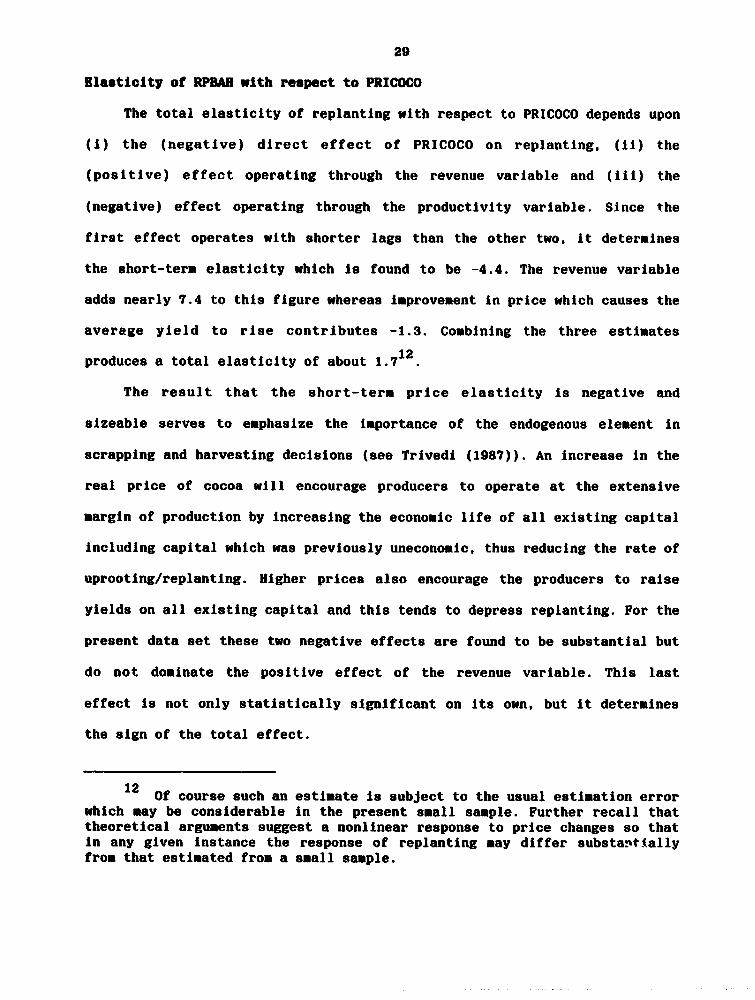
Elasticity of RPBAH with respect to PRICOCO
The total elasticity of replanting with respect to PRICOCO depends upon
(1) the (negative) direct effect of PRICOCO on replanting, (ii) the
(positive) effect operating through the revenue variable and (iii) the
(negative) effect operating through the productivity variable. Since the
first effect operates with shorter lags than the other two, It determines
the short-tera elasticity which is found to be -4.4. The revenue variable
adds nearly 7.4 to this figure whereas improvement in price which causes the
average yield to rise contributes -1.3. Combining the three estimates
produces a total elasticity of about 1.712.
The result that the short-term price elasticity is negative and
sizeable serves to emphasize the importance of the endogenous element in
scrapping and harvesting decisions (see Trivedi (1987)). An increase in the
real price of cocoa will encourage producers to operate at the extensive
margin of production by increasing the economic life of all existing capital
including capital which was previously uneconomic, thus reducing the rate of
uprooting/replanting. Higher prices also encourage the producers to raise
yields on all existing capital and this tends to depress replanting. For the
present data set these two negative effects are found to be substantial but
do not dominate the positive effect of the revenue variable. This last
effect is not only statistically significant on its own, but it determines
the sign of the total effect.
12 Of course such an estimate is subject to the usual estimation errorwhich may be considerable in the present small sample. Further recall thattheoretical arguments suggest a nonlinear response to price changes so thatin any given instance the response of replanting may differ substantiallyfrom that estimated from a small sample.

30
Interest rate effects
The partial derivative of replanting with respect to the real interest
rate is negative and highly signiticant statistically1 . The change In
interest rate has been of the order of fifty percentage points In some
years. e.g. 1980. and this implies a reduction In replanting of about 4035
(- 0. 2452xlO3 x50x329189) hectares. Comparison with the data in Table I
shows this to be a large effect. Clearly, real interest subsidies can be
expected to have significant stl-ulatory effects.
13 The interest rate elasticity calculated at the sample mean realinterest rate of about -15 (see Figure 21) is 22sitive at about 0.48. Sincethe real interest rate has fluctuated between positive and negative valuesthe elasticity value as such is not very meaningful.

31
V : ICONONBTRIC ANALYSIS Of MM PLANTING
The new planting equation is derived In a manner similar to that for
replanting, but the specifilcation of the costs of adjustment is different1 4
New planting decisions are based on expected profit calculations. In
estimating expected gross revenue the operating costs and average yield at
maturity should be those which apply to the variety being considered. It is
likely that the average yield at maturity of newly planted areas may be
substantially different from the yield on older areas due to differences in
soil fertility, chosen varieties and the average age of planted area.
Despite this the first alternative considered for proxying expected revenue
of new planting is AREVPROD. Again two lagged values of AREVPROD are used to
proxy GREVE. The major justification for this Is that, given the relative
unimportance of new planting before 1966, and the rather low level of new
planting until 1975, reliable estimates of the revenue of new planting based
on the yield of newly planted area cannot be formed except for a rather
small part of our sample. Estimation based on such a small sample will not
yield useful results. On the other hand, it is at least plausible that the
movements in the revenue of newly planted areas should closely mirror the
movements in revenue of the older areas since both depend to some extent on
PRICOCO.
Yet another possibility is to specify expected revenue to be a linear
function of two lagged values of PRICOCO. Such a specification ignores an
important component of revenue, viz, average yield, but could involve a
relatively smaller error than using AREVPROD variable if the past yield on
14 It may be argued also thet the relevant measure of expected revenuealso should be different.
32
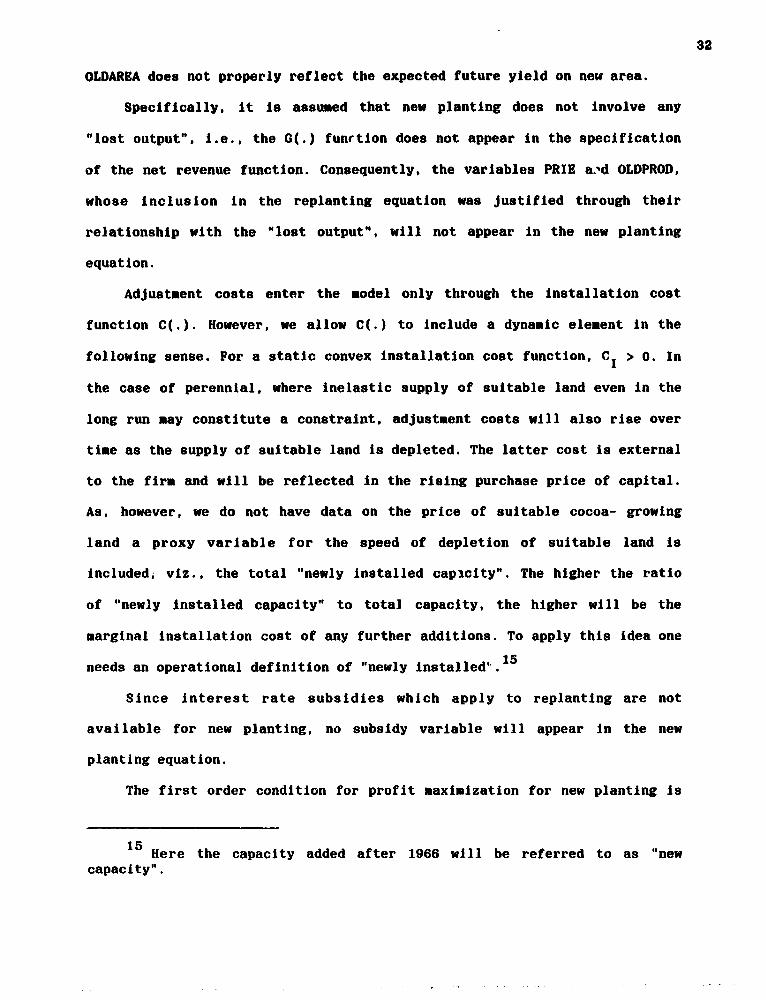
OLDAREA does not properly reflect the expected future yield on new area.
Specifically, It is assumed that new planting does not involve any
"lost output", i.e., the G(.) function does not appear in the specification
of the net revenue function. Consequently, the variables PRIE and OLDPROD,
whose inclusion in the replanting equation was justified through their
relationship with the "lost output", will not appear in the new planting
equation.
Adjustment costs enter the model only through the installation cost
function C(.). However, we allow C(.) to include a dynamic element in the
following sense. For a static convex installation cost function, CI > 0. In
the case of perennial, where inelastic supply of suitable land even in the
long run may constitute a constraint, adjustment costs will also rise over
time as the supply of suitable land is depleted. The latter cost is external
to the firm and will be reflected in the rising purchase price of capital.
As, however, we do not have data on the price of suitable cocoa- growing
land a proxy variable for the speed of depletion of suitable land is
includedi viz., the total "newly installed capicity". The higher the ratio
of "newly installed capacity" to total capacity, the higher will be the
marginal installation cost of any further additions. To apply this idea one
needs an operational definition of "newly installed". 15
Since Interest rate subsidies which apply to replanting are not
available for new planting, no subsidy variable will appear in the new
planting equation.
The first order condition for profit maximization for new planting is
Here the capacity added after 1966 will be referred to as "newcapacity".

33
that the present value of marginal expected revenue from new planting should
16equal its marginal installation cost . As before a linear MER function is
specified in the variables AREVPROD(-1), ARBVPROD(-2). and REALINT. The
marginal Installation cost Is also linear In PLAND which is the empirical
counterpart of the theoretical variable q; the rate of new planting as
measured by either NPBAHR or NPBAHR2 and a variable measuring the ratio of
"newly Installed capacity" to old capacity or total capacity, measured by
either KNPLR, KNPLR2 or NEWCAPR2. Thus we have
rO + r1AREVPROD(t-1) + r2AREVPROD(t-2) - r3REALINT(t)
- PLAND(t) + c0 + cINPBAKR(t) + c2KNPLR(t-1) (27)
Rewriting gives an equation for new planting
NPBAHR(t) - d(r0 - c0) + drIAREVPROD(t-1) + dr2AREVPROD(t-2)
- dr3REALINT(t) - dPLAND(t) - dc2KNPLR(t-1) (28)
where d-l/c1.
In sumaary, the rate of new planting is related positively to the
average revenue on existing planted areas, negatively to the discount rate,
negatively to the price of land and negatively to the ratio of newly planted
area to the old area. The variable PLAND is actually omitted from the
estimated equation because of lack of data, but theoretically it should be
present. Its inclusion will capture the external adjustment costs that are
17likely to be important for the sector as a whole
Two aeasures of the rate of new planting, NPBAHR and NPBAHR2, move
16 It is assumed that there Is an interior solution for the rate of newplanting.
17 The seriousness of the misspecification ensuing from the omission ofthe price of land will be case dependent, being the greater when areaexpansion nears the limit of suitable available land.

34
synchronously and the regression results for the two are also rather
similar, except that residual serial correlation is a more serious problem
when the dependent variable is NPBAHR.
As an estimate of newly installed capacity relative to total capacity,
two measures have been tried. The first Is simply the ratio of area planted
after 1966 to the total area planted, denoted KNPLR, a slight variant of
this being KNPLR2 where the divisor was OLDARBA. The second measure Is
NEWCAPR2, the estimated proportlonal contribution to total cocoa production
due to the area planted since 1966. This is based on the potentlal
production calculations alluded to earlier. The regression results using the
different variants are broadly similar but those based on NRWCAPR2 are
marginally superior in terms of statistical fit.
The estimated equations reported here incorporate a small variation on
equation (27) above. The latter may be properly interpreted as an equation
for Planned rate of new planting. Allow the actual rate to differ from the
planned rate by an amount that dep.erd2 upon the percentage error of price
expectation, denoted by CHPRI, which in the present case is simply the
percentage change in PRICOCO between current and last period. That is, price

35
TABLE 7: Basic new planting equation
Dependent variable Is NPBAHR218 observations used for estimation froa 1968 to 1985
Regressor Coefficient T-RatioCONS -.0163 3 3.4623PRICOCO(-1) .0735xlO 3 5.2300PRICOCO(-2) .0437xlO 2.6948CHPRI .0117 -2 2.2021kRALINT -.104x10 -10.0122NEWCAPR2(-i) -.0198 -1.9917
R-Squared .9663F-statistic FP 5, 12) 68.7542R-Bar-Squared .9522s.E. of Regression .0070318 3Residual Sum of Squares .5934x10Mean of Dependent Variable .0369S.D. of Dependent Variable .0322DW-statistic 1.67fit
Diagnostic Score (LK) Test Statistics
A:Serial Correlation CHI-SQ( 1)= .2901B:Functional Form CHI-SQ( 1)= .2783C:Normallty CHI-SQ( 2)= .8643D:Heteroscedasticity CHI-SQ( 1)= .7206
TABLE 8 : Tests for Mon-Nested Models of New Planting
Dependent variable is NPBAHR2Regressors for model M1: CONS, PRICOCO(-1), PRICOCO(-2), CHPRI,
REALINT, NEWCAPR2(-1)Regressors for model N2: CONC, AREVPROD(-1), AREVPROD(-2).
REALINT, CKPRI, NEWCAPR2(-1)
Test Statistic Ml against K2 K2 against Ml
COX-PESARAN -.6627 -1.4303ADJUSTED COX-PESARAN -.4068 -.9602DAVIDSON-MACKINNON J-Test .9022 1.4457ADJUSTED JA-Test .1700 .4942Model Ml: DW 1.6761 ;R-Bar-Squared .9522Model K2: DW 1.5614 ;R-Bar-Squared .9482Akalke's Information Criterion of Ml versus M2= .7343 favours Ml
36
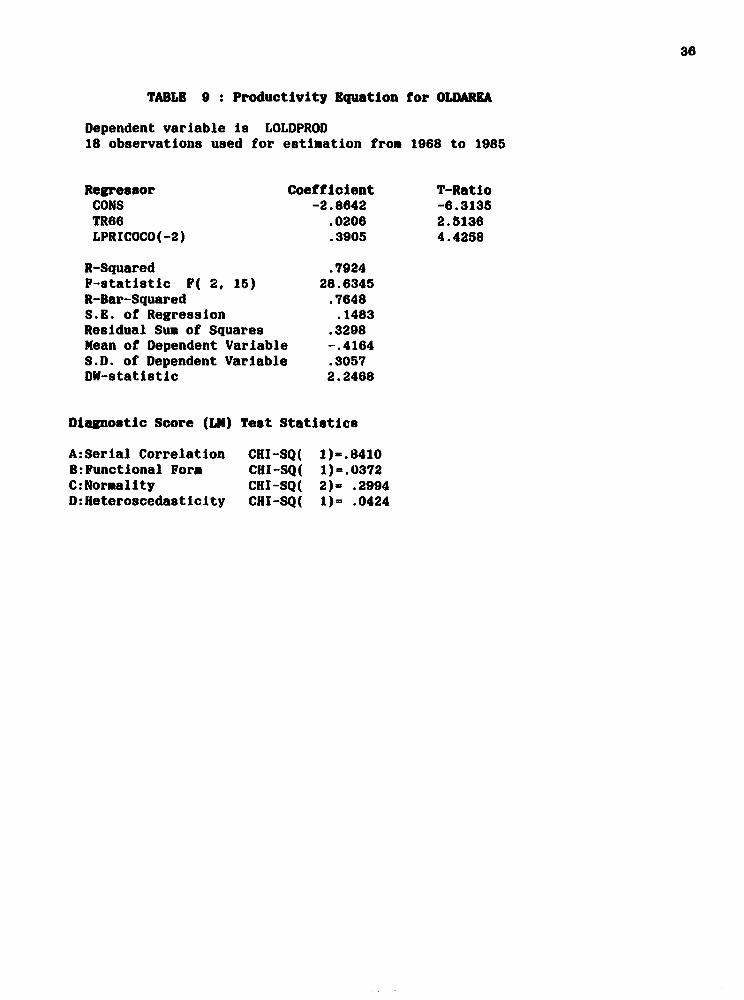
TABLE 9 : Productivlty Equation for OLDAREA
Dependent variable is LOLDPROD18 observations used for estimation from 1968 to 1985
Regressor Coefficient T-RatioCONS -2.8642 -6.3135TR66 .0206 2.5136LPRICOCO(-2) .3905 4.4258
R-Squared .7924F-statistic F( 2, 15) 28.6345R-Bar-Squared .7648S.E. of Regression .1483Residual Sum of Squares .3298Mean of Dependent Variable -.4164S.D. of Dependent Variable .3057DW-statistic 2.2468
Diagnostic Score (L") Test Statistics
A:Serial Correlation CHI-SQ( l)-.8410B:Functional Form CHI-SQ( 1)=.0372C:Normality CHI-SQ( 2)- .2994D:Heteroscedasticity CHI-SQ( 1)= .0424

37
expectations art. assumed to be based linearly on the previous perlod's
price. A priori, a positive change will provide an Incentive to raise the
rate of new planting and a negative change to reduce it.
Using non-nested tests, the specifications based on AREVPROD and either
NEWCAPR2 or KNPLR2 , which were generally very similar, twere compared with
the results obtained with PRICOCO(-1) and PRYCOCO(-2) (Table 7) replacing
AREVPROD(-1) and AREVPROD(-2), respectively. The tests given in Table 8
favor the model based on PRICOCO.
Whereas the variables AREVPROD and PRICOCO are highly correlated, the
regression of AREVPROD on PRICOCO leaves a substantial unexplained variance
essentially because the former depends by definition on the average yield of
OLDARBA, which has shown very substantial variation. If, however, the
relevant variable is the expected yield on new area, which may differ from
that on OLDAREA. then the final choice of equation can be rationalized.
The results presented in Table 7 show that all explanatory variables
have t-ratios of about 2.0 or greater. The price and the interest rate
effects are precisely measured and have the a priori expected signs. The R-
bar-squared statistic has a value of .9522 and the diagnostic tests
presented in the lower part of Table 7 are all satisfactory. The CUSUM and
CUSITMSQ plots were examined ; the former deviates markedly from the zero
axis suggesting that at least some of the estimated coefficients may not be
robust. The recursively estimated coefficients plotted in Figures 14 through
18 and these suggest that the coefficients of NEWCAPR2(-1) and CHPRI are
38
relatively the least robust18
Price elasticlty of new planting :The estimated short-run elasticity of new
planting with respect to price measured at the sample means is 1.60 (-
0.1172x 10 3x342.42 /0.0369), about the same as the replancing elasticity.
However, the dynamics of replanting are a great deal more complex and there
is considerable internal evidence that the price response of replanting is
somewhat nonlinear.
Interest elasticity The interest rate elasticity measured at the sample
mean values is 0.42 - a value very similar to that obtained for replanting.
This effect is interpreted as a cost of capital type effect. From 1973
through 1985 the real interest rate was negative and between 1973 and 1980
it was for the most part declining reaching about -68% in 1980, a decline
of almost 60 points over the previous two years. The estimated net direct
effect of such a decline would be to add about 12180 hectares of new
planting, thereby strongly counteracting the negative contribution over this
period from the declining average revenue per hectare. It is clear that the
factors that contributed to low real Interest rates caused a very
considerable growth in cocoa new planting during the 1970's1
18 Generally, the t-ratios on the estimated coefficients provides agood guide to the robustness of the coefficients to variations in the samplesize.
the empirical analysis of new planting has been carried outwithout including the theoretically relevant price of cocoa land. Even ifthis were not a significant omission in the sample period, such may not bethe case in the future so that an extrapolation based on the estimatedequation should be done with care.
39
VI : SUNKARY AND CONCLUSIONS
Specifications for replanting and new planting derived from a cost of
adjustment model of investment have been estimated and tested extensively in
this paper. They stand up well to a battery of specification tests and
several key coefficients are robust.
The detailed and the broad conclusions of this paper support the
importance of real price of cocoa as a key determinant of both replanting
and new planting. Lest such a conclusion should be thought obvious, note
that the channels through which this effect operates is perhaps more complex
in the case of replanting than new planting. For the latter the short run
response may be small, whereas for the former it is estimated to be
negative. The long run response of both is estimated to be positive. Though
elasticity estimates have been provided in the text, they must be
interpreted with care both because of the small sample analyzed and the
nonlinearities involved.
The analysis of replanting has been conditioned on the productivity of
the pre-1966 planted area. But the latter is an endogenous variable. The
average productivity of this area has shown considerable rise since 1966.
but the reasons for this change do not appear to have been fully documented.
Whether replanting will be stimulated in the future depends both on the
movements in the real price of cocoa and the exogenous component of changes
in average productivity.
Evidently the low real interest rates of the 1970's and early 1980's
have stimulated new planting and also replanting. The strong collinearity
between the interest subsidy provided by CEPLAC to replanters between 1977
and 1984 and the real interest rate has prevented a clear quantitative

40
conclusion about the effect of this subsidy, though Its qualitative effect
seems to have been as expected a priori. By lowering the real interest even
below the prevailing level which was already low, the subsidy reinforced
that effect.
The surge in new planting during the last two decades has implications
for future new planting. The Brazilian cocoa orchard is now considerably
younger than in 1966, and the consequent increase in its production
potential reduces the need for both new planting and replanting. A sharp
decline in the yield of the pre-1966 planted area and/or the depletion of
land suitable for new planting may generate new incentives for replanting.
These are issues for future investigations.

41
RIFEmECS
Akiyama, T. and P. K. Trivedi (1987a) A New Global Tea Model: Specification,Estimation and Simulation. World Bank Starf Commodity Working Papers, Number17. Washington : The World Bank.
___________________________ (1987b) "Vintage Production Approach toPerennial Crop Supply : An Application to Tea in Major Producing Countries",Journal of Econometrics 36, 133-161.
Binswanger, H., Y. Mundlak, N.C. Yang and A. Bowers (1985), "TheDeterminants of Cross-Country Aggregate Agricultural Supply". Journal ofEconometrics, 36.
Dufour, J-N. (1982) "Recursive Stability Analysis of Linear RegressionRelationships", Journal of Econometrics, 19, 31-76.
French, B.C., C. A. King, and D. D. Minami (1985) "Planting and Removal ofPerennial Crops", American Journal of Agricultural Economics, 67, 215-223.
Hartley, M. J., M. Nerlove and R. K. Peters (1985) The SupplY ResDonse forRubber in Sri Lanka : A Preliminary Analysis, World Bank Staff WorklnigPapers, Number 657, Washington, D. C.: The World Bank.
Hayashi, F. (1982) " Tobin's Marginal Q and Average Q : NeoclassicalInterpretation", Econometrica, 50, 213-224.
Knight, P. T. (1976) "Economics of Cocoa Production in Brazil", Chapter 10in Cocoa Production : Economic and Botanical Perspectives , John Simmons(Editor). New York : Praeger Publishers.
Monteiro, A. (1987) "Estmativas de margea bruta de producao de cacau, dosinvestimentos na implatacao e renovacao de lavouras decadentes naspropriedades cacaueiras de Estado da Bahia. Periodo 1965 a 1986".Unpublished CEPLAC paper.
Nerlove, M. (1979) "The Dynamics of Supply : Retrospect and Prospect",American Journal of Agricultural Economics, 61, 874-888.
Nickell, S. J. (1976) The Investment Decisions of Firms . CambridgeUniversity Press.
Tafani, R. R. (1987) "Estimativas de producao de cacau no Brasil Para 08proximos anos". Unpublished CEPLAC paper.
____________ (1987) "Juros Subsidiados Pela CEPLAC". Unpublishedmemorandum.
Trivedi, P. K. (1986) "A Framework for Studying the Supply Response ofPerennial Crops", Division Working Paper No. 1986-1, Commodity Studies andProjections Division, EPD, The World Bank

42
Il- , 1N~~ I
-~~~~~~~~~~~~~~~~~~~~~~-
I~~~~~~~~~~~ I
I I U
. gu!~~~~~:s >j4ii1
43
III I HI U
U IH I
I HH UII 6
-Iw. I
I ______ I!II I - 6 IA
I Ii
II
I I I8I I* BI H IIa *H Ua- HI 46 1
o
I �NI
:lh, 129
Flat at tUm Cmtlaleut af AWJFN(-12 bum - 1 on mmIm r egpegaon
.uUSM flat.. .' tim CuuttleIa.t r XI OSf-ao e a -z; em if O 113u1a11t
-.09me
a1m 1973 1973 1.3 11
19m is" 1973Is
fJ CU$tE IO ~~~~~~~~~~~~~~~~~~~LMUL £2FIGURE Jo
,IG _, .ii uG _. c t: I,J hEPlM TItK IQUA1 ION
Flat of tl Coflmwut of EAIlNTt-1 bai co uw1_ too on plut of t). Coaticimt d PCCC-ti -o _tIlMuDlln t - \ [ -. 11111A111=m-
-.zzes2 lsn 197|1 - lse3 ssirs _,,Z3 .,,7, r-.111. 1973 1173 1983 1i85 tam 193 i973 193 Is5

45
I II I II� I IK
U -
�.jj IW �x-�
*0 .- J U
3 2
I II I
II. I DII S S
I I� I
3 21
I
2
�JjI U
III I a
I�u a. ________
- I.,

46
j~~~~~~~~~~~~~ |~~ K
!-lYlU I I~~~~~~~~~~~~~~~~~~~~~~~r
PPR Working Paper Series
Title Author Date Cuntact
WPS73 Taxation and Output Growth in Africa Jonathan SkInner August 1988 A. Bhalla
60359
WPS74 Fiscal Stabilization and Exchange RateInstability: A Theoretical Approach
and Some Policy Conclusions Using
Mexican Data Andrew Feltenstein August 1988 A. BhaliaStephen Morris 60359
WPS75 Welfare Dominance and the Design ofExcise Taxation In the Cote d'lvoire Shlomo Yitzhaki August 1988 A. Bhalla
Wayne Thirsk 60359
WPS76 On the Shadow Price of a TaxInspector Shlomo Yitzhaki
Yitzhak Vakneen
WPS77 Incentive Policies and AgriculturalPerformance in Sub-Saharan Africa Bela Balassa August 1988 N. Campbell
33769
WPS78 Economists, Institutions and Trade
Restrictions: A Review Article J. Michael Finger September 1988 N. Artis
33731
WPS79 Quantitative Appraisal ofAdjustment Lending Bela Balassa August 1988 N. Campbell
33769
WPS80 Emerging Issues of Privatizationand the Public Sector Samuel Paul September 1988 E. Madrona
61711
WPS81 Reaching People at the Periphery:
Can the World Bank's Population,Health, and Nutrition OperationsDo 1Better? Richard Heaver September 1988 S. Ainsworth
31091
WPS82 Microeconomic Theory of the House-hold and Nutrition Programs Dov Chernichovsky September 1988 S. Ainsworth
Linda Zangwill 31091
WPS83 Welfare Costs of U.S. Quotas inTextiles, Steel, and Autos Ja!me de Melo September 1988 C. Cabana
David Tarr 61539

PPR Working Paper Series
Title Author Date Contact
WPS84 Black Markets for Foreign Exchange,
Real Exchange Rates and Inflation:Overnight vs. Gradual Reform in
Sub-Saharan Africa Brian Pinto September 1988 S. Fallon
61680
WPS85 Wage Responsiveness and Labor MarketDisequilibrium Ramon E. Lopez September 1988 L. Riveros
Luis A. Riveros 61762
WPS86 External Balance, Fiscal Policy andGrowth In Turkey Ritu Anand September 1988 A. Chhlbber
Ajay Chhibber 60102Sweder van Wijnbergen
WPS87 Vocational and Technical Education
in Peru Peter R. Moock
Rosemary T. Bellew
WPS88 Costs, Payments, and Incentives in
Family Planning Programs John A. Ross September 1988 S. Alnsworth
Stephen L. Isaacs 31091
WPS89 Export Quota Allocations, Export
Earnings and Market Diversifications Taeho Bark September 1988 C. Cabana
Jaime de Melo 61539
WPS90 A Framework for Analysis of Mineral
Tax Policy in Sub-Saharan Africa Robert F. Conrad September 1988 A. BhallaZmarak M. Shalizi 60359
WPS91 Israel's Stabilization Program Nissan Liviatan September 1988 N. Liviatan
61763
WPS92 A l4odel of Cocoa Replanting and New
PlanTing in Bahia, Brazil: 1966-1985 Pravin K. Trivedi September 1988 D. Gustafson
33714
WPS93 The Effects of Education, Health and
Social Security on Fertility in
Developing Countries Susan H. Cochrane September 1988 S. Ainsworth
31091
WPS94 The World Bank's Population Lending
and Sector Review George B. Simmons September 1988 S. Ainsworth
Rushikesh Maru 31091