mobilizing domestic and external resources … -and-cheen.pdf · mobilizing domestic and external...
TRANSCRIPT

Asia-Pacific Development Journal Vol. 8, No. 1, June 2001
41
MOBILIZING DOMESTIC AND EXTERNAL RESOURCES FORECONOMIC DEVELOPMENT: LESSONS FROM
THE MALAYSIAN EXPERIENCE
Mohamed Ariff and Lim Chze Cheen*
This paper provides an overview of issues pertaining to the availabilityand mobilization of resources for national development in Malaysia. Itdiscusses recent trends in public and private savings and also the need forexternal resources and concludes with an analysis of Malaysia’s integrationinto the world economy during the 1990s.
The availability and mobilization of resources is a sine qua non for realcapital formation and, hence, national development. Sustainable development canonly be achieved if resources are efficiently mobilized and transformed into productiveactivities. The development of an efficient financial system in providing the vital linkbetween savings and investment is thus important. Not only must there be coordinationof different agencies within and among levels of government, there must also becoordination between the public and private sectors, and among the various componentsof the private sector.
Whatever the level of domestic savings and however large or small the nettransfer of foreign savings, there is legitimate concern to ensure that those savingsare allocated to investment in a developing country in a manner that is efficientand desirable in the social, political and developmental senses. Apart from havinga well-coordinated financial system, the appropriate infrastructure, human capital andinstitutions all have to be in place. The Malaysian Government has basically reliedon the use of five-year plans to implement its development strategy. Traditionally,a major portion of the financing for the Malaysian economy is intermediated throughthe banking system as reflected by the high bank credit to GDP ratio of 126 per centas at end of 1999. This trend is changing as the landscape of the economy varies,necessitating a broader scope of financing to meet its needs.
This paper is structured as follows. Section I provides an overview ofthe availability and mobilization of resources for national economic development.Sections II and III discuss public and private savings as domestic sources of financing
* Malaysian Institute of Economic Research, Kuala Lumpur, Malaysia.

Asia-Pacific Development Journal Vol. 8, No. 1, June 2001
42
respectively. The need for external resources, consistent with the industrializationplan, is discussed in section IV. Section V looks at future developments in the capitalmarket, dynamically with integration into the world economy. Finally, section VIsums up the paper.
I. THE SAVING-INVESTMENT GAP
Since there was substantial accumulation of foreign reserves over the period1960-1980, Malaysia had neither a savings-investment gap nor a foreign exchangegap to bridge over these years. On the whole, Malaysia generally financed most of itsinvestment out of domestic savings. Figure I.1 shows the relationship between public,private and total resources over the period 1970-1999. The net transfer of resources,that is, the difference between gross domestic investment and gross domestic savings,has not been more than plus or minus 1percent of the GDP of the developing countriessince 1980. The problem that arises is the accumulating domestic debt as opposed toexternal debt.
Essentially, the surpluses in the funds were provided by the growth in theagricultural and mining sectors, which were then mobilized by the Government andthe financial system to develop the manufacturing and service sectors as well as thebasic infrastructure, in an effort to avoid overdependence on one sector. In addition,the surpluses together with taxes collected enabled the economy to finance reinvestmentin the respective sectors and government spending.
Figure I.1. Public, private and total resources, 1970-1999
-50 000
-40 000
-30 000
-20 000
-10 000
0
10 000
20 000
30 000
40 000
50 000
M$
mill
ion
1970
1971
1972
1973
1974
1975
1976
1977
1978
1979
1980
1981
1982
1983
1984
1985
1986
1987
1988
1989
1990
1991
1992
1993
1994
1995
1996
1997
1998
1999
Year
Private resource gapPublic resource gapTotal resource gap

Asia-Pacific Development Journal Vol. 8, No. 1, June 2001
43
Although the level of gross capital formation increased rapidly from around18 per cent of GNP in the 1960s to around 25 per cent in the 1970s, the country wasable to finance its investment outlays without any significant recourse to externalfinancing. The same cannot be said of the early 1980s, with the nation entering theheavy industrialization phase. The Òbig pushÓ changed the composition of public andprivate investment. Public investment rose to the level of private investment in 1982and 1983, as shown in figure I.2. Subsequent years saw a divergence between publicand private investment until 1997, with private investment responding positively tothe industrial policies implemented. Private savings, however, were always abovepublic savings, with the wedge between them widening over the years, as illustratedby figure I.3.
During the period 1981-1985, the gap between GNS (gross national savings)and GDI (gross domestic investment) reached a high deficit of 8.5 per cent of GNP,which was unsustainable. In recognition of this, various policy measures wereimplemented to narrow the yawning gap. With continued discipline in fiscal restraintand improving commodity prices, the gap between GNS and GDI narrowed. In 1987,it turned into a surplus of about 9 per cent of GNP. However, with improvinginvestment and consumption, the gap once again surfaced from 1989 to 1997. Duringthis period, the financing requirement was basically met by foreign capital inflows.Nevertheless, the dawn of the East Asian crisis in the second half of 1997 led to aplunge in investment, widening the gap abruptly.
Figure I.2. Public and private investment, 1970-1999
0
10 000
20 000
30 000
40 000
50 000
60 000
70 000
80 000
Private investmentPublic investment
Year
M$
mill
ion
1970
1971
1972
1973
1974
1975
1976
1977
1978
1979
1980
1981
1982
1983
1984
1985
1986
1987
1988
1989
1990
1991
1992
1993
1994
1995
1996
1997
1998
1999

Asia-Pacific Development Journal Vol. 8, No. 1, June 2001
44
II. PRIVATE SAVINGS
Private savings have increased over the years driven by rising per capitaincome, higher age dependency ratio, lower share of agriculture in the economy andcontinued efforts to deepen the financial system. It is anticipated that private savingswill have to provide the bulk of the additional investment-financing requirement,especially through the increasing role of the capital market (to be discussed insection V). The data on private savings in Malaysia at the subsectoral level arescarce and, at times, not readily accessible.
Unlike the public sector, the private sector was consistently a net saver in the1960s and 1970s. Nevertheless, this surplus turned negative in the first half of the1980s, reflecting lower private savings (in particular, corporate savings) and poorcommodity and manufacturing (especially electronic products) prices. The transfer ofassets, as a result of privatization, indicates a swell in private sector investment,which contributed to the private sector resource gap. After 1986, the situation revertedto a surplus before turning into a deficit again in the 1990s owing to a sharp rise inboth private consumption and investment.
The changing structure of the Malaysian economy over the past four decadeshas transformed the role of financial institutions from one of financing trade tomobilizing and channelling financial resources to various growing sectors of theeconomy. The financial system can be divided into three parts: banking institutions,non-bank financial intermediaries and financial markets as shown in figures II.1-II.3.
Figure I.3. Public and private savings, 1970-1999
0
10 000
20 000
30 000
40 000
50 000
60 000
70 000
80 000
M$
mill
ion
1970
1971
1972
1973
1974
1975
1976
1977
1978
1979
1980
1981
1982
1983
1984
1985
1986
1987
1988
1989
1990
1991
1992
1993
1994
1995
1996
1997
1998
1999
Year
Public SavingsPrivate investment

Asia-Pacific Development Journal Vol. 8, No. 1, June 2001
45
Figure II.2. The financial market as at 31 December 1999
Source: Central Bank of Malaysia.** Including Bank Islam.@ Money market only (interbank).
Figure II.1. The structure of banking institutions as at 31 December 1999
Source: Central Bank of Malaysia.* Supervised by the Central Bank.
ISLAMIC BANKS*Assets: RM11.7bDeposits: RM9.7b
Loans: RM5.0b
COMMERCIALBANKS*
Assets: RM471.5bDeposits: RM330bLoans: RM282.3b
FINANCECOMPANIES*
Assets: RM115.9bDeposits: RM91.4b
Loans: RM75.4b
MERCHANTBANKS*
Assets: RM39.2bDeposits: RM25.9b
Loans: RM18.9b
DISCOUNTHOUSES*
Assets: RM18.6b
FOREIGN BANKSREPRESENTATIVE
OFFICES*
36 offices7 discount houses
12 merchant banks22 branches
23 finance companies960 finance companies
33 banks of which:20 domestic13 foreign
1,888 bank branches
120 branches
CENTRAL BANK OF MALAYSIAAssets: RM147.1b
of which:External reserves: RM117.3b
6 branch offices2 overseas
representative offices
LABUAN INTERNATIONAL
OFFSHORE FINANCIAL CENTRE
61 offshore banks59 offshore insurance
and insurancerelated companies20 trust companies6 fund managers
MONEY ANDFOREIGN
EXCHANGE
33 commercial banks**10 finance companies@
12 merchant banks@8 money and foreign
exchange brokers
MALAYSIANGOVERNMENT
SECURITIES
13 principal dealers
OPTION ANDFUTURES
EXCHANGES
Kuala Lumpur Optionsand
Financial Futures Exchange
Commodity and Monetary
Exchange of Malaysia
STOCK EXCHANGE
Kuala LumpurStock ExchangeNo. of cos.: 757
Mkt. Cap.: RM552.69bNo. of broking cos.: 64
PRIVATE DEBTSECURITIES
LABUAN OFFSHOREFINANCIAL SERVICES
AUTHORITY
CENTRAL BANKOF MALAYSIA
REGISTRAR OFCOMPANIES
SECURITIESCOMMISSION

Asia-Pacific Development Journal Vol. 8, No. 1, June 2001
46
LEASING COsAssets: RM6.3b
No. of companies: 45
FACTORING COs#Assets: RM1.0b
No. of companies: 13
VENTURE CAPITALCOs#
Size of funds: RM1.7bNo. of companies: 30
CREDIT TOKENCOs#
✧ 18 issuinginstitutions
DEVELOPMENTFINANCE
INSTITUTIONS#Assets: RM22.4b
Malaysia IndustrialDevelopment FinanceDevelopment Bank of
MalaysiaIndustrial Bank ofMalaysia Berhad
Sabah Development BankAgriculture Bank of
MalaysiaSabah Credit Corporation
Borneo DevelopmentCorporation
Export-Import Bank Malaysia
PROVIDENTAND
PENSION
EmployeesProvident Fund
Assets: RM168.6bNo. of
contributors: 9.5m
Social SecurityOrganisation
Assets: RM7.9bNo. of
contributions: 8.6m
Pension Trust FundAssets: RM14.2b
Other statutory andprivate
provident fundsAssets: RM6.4b
No. ofcontributors:
138,655
SAVINGSINSTITUTIONSAssets: RM20.9b
National SavingsBank
Assets: RM8.8b
426 branchesincluding
mini and sub-branches
641 post officeswith savings bank
facilities
Urban creditco-operatives
Assets: RM3.7b
Rural creditco-operatives
Assets: RM8.4bOf which:
Bank RakyatAssets: RM7.2b
UNIT TRUSTS
33 unit trustcompanies
101 unit trustfunds
Net asset value:RM30.1b
ASN, ASB andASW
Net asset value:RM30.1b
INSURANCE COs*Assets: RM46.5b
Of which:Life insurance:
RM32.3bGeneral insurance:
RM14.2b
67 insurancecompaniesof which:
56 domestic11 foreign
38 general insurancecompanies
7 life insurancecompanies
11 composite lifeand general
insurance companies11 reinsurance
companies
Islamic insurance2 companies(TAKAFUL)
OFFSHOREINSURANCE
ANDINSURANCE-
RELATEDCOMPANIES*
No. of companies: 59
PROPERTYTRUSTS*
4 property trust funds
HOUSING CREDITINSTITUTIONS#Assets: RM6.5b
Malaysia BuildingSociety Borneo
Housing Mortgage
GOVERNMENTHOUSING
LOAN DIVISIONOutstanding loans:
RM16.8b
CAGAMASBERHAD
Assets: RM20.4b
PILGRIMS FUNDBOARD
Assets: RM8.6b
CREDITGUARANTEE
CORPORATIONAssets: RM2.6b
MALAYSIAEXPORT CREDITINSURANCE BHDAssets: RM29.8m
MALAYSIA RATINGCORPORATION BHD
RATING AGENCYMALAYSIA BHD
Figure II.3. Non-bank financial intermediaries asat 31 December 1999
* Supervised by the Central Bank.# Registered with the Central Bank.✧ As at 31 December 1998.
The financial sector of Malaysia up until the 1980s consisted broadly ofa formal and an informal segment. The banking system dominated the formal sector,where there was heavy reliance on direct government control in the pricing andallocation of loans. Obtaining finance from non-bank institutions (such as pensionfunds, insurance companies and merchant banks) and capital markets was ratherlimited. Since the latter half of the 1970s, the Central Bank of Malaysia has undertakenwide-ranging reform measures that are aimed at reducing the direct intervention ofgovernment and increasing reliance on the market. They include the liberalization ofinterest rates, relaxation of lending guidelines, reduction of subsidized credit directedto the promotion of specific sectors or enterprises, development of domestic capitalmarkets and easing of restrictions on foreign investment in the domestic bankingsystem and capital market. The role of government is thus becoming more indirectbut is still important for providing financial legislation and a system of prudentialregulation and supervision of the decentralized financial system. Nevertheless, thereseems to be a transformation of intervention by the Government from one that isexplicit to one that is implicit.

Asia-Pacific Development Journal Vol. 8, No. 1, June 2001
47
Using the Granger causality test, the authors have found that there is noclear evidence in favour of the supply-leading or demand-following hypotheses. Thesupply-leading hypothesis stresses the importance and usefulness of financialdevelopment that leads to national economic development while the demand-leadinghypothesis views the causal relationship as the reverse. When the monetization variableMV3 (i.e., M3/real GDP) is employed as a measurement of financial development, itis apparent from the empirical results in table II.1 that neither the supply-leadingphenomenon nor the demand-leading hypothesis dominates. However, the use ofmonetary aggregates M2 and M3 as financial development measures seems to suggesta supply-leading hypothesis, though not a substantial one.
Table II.1. Financial and economic development in Malaysia:a causal relation
Pairwise Granger causality testsSample: 1973 1999
Lags: 4
Null hypothesis: Obs F-Statistic Probability
M3 does not Granger Cause GDP 23 3.58114 0.03272
GDP does not Granger Cause M3 2.13370 0.13042
M2 does not Granger Cause GDP 5.19311 0.00889
GDP does not Granger Cause M2 2.19350 0.12265
MV3 does not Granger Cause GDP 2.60374 0.08125
GDP does not Granger Cause MV3 6.15719 0.00449
The monetization variable MV3 shows the real size of the financial sector ina growing economy and registers a rise over time (see table II.2), indicating the fasterdevelopment of the financial sector than the real sector. It also indicates the extent ofthe informal sector financing of the economy, which declines over time. However,the reverse is true for currency ratios, which fall as real growth rises. Financialinnovations lead to more diversification of financial assets and liabilities and moretransactions being carried out in a non-currency form. As a consequence, the use ofnotes and coins to monetary aggregates tends to decline over time, which is illustratedby the decreasing currency-deposit ratios in table II.2.
Consequently, efforts to raise private savings should focus on structural reforminvolving gradual financial liberalization, particularly on the mobilization oflong-term saving instruments, such as the Employees Provident Fund1 (EPF), pensions,
1 The Employees Provident Fund (EPF) was first established on 1 October 1951 under the EPF Ordinance1951, which was subsequently replaced by the EPF Act 1991. The statutory rates of contribution foremployers and employees are currently 12 per cent and 11 per cent of the employeeÕs wages respectively.

Asia-Pacific Development Journal Vol. 8, No. 1, June 2001
48
Table II.2. Monetization ratio for the Malaysian economy (1970-1999)
Currency ratios M2 M3 RGDP87 M3/GDP
1970 0.968904 4 122.3 29 070
1971 1.000944 4 668.2 32 090
1972 0.877809 5 762.4 31 680
1973 0.851767 7 551.9 8 313.4 35 386 0.234935
1974 1.002024 8 713.9 9 791.0 38 323 0.255486
1975 1.061238 9 981.5 11 322.7 38 630 0.293106
1976 0.999391 12 748.2 14 496.3 43 111 0.336255
1977 1.032238 14 819.0 16 894.4 46 474 0.363524
1978 0.976531 17 466.5 20 270.9 49 587 0.408795
1979 0.932465 21 706.4 25 457.5 54 199 0.469704
1980 0.950914 27 991.8 32 687.6 58 234 0.561315
1981 0.862193 32 772.7 38 051.6 62 276 0.611015
1982 0.848482 37 899.9 44 357.8 65 976 0.672332
1983 0.81346 42 264.1 51 705.7 70 100 0.737599
1984 0.809287 47 733.2 59 772.6 75 541 0.79126
1985 0.845285 50 412.2 65 607.7 74 693 0.878365
1986 0.89209 56 096.8 71 399.9 75 554 0.945018
1987 0.874979 59 771.7 74 891.7 81 085 0.92362
1988 0.885196 64 072.1 80 987.4 89 143 0.908511
1989 0.759785 74 392.8 97 668.3 97 219 1.004622
1990 0.709328 83 902.9 115 435.7 105 976 1.089263
1991 0.69644 96 092.5 133 120.8 116 094 1.146664
1992 0.665211 114 480.9 159 177.9 126 408 1.259239
1993 0.478928 139 800.0 196 611.1 138 917 1.415313
1994 0.521192 160 365.6 222 329.8 151 713 1.465463
1995 0.507453 198 873.3 271 948.4 166 626 1.632089
1996 0.45799 238 208.6 329 707.6 183 292 1.798811
1997 0.511161 292 217.1 390 809.3 196 714 1.986688
1998 0.508409 296 472.0 401 459.2 182 222 2.203132
1999 0.52424 330 908.2 434 593.3 192 506 2.257557
Source: Calculated from data provided by Bank Negara Malaysia.

Asia-Pacific Development Journal Vol. 8, No. 1, June 2001
49
insurance companies, mutual funds and, to a lesser extent, the separately constitutedprivate pension and provident funds. The EPF has been the nationÕs largest providentand pension fund, with resources of M$158 billion (85.8 per cent of total resources ofprovident and pension funds). The EPF (as well as SOCSO2) faces restrictions interms of investment avenues. Specifically, the Trustee Act restricts EPF frompurchasing corporate bonds without a bank guarantee or acceptable collateral. Thus,the EPF is confined to mobilizing funds in the stock market and investing in MalaysianGovernment Securities (MGS). In this context, there is a need for the above restrictionsto be relaxed by allowing the purchase of unsecured private debt securities with goodcredit rating, and derivatives. Of late, there has been greater mobilization of EPFfunds through permitting withdrawals by employees for purchases of houses.
Insurance companies, however, mobilize total funds of M$26.6 billion (fromM$1.7 billion in 1980) by providing attractive insurance products. The unit trustindustry has expanded over the years, with a net asset value of M$39.8 billion as atend-August 1999, which is largely contributed by Government-supported funds likeAmanah Saham Nasional. To have a sustained increase in long-term savings, theGovernment would need to reduce its recourse to captive financing from the EPF,SOCSO and pension funds, in order to give market participants more flexibility intheir portfolio allocation, while encouraging greater private-sector involvement in thecreation of more innovative financial products and enhancing competition. With moreremunerative saving instruments installed, investors would certainly be enticed.
Since the 1970s, Islamic banking has emerged as an alternative source offinance in the international financial scene. In Malaysia, Islamic legal provisions andbanking regulations coexist with those of the conventional banking system. The IslamicBanking Act 1983, which came into effect on 7 April 1983, marked the introductionof Islamic banking products. In principle, many Muslims are reluctant to resort toconventional banking institutions, since their Islamic beliefs prevent them from dealingsthat involve usury or interest (riba). The emergence of Islamic banking, which prohibitsinterest payments, caters for their banking needs. In this context, their funds will notbe kept idle.
As at end-1999, Islamic banking assets contributed 5.4 per cent of the totalassets of the banking system, amounting to M$35.8 billion. Deposits placed with thebanking institutions continued to form the bulk of the funds in the Islamic bankingsector, which accounts for 69.2 per cent of the total resources of the sector. TheIslamic funds mobilized were mainly used to finance economic activities (37.3 percent of total uses of Islamic funds), while the remaining funds were deposited withother banking institutions, with investment and dealing securities accounting for
2 The Social Security Organisation (SOCSO) was established to provide security benefits to workers. Itmobilized total resources of M$7,034 million as at end-June 1999. The rate of employer-employee contributionvaries according to the employeesÕ wages.

Asia-Pacific Development Journal Vol. 8, No. 1, June 2001
50
19.1 per cent and 12.3 per cent respectively. Total financing extended by the Islamicbanking sector stood at M$14.0 billion as at the end of 1999. The sectorÕs exposureto the broad property sector remained significant at 42.9 per cent, while 9 per cent oftotal financing goes to the manufacturing sector. Although the Islamic banking sectoris still small relative to the conventional banking sector, efforts are being made toexpand its presence and create an Islamic banking system to function on a parallelbasis with the conventional system.
Another source of finance comes from the Pilgrim Fund Board. It was set upby statute in August 1969 to promote and coordinate activities connected with Muslimsgoing on pilgrimage. The funds mobilized by the Board were invested mainly inquoted and unquoted corporate securities as well as short-term investments, whichtogether accounted for 71.7 per cent of total assets. Investments in corporate securitiesand short-term instruments have over the years increased significantly from M$349million and M$548 million as at the end of 1987 to M$3.9 billion and M$2.3 billionin 1999 respectively.
From table II.3, we can conclude that changes in the real interest rates asmeasured by the Real Base Lending Rate (RBLR) have no effect on the private rateof savings (PRS), as indicated by insignificant t-ratios, holding other things constant.This implies that monetary policy is ineffective in mobilizing private savings. As therole of banking institutions (with respect to bank loans) diminishes, the monetarytransmission mechanism would alter by moving towards other channels of financing.This would make it increasingly difficult for the monetary authority to evaluate the
Table II.3. Effects of RBLR on private savings (PRS)
Dependent variable: PRS
Method: Least squaresSample: 1970 1999
Included observations: 30
Variable Coefficient Std. Error t-Statistic Prob.
C -1 456.051 1 672.037 -0.870825 0.3915
RBLR -87.83493 273.9169 -0.320663 0.7509
NOMGNP 0.219170 0.011012 19.90214 0.0000
R-squared 0.938673 Mean dependent var 19 718.87
Adjusted R-squared 0.934131 S.D. dependent var 18 967.30
S.E. of regression 4 867.966 Akaike info criterion 19.91338
Sum squared resid 6.40E+08 Schwarz criterion 20.05350
Log likelihood -295.7007 F-statistic 206.6323
Durbin-Watson stat 1.221424 Prob(F-statistic) 0.000000
Source: Data on real interest rates and private savings are provided by the Central Bank.

Asia-Pacific Development Journal Vol. 8, No. 1, June 2001
51
efficacy of monetary policy, thus making monetary policy less potent. Fiscal incentivesto savings mainly through tax incentives are unlikely to be effective as well. Usinga simple two-period intertemporal model, we would find that a fall in endowmentsleads to a decrease in savings, which is further enhanced by the existence of Ricardianequivalence and consumers having rational expectations.
III. PUBLIC SAVING
The theory of economic policy as described by Brainard (1967) or Theil(1971) suggests that public policy alone should be used to influence the nationalsavings level. It would seem that the most direct way to raise national savings isthrough higher public savings since it is subjected to direct control by the authorities.The Malaysian Government consists of the federal Government, state governments,local and statutory authorities and non-financial public enterprises3 (NFPEs).Figure III.1 shows the planning process involved. As in any other federation, fiscalimbalance, defined as the inability of state and local governments and statutory bodies,to raise sufficient revenue on their own to undertake the functions and responsibilitiesassigned to them, would appear to exist in Malaysia (Ariff, 1991). Table III.1 indicatessuch imbalances for the period 1995-1999.
Two types of fiscal imbalance are referred to in this context, namely, verticaland horizontal imbalances. Vertical imbalances involve the lopsided nature of resourcedistribution between the federal and the state governments. These imbalances arerectified through grants and reimbursements from the federal Government, in view ofits central role in the economy, as an economic stabilizer, as a redistributor of thenationÕs wealth, as a resource allocator and as a provider of public goods and serviceslike education and defence. Horizontal imbalances pertain to interstate disparity inrevenue-raising capacity and consequently to differences in the ability of states tofulfil their constitutional obligations. The allocation of grants to various states isimportant to narrow the gap between states. Several criteria can be used for distributionto address the needs of the states, i.e., the revenue-expenditure gap, reserves, incomeper capita, private-sector involvement and stage of economic development.
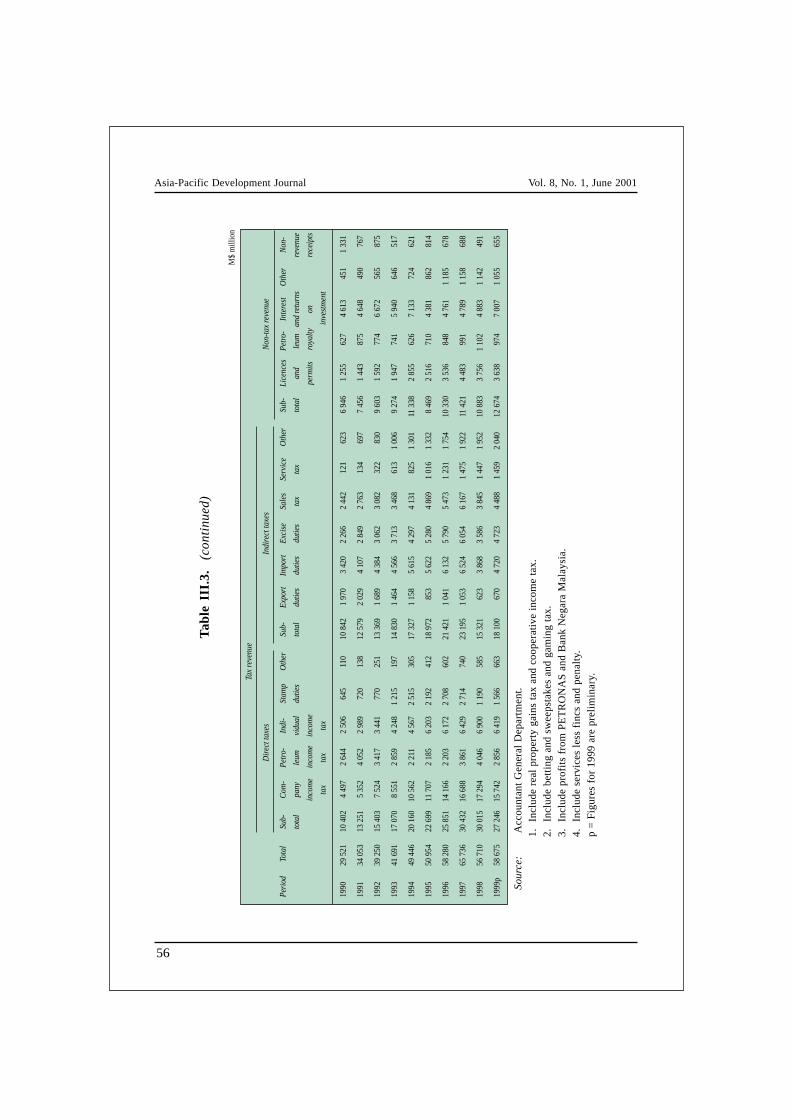
Nevertheless, tax sources need not be divided between federal and stategovernments in a manner that ensures that the latter balance their budgets on theirown. Revenue assignments are demarcated accordingly as shown in figure III.2.Federal government revenue constituted a large portion of public-sector finance, thatis, approximately 80 per cent, on average, over the period 1990-1999, as shown intable III.3. The residual of 20 per cent goes to the state government, local government
3 The criteria for determining an enterprise as an NFPE included annual sales turnover of at leastM$100 million (before 1998, M$50 million) with large borrowing requirements and high capital expendituresas well as at least 51 per cent equity share by government, including public sector agencies.

Asia-Pacific Development Journal Vol. 8, No. 1, June 2001
52
Table III.1. Consolidated state governments, local governments and statutorybodies’ own resources for financing expenditure (1995-1999a)
1995 1996 1997 1998 1999 a
State sources 6 799 8 006 8 389 6 838 6 421State government Expenditure b 7 640 8 598 9 156 8 938 8 641
Balance -841 -592 -767 -2 100 -2 220
Own resources 2 294 2 364 2 509 2 586 2 769Local government Expenditure b 2 865 2 922 2 854 3 684 3 835
Balance -571 -558 -345 -1 098 -1 066
Own resources 2 225 2 743 3 210 3 235 2 720Statutory bodies Expenditure b 5 538 6 188 5 916 6 049 7 290
Balance -3 313 -3 445 -2 706 -2 814 -4 570
Source: Economic Report, 1999/2000.a Latest estimates.b Equals the sum of operating and net development expenditures.
Figure III.1. The Planning Process
Source: Economic Planning Unit.
Planning from the top
Matching
EconomicPlanning Unit Treasury
CentralBank
StatisticsDevelopment
Inter-agency planning groups
Secretariat byEconomic Planning Unit
EconomicPlanning Unit
NationalDevelopment
PlanningCommittee
NationalPlanningCouncil
Cabinet
Ministries CabinetOther agencies
Planning from the bottom
Programmeprojects

Asia-Pacific Development Journal Vol. 8, No. 1, June 2001
53
Table III.2. Federal government revenue as a proportionof general government revenue
Federal State General Federal State revenue
government government government revenue as a as a percentage
revenue revenue revenue percentage of of federal(M$ million) (M$ million) (M$ million) general revenue revenue
1990 29 521 6 718 38 472 76.73 22.76
1991 34 053 6 429 42 671 79.80 18.88
1992 39 250 6 911 49 516 79.27 17.61
1993 41 691 7 361 52 376 79.60 17.66
1994 49 446 7 964 61 136 80.88 16.11
1995 50 954 8 261 62 271 81.83 16.21
1996 58 280 9 526 70 912 82.19 16.35
1997 65 736 9 967 79 783 82.39 15.16
1998 56 710 8 591 69 369 81.75 15.15
1999 a 56 690 8 228 68 600 82.64 14.51
Source: Economic Report, various years.a Latest estimates.
and statutory bodies. The federal Government collects direct taxes such as incometaxes and taxes on property and capital gains as well as indirect taxes, like taxes onproduction and consumption, and import and export duties. Import duties account foronly a small proportion, roughly 9-10 per cent of the total tax revenue. Malaysia hasa low-tariff regime and this has made it easy for Malaysia to further liberalize, unlikecountries that are heavily dependent on import duties. Corporate and individual incometax account for 26.0 and 11.1 per cent of the total tax revenue respectively. As arguedby Musgrave (1983), taxes on production and consumption are cyclically stable andshould be assigned to the state governments since they have no monetary and debtdevices for manoeuvre.
Traditionally, public savings were insufficient to finance public investment.In the 1960s and 1970s, this was readily bridged by non-inflationary sources andwithout crowding out the private sector. Such non-inflationary sources would includethe Employees Provident Fund, pension, insurance and the ample liquidity in thebanking sector. The first half of 1980s saw the doubling of the absolute size of thisgap, a factor behind the economic crisis of the mid-1980s. However, theimplementation of the privatization programme in the second half of the decade,together with higher revenues attributed to better economic performances, reducedthis deficit considerably. From 1993 onwards, the consolidated public sector registeredbudget surpluses, in tandem with the South-East Asian miracle economies.

Asia-Pacific Development Journal Vol. 8, No. 1, June 2001
54
Figure III.2. General sources of finance of various levelsof government in peninsular Malaysia
Notes: A: Tin-producing states are entitled to a share of the proceeds from the export duty imposedupon tin with the federal Government.
B: Excise duty levied upon toddy accrues directly to the state governments.C: Non-tax revenue of the federal Government includes such items as government
commercial undertakings, interest and returns of investment, licences, service fees, finesand rental revenued from Federal Territory, contributions from foreign Governments andinternational agencis, and petroleum royalties/gas cash payment. Non-tax revenue ofstate governments may include fees and receipts for specific services rendered by them,returns from their commercial undertakings, revenue from forestry, pretroleum and gasroyalties,a nd entertainment duties and municipal revenued unless accrued directly tothe municipalities concerned. With respect to local government, their main sources offunds are the collection of house assessments in their localities and fees for servicesrendered to the public and even from the issuance of trading permits.
D: State governments have to seek the approval of the federal Government to borrow eitherdomestically or externally.
Income
Export duties
Import duties and surtax
Excise duties
Road tax
Land and mines
Sales tax
Service tax
Taxe
s
A
B
Non-tax revenue C
D
Federal
Government
State
governments
Assets accumulated
Local
governments
Borrowing

Asia-Pacific Development Journal Vol. 8, No. 1, June 2001
55
Tab
le I
II.3
. F
eder
al g
over
nmen
t re
venu
e
M$
mill
ion
Tax
reve
nue
Dir
ect t
axes
Indi
rect
taxe
sN
on-ta
x re
venu
e
Peri
odTo
tal
Sub-
Com
-Pe
tro-
Indi
-St
amp
Oth
erSu
b-Ex
port
Impo
rtEx
cise
Sale
sSe
rvic
eO
ther
Sub-
Lice
nces
Petr
o-In
tere
stO
ther
Non
-
tota
lpa
nyle
umvi
dual
dutie
sto
tal
dutie
sdu
ties
dutie
sta
xta
xto
tal
and
leum
and
retu
rns
reve
nue
inco
me
inco
me
inco
me
perm
its r
oyal
tyon
rece
ipts
tax
tax
tax
inve
stm
ent
1970
2 40
068
548
90
168
1711
1 15
525
955
824
90
089
529
181
011
523
331
1971
2 41
872
551
74
168
1917
1 19
223
158
230
70
072
471
192
014
313
630
1972
2 92
080
355
90
182
2636
1 38
723
258
936
611
50
8569
221
522
310
145
38
1973
3 39
990
758
527
218
4829
1 90
043
774
640
722
00
9054
824
925
9517
945
1974
4 79
11
383
800
144
355
4539
2 67
194
389
344
329
70
9567
928
946
139
205
58
1975
5 11
71
990
1 16
432
243
847
192
266
625
800
450
272
811
179
229
078
159
265
69
1976
6 15
72
139
1 16
332
257
456
243
006
1 01
097
855
032
312
133
900
351
8425
620
911
2
1977
7 76
02
900
1 33
677
667
965
443
761
1 39
11
140
695
383
1613
699
040
911
124
322
710
9
1978
8 84
13
300
1 62
477
177
193
414
267
1 46
31
325
849
458
1815
41
118
447
116
307
248
156
1979
10 5
053
835
1 80
482
91
041
119
425
162
1 93
91
513
957
544
2218
71
326
481
166
419
260
182
1980
13 9
265
495
2 53
01
736
983
182
646
565
2 56
72
060
973
696
2624
31
675
551
345
473
306
191
1981
15 8
066
112
2 75
41
978
1 08
720
786
6 48
22
225
2 24
696
773
034
280
2 85
559
241
71
499
347
357
1982
16 6
906
398
2 61
92
075
1 36
024
896
6 19
21
720
2 31
51
024
788
4230
33
529
669
425
2 05
038
557
1
1983
18 6
087
712
3 45
11
998
1 81
433
811
17
551
1 89
22
591
1 36
11
284
108
315
3 01
278
149
11
286
454
333
1984
20 8
058
445
3 43
22
570
1 97
537
296
8 02
92
090
2 69
71
459
1 32
011
434
93
791
875
581
1 79
554
054
0
1985
21 1
159
259
3 92
03
130
1 74
934
012
07
441
1 83
92
518
1 37
61
234
107
367
3 97
591
461
91
996
446
440
1986
19 5
188
653
3 44
63
072
1 76
124
612
86
029
1 14
12
066
1 41
099
260
360
4 35
691
154
92
499
397
480
1987
18 1
436
468
2 78
31
533
1 81
225
783
6 00
61
267
1 93
41
310
1 09
063
342
5 13
492
941
03
450
345
535
1988
21 9
677
508
3 14
62
208
1 77
927
897
7 20
01
395
2 40
61
536
1 45
673
334
6 62
31
028
499
4 69
640
063
6
1989
25 2
737
793
3 40
21
847
2 04
342
180
8 88
11
588
2 89
91
932
1 91
391
455
7 49
61
143
509
5 40
543
91
103
Asia-Pacific Development Journal Vol. 8, No. 1, June 2001
56
Tab
le I
II.3
. (
cont
inue
d)
M$
mill
ion
Tax
reve
nue
Dir
ect t
axes
Indi
rect
taxe
sN
on-ta
x re
venu
e
Peri
odTo
tal
Sub-
Com
-Pe
tro-
Indi
-St
amp
Oth
erSu
b-Ex
port
Impo
rtEx
cise
Sale
sSe
rvic
eO
ther
Sub-
Lice
nces
Petr
o-In
tere
stO
ther
Non
-
tota
lpa
nyle
umvi
dual
dutie
sto
tal
dutie
sdu
ties
dutie
sta
xta
xto
tal
and
leum
and
retu
rns
reve
nue
inco
me
inco
me
inco
me
perm
its r
oyal
tyon
rece
ipts
tax
tax
tax
inve
stm
ent
1990
29 5
2110
402
4 49
72
644
2 50
664
511
010
842
1 97
03
420
2 26
62
442
121
623
6 94
61
255
627
4 61
345
11
331
1991
34 0
5313
251
5 35
24
052
2 98
972
013
812
579
2 02
94
107
2 84
92
763
134
697
7 45
61
443
875
4 64
849
076
7
1992
39 2
5015
403
7 52
43
417
3 44
177
025
113
369
1 68
94
384
3 06
23
082
322
830
9 60
31
592
774
6 67
256
587
5
1993
41 6
9117
070
8 55
12
859
4 24
81
215
197
14 8
301
464
4 56
63
713
3 46
861
31
006
9 27
41
947
741
5 94
064
651
7
1994
49 4
4620
160
10 5
622
211
4 56
72
515
305
17 3
271
158
5 61
54
297
4 13
182
51
301
11 3
382
855
626
7 13
372
462
1
1995
50 9
5422
699
11 7
072
185
6 20
32
192
412
18 9
7285
35
622
5 28
04
869
1 01
61
332
8 46
92
516
710
4 38
186
281
4
1996
58 2
8025
851
14 1
662
203
6 17
22
708
602
21 4
211
041
6 13
25
790
5 47
31
231
1 75
410
330
3 53
684
84
761
1 18
567
8
1997
65 7
3630
432
16 6
883
861
6 42
92
714
740
23 1
951
053
6 52
46
054
6 16
71
475
1 92
211
421
4 48
399
14
789
1 15
868
8
1998
56 7
1030
015
17 2
944
046
6 90
01
190
585
15 3
2162
33
868
3 58
63
845
1 44
71
952
10 8
833
756
1 10
24
883
1 14
249
1
1999
p58
675
27 2
4615
742
2 85
66
419
1 56
666
318
100
670
4 72
04
723
4 48
81
459
2 04
012
674
3 63
897
47
007
1 05
565
5
Sour
ce:
Acc
ount
ant
Gen
eral
Dep
artm
ent.
1.In
clud
e re
al p
rope
rty
gain
s ta
x an
d co
oper
ativ
e in
com
e ta
x.2.
Incl
ude
bett
ing
and
swee
psta
kes
and
gam
ing
tax.
3.In
clud
e pr
ofit
s fr
om P
ET
RO
NA
S a
nd B
ank
Neg
ara
Mal
aysi
a.4.
Incl
ude
serv
ices
les
s fi
ncs
and
pena
lty.
p =
Fig
ures
for
199
9 ar
e pr
elim
inar
y.

Asia-Pacific Development Journal Vol. 8, No. 1, June 2001
57
MalaysiaÕs ability to tax, given by the tax revenue/GNP ratio, is on average37.0 per cent of GNP for the period 1981-1999, as obtained from table III.4. This isamong the highest for developing countries and exceeds that of neighbouring countries,which reflects the buoyancy of direct taxes, which contribute 43.0 per cent of totalfederal revenue, with corporate taxes taking a major share. With a high taxablecapacity, there is no need for Malaysia to increase taxation in general to financespending.4 In fact, the tax administration system. Measures to be undertaken includeexpanding the smart partnership concept with related licensing agencies, increasingthe education programme, strengthening enforcement activities and surveillance tominimize tax evasion or avoidance, so as to expand the tax base. Another step would
Table III.4. Tax revenue/GNP ratio for the period 1981-1999
Year Tax revenue/GNP ratio Tax buoyancy
1981 30.33 Ð
1982 31.31 1.34
1983 32.97 1.50
1984 34.45 1.48
1985 35.07 -0.46
1986 31.48 -6.95
1987 32.02 1.29
1988 33.91 1.80
1989 35.64 1.57
1990 37.85 1.91
1991 38.64 1.14
1992 41.88 1.81
1993 40.25 0.58
1994 43.09 1.82
1995 40.12 0.19
1996 41.69 1.39
1997 43.77 1.71
1998 40.15 1.77
1999 a 38.13 -0.20
Source: Economic Report, various years.a Latest estimates.
4 Increasing taxes may lead to the following adverse implications, namely, excess burden involvingadditional distortion of economic behaviour that imposes costs on the private sector as well as politicalproblems of different sorts. Then, there is the Ricardian equivalence issue where the Government canfinance spending through debt instruments but it is through tax revenue that this spending is ultimatelyfinanced.

Asia-Pacific Development Journal Vol. 8, No. 1, June 2001
58
be the introduction of a value-added tax in place of the relatively inefficient sales tax.Although value-added tax boasts the virtues of simplicity, efficiency and neutrality, ithas not yet been implemented in Malaysia. The stumbling block is arguably the fearof inflation.
IV. EXTERNAL FINANCE
The sources of external finance for development in Malaysia have undergonemajor changes over the years. In Malaysia, these sources are essentially categorizedas official long-term capital, private long-term capital and private short-term capital.
Malaysia has experienced a change in the observed pattern of externalfinancing since the 1960s. Such a change in composition can be seen in the relativeimportance of official versus private long-term capital and long-term versusshort-term capital. During the early stages of MalaysiaÕs development, domesticresources up until the late 1970s met most of the economyÕs financing requirements.Official net long-term capital constituted the major portion of external financing forthose years. However, greater government participation in national economicdevelopment generated a rising trend in external borrowing. This became pronouncedin the first half of the 1980s owing to the extensive borrowing by the Governmentand non-financial public enterprises (NFPEs) in the midst of the heavy industrializationphase. However, soft loans, multi- and bilateral loans and overseas developmentassistance (ODA) have declined since the mid-1980s. As official long-term capitalmoderated, private long-term capital became increasingly important, mainly attributedto industrialization plans. While private long-term capital remains large, there seemsto be, a priori, an increase in merger and acquisition activities, albeit small. Bothgreenfield investments and reinvestment, driven by the incentive structure, havemoderated somewhat. The early 1990s marked a surge in short-term capital inflows(see figure IV.1 for a graphical exposition).
Capital flows bridged the domestic resource gap by providing the requisiteforeign exchange for the import of capital and intermediary goods as well as domesticinvestments. Official long-term capital inflow consists mainly of borrowing by thefederal Government in the form of market loans, project loans and suppliersÕ credit,and borrowing by NFPEs, which generally require a federal government guarantee.Figure IV.2 shows that external borrowing by the federal Government tapered offafter 1987, together with NFPEsÕ borrowing. However, during the period 1993-1997,external loans taken by NFPEs (comprising the major portion of the official long-termcapital) rose to finance expansion and new investments, with more than three quartersof the loans taken by Tenaga Nasional, Telekom and Malaysian Airline System (MAS),a factor contributing to the 1997-1998 currency/financial/economic crisis. Federalgovernment market loans and NFPEsÕ borrowing made up a large portion of officiallong-term capital.

Asia-Pacific Development Journal Vol. 8, No. 1, June 2001
59
Figure IV.1. Capital financing, 1985-1999
Figure IV.2. Components of official long-term capital, 1985-1998
-25 000
-20 000
-15 000
-10 000
-5 000
0
5 000
10 000
15 000
20 000
1985 1986 1987 1988 1989 1990 1991 1992 1993 1994 1995 1996 1997 1998
M$
mill
ion
Year
Official long-term capitalPrivate long-term capitalPrivate short-term capital
-6 000
-4 000
-2 000
0
2 000
4 000
6 000
8 000
1985
1986
1987
1988 19
8919
9019
9119
9219
9319
9419
9519
9619
9719
98
Market loans
Project loans
Suppliers' credit
Non-financial public enterprises
Other assets and liabilities
M$
mill
ion

Asia-Pacific Development Journal Vol. 8, No. 1, June 2001
60
Specifically, the official borrowing is mainly through the issuance of bonds(Eurobonds, Yankee bonds and Samurai bonds) via commercial banksÕ borrowing andsuppliersÕ credits. Malaysia also obtains soft loans from multilateral agencies like theWorld Bank and Asian Development Bank (long-maturity loans) as well as ODA,mainly from Japan (long-maturity loans with concessionary interest rates), and bilateralloans. These inflows provide funding for direct investments in industries, such assteel, cement and national car projects, and infrastructure development to support theindustrialization process.
Private long-term capital, as recorded in the monthly statistical bulletinpublished by the Central Bank of Malaysia, is used as a proxy for FDI in Malaysia.This is basically the inflow of long-term foreign financial liabilities net of the outflowof long-term financial assets in the corporate sector, which could approximate thedifference between net FDI and net investment abroad by domestic companies.However, the accessibility of reliable FDI data is much desired. FDI statistics can bederived from the Malaysian Industrial Development Authority (MIDA), or estimatesfrom IMF, UNCTAD and ADB can be used.
The FDI statistics from MIDA are not comprehensive as they excludeinvestments outside the promoted sector (manufacturing sectors only) and reinvestmentsundertaken by the existing units. The data largely relate to approved investmentsrather than actual investments. Since some of the approved projects had a relativelylong gestation period, the FDI data based on approvals grossly overstate foreignparticipation in the various industrial sectors. It would seem that data from the CentralBank of Malaysia provides a more realistic picture of FDI in Malaysia.
External financing through FDI has been preferred over other sources. Thisis especially so after the Asian economic crisis, which demystified the Malaysiangrowth miracle. It was argued that the inflow of foreign direct investment (FDI)assists in the expansion of indigenous industrial capability and capacity, since ittypically comes in a package with management expertise, technical human capital,product and process technologies, and overseas marketing channels, which can beadopted and adapted by local industries. In this regard, FDI was preferred evencompared with domestic investment. This does not imply that domestic investment isless important. The superiority of FDI over external debt, however, is obvious asnoted in the recent Asian crisis, where the rapid growth of private foreign debt(especially short-term debt, which accelerated from M$2.4 billion in 1988 to M$43.3billion in 1997) can bring about adverse consequences.
Private long-term capital has always been positive, indicating the strength offoreignersÕ confidence in the Malaysian economy and the profitability of investing inMalaysia, especially with the lucrative incentive structure5. It registered significant
5 The Promotion of Investments Act, 1986 (PIA), which supported the First Industrial Master Plan(IMP1), was formulated to develop promoted activities and products and liberalized the incentives for potentialinvestors. Since the 1986 ÒliberalizationÓ, the Malaysian economy has been relatively successful in attractingFDI.

Asia-Pacific Development Journal Vol. 8, No. 1, June 2001
61
gains after 1988, with annual inflows of over M$10 billion for the period 1991-1997.In addition to the various incentives accorded and the relaxation of the foreignownership guidelines in 1986, this trend was also due to the GovernmentÕs effort toreduce its external borrowing and prepay its external debt. Most of these privateflows were channelled to the manufacturing sector, in particular, the electronicsubsector.
While FDI can stimulate and generate exports, its impacts on the balance ofpayments are mitigated by the high import content required for production, freightand insurance payments, and repatriation of investment income, as shown intable IV.1. As a result, net factor payment from abroad has become increasinglysignificant. Growth-oriented policies, coupled with political and social stability, apro-business environment, labour and capital market reforms, good infrastructureand the availability of an educated and trainable workforce have frequently been citedas the driving reasons for MalaysiaÕs rapid economic growth and ability to attracthigh-level inflows of FDI. Nevertheless, it should be noted that merely relying on taxand investment incentives is unlikely to tilt investor decisions and attract internationalresources on a sustainable basis.
Prior to 1991, private short-term capital, which refers to short-term foreignassets net of the foreign liabilities of all industries, displayed no specific patterns.Part of the portfolio investment flows is captured under private short-term capital,while some fell under Òerrors and omissionsÓ, which amounted to M$13.5 billion in1998. Short-term capital gained importance in the early 1990s, in particular, 1992(M$11,960 million) and 1993 (M$13,930 million). The 1993 figure showed that privateshort-term capital actually exceeded private long-term capital by M$1,070 million.These short-term funds are highly sensitive to interest rate differentials and movementsin expected exchange rates. In the Malaysian context, the huge inflows were alsoencouraged by the GovernmentÕs attempts to make Malaysia a financial centre throughcapital account liberalization. The massive increase in private short-term capital inthe early to mid-1990s exhibits great volatility. One of the measures undertaken toreduce volatility was to subject all funds sourced from abroad to liquidity and statutoryreserve requirements.
The Asian economic crisis, although marked by the massive flight ofshort-term capital and large-scale sell-offs of foreign equity holdings, was at the sametime accompanied by a wave of inward direct investment as argued by Krugman(1998). As reported in the 1999 World Investment Report, cross-border mergers andacquisitions (M&A) accounted for US$ 411 billion of all 1998 FDI and for a veryhigh proportion of total FDI among developed countries. With the recent spate ofmergers and acquisitions around the world, their presence in Malaysia is still verylow, partly owing to a policy bias against cross-border M&As. A priori, there seemsto be an increase in M&A activities, while both greenfield investments and reinvestmenthave moderated. Even though foreign firms are unlikely to have controlling stakes in

Asia-Pacific Development Journal Vol. 8, No. 1, June 2001
62
more local companies, the merger and acquisition activities are set to increase in thenear future in line with the global trend and the development of the capital market.
As pointed out earlier, net factor payment abroad has consistently been in anever-increasing deficit. The only way in which Malaysia could reduce net factorpayments abroad is probably for Malaysia to undertake reverse investment abroadthat would generate an inflow of factor payments. This, however, has adverseimplications for the capital account of the balance of payments at the initial stage. Inany case, with the selective capital control in place, such a trend is unlikely to turnaround in the near future.
V. THE FUTURE OF FINANCING
The capital market covers transactions of private and public debt instrumentswith maturities exceeding one year, stocks and shares, as well as derivatives. It is anintegral part of the financial system, providing efficient delivery mechanisms for savingsmobilization and allocation, risk and liquidity management, and corporate governance.In addition, capital market transactions not only facilitate government debt managementand the conduct of monetary policy but also provide a channel for privatization.Capital markets can also be the catalyst for, and benefit from, the development ofinstitutional investors (pension funds, insurance companies and mutual funds), effortsat fiscal decentralization and the development of mortgage markets.
While the banking system and equities market are relatively developed,the capital markets for government securities and private debt securities are stillunderdeveloped, as indicated by a high ratio of bank loans to net funds raised in thecapital market of 263.0 per cent in 1997. This implies that there is still ample roomfor the development and enhancement of alternative sources to meet the financingneeds of the Malaysian economy. In order to diversify risks and minimize spillovereffects in a more integrated international financial system, Malaysia should movetowards a broader and deeper financial system.
Net funds raised in the capital market increased significantly in the 1990s,reaching a peak of M$33.5 billion in 1997, which financed 17.1 per cent of GDP.Figure V.1 points out that net funds raised in the capital market came mainly from thepublic sector prior to 1980. Private-sector activities in the capital market before 1986were quite insignificant. Ever since then, net funds raised by the private sector rosesteadily to a high of M$34.9 billion in 1997, contrasting with the declining trendexperienced by the public sector. However, the onset of the Asian crisis marked asharp reversal of net funds raised by the private sector, which plunged to M$7,960million, while those sourced by the public sector rose moderately. When a financialsystem relies heavily on its banks, systemic vulnerability increases. The Asian financialcrisis provided ample evidence of this. Although net funds raised in the capitalmarket seem to move in a pro-cyclical manner, a sound domestic capital market

Asia-Pacific Development Journal Vol. 8, No. 1, June 2001
63
Fig
ure
V.1
. F
unds
rai
sed
in t
he c
apit
al m
arke
t (M
$ m
illi
on)
Sect
or19
71-1
975
1976
-198
019
81-1
985
1986
-199
019
91-1
995
1996
1997
1998
1999
p
BY
PU
BL
IC S
EC
TO
R
Deb
t Sec
uriti
es
Mal
aysi
an G
over
nmen
t Sec
uriti
es (M
GS)
4 87
512
250
24 0
3030
975
.813
129
6 00
03
000
14 9
5010
000
MG
S A
dvan
ced
Subs
crip
tions
(2)
3264
(46.
7)27
0.9
ÐÐ
ÐÐ
Kha
zana
h B
onds
(KB
)Ð
ÐÐ
ÐÐ
Ð79
4.4
2 73
1.9
2 59
8.2
Gov
ernm
ent I
nves
tmen
t Iss
ues
(GII
)Ð
Ð50
01
700.
05
750
ÐÐ
Ð2
000
Mal
aysi
a Sa
ving
s B
onds
(MSB
)Ð
ÐÐ
Ð94
8Ð
ÐÐ
372.
2
New
Issu
es o
f Deb
t Sec
uriti
es4
873
12 2
8224
594
32 6
29.1
20 0
986
000
3 79
4.4
17 6
81.9
14 9
75.4
Les
s: R
edem
ptio
ns
M
GS
998
2 86
74
209
5 51
3.9
10 7
873
809
3 64
86
200
6 67
6
K
BÐ
ÐÐ
ÐÐ
ÐÐ
ÐÐ
G
IIÐ
Ð30
01
000
1 60
090
0.0
1 40
075
0.0
2 00
0
M
SBÐ
ÐÐ
Ð20
0.6
3415
4.8
982.
22.
1
Les
s: G
over
nmen
t Hol
ding
s58
217
.4(1
07.5
)(1
00.6
)(7
4.2)
(1.2
)Ð
Ð
Net
Fun
ds R
aise
d by
the
Publ
ic S
ecto
r3
817
9 41
320
067
.626
222
.77
611
1 33
1.1
(1 4
07.2
)9
803.
76
297.
3
BY
PR
IVA
TE
SE
CT
OR
Shar
es/W
arra
nts
Ord
inar
y Sh
ares
1
Initi
al P
ublic
Off
ers
101.
177
.492
9.1
5 57
9.4
15 1
87.3
4 09
9.2
4 78
168
4.6
999.
5
Rig
hts
Issu
es16
3.2
387.
33
234.
87
169.
115
449
.35
268.
58
524.
972
2.0
4 34
6.9
Priv
ate
Plac
emen
t/Res
tric
ted
Off
er-f
or-S
ale
27.6
21.2
Ð76
.62
632.
14
554.
43
233.
632
0.1
518.
6
Spec
ial I
ssue
sÐ
132.
61
245.
783
7.2
3 60
0.3
2 00
2.3
1 81
8.8
6120
8.0
Pref
eren
ce S
hare
sÐ
ÐÐ
Ð32
ÐÐ
ÐÐ
War
rant
sÐ
ÐÐ
ÐÐ
ÐÐ
Ð13
.5
New
Issu
es o
f Sha
re/W
arra
nts
291.
961
8.5
5 40
9.6
13 6
62.3
36 9
0115
924
.418
358
.31
787.
76
086.
5

Asia-Pacific Development Journal Vol. 8, No. 1, June 2001
64
Fig
ure
V.1
. (
cont
inue
d)
Sect
or19
71-1
975
1976
-198
019
81-1
985
1986
-199
019
91-1
995
1996
1997
1998
1999
p
Deb
t Sec
uriti
es2
Stra
ight
Bon
dsÐ
20Ð
2 16
48
836.
42
675.
44
209
10 2
389
570
Bon
ds w
ith W
arra
nts
ÐÐ
Ð26
9.4
8 16
0.2
5 56
3.7
2 95
0.3
150.
055
5
Con
vert
ible
Bon
ds57
Ð57
91
020.
14
014.
61
794.
62
018.
998
.81
269.
2
Isla
mic
Bon
dsÐ
ÐÐ
378.
51
475
2 35
05
249.
734
5.0
1 73
4
Cag
amas
Bon
dsÐ
ÐÐ
6 48
711
546
.84
665
5 16
93
320
4 42
5
New
Issu
es o
f Deb
t Sec
uriti
es57
.020
.057
9.0
395
34 0
3317
048
.719
596
.914
151
.817
553
.2
Les
s: R
edem
ptio
ns
P
riva
te D
ebt S
ecur
ities
3Ð
ÐÐ
473.
32
689.
61
765
1 36
8.5
2 96
4.4
6 27
9.5
C
agam
as B
onds
ÐÐ
Ð50
5 13
575
0.0
1 64
05
012
6 47
0
Net
Issu
es o
f Deb
t Sec
uriti
es57
2057
9.0
6 25
8.7
26 2
08.4
14 5
33.7
16 5
88.4
6 17
5.4
4 80
3.7
Net
Fun
ds R
aise
d by
the
Priv
ate
Sect
or34
8.9
638.
55
988.
619
921
63 1
09.4
30 4
58.1
34 9
46.7
7 96
3.1
10 8
90.2
Net
Fun
ds R
aise
d in
the
Cap
ital M
arke
t4
165.
910
051
.526
056
.246
143
.770
718
.431
789
.233
539
.517
766
.817
766
.8
Sour
ce:
Cen
tral
Ban
k of
Mal
aysi
a.N
otes
: 1
)E
xclu
des
fund
s ra
ised
by
the
exer
cise
of
Em
ploy
ee S
hare
Opt
ions
Sch
eme,
Tra
nsfe
rabl
e S
ubsc
ript
ion
Rig
hts,
War
rant
s, a
ndIr
rede
emab
le C
onve
rtib
le U
nsec
ured
Loa
n S
tock
s.2)
Exc
lude
s bo
nds
issu
ed b
y th
e ba
nkin
g in
stit
utio
ns.
3)In
clud
es a
ll s
trai
ght
bond
s, b
onds
wit
h w
arra
nts,
con
vert
ible
and
Isl
amic
bon
ds.
P =
Pre
lim
inar
y.

Asia-Pacific Development Journal Vol. 8, No. 1, June 2001
65
provides market signals on current situations and future expectations, which wouldreduce the severity of the fluctuation. Furthermore, strong domestic capital marketshelp to ensure efficient and sustainable medium- and long-term funding ofGovernments, corporations, banks and large-scale or long-term projects.
The Malaysian Government Securities (MGS) constitute the bulk of the newissues of public debt securities over the years. In 1998, MGS contributed M$14,950million, while the remaining M$2,730 million were raised through Khazanah bonds6.Funds raised in the capital market by the private sector were mainly through theissuance of shares prior to 1990. New issues of private debt securities surged in the1990s, raising more than M$100 billion for the decade as a whole.
As there is already a well-functioning and active equity market in Malaysia,efforts have been stepped up to further develop private debt securities as well as toencourage secondary trading in the government securities and private debt securitiesmarkets. Thus far, secondary trading7 of private debt securities is insignificant relativeto the trading of shares8. The development of an active private debt securities marketwould enhance the capability of the domestic capital market to accommodate largeand more complex funding arrangements and diversify financing away from the bankingsector. The bond market would allow companies to obtain long-term fixed rates offinancing at a lower cost relative to bank credit. This is because intermediationwould be minimized and as risks are diversified among a large pool of investors andliquidity risks for investors are reduced, investors are prepared to accept a lowerreturn. By allowing secondary trading, access to financing would be spread acrossthe board.
The development of non-bank sources of financing bodes well for thedevelopment of a knowledge-based economy. Given the different and evolving natureof the business world, alternative sources of financing for high-risk investments arerequired. The Malaysian Government recognizes that venture capital companies, suchas the Malaysian Technology Development Corporation (MTDC), have an importantrole to play in providing equity capital to finance high-risk investments to supportthe emergence of a knowledge-based economy and has granted tax incentives toventure capitalists. Nevertheless, venture capital in Malaysia is still very muchGovernment-directed. Other alternative sources of finance such as Òbusiness angelÓ
6 Khazanah bonds are bonds issued by Khazanah Nasional Bhd, a wholly-owned subsidiary of theMinistry of Finance, primarily for benchmarking purposes.
7 Secondary markets are those where financial securities trade after the issuance of financial securities,while primary markets are where firms raise capital through the issuance of financial securities.
8 One of the main reasons is that there are selling restrictions which ensure that the bonds are tradedamong economic agents whose ordinary business is to buy and sell bonds as set forth in section 38 (1B)(c)of the Companies Act, 1965.

Asia-Pacific Development Journal Vol. 8, No. 1, June 2001
66
investment and Òspecialist seed capitalÓ firms would complement venture capitalfinancing and should also be promoted. The market has the potential to extend beyondmerely catering to the needs of Malaysian technology-based companies. The wave ofdot com companies will hit Malaysian shores soon. It is important for venturecapitalists to take heed in the funding of these companies, so as not to beoverenthusiastic about them.
The commencement of trading of the Malaysian Exchange of SecuritiesDealing and Automated Quotation Bhd (MESDAQ)9 is also a significant step inproviding an alternative source of financing and serves as an exit mechanism forventure capital companies. Unfortunately, however, its launch coincided with thecrisis, which has hindered the progress. To date, there are only two companies listedon MESDAQ.
Equally important is the development of instruments that enable the unbundlingof risks so that risks are borne and managed by those who are best able to do so. Inconsequence, the risk tolerance of the economy increases and financing is available atreasonable cost. The development of the derivatives market is ideally suited to theprivate sector. As Robert A. Klein and Jess Lederman (1994) put it, futures, options,swaps (credit derivatives) and other derivatives are transforming every aspect of financeÐ from investing to raising capital to managing risk. The commencement of trade inthe Kuala Lumpur Options and Financial Futures Exchange (KLOFFE) and theCommodity and Monetary Exchange of Malaysia (COMMEX) is an encouraging moveahead but still relatively sluggish. With the expected boom in the use of derivatives,skilled manpower to embrace these new financial instruments is needed.
VI. CONCLUSION
No single model of development finance applies equally well in allinstitutional, cultural and technological situations. There is no one proper sequenceof financial reforms for all countries or for all times. Market discipline is likely to besevere in the initial stages, and any backtracking on reform would result in direconsequences, such as the inability to have access to international funds or only atcostlier terms. Encouraging exchanges of experiences within and across regions ofdeveloping countries also fosters the adaptation and redesign of foreign models ofreform and turns them into reforms that can be utilized by the domestic establishment.Needless to say, mobilizing resources is not only a static question of how much fundsto mobilize effectively but a dynamic one, where the methods of financing evolvethrough time.
9 MESDAQ is a stock exchange targeted specifically at growth and technology companies, in a similarsimilar vein to NASDAQ. It commenced trading on Friday, 30 April 1999.
Asia-Pacific Development Journal Vol. 8, No. 1, June 2001
67
MalaysiaÕs rapid economic growth and development are due to bothendogenous and exogenous factors. The latter are more obvious, given the countryÕseconomic openness to foreign trade and investment, as attested by the fact that theratio of exports to gross national income exceeds 100 per cent and manufacturesaccount for more than 80 per cent of total exports. MalaysiaÕs export orientation andexport-led growth would not have been possible had it not been for its liberal policiestowards foreign direct investment. It is important to note that MalaysiaÕs outward-looking growth strategy was reinforced by sound domestic policies and strategies,which include mobilization of domestic resources. A major factor behind MalaysiaÕssuccessful development drive has been its capacity to generate and mobilize domesticsavings. Foreign investment supplements, but does not replace, domestic investment.Malaysia has also been quite successful in raising tax revenues in the form of bothdirect and indirect taxation.
The Malaysian experience underscores the need to avoid a domestic resourcegap and budgetary deficits. It was the widening private savings-investment gap and/or deficit budgets which led to increased dependence on external borrowing and foreignshort-term capital flows, both of which proved to be extremely dangerous, asdemonstrated by the 1985-1986 and 1997-1998 economic crises.

Asia-Pacific Development Journal Vol. 8, No. 1, June 2001
68
REFERENCES
Ariff, M., 1992. ÒForeign direct investment in Malaysia: trends, determinants and implicationsÓ, inM. Ariff and H. Yokoyama, eds., Foreign Direct Investment in Malaysia, Institute of DevelopingEconomies, Tokyo.
, 1991. Case study of Malaysia, in Fiscal Decentralization and the Mobilization and Use ofNational Resources for Development: Issues, Experience and Policies in the ESCAP Region,United Nations, Development Papers No. 11.
Aznam, Zainal, 1944. ÒFinancing sustained economic growth: future developments in the Malaysiancapital marketÓ, MIER National Outlook Conference, 6-7 December 1994, Kuala Lumpur.
Bank Negara Malaysia, Annual Report, various years, Kuala Lumpur, Malaysia.
Bank Negara Malaysia, Monthly Statistical Bulletin, various issues, Kuala Lumpur, Malaysia. EconomicReport, various years. Ministry of Finance, Malaysia.
Brainard, William, 1967. ÒUncertainty and the effectiveness of policyÓ,American Economic Review,vol. 57, No. 2.
Feldstein, Martin and Charles Horioka, 1979. ÒDomestic saving and international capital flowsÓ,NBERWorking Paper No. 310.
Klein, Robert A. and Jess Lederman, 1994. The Handbook of Derivatives and Synthetics: Innovations,Technologies and Strategies in the Global Markets, Irwin.
Krugman, Paul, 1998. ÒFire-sale FDIÓ,NBER Conference on Capital Flows to Emerging Markets,20-21 February.
Lin, S.Y, 1994. ÒThe current state of Malaysian financial system, with special reference to capital marketdevelopmentsÓ,Pacific Basin Financial Journal.
, 1991. ÒMalaysia: issues in capital market developmentÓ, in K.H. Lee and S. Nagaraj, eds.,The Malaysian Economy Beyond 1990: International and Domestic Perspectives, MalaysianEconomic Association.
Mahbob, Sulaiman and Michael Yap, 1996. ÒSeventh Malaysian plan Ð external financing challengeÓ,National Convention on “Seventh Malaysian Plan: Productivity Growth for SustainedDevelopmentÓ, Kuala Lumpur.
Ministry of International Trade and Industry, 1996. Second Industrial Master Plan (1996-2005). KualaLumpur, Malaysia.
Musgrave, R., 1983. ÒWho should tax, where and whatÓ, in C.E. McClure, Jr., ed., Tax Assignment inFederal Countries (Australian National University Press).
Summers, Lawrence H., 1985. ÒIssues in national savings policyÓ,NBER Working Paper No. 1710.
Theil, H., 1971. The Theory of Economic Policy, Amsterdam: North Holland.
UNCTAD, World Investment Report 1999: Foreign Direct Investment and The Challenge of Development.