mobility for development - sommaire urba 2000€¦ · · 2013-04-189.3 transports during shanghai...
TRANSCRIPT

Mobility fordevelopment
Shanghai I China

Disclaimer
The Case study is prepared for the background information for a Stakeholder Dialogue, on behalf of the Mobility forDevelopment (M4D) Project at the World Business Council for Sustainable Development (WBCSD). The objectives of thisstudy are to assess the mobility challenges, opportunities and experience in Shanghai with reference to Yangtze DeltaRegion. We hope this report can make some contribution on knowledge exchange in the development of sustainablemobility for the whole society in the world.

Mobility fordevelopment
Shanghai I China
Professor Pan Haixiao, Dr. Zhuo Jian and Dr. Liu Bing Department of Urban Planning, Tongji University

Mobility for Development -Shanghai Case Study
2
This case study has been prepared for the World Business Council for Sustainable Development (WBCSD) by the Department of Urban Planning, Tongji University. Project team Professor Pan Haixiao, Project Leader, [email protected] Dr. Zhuo Jian, Associate Professor, Project Researcher Dr. Liu Bing, Associate Professor, Project Researcher Ms. Xu Xiaomin, Project Assistant Mr. Liu Weiwei, Project Assistant Mr. Xue Song, Project Assistant Mr. Wang Xiaobo, Project Assistant Mr. Chen Ye, Project Assistant Acknowledgements The authors are indebted to and acknowledge Shona Grant and Dr. George Eads and are grateful for their thoughtful and patient advice during formulation of this case study.

Mobility for Development -Shanghai Case Study
1
CONTENTS
Executive summary ________________________________________________________ 1
1. Background __________________________________________________________ 8
1.1 General information _______________________________________________ 8
1.2 YDR’s and Shanghai’s social and economic development ______________ 10
1.2.1 The YDR since the 1990s ________________________________________ 10
1.2.2 Shanghai’s development _________________________________________ 10
1.3 Role of transport in regional and urban development __________________ 11
1.4 Institutional mechanisms in the YDR ________________________________ 13
1.4.1 Regional coordinating mechanism of economic development _____________ 13
1.4.2 Regional transport organization ____________________________________ 14
1.5 Organization of transport management in shanghai ___________________ 15
1.5.1 Intercity transport management ____________________________________ 15
1.5.2 Urban transport management _____________________________________ 15
2. Mobility development of GYDR _________________________________________ 17
2.1 Introduction ____________________________________________________ 17
2.2 Highway transport _______________________________________________ 20
2.2.1 Highway development in GYDR ___________________________________ 20
2.2.2 Highway passenger and freight transport in the GYDR __________________ 21
2.3 Railway transport ________________________________________________ 22
2.3.1 Railway development in the Yangtze Delta Region _____________________ 22
2.3.2 Railway passenger and freight transport in the Yangtze Delta Region ______ 23
2.4 Waterway transport ______________________________________________ 24
2.4.1 Waterway freight and passenger transport in the YDR __________________ 25
2.4.2 Port function in the GYDR ________________________________________ 25
2.5 Aviation ________________________________________________________ 26
2.5.1 Airports in the YDR _____________________________________________ 26
2.5.2 Airport passengers in the YDR ____________________________________ 26
2.5.3 Air cargo and mail ______________________________________________ 27
2.6 Conclusions ____________________________________________________ 27

Mobility for Development -Shanghai Case Study
2
3. Regional transport in Shanghai ________________________________________ 29
3.1 Traffic distribution in the Shanghai region ___________________________ 29
3.2 Supply of facilities _______________________________________________ 30
3.2.1 Highways _____________________________________________________ 31
3.2.2 Railways _____________________________________________________ 33
3.2.3 Water transport ________________________________________________ 34
3.2.4 Ports ________________________________________________________ 35
3.2.5 Aviation ______________________________________________________ 36
3.3 Passenger transport _____________________________________________ 37
3.3.1 Intercity passenger transport structure ______________________________ 37
3.3.2 Highway passenger transport _____________________________________ 39
3.3.3 Railway Passenger Transport _____________________________________ 40
3.3.4 Aviation ______________________________________________________ 40
3.4 Cargo transport _________________________________________________ 41
3.4.1 Cargo transport structure _________________________________________ 41
3.4.2 Highway cargo transport _________________________________________ 42
3.4.3 Water transport ________________________________________________ 42
3.4.4 Railway cargo transport __________________________________________ 43
3.4.5 Air cargo transport ______________________________________________ 44
3.5 Conclusions ____________________________________________________ 44
4. Shanghai urban transport _____________________________________________ 46
4.1 Features of travel demand ________________________________________ 46
4.1.1 Features of personal travel _______________________________________ 47
4.1.2 Personal motorized vehicle travel __________________________________ 52
4.2 Features of traffic supply _________________________________________ 53
4.2.1 Road supply and use ____________________________________________ 53
4.2.2 Public transport supply and use ____________________________________ 55
4.2.3 Non-motorized transportation system _______________________________ 57
4.3 Transport demand management policy ______________________________ 57
4.3.1 Public transport priority policy _____________________________________ 58
4.3.2 The license plate auctioning policy _________________________________ 58
4.3.3 Parking charging policy __________________________________________ 58
4.3.4 Motorcycle limitation policy _______________________________________ 59
Mobility for Development -Shanghai Case Study
3
4.4 Conclusions ____________________________________________________ 60
5. Information and telecommunications services ____________________________ 61
5.1 Postal services __________________________________________________ 62
5.2 Telecommunication: Installed telephone & mobile phone _______________ 64
5.3 Internet and web communication ___________________________________ 66
5.4 Broadcasting and television stations ________________________________ 69
5.5 Application of new ICTs and its impact ______________________________ 71
5.6 Conclusions ____________________________________________________ 73
6. Shanghai’s transport system operating costs and efficiency ________________ 74
6.1 General information ______________________________________________ 74
6.2 The operation situation of transport enterprises ______________________ 74
6.3 General transport and communication costs and expenditures __________ 75
6.3.1 Transport and communication consumer price index ___________________ 75
6.3.2 Transport and communication expenditures __________________________ 75
6.4 Cost and efficiency on urban transport ______________________________ 78
6.4.1 Cost and efficiency for public transport ______________________________ 78
6.4.2 Cost and efficiency for motorized vehicles ____________________________ 80
6.4.3 Cost of urban occasional freight transport ____________________________ 83
6.5 Efficiency and cost of intercity transport ____________________________ 83
6.5.1 Cost of highway and railway freight _________________________________ 84
6.5.2 Cost of highway and railway passenger transport ______________________ 85
6.5.3 Aviation transport _______________________________________________ 86
6.5.4 Water transport and ports ________________________________________ 87
6.6 Conclusions ____________________________________________________ 89
7. Investment in Shanghai’s transport system ______________________________ 90
7.1 Brief ___________________________________________________________ 90
7.2 Investment in metro transport _____________________________________ 91
7.2.1 Brief _________________________________________________________ 91
7.2.2 Reform of investment and financing system of Shanghai metro transport ____ 92
7.2.3 Investment and financing for constructed metro in Shanghai _____________ 92

Mobility for Development -Shanghai Case Study
4
7.3 Conclusions ____________________________________________________ 93
8. Sustainable transport development challenges in Shanghai _________________ 94
8.1 Traffic safety ____________________________________________________ 94
8.1.1 Statistical analysis of road traffic accidents ___________________________ 95
8.1.2 Road traffic accident factors ______________________________________ 96
8.2 Environmental impact ____________________________________________ 96
8.2.1 Ambient air environment _________________________________________ 96
8.2.2 Ambient acoustic environment _____________________________________ 99
8.2.3 Greenhouse gas emissions _______________________________________ 99
8.2.4 Transport environment policies and pollution control measures __________ 100
8.3 Traffic congestion ______________________________________________ 100
8.3.1 Transport construction __________________________________________ 100
8.3.2 Traffic flow ___________________________________________________ 100
8.3.3 Traffic speed analysis __________________________________________ 101
8.4 Energy ________________________________________________________ 103
8.4.1 Energy consumption and pricing in Shanghai ________________________ 103
8.4.2 Energy consumption in the transport sector _________________________ 105
8.5 Mobility Divide _________________________________________________ 107
8.5.1 Urban space expansion by enhanced mobility________________________ 107
8.5.2 Segregation of urban space by enhanced mobility ____________________ 108
8.5.3 Urban interest differential by imbalanced mobility _____________________ 108
8.5.4 Reflections on the disadvantaged _________________________________ 112
8.6 Conclusions ___________________________________________________ 112
9. Policy and special issues ____________________________________________ 114
9.1 Analysis of Shanghai’s transport policy ____________________________ 114
9.1.1 Continue to strengthen key transport infrastructure construction __________ 114
9.1.2 Coordinating urban land use and transport __________________________ 115
9.1.3 Control of motorized vehicles _____________________________________ 116
9.1.4 Building a multi-mode urban transport system based on public transport priorities
____________________________________________________________ 117
9.1.5 Protect activity space for slow transport ____________________________ 117
9.1.6 Traffic management ____________________________________________ 118

Mobility for Development -Shanghai Case Study
5
9.2 Key transport infrastructure construction ___________________________ 118
9.2.1 Hongqiao transport hub station ___________________________________ 118
9.2.2 Shanghai-Hangzhou maglev line __________________________________ 118
9.2.3 Intercity railway planning in Yangtze River Delta region ________________ 119
9.3 Transports during Shanghai Expo 2010 _____________________________ 119
9.4 Conclusions ___________________________________________________ 121
Appendices ____________________________________________________________ 122
Appendix I - Tables ____________________________________________________ 122
Appendix II - Figures___________________________________________________ 128
Appendix III – Stakeholder dialogue participants list ________________________ 138
Appendix IV - Notes from the stakeholder dialogue _________________________ 139
Appendix V - References cited __________________________________________ 143
Mobility for Development -Shanghai Case Study
1
Executive summary This case study was prepared as input for a stakeholder dialogue that was held in Shanghai on 14 November 2007. The interim report was distributed to participants prior to the meeting and presented during the meeting. The feedback from the stakeholders has been used in the preparation of this final report. The list of dialogue participants are given in Appendix III and a summary of the stakeholder dialogue in Appendix IV. Some specific comments from dialogue participants are presented in boxes at various points throughout the report. The objectives of the case study The objectives of this study are to assess the mobility challenges, opportunities and experience in Shanghai with reference to the Yangtze Delta Region. In particular the study is designed to:
1. Explore the role of mobility in China’s recent economic growth, with a specific focus on Shanghai and the Yangtze Delta: • Consider the role of international trade, intercity and regional transport, and
information & communications technology (ICT) in connecting people and goods to each other and to markets
• Discuss the extent to which this is narrowing the mobility opportunity divide between urban and rural areas in China
2. Learn from China’s experience in dealing with the challenge of making mobility sustainable in its rapidly growing cities: • Consider the role of mobility in Shanghai in driving economic growth and social
progress and compare with several other key cities in China at different stages of development;
• Explore the extent to which this is narrowing the mobility opportunity divide within the cities
• Discuss the transport-related impacts arising from this growth and how these are impacting sustainable development in China (safety, emissions, congestion, energy security etc)
• Seek feedback on the key sustainable mobility priorities and policy measures to deliver “harmonious” mobility in China’s cities.
Regional mobility in the greater Yangtze Delta Region and Shanghai The Yangtze Delta Region has the highest population density, the largest gross domestic product and the most powerful development potential of all economic zones in China. As the “dragon’s head” of economic development, Shanghai is now striding toward the objective of being a modern international metropolis. Comprising only 0.06% of China’s land area, Shanghai’s financial revenue accounts for one-eighth of the nation’s total, while its total port import-export commodity volume comprises 25% of China’s total.

Mobility for Development -Shanghai Case Study
2
Transport modernization and integration is an important component of economic integration in the Yangtze Delta Region and a precondition of realizing economic integration. Since the 1990s, the service and functioning of regional transport have greatly advanced, especially freeway systems. There are 11 major coastal and inland ports, 17 large and small airports, hundreds of highway routes and 10 main railways in this region. Intercity passengers in Yangtze delta region account for 20% of the nation’s total, and the share of freight movement is also more than 10% of the total. Thus, the Yangtze Delta Region is one of the most important logistics centers in China. It is the construction of passenger and freight transport systems that has made the high-speed development of the region possible. The total highway mileage in Shanghai reached 8,110 kilometers in 2005, 2.66 times that of 1990, of which freeway mileage constitutes 560 kilometers. As a result, the road network length density of the greater Yangtze Delta Region (GYDR) is now higher than that of the other areas in China by area. However, it does not match the economic scale and size of the population. The highway mileage per ten thousand people in this area is only 20.8% of China’s average. Railway mileage per 10,000 persons was only 0.16 km, one-third of the national average. And the utilization rate of line section capacity approached 100%. The Shanghai railway plays an important role in the national railway networks. Railway transport accounts for about 50% of intercity passengers in Shanghai and about 5% of cargo transport. It represents the backbone of intercity transport for Shanghai, especially for passenger transport. The operated mileage in Shanghai has only changed from 259 km in 1990 to 269 km in 2005, a negligible increase in the last 15 years. As an international hub airport, Shanghai Pudong and Shanghai Hongqiao airports account for 70% of air passengers and 86% of the air freight in this region. Pudong airport will be extended to reach a capacity of 80 million passengers while Hongqiao will increase its capacity to 30 million by 2010. Constrained by transport capacity and vehicle efficiency, the efficiency of rail and road transportation between cities has not changed much recently. In contrast, waterways, especially the ocean, and air transportation have improved a lot in efficiency. Waterway transport enterprises have grown to be the economic power of the Shanghai transport sector, with profits equaling some 75% of the total profit for the entire Shanghai transport industry in 2005. Railways are better suited to passenger and longer distance freight transport than roads. But its capacity is limited and railway transport maintained a deficit from 1997 to 2005. In 2005 major ports in the GYDR handled over one-third of the foreign trade cargo for China. Of these the Shanghai and Ningbo ports handled 70% of the foreign cargo in the GYDR area.
Mobility for Development -Shanghai Case Study
3
Shanghai is a key international shipping and aviation center, and with the continued development of the manufacturing industry in GYDR, a large demand for freight and passenger movement will be created. Because of its geographical location, Shanghai can only connect with the other parts of mainland China through the Shanghai-Nanjing corridor in the northwest and Shanghai-Hangzhou corridor in the southwest. Two enormous bridges are under construction as a new gateway to the north via Nantong and to the south via Ningbo. Expansion of the existing highways is unlikely to meet the huge demand for sustainable mobility due to high traffic concentrations on several corridors that pass through densely populated areas. More integrated regional transport systems should be encouraged, such as sea-inland waterways, port-rail, airport-regional public transport systems. At present, the Yangtze Delta Region1, especially Shanghai, is in a key period of development. Faced with a complicated and volatile situation, a prominent contradiction of land resources, the rise of production prices and enterprise cost increases resulting from an appreciation in the RMB, transportation congestion and resource constraints, the GYDR must change its development path if it wants to realize the goal of sustainable development. Shanghai urban transport Regarding urban transport in Shanghai, because of the long time delays in infrastructure construction and the city center’s high population density, city planners have followed a strategy to constrain car use, such as the parking policy and license plate auction system. But the fast growth of motorization and the car industry promotion policy require large amounts of road space. Over the last ten years, Shanghai invested an average of 2.9% of its GDP annually on transportation infrastructure. Forty-one percent of the investment was for metro construction, consistent with the policy of encouraging public transport in the city center and adopting motorization in suburban areas. The huge investments in transportation are only possible with the active role of the Shanghai government and the involvement of the private sector. By the end of 2005, the total mileage of city roads in Shanghai had reached 12,227 kilometers, up 84% over that of 2000, of which 7,200 kilometers of carriageway length are classified as express and arterial roads. Shanghai’s motorization is also increasing rapidly, with the number of motorized vehicles increasing from 466,000 to 2,217,000 in 9 years, an annual growth rate of 20.8%. The extensive construction of urban roads did lessen traffic congestion for short periods immediately after construction. According to statistics, during rush hour about 42% of arterial roads in the center of the western Shanghai area were congested. Of 22 arterial road crossings under investigation, about 50% were seriously congested during rush hour. It was recognized that a metro system may be the solution, and large scale metro construction is now

Mobility for Development -Shanghai Case Study
4
ongoing. One of the distinguishing characteristic of urban transport in Shanghai is that pedestrian and bicycle traffic is quite high, accounting for 54% of total trips, thanks to the contribution of land-use control with a high density and high mixture, and also the large-scale infrastructure still available for non motorized travel in Shanghai. It is because of non-motorized travel that road congestion is still acceptable to society. And the low paid employees are still able to get to work at an acceptable time and monetary cost. According to the Third Transport Survey Report of Shanghai (2004), the total number of daily trips for resident was about 41 million. Transport demand within Shanghai’s city center is increasing; the biggest increase is in trips outside of the central city. Motorized travel is increasing even more dramatically; the growth rate of motorized trips is far ahead of that of the personal trips. The gap between traffic demand and supply is widening. Public transport is now a priority in urban transport policy. A long-term government commitment is also needed to control the increasing volume of car traffic. There are 18,000 buses with 1,180,000 seats and 948 bus/trolley lines with a total length of 22,000 km in Shanghai. The local buses serve 7.48 million passengers daily. The 45,000 taxies registered carry 2.96 million passengers every day. There are 5 metro lines in Shanghai with 68 stations and a total operating length of 147.9 km in 2005. The number of passengers serviced by the Shanghai metro system increased sharply from 2000 to 2005, with annual increases of nearly 37%. The total passengers per day rose to 1.63 million in 2005. As a result, the metro is always seriously crowded, especially line #1. With the expansion of the city and the remarkable growth in urban activity space, the average travel distance extended from 4.5 kilometers/trip to 6.9 kilometers/trip between 1995 and 2004, and the proportion of motorized travel has increased. For example, from 1995 to 2004 the proportion of the motorized trips in Shanghai increased from 28% to 40%, of which the proportion of public transport rose from 20% to 24%, private motorized vehicles from 7% to 15%, and non-motorized-vehicles dropped from 42% to 28%. Shanghai has witnessed substantial development in both transport supply and operational efficiency. At the same time, transport development is closely connected with other aspects of sustainable urban development, including environmental protection, traffic safety, energy consumption and social justice. From 1980 to 2000, the number of traffic accidents increased progressively by 275%. Traffic safety measures have been gradually strengthened, and the number of deaths and injuries, and the direct pecuniary losses due to road traffic accidents in Shanghai followed a significant downward trend in recent years. Traffic safety in the suburbs is still very serious, for example fatal traffic accidents in suburb areas accounted for more than 85% of the total number in Shanghai in 2004.
Mobility for Development -Shanghai Case Study
5
In 2006, the annual daily average of inhalable particulates, SO2 and NO2 in urban areas was 0.086mg/m3, 0.051mg/m3 and 0.055mg/m3 respectively. Data show that CO2 emissions were 138 million tonnes in 2002. With faster growth, CO2 emissions reached 150 million tonnes in 2004, 20 million tonnes more than in 2000.One report has estimated that 86% of CO2 and 81% of NOx are from urban vehicle emissions in Shanghai.2 With residential areas developing along the main transport axis, some low-income families are being squeezed out by higher earning newcomers, to areas with poorer transportation. As a result, low-income families will spend more time travelling. Even with great effort to encourage public transport through large-scale metro construction, the low-income segment rides the metro much less frequently that the other income groups. The overall cost of transportation is increasing rapidly in general. In 2000 only 3% of the family budget was spend on transportation and communication. This rose to 15.6% in 2006. A two-way metro ticket costs a minimum of 17.7% of a low-wage worker’s daily income. This shows the need to cut the cost of urban transport. If we cannot reduce the cost, or provide the subsidy directly to the low-income consumer, construction will further divide whole society. Key policy issues on sustainable mobility for Shanghai To solve the above problems, the Shanghai government has instigated many transport demand management policies. Of these the public transport privilege policies, the license plate auctioning policy, parking charging policy and motorcycle limitation policy have so far been most successful. Some important policies are analyzed below. Continue to strengthen key transport infrastructure construction Shanghai will continue to strengthen the construction of key transport infrastructure. But the main efforts will be put on mass-capacity transport modes, such as the intercity express rail, metro system and freight rail link to the container port. The construction of the metro is key to establishing a sustainable transport system in Shanghai. The 1,000 km metro construction plan is very ambitious. But success will not be measured just by its scale, but also by its impact on economic vitality and social justice. Greater Yangtze Delta Region comprehensive transport plan Due to the difficult nature of province-wide coordination between different government transport authorities, highway construction is usually considered the simplest solution to implement to address transportation needs. However, due to the limited land area and geographical setting of Shanghai, it is proving very difficult for Shanghai to provide enough traffic lanes to match the demand from surrounding provinces for freight and passenger transport. As a result, a comprehensive transport plan should be prepared to integrate various transport modes over the whole GYDR. There is a need to develop a regional planning authority that would responsible for the implementation of plan.

Mobility for Development -Shanghai Case Study
6
Coordinating between urban land use and transport It has been proven that land-use density and mixture are very important factors that impact on people’s travel mode choice. The urban planning control system, generally speaking, is working well to control unplanned and low-density development in Shanghai. But there is an incentive to sell as much land as possible to generate fiscal revenues, especially in suburban areas, so that suburban development should be encouraged along the public transport corridors. Control of motorized vehicle Controlling the number of motorized vehicle has been a successful practice in Shanghai from the 1990s, keeping a balanced dynamic between road supply and increasing vehicle demand by, for example, the license plate auction and parking policy. However, this unique public policy is under great pressure from the car industry lobby. In addition, the license plate auction policy only delays motorization. A new taxation system should also be introduced to encourage people to buy smaller cars for both environmental and road/parking space concerns. Building multi-mode urban transport system based on public transport priority The municipal government has tried to promote the construction of transportation hubs to more effectively link all transport modes. The intention is to fully leverage the advantages of various transport modes and build up a multi-modal urban transport system. The construction of the multi-modal transport system will face the challenge of institutional fragmentation. As a result, the ability to coordinate the various stakeholders within Shanghai, GYDR and the central government is critical to success. Protect space for slow transport The bicycle is still the most sustainable mode of urban transport. In the past, many services and job opportunities were available in Shanghai within bicycle range. In the context of the rapid expansion of urban space, the municipal government has anticipated a transfer of the long distance bicycle passenger to motorized public transport. However, in fact, this transfer is not obvious due to limited services and geographic coverage.3 The question is whether public transport can provide the same mobility service as a bicycle without an extra financial burden on the government? Or should people be forced to use a car even for short distance travel?4 How can bicycle riders keep their share of the road? Faced with these questions, it is now very important to keep the characteristics of the pedestrian and bicycle transport modes in the city. Traffic management The operation of “unblocking the road” (to speed-up the car traffic with wider roads, investments in traffic control equipment and stronger enforcement) has greatly improved the local government’s ability to manage traffic and the physical quality of traffic infrastructure, although it is hard to consider it a successful operation on the whole. The soft traffic management measures, such as the flexible working hours schedule, tide traffic lanes5 etc., have not been fully explored yet. Information technology has the potential to greatly improve the efficiency of existing transport infrastructure and make information on transport “more accessible and more transparent” for passenger and freight movement.

Mobility for Development -Shanghai Case Study
7
Vehicle emission control On 1 October 1997, unleaded gasoline for motor vehicles was promoted in Shanghai. On 1 July 1999, the European I emission standards for light vehicles was implemented, two years ahead of schedule. In 1998, taxis began to run on liquefied petroleum gas (LPG) and the use of compressed natural gas (CNG) was promoted on buses. The use of low-olefin unleaded petrol was promoted for motorized vehicles in March 2000 ahead of national implementation. On 1 March 2003, the European II emission standard for motorized vehicles was implemented in the city. According to new regulations implemented in the city center since 15 February 2006, high-polluting vehicles (i.e., those not meeting European I emission standards) that have not received "the green license" are restricted on the elevated expressways. This restriction was extended to the surface roads within the inner-ring road on 1 October 2006.

Mobility for Development -Shanghai Case Study
8
1. Background
1.1 General information
Figure1.1.1: Location of Greater Yangtze Delta Region
The Yangtze Delta Region (YDR)6 is an economic region led by the city of Shanghai. It consists of eight large or medium cities in Jiangsu Province along the Yangtze River (Suzhou, Wuxi, Changzhou, Zhenjiang, Nanjing, Yangzhou, Taizhou, Nantong) and seven cities in Zhejiang Province around Hangzhou Bay (Hangzhou, Jiaxing, Huzhou, Ningbo, Shaoxing, Zhoushan and Taizhou). These two urban agglomerations form the two wings of YDR.

Mobility for Development -Shanghai Case Study
9
Figure1.1.2: Yangtze Delta Region
The YDR stretches over approximately 109,600 km². With a population of more than 80 million, its population density is the highest of all economic zones of China, as is its gross domestic product (GDP). It is acknowledged as having the largest development potential in China. Its strong competitiveness has attracted increasing foreign investment, promoting industry and technology transfer, and playing an active role in international and regional competition. According to the Yangtze Delta Regional Planning Outline, this region is defined as “an economic center with the strongest competitiveness in China, the main international gateway in Asia Pacific Region, and a globally important advanced manufacturing base and the first Chinese megalopolis in the rank of world cities.”7 Shanghai is located at the foreland of YDR, facing the East Sea in the east, Hangzhou Bay in the south and an estuary of the Yangtze River in the north. Shanghai has long been the largest economic center in China and is a famous historical and cultural city. At the same time, it has been an important port city in China. The total area of Shanghai is 6,340.5 km², including a land area of 6,218.65 km² and a water area of 121.85 km². The south to the north of the city spans approximately 120 km, 100 km

Mobility for Development -Shanghai Case Study
10
from east to west. Administratively, Shanghai is divided into 18 districts and 1 county. By the end of 2006, Shanghai’s registered urban population8 reached 13.68 million, while the total number of inhabitants staying in Shanghai for more than six months totaled 18 million. Shanghai’s development objectives include the creation of international economic, financial, trade and shipping centers, and a modern international metropolis.
1.2 YDR’s and Shanghai’s social and economic development 1.2.1 The YDR since the 1990s Announced in 1992, the opening of the Pudong area in Shanghai was considered as strategic move for China’s development. It has brought about unprecedented opportunities for the development of the YDR and resulted in its rapid growth. The Yangtze Delta Region has become an important international manufacturing base and a locomotive driving economic growth in China. In 2006, the annual GDP of the 16 cities in the YDR reached 3,952.6 billion Yuan, accounting for 18.9% of national GDP, increasing 0.4% over the previous year. At the same time the GDP of all 16 cities in the Yangtze Delta Region increased 14.7%. The YDR has become increasingly important to national economic growth. The YDR is responsible for nearly 20% of national GDP but only accounts for 1% of China’s land area. Its output per unit of land has shown constant growth. In 2006, the output of the YDR per square kilometer of land was 36.05 million Yuan, an increase of 5.08 million Yuan compared to 2005. In 2006, retail sales of consumer goods per square kilometer in the YDR reached 11.26 million Yuan, an increase of 1.47 million Yuan compared to 2005. Gross exports per square kilometer were 3.24 million dollars with an increase of 0.72 million dollars compared to 2005.9 Today the YDR is facing a key period of development. With the more complicated global and national social and economic situation, decreasing land resource availability, the rising costs of raw materials resulting from the appreciation of the RMB, as well as deteriorating transport conditions, the YDR has to change its development path in order to maintain its social and economic vigor. 1.2.2 Shanghai’s development As the economic center of China, Shanghai bears the responsibility of leading the economic growth of the YDR, and even that of the whole country. With only 1.5% of the nation’s population and 0.06% of China’s land area, the financial revenue of Shanghai accounts for one-eighth of the national total, while the total port import-export commodity volume comprises 25% of China’s total. The total port import-export volume accounts for about 10% of China’s total, while the total port import-export commodity value reaches 25%10. The import-export activities are more polarized in Shanghai because of the reliable and professional services and
Mobility for Development -Shanghai Case Study
11
central government support. In 2006, Shanghai’s GDP of was 1,029.697 billion Yuan, an increase of 12% over 2005, continuously serving the strongest economy in China. Shanghai was the first city to generate a GDP of over one trillion Yuan in China, and its per capita GDP reached 75,990 Yuan. Since 1992, Shanghai has maintained double-digit economic growth rate. The proportion of tertiary industry reached 50.6%, and in the city center, this figure reached over 70%.11 In 2006, the export-import value of Shanghai was US$ 656.243 billion, among which total port import-export value was US$ 428.754 billion and total foreign trade import-export volume was US$ 227.489 billion with an increase of US$ 78.076 and US$ 41.124 billion12 respectively, compared to the previous year.13 Since the 1990s, infrastructure construction has been breathtaking in Shanghai. Yangshan Deepwater Port Phase I Project, the Pudong International Airport and its auxiliary projects have been completed; the urban expressway network framework has gradually formed and the construction of the metro has been accelerated. The integrated service ability of information infrastructure has been notably enhanced. Development prospects In accordance with The Outline of the Eleventh Five-Year Program for the Economic and Social Development of Shanghai, Shanghai must strike a balance between the needs of the population, industry, infrastructure, resources and the environment as it moves towards the goal of “four centers” (international economic, finance, trade and shipping centers) and modern international metropolis by implementing the view of scientific development and constructing a harmonious society.
1.3 Role of transport in regional and urban development Transport is the key component of economic development in the YDR. After years of construction, an integrated transport system, including highway, waterway, railway, aviation and pipeline, has gradually formed in the YDR. The construction of an international shipping center in Shanghai has laid a solid foundation for constructing an internationally influential manufacturing base, which is important for the YDR to merge into the global economy. With the rapid economic growth in the YDR, the demand for transportation has been greatly increased. Since the opening of the Shanghai-Hangzhou freeway in 1996, its traffic flow has continuously increased, with an average annual growth rate of nearly 20%, and over 24% for some parts of the freeway. In 1997, the average daily traffic flow of Hangzhou-Ningbo Freeway was 15,000, while by 2003, the traffic had reached 41,000 vehicles, equating to an average annual increase of 18%. The improvement of the regional transportation network has played an important role in promoting the YDR’s internal and external exchange capacity.14 To achieve the goal of balanced regional economic development, transportation has to be developed in an integrated way in the YDR, a consensus in the YDR and its surrounding cities.
Mobility for Development -Shanghai Case Study
12
Since the 1990s, with large-scale investment, regional transportation service and functioning have been greatly advanced, especially for freeway systems. With the completion of Yangtze riverside freeway, the COASTAL FREEWAY, the cross-river passage, Hangzhou Bay Bridge and other major transport projects, a well developed highway network has come into being.$ With the regional transport system’s development, the YDR’s transport circle has been continuously expanded and travel time significantly shortened, which has been important for the integration of regional transport and economic development. 15 To promote the GYDR’s urban development, improve the regional spatial development pattern and advance integrated strength and overall competitiveness, the Sutong Yangtze River highway bridge (with the world’s longest main span, north of Shanghai) and the Hangzhou Bay cross-sea bridge (one of the world’s longest sea-crossing bridges, south of Shanghai) will be built in succession. The new transportation network will expand spaces for the economic growth of the YDR, which is particularly favorable for Zhejiang and Jiangsu because of much improved links to Shanghai. Ningbo will be a coastal transport junction from a transport end and Jiaxing will also become a key node city. As a result, the level of opening up to both the inside and the outside will be enhanced. In the mean time, it may provide Nantong with new development opportunities, which would add new power to economic development and regional interaction of the YDR. The construction of a costal freeway in the Jiangsu Province will establish closer links between central and northern Jiangsu and Shanghai. Let us take Yancheng city (Jiangsu Province) as an example where transportation construction has been accelerated in recent years. With the completion of the Ningjingyan freeway, the coastal freeway, the Yanhuai freeway and the Xinchang railway, Yancheng city’s transportation has been considerably enhanced, along with its economic and social development. In 2006, the GDP of Yancheng reached 117.43 billion Yuan, an increase of 15.1% over 2005, while GDP per capita grew from 6,904 Yuan in 2000 to 12,849 Yuan in 2005, an increase of 86%.16 Regional transportation development in Jiangsu province will also promote the rapid development of Lianyungang, the largest seaport of Jiangsu and bring it into the “half-day traffic circle” of the YDR. This is favorable for the development of northern Jiangsu. The exiting gateways of Shanghai are mainly located in west of Shanghai along the Huning,17 Huhang18 and Yangtze Riverside Freeway, and the expansion of urban space is mostly along these corridors making obvious spatial difference to urban development in the Shanghai region. For example, Chongming is an island surrounded by the Yangtze River, and its socio-economic development has lagged behind because of inconvenient transport links. According to the plan, after the Sutong bridge and Hangzhou bay sea-crossing bridge have been established, the Shanghai International Shipping Center, with its structure of “one heart
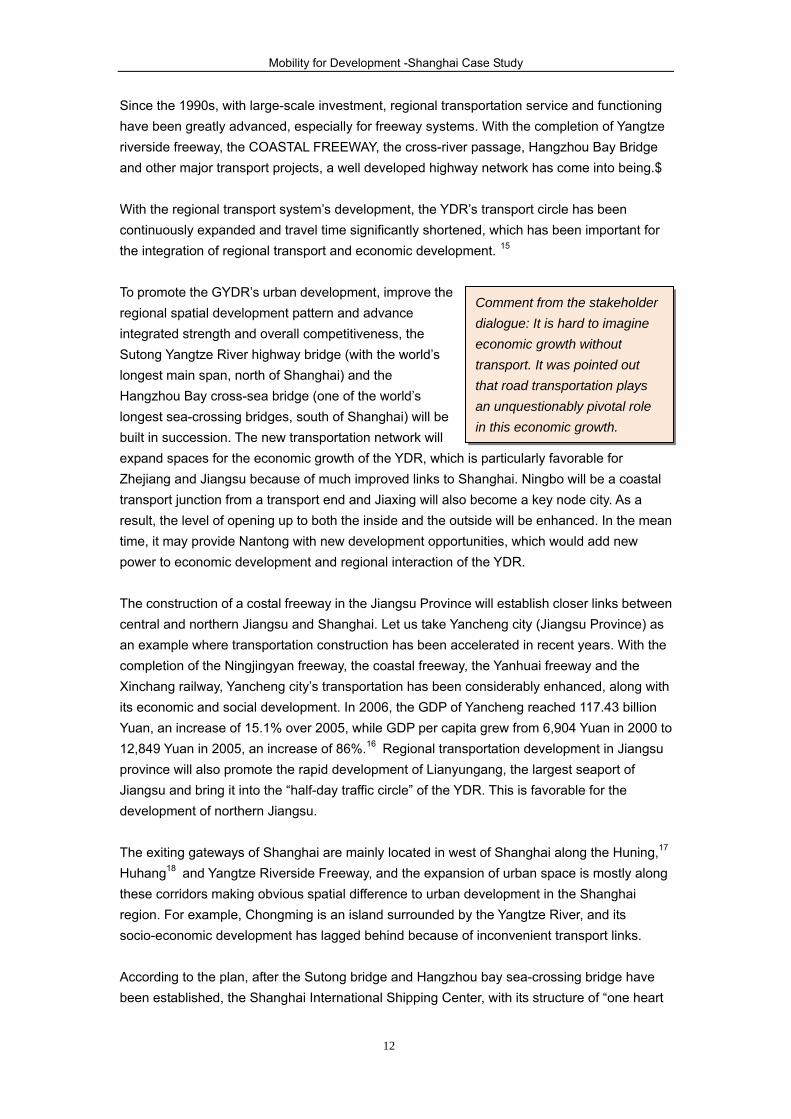
Comment from the stakeholder dialogue: It is hard to imagine economic growth without transport. It was pointed out that road transportation plays an unquestionably pivotal role in this economic growth.
Mobility for Development -Shanghai Case Study
13
and two wings”, will begin to take shape. With the Ningbo–Zhoushan port groups as its south wing and Nantong port as its north wing, the economic radiation of Shanghai may be extended to Zhangjiagang and even Rizhao port in Shandong Province. The 954-kilometer long coastline within Jiangsu Province will be connected with Shanghai. The distance from Ningbo to Shanghai will be shortened by 120 km and the distance from Shanghai to Taizhou (of Zhejiang Province) and Wenzhou will also be greatly shortened. As a result, the cost of transportation will be greatly reduced.19 In the future, the intercity rail transport program will be launched, one line after another, in the GYDR, with the total length around 815 km linking Nanjing, Hangzhou and other major cities with Shanghai to increase the railway capacity for short-medium distance intercity travel (less than 300 km). The shortening of travel time will certainly accelerate the transformation of the Yangtze Delta Region into an advanced international metropolitan region with Shanghai as its head.
1.4 Institutional mechanisms in the YDR 1.4.1 Regional coordinating mechanism of economic development The Regional Economic Coordinating Meeting of the YDR is a regional cooperation organization aiming to enhance economic connections and cooperation, and promote economic sustainable development in the YDR. In 1992, the municipal Economic Cooperation Committees were created in 14 cities in the region (except Taizhou in Jiangsu and Taizhou in Zhejiang), and an annual forum is held by the directors of cooperation committees of each city. When Taizhou city of Jiangsu Province participated in this forum in 1997, all 15 city members reached a consensus that this conference should involve all mayors in the YDR. In 2003, Taizhou city joined this forum. Since then there have been mayors of 16 cites participating in this annual forum. At the fifth session of Yangtze delta regional urban economic coordinating forum held in 2004, all members decided to establish the YDR Urban Economic Coordinating Office. Based in Shanghai, this office is an executive department responsible for the coordination, organization and improvement of regional economic cooperation in the YDR.
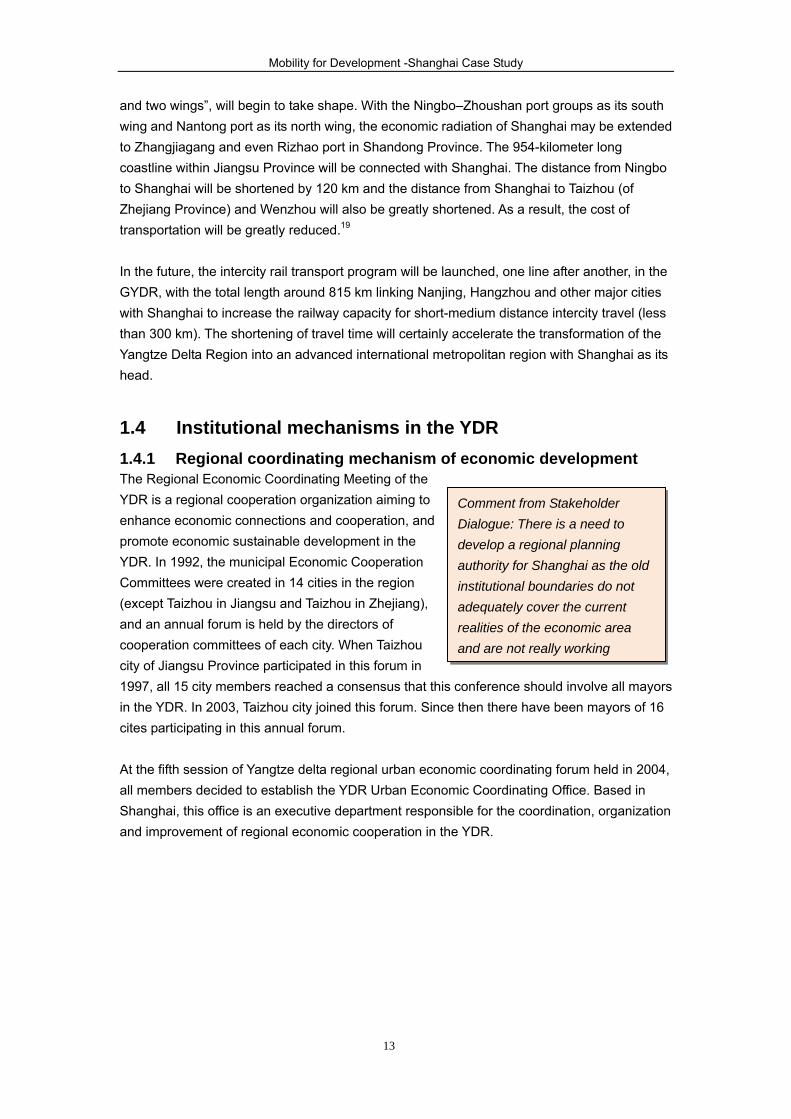
Comment from Stakeholder Dialogue: There is a need to develop a regional planning authority for Shanghai as the old institutional boundaries do not adequately cover the current realities of the economic area and are not really working
Mobility for Development -Shanghai Case Study
14
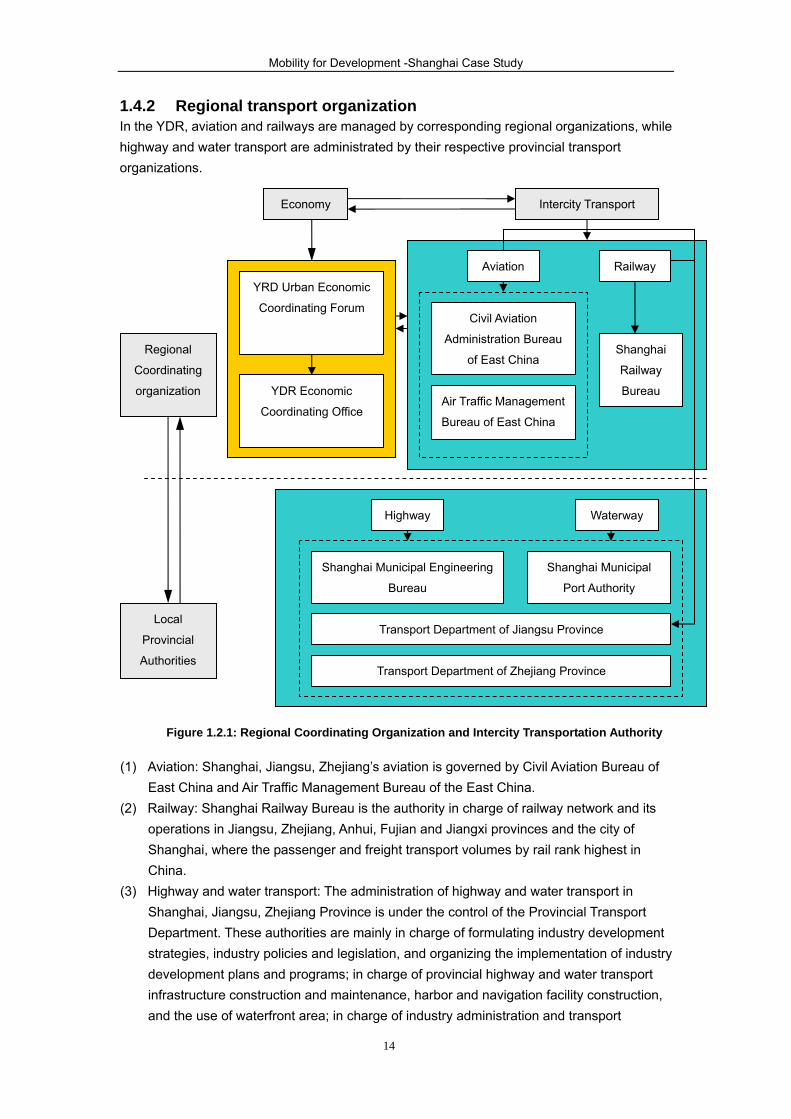
1.4.2 Regional transport organization In the YDR, aviation and railways are managed by corresponding regional organizations, while highway and water transport are administrated by their respective provincial transport organizations.
(1) Aviation: Shanghai, Jiangsu, Zhejiang’s aviation is governed by Civil Aviation Bureau of East China and Air Traffic Management Bureau of the East China.
(2) Railway: Shanghai Railway Bureau is the authority in charge of railway network and its operations in Jiangsu, Zhejiang, Anhui, Fujian and Jiangxi provinces and the city of Shanghai, where the passenger and freight transport volumes by rail rank highest in China.
(3) Highway and water transport: The administration of highway and water transport in Shanghai, Jiangsu, Zhejiang Province is under the control of the Provincial Transport Department. These authorities are mainly in charge of formulating industry development strategies, industry policies and legislation, and organizing the implementation of industry development plans and programs; in charge of provincial highway and water transport infrastructure construction and maintenance, harbor and navigation facility construction, and the use of waterfront area; in charge of industry administration and transport
YRD Urban Economic
Coordinating Forum
YDR Economic
Coordinating Office
Regional
Coordinating
organization
Local
Provincial
Authorities
Economy Intercity Transport
Aviation Railway
Civil Aviation
Administration Bureau
of East China Shanghai
Railway
Bureau Air Traffic Management
Bureau of East China
Highway Waterway
Shanghai Municipal Engineering
Bureau
Transport Department of Zhejiang Province
Shanghai Municipal
Port Authority
Transport Department of Jiangsu Province
Figure 1.2.1: Regional Coordinating Organization and Intercity Transportation Authority

Mobility for Development -Shanghai Case Study
15
management of provincial highway and water transport industries; in charge of the safety issues in transport operation and enhancing law enforcement and reform for the transport industries.
1.5 Organization of transport management in shanghai 1.5.1 Intercity transport management (1) Shanghai Municipal Port Authority is in charge of port and shipping management.
Shanghai Municipal Port Authority is responsible for the industry management of international maritime transport, coastal transport and the Yangtze River transport within the administration authorization of local government and for the industry management of waterway.
(2) Urban Transport Bureau of Shanghai is responsible for intercity transport industry management.
(3) Municipal Engineering Administration Bureau is responsible for road construction and supervision, property protection, maintenance and management for municipal highways.
1.5.2 Urban transport management Urban transport management in Shanghai involves several organizations, including Urban Transport Bureau, Urban Planning Bureau, Urban Construction and Transport Committee, Municipal Engineering Administration Bureau, Traffic Police Headquarters of Police Security Bureau, etc. These organizations are working together to manage the urban transport system. (Figure 1.5.1)

Mobility for Development -Shanghai Case Study
16
The Yangtze Delta Region, especially Shanghai, is currently in a key period of development. Faced with a complicated and volatile situation, a prominent contradiction of land resources, the rise of production prices and enterprise cost increases resulting from the RMB exchange appreciation, congestion in transportation as well as resource constraints, the GYDR must change its development path if it wants to realize sustainable development.
Shanghai Urban
Transport Bureau
Shanghai Urban
Planning Bureau
Shanghai Municipal
Engineering Bureau
● Formulating Policy guidelines and industry criteria
● Formulating Transport development strategies and
transport planning
● Nourishing the transportation market
Traffic Police
Headquarters of
Police Security
Bureau
Shanghai Municipal
Construction &
Transport
Committee
Shanghai
Municipal
Government
● Organizing and conducing research on urban
infrastructure development
● Managing urban infrastructure investment
● Approving the proposal of infrastructure projects
● Supervising the implementation of integrated transport
development strategy and its planning
●Organizing evaluation for transport planning, policy and
measure
● Construction, maintenance and operation
administration of urban roads and bridges
● Road traffic management
● Streets public security order
● Administration for motor vehicles, non-motor vehicles
and all the vehicle drivers
● Prevention for road traffic accidents
Figure 1.5.1: Structure of the Shanghai Urban Transport Organization
●Coordinating various specialized planning including
transport planning
●Auditing and examining transport construction projects
Mobility for Development -Shanghai Case Study
17
2. Mobility development of GYDR This chapter focuses on the development of transportation systems and the regional distribution of different transportation modes (highway, railway, waterway, civil aviation) in the GYDR.
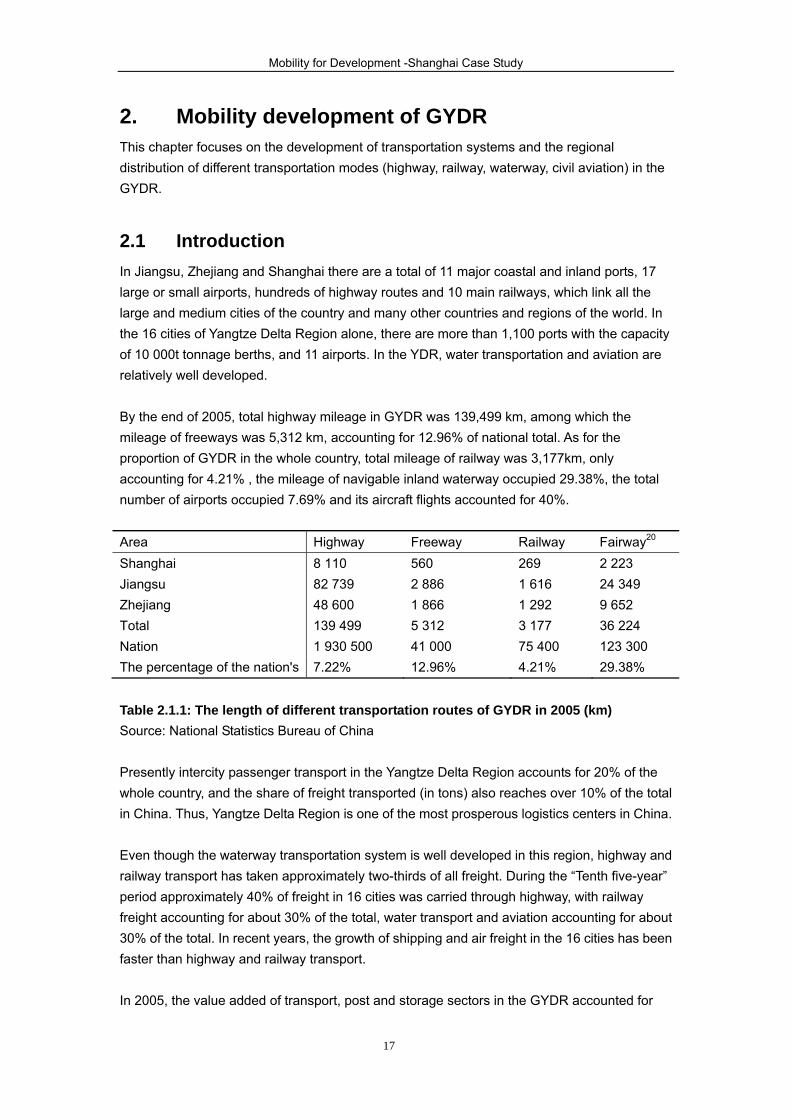
2.1 Introduction In Jiangsu, Zhejiang and Shanghai there are a total of 11 major coastal and inland ports, 17 large or small airports, hundreds of highway routes and 10 main railways, which link all the large and medium cities of the country and many other countries and regions of the world. In the 16 cities of Yangtze Delta Region alone, there are more than 1,100 ports with the capacity of 10 000t tonnage berths, and 11 airports. In the YDR, water transportation and aviation are relatively well developed. By the end of 2005, total highway mileage in GYDR was 139,499 km, among which the mileage of freeways was 5,312 km, accounting for 12.96% of national total. As for the proportion of GYDR in the whole country, total mileage of railway was 3,177km, only accounting for 4.21% , the mileage of navigable inland waterway occupied 29.38%, the total number of airports occupied 7.69% and its aircraft flights accounted for 40%.
Table 2.1.1: The length of different transportation routes of GYDR in 2005 (km) Source: National Statistics Bureau of China Presently intercity passenger transport in the Yangtze Delta Region accounts for 20% of the whole country, and the share of freight transported (in tons) also reaches over 10% of the total in China. Thus, Yangtze Delta Region is one of the most prosperous logistics centers in China. Even though the waterway transportation system is well developed in this region, highway and railway transport has taken approximately two-thirds of all freight. During the “Tenth five-year” period approximately 40% of freight in 16 cities was carried through highway, with railway freight accounting for about 30% of the total, water transport and aviation accounting for about 30% of the total. In recent years, the growth of shipping and air freight in the 16 cities has been faster than highway and railway transport. In 2005, the value added of transport, post and storage sectors in the GYDR accounted for
Area Highway Freeway Railway Fairway20 Shanghai 8 110 560 269 2 223 Jiangsu 82 739 2 886 1 616 24 349 Zhejiang 48 600 1 866 1 292 9 652 Total 139 499 5 312 3 177 36 224 Nation 1 930 500 41 000 75 400 123 300 The percentage of the nation's 7.22% 12.96% 4.21% 29.38%
Mobility for Development -Shanghai Case Study
18
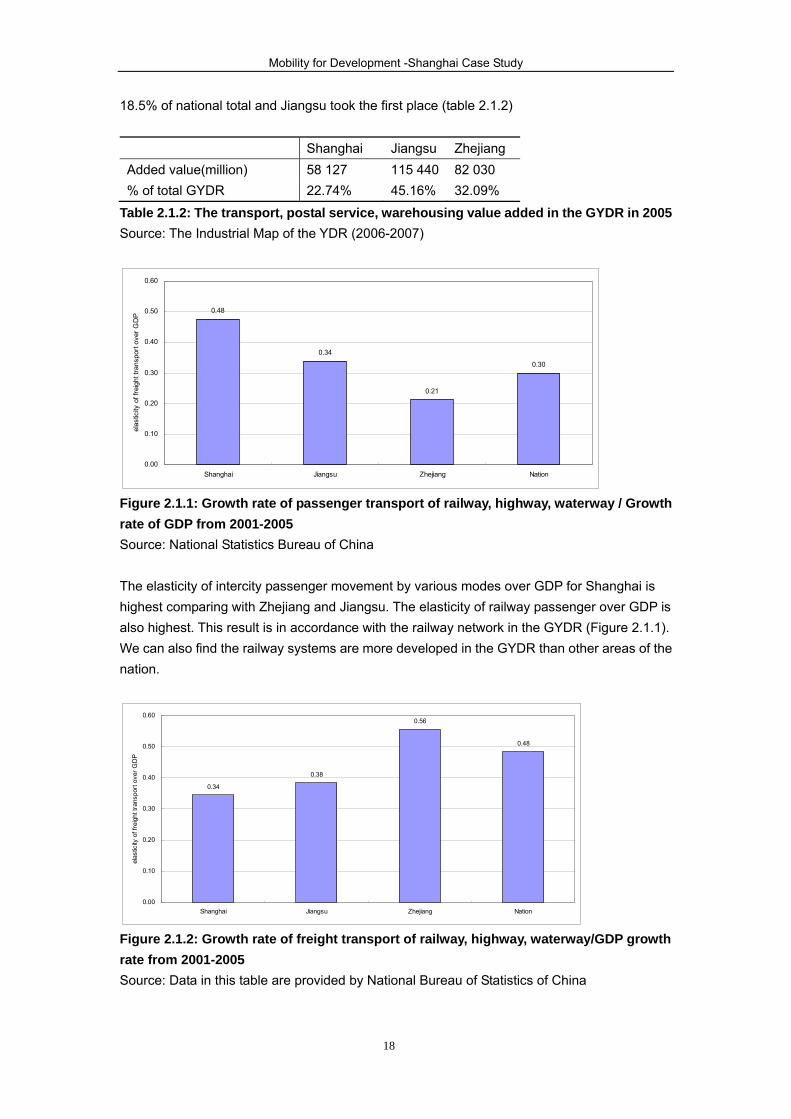
18.5% of national total and Jiangsu took the first place (table 2.1.2) Shanghai Jiangsu Zhejiang Added value(million) 58 127 115 440 82 030 % of total GYDR 22.74% 45.16% 32.09%
Table 2.1.2: The transport, postal service, warehousing value added in the GYDR in 2005 Source: The Industrial Map of the YDR (2006-2007)
0.48
0.34
0.21
0.30
0.00
0.10
0.20
0.30
0.40
0.50
0.60
Shanghai Jiangsu Zhejiang Nation
elas
ticity
of f
reig
ht tr
ansp
ort o
ver G
DP
Figure 2.1.1: Growth rate of passenger transport of railway, highway, waterway / Growth rate of GDP from 2001-2005 Source: National Statistics Bureau of China The elasticity of intercity passenger movement by various modes over GDP for Shanghai is highest comparing with Zhejiang and Jiangsu. The elasticity of railway passenger over GDP is also highest. This result is in accordance with the railway network in the GYDR (Figure 2.1.1). We can also find the railway systems are more developed in the GYDR than other areas of the nation.
0.34
0.38
0.56
0.48
0.00
0.10
0.20
0.30
0.40
0.50
0.60
Shanghai Jiangsu Zhejiang Nation
elas
ticity
of f
reig
ht tr
ansp
ort o
ver G
DP
Figure 2.1.2: Growth rate of freight transport of railway, highway, waterway/GDP growth rate from 2001-2005 Source: Data in this table are provided by National Bureau of Statistics of China
Mobility for Development -Shanghai Case Study
19
Shanghai’s elasticity of intercity freight by various modes of transport over GDP is lowest in GYDR (Figure 2.1.2).
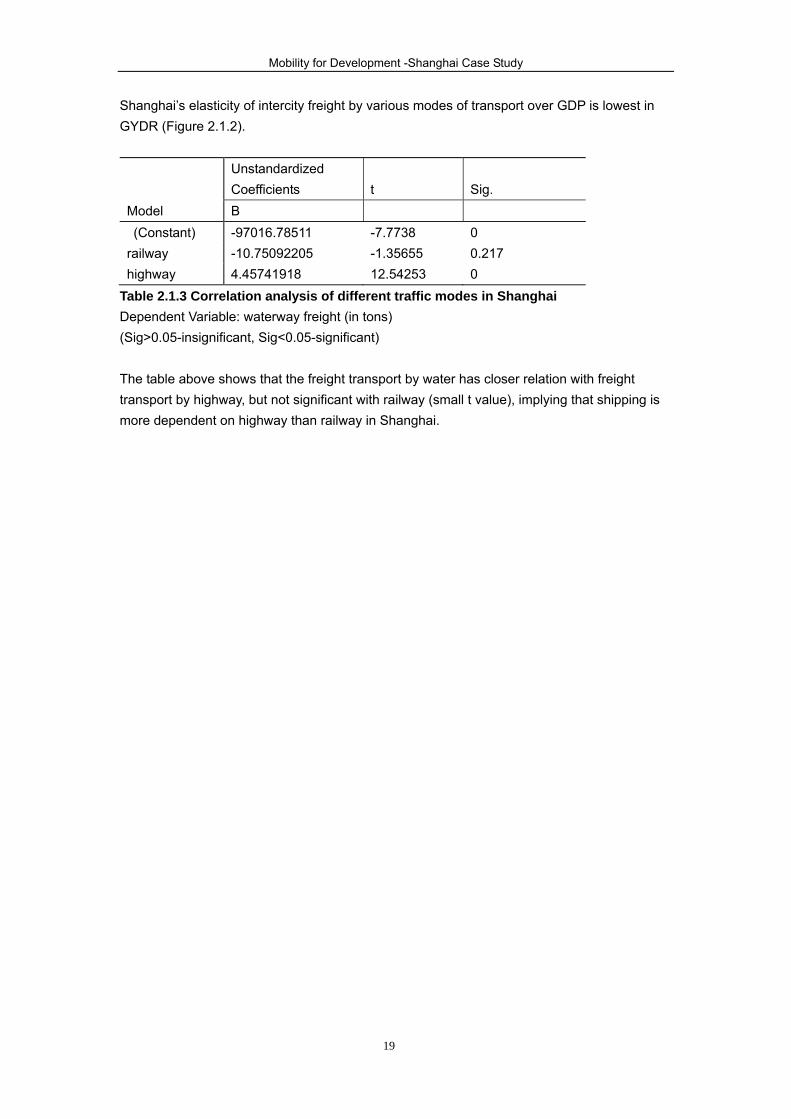
Model
Unstandardized Coefficients t Sig. B
(Constant) -97016.78511 -7.7738 0 railway -10.75092205 -1.35655 0.217 highway 4.45741918 12.54253 0
Table 2.1.3 Correlation analysis of different traffic modes in Shanghai Dependent Variable: waterway freight (in tons) (Sig>0.05-insignificant, Sig<0.05-significant) The table above shows that the freight transport by water has closer relation with freight transport by highway, but not significant with railway (small t value), implying that shipping is more dependent on highway than railway in Shanghai.
Mobility for Development -Shanghai Case Study
20
2.2 Highway transport 2.2.1 Highway development in GYDR
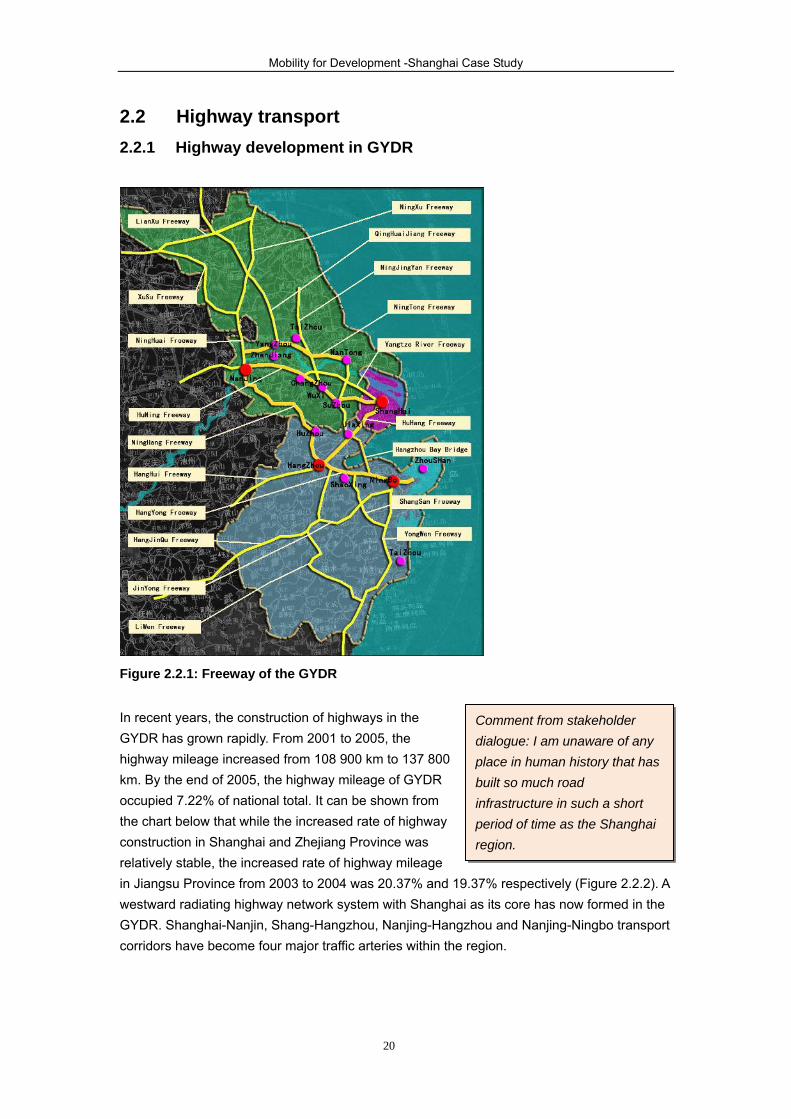
Figure 2.2.1: Freeway of the GYDR
In recent years, the construction of highways in the GYDR has grown rapidly. From 2001 to 2005, the highway mileage increased from 108 900 km to 137 800 km. By the end of 2005, the highway mileage of GYDR occupied 7.22% of national total. It can be shown from the chart below that while the increased rate of highway construction in Shanghai and Zhejiang Province was relatively stable, the increased rate of highway mileage in Jiangsu Province from 2003 to 2004 was 20.37% and 19.37% respectively (Figure 2.2.2). A westward radiating highway network system with Shanghai as its core has now formed in the GYDR. Shanghai-Nanjin, Shang-Hangzhou, Nanjing-Hangzhou and Nanjing-Ningbo transport corridors have become four major traffic arteries within the region.
Comment from stakeholder dialogue: I am unaware of any place in human history that has built so much road infrastructure in such a short period of time as the Shanghai region.
Mobility for Development -Shanghai Case Study
21
Figure 2.2.2: The Length of highway of the GYDR from 2001 to 2005
(in thousand kilometers) Source: The Industrial Map of the Yangtze Delta Region (2006-2007) The total mileage of freeway in the GYDR is 4,921 km, accounting for 12.96% of the national total in the same period. As for the density of highway network, however, Shanghai was densest with 1.28 km/km², the density of Jiangsu and Zhejiang is 0.03 and 0.02 respectively. With the construction of a series of major projects, such as Ninghang freeway, northern Jiangsu transport network, Jiangyin bridge, Sutong bridge and Hangzhou bay cross-sea bridge, the highway network of the GYDR will be advanced comprehensively. 2.2.2 Highway passenger and freight transport in the GYDR GYDR’s intercity passenger transport volume in 2005 totaled 2,929.77 billion passengers, accounting for 17.26% of the national total; and the freight was 1.904 billion tons, accounting for 14.19% of national total in the same period. With the well established network, highway transport among cities has become convenient. With increasing transport demand, however, the freeways in the GYDR become crowded soon after the opening.
0
10 000
20 000
30 000
40 000
50 000
60 000
70 000
80 000
90 000
2001 2002 2003 2004 2005
Year
leng
th o
f hig
hway
Shanghai Jiangsu Zhejiang
Leng
th o
f hig
hway
(Tho
usan
d ki
lom
eter
s)

Mobility for Development -Shanghai Case Study
22
Figure 2.2.3: Growth of passenger and freight traffic on highways of the GYDR from 2001 to 2005 Source: The Industrial Map of the Yangtze Delta Region (2006-2007) It can be seen from the above chart that the passenger and freight transport in the GYDR during the five years was growing. In Shanghai, intercity passenger transport only accounted for 0.84% of the GYDR, while the freight accounted for 17.16%. Clearly there is a lot of pressure on freight transport in the GYDR, including Shanghai.
2.3 Railway transport 2.3.1 Railway development in the Yangtze Delta Region
Figure 2.3.1: Railway of the Yangtze Delta Region
The railway network in the GYDR has developed rapidly, forming a state-wide transport network. The operating mileage of railways in the GYDR was about 3,177 km in 2005, accounting for 4.21% of the national total in the same period. However the railway mileage per 10,000 persons was only 0.16 km, only one-third of the national average. As a whole, the railway network in GYDR cannot accommodate the demands of economic and social development in this region yet.
0
500 000
1 000 000
1 500 000
2 000 000
2 500 000
3 000 000
3 500 000
2001 2002 2003 2004 2005Year
grow
th o
f pas
seng
er a
nd fr
eigh
t(
1000
peo
ple/
1000
tons
)
Passenger (thousand people) Freight(thousand tons)

Mobility for Development -Shanghai Case Study
23
Comment from stakeholder dialogue: It was pointed out that the Ministry of Railways is set up to deal primarily with freight (and mainly coal) and they do not have the capacity/culture to deal with metropolitan rail transport. However a new 800-km long regional railway has been agreed between the three provinces in the GYRD and this is expected to go ahead.
In China the railway system is generally for long-distance service (over 300 km), designed for inter-province transport. There is a lack of high-speed train services within the 50 to 300 km range. With the gradual regional economic integration and highway congestion, the few slow-speed train services cannot meet passenger transport demands within the region. Intercity railway services within the GYRD have been planned. By 2020, the total mileage of intercity rail transport network in the Yangtze Delta Region is expected to reach 815 km. 2.3.2 Railway passenger and freight transport in the Yangtze Delta
Region From 2001 to 2005, the number of railway passengers in the GYDR grew by 31.49%, which was much more rapid than the national growth of 9.91%. In the same period, freight tons grew by 25.53%, which was less than that of national growth during the same period of (39.4%). Railway freight in the GYDR grew at an annual rate of about 6%, while highway freight growth rate was about 13%. In 2005, railway freight movement in the GYDR accounted for 4.05% of the national total, while railway passengers accounted for 15.13% of the national total. With the huge demand for passenger transport, railway freight transport has to be reduced to leave room for passenger. As a result, the pressure on railway transport is huge due to the rapid increase in passenger and freight transport demand.
Figure 2.3.2: Growth of freight traffic by train in the GYDR from 2001 to 2005 (in thousand tons) Source: The Industrial Map of the Yangtze Delta Region (2006-2007)
0
10 000
20 000
30 000
40 000
50 000
60 000
70 000
2001 2002 2003 2004 2005
Year
Fre
ight
traf
fic b
y tra
in
Shanghai Jiangsu Zhejiang
Frei
ght t
raffi
c by
trai
n (T
hous
and
tons
)
Mobility for Development -Shanghai Case Study
24
Figure 2.3.3: Growth of passenger traffic by train in the GYDR from 2001 to 2005 (in thousand passengers) Source: The Industrial Map of the Yangtze Delta Region (2006-2007)
2.4 Waterway transport In 2005, the ports of Shanghai, Ningbo, Zhoushan and Lianyun’gang ranked among the top ten ports in China, and the GYRD boasts large scale port capacity overall.
Figure 2.4.1: Major ports of the Yangtze Delta Region
0
10 000
20 000
30 000
40 000
50 000
60 000
70 000
80 000
2001 2002 2003 2004 2005
Year
Pase
nger
traf
fic b
y tra
in
ShangHai JiangSu ZheJiang
pass
enge
r tra
ffic
by tr
ain
(Tho
usan
d pa
ssen
gers
)

Mobility for Development -Shanghai Case Study
25
2.4.1 Waterway freight and passenger transport in the YDR In 2005, the waterway freight movement and turnover of the GYDR were 1,057 million tons and 1,682.6 billion ton-kilometers respectively, accounting for 48 % and 34% of the total figures for China (Figure 2.4.2).
Figure 2.4.2: Freight by water of the GYDR from 2001 to 2005 (in thousands of tons) Source: Data in this table are provided by The Industrial Map of the Yangtze Delta Region (2006-2007) In 2005, the variation in waterway freight transport of Shanghai, Jiangsu and Zhejiang was not so wide, while the waterway freight ton-kilometers was much higher in Shanghai, accounting for 71.37% of the total in the GYDR. It shows that Shanghai waterway transport is mainly oceangoing freight. From 2001 to 2003, the waterway passenger transport and passenger-kilometers in GYDR decreased, but rose slightly in 2004. In 2005 the waterway passenger and passenger-kilometers were 37.51 million and 1.23 billion person kilometers (see Appendix Ⅱ, Figure 1~2), accounting for 18.54% and 18.14% of the total figures for China respectively. 2.4.2 Port function in the GYDR In the GYDR, a hierarchy port system has been formed: Shanghai and Ningbo ports serve as the container trunk line ports and Lianyun’gang, Suzhou, Nanjing, Nantong, Zhenjiang, Wenzhou and other ports as the branch line ports with other ports as the feeding ports. In 2005, cargo handled through major ports of the Yangtze Delta Region accounted for about 40% of the total in China, with the cargo handled through Shanghai and Ningbo ports taking 13.11% and 7.94% respectively. The Shanghai Port has the leading role in the port system of the GYRD, accounting for 32.79% of the port freight in GYDR. The cargo handling capacity of Ningbo Port accounts for 19.85% and it is the second largest port in the GYDR. (See Appendix I, Table 1)
0
50 000
100 000
150 000
200 000
250 000
300 000
350 000
400 000
450 000
2001 2002 2003 2004 2005
Year
Fre
ight
by
wat
er
Shanghai Jiangsu Zhejiang
Frei
ght b
y w
ater
(Tho
usan
d to
ns)

Mobility for Development -Shanghai Case Study
26
2.5 Aviation 2.5.1 Airports in the YDR By 2005, the 16 cities of the YDR had 10 civilian airports, and there is one civilian airport per ten thousand square kilometers.
Figure 2.5.1: Airports in the YDR 2.5.2 Airport passengers in the YDR In 2005 there were 284.35 million passengers at 137 airports in China, among which 59.12 million flew through the 10 civilian airports of the YDR, representing 20.79% of the nation’s total. Five of the 10 airports in the YDR boarded over 1 million passengers per year. This compares with a total of 39 such airports in the entire country. Therefore, the YDR plays an important role in the nationwide air transportation system. (See Appendix I, Table 2)
Mobility for Development -Shanghai Case Study
27
The airports in the YDR can be classified as three categories: Classification Class I Class II Class III
National Hub Key Node Branch Line City Shanghai Hangzhou,
Nanjing, Ningbo
Wuxi, Zhoushan, Changzhou, Taizhou, Nantong
Table 2.5.1: Airports in the YDR 2.5.3 Air cargo and mail The annual cargo and mail of the 10 airports in YDR reached 2.57 million tons, equivalent to 40.63% of that of all the airports in mainland China. Six airports handle above ten thousand tons of cargo and mail in the region (see Appendix I, Table 3). The airport system of the YDR has the following two features:
1. The air cargo transport service of the YDR mainly focuses on Shanghai, especially Pudong International Airport.
2. The scheduled all-cargo flights from/to the Shanghai Airport account for a small proportion (5%) of the total flights, but the volume it transports reaches 35.01% of the total air cargo in China, and 86.2% of the air cargo in the YDR.
2.6 Conclusions Economic prosperity will undoubtedly strengthen the transport linkage among cities and regions in the GYDR. Although the transport facilities of the YDR are relatively well developed as a whole, the supply of transport infrastructure per capita is insufficient. The highway mileage per ten thousand people is only 20.8% of China’s average. Its railway mileage per ten thousand people is merely 0.16 kilometers, only one-third of the national average. Although the road length density of the YDR is higher than other areas in China, it is not sufficient compared with its economic scale and size of population. This area is very important for international air flight and sea transportation. The strong correlation between water freight and highway freight indicates that a further increase in import-export trade will bring more highway traffic, which will have considerable influence on the development of the YDR in the future. Regional economic development requires the integration of transport system over different modes and different administrative boundaries. With the annual growth of passengers in the YDR, intercity passenger transport has become

Mobility for Development -Shanghai Case Study
28
the competitive focus of various transport means, especially the medium and long distance intercity passenger. As far as passenger transport is concerned, the key lies in strengthening the construction of passenger transport hubs. The passenger transport hubs not only link up different internal modes of a certain transport means, but also link up passenger transport between cities and urban public transport within cities. In other words the authorities should regard developing a fast and convenient transfer system as the pre-condition for constructing passenger transport hubs. Further development of oceangoing container shipping relies crucially on the distribution system of inland waterways, highways and railways across provinces. As a result there is a need for a comprehensive transport plan to maintain and improve the efficiency and competitiveness of this region.
Mobility for Development -Shanghai Case Study
29
3. Regional transport in Shanghai This chapter focuses on the comprehensive transportation system in Shanghai region, including the area between Shanghai administrative boundary and outer-ring freeway. The transport network here includes highway, railway, waterway (particularly port) and aviation. First, the traffic distribution is discussed in the Shanghai region. Then transport infrastructure is described, and it concludes with the analysis of some key indexes of passenger transport and cargo transport.
3.1 Traffic distribution in the Shanghai region In the past the major economic activities were concentrated in the central city. However, since the 1990s industry has increasingly developed in suburban areas due to vast amounts of cheap land and good access to the regional highway, which has, to a large extent, changed the traffic flow pattern in the Shanghai region. Now the highway in the Shanghai region alone accommodates 591,000 motor-vehicle trips every day. There are several very congested sections with trucks moving along several corridors that connect to other parts of mainland China. Recently an investigation of highway traffic among the three areas (central city (within the outer ring), suburbs and area outside of Shanghai) has been conducted to define traffic distribution in the Shanghai region.21 This survey does not include the traffic inside the central city (Table 3.1.1 and Table 3.1.2).
Passenger traffic Central city Suburbs Outside of Shanghai Total
Central city — 163,364 22,714 205,297
Suburbs 173,436 342,033 28,694 544,163
Outside of Shanghai 23,146 30,913 — 54,059
Total 215,801 536,310 51,408 803,519
Freight traffic Central city Suburbs Outside of Shanghai Total
Central city — 88,470 27,412 131,900
Suburbs 90,755 249,292 52,883 392,930
Outside of Shanghai 24,209 52,436 — 76,645
Total 130,982 390,198 80,295 601,475
Total O-D Central city Suburbs Outside of Shanghai Total
Central city — 251,834 50,126 337,197
suburbs 264,191 591,325 81,577 937,093
Outside of Shanghai 47,355 83,349 — 130,704
Total 346,783 926,508 131,703 1,404,994
Table 3.1.1: Traffic Distribution among the city proper, suburbs and area outside of the City PCU/day (passenger car units per day)22 Source: Shanghai Highway Network Vehicle Travel OD Distribution and Traffic Characteristic Analysis Report 2004

Mobility for Development -Shanghai Case Study
30
Region Passenger vehicle Freight vehicle Total
Central city - suburbs 336,800 42.94% 179,225 30.61% 516,025 37.67%
Central city - outside of Shanghai 45,860 5.85% 51,621 8.82% 97,481 7.12%
Suburbs - outside of Shanghai 59,607 7.60% 105,319 17.99% 164,926 12.04%
Suburbs - suburbs 342,033 43.61% 249,292 42.58% 591,325 43.17%
Table 3.1.2: Travel between Various Regions and Their Percentages (Unit: PCU/day)
Figure 3.1.1: Highway vehicle travel linkage between various areas of Shanghai If the internal travel of the urban area is not taken into account, the traffic in the suburbs accounts for the major part, and the travel between suburbs accounts for the largest percentage (43.17%) of the total. However, the transport connection between the central city and suburbs is much better than that between the suburban areas, and this has caused much difficulty for travel in the suburbs.
3.2 Supply of facilities Shanghai is one of the most important land, sea and air transport hubs in China today.23 Through decades of construction, Shanghai has established a regional transport system, covering a wide range of transportation modes, such as railway, highway, waterway and aviation. Due to the transport policy to encourage the public transport in the central city, major road construction has mainly taken place in suburban areas, especially for the freeway system (toll road). The policy has not yet delivered success in reducing congestion or in decreasing the dense population in the city center.
Suburbs
Central city 43.17%
37.67%
12.04%
7.12%
Outside of Shanghai

Mobility for Development -Shanghai Case Study
31
3.2.1 Highways Shanghai now has basically built its freeway network and completed its urban outer-ring construction, thus forming its road system of “three rings and ten radial roads”. By the end of 2005, the total mileage of the highways24 (including village roads) of Shanghai had reached 8 110 kilometers, 2.66 times that in 1990. The state, provincial and county highways totaled 3,409 km, 162km more than that in 2004. The highway density reached about 123.1 kilometer per 100 square kilometers on average, forming a highway transportation network with the state highways, freeways and highways as trunk lines and the county and village highways as the branches. These roads not only link the countrywide highway network, but also stretch to the various towns and villages in the suburbs of Shanghai. Please refer to Table 3.2.1 and Figure 3.2.2 for the mileage change of the highways of Shanghai in the past years.
Year 1990 1991 1992 1993 1994 1995 1996 1997 Length 3,049 3,165, 3,625, 3,677, 3,721, 3,787, 3,881, 3,961,
Year 1998 1999 2000 2001 2002 2003 2004 2005 Length 4,104, 4,231, 5,970, 6,078, 6,286, 6,486, 7,805, 8,110
Table 3.2.1: Change in Shanghai highway mileage in the past years (Unit: kilometers)
2000
3000
4000
5000
6000
7000
8000
9000
1990
1991
1992
1993
1994
1995
1996
1997
1998
1999
2000
2001
2002
2003
2004
2005
Year
Km
Figure 3.2.2: Shanghai Highway Mileage Changes from 1990 to 2005 (Unit: kilometers)
Figure 3.2.1 Highway in Shanghai

Mobility for Development -Shanghai Case Study
32
Source: Shanghai Statistic Yearbook 1991-2006 Figure 3.2.2 shows that the highway mileage of Shanghai in the past decade increased with an annual average growth rate of 7.2%. In 1988, Shanghai built the first freeway in China---Shanghai-Jiading Freeway. In 2000, Shanghai-Nanjing and Shanghai-Hangzhou freeway were built. During the “tenth-five-year-plan” period, the freeway construction of Shanghai developed rapidly. By the end of 2004, Shanghai finished the construction of 10 freeways including the A20 outer-ring (Please see Appendix I, Table 4 for the traffic flows of the networks). While total highway mileage is increasing, the technical hierarchy structure of the highways of Shanghais has also been greatly improved. By the end of 2005, the city had a total of 3,057 kilometers of highway at or above second grate (highways designed for an average of 3,000-7,500 mid-sized trucks passing day and night), accounting for 37.7% of the total mileage of highways, of which the mileage of freeway has already reached 560 kilometers, accounting for 6.21% of the total highway mileage. Please refer to Figure 3.2.3-4 for the hierarchy structure of the highway network of Shanghai.
6.21% 4.24%
27.92%
32.56%
27.26%
1.81%
Freew ay First-grade highw ay Second-grade highw ay
Third-grade highw ay Fourth-grade highw ay Non-classif ied highw ay
Figure 3.2.3: The technical grade of highway in Shanghai (2004)
4.1%12.8%
57.7% 25.5%
State highw ay Provincial highw ay County highw ay Village highw ay

Mobility for Development -Shanghai Case Study
33
Figure 3.2.4: Administrative grade of highway in Shanghai (2004) 3.2.2 Railways As one of the ten largest railway hubs of China, Shanghai Railway plays an important role in the national railway networks. The railway transport of the Shanghai area undertakes 50% of intercity passengers in Shanghai and some 5% of cargo transport. It represents the backbone, especially for Shanghai intercity passenger transport. The railway of Shanghai includes two main lines linking other parts of mainland China: Shanghai-Nanjing Line and Shanghai-Hangzhou Line, 15 Shanghai hub branch lines and liaison lines and 79 special-purpose lines. The operated mileage of Shanghai reached 269 kilometers in 2005. During the 15 years from 1990 to 2003, overall railway mileage stagnated. However, in the last three years it saw an increase. Please refer to Figure 3.2.5 and Figure 3.2.6 and Table 3.2.2.
245
250
255
260
265
270
1990 1995 1999 2000 2001 2002 2003 2004 2005
KM
Railw ay Operated Mileage
Figure 3.2.5: Change of Shanghai Railway Mileage from 1990 to 2005 Source: Shanghai Statistic Yearbook 1991-2006

Mobility for Development -Shanghai Case Study
34
Figure 3.2.6: Railway networks in Shanghai
Year 1990 1991 1992 1993 1994 1995 1996 1997
Length 259 259 235 247 246 256 256 244
Year 1998 1999 2000 2001 2002 2003 2004 2005Length 248 260 257 257 257 257 264 269
Table 3.2.2: Operated Mileage Change of Shanghai Railway from 1990 to 1997 (Unit: kilometer)
There are three large passenger transport stations: Shanghai Station, Shanghai Southern and Western Station, and a total of 35 large or small stations, linking the ports and metros, which constitute the water/land and internal/external transport hub. 3.2.3 Water transport The water transport of Shanghai is composed of inland river, Yangtze River, coastal and ocean transport. The inland river shipping of Shanghai connects with that of Jiangsu, Zhejiang and Anhui Province. The water transport trunk way of the Yangtze River links eight provinces along the Yangtze River. By going out to the sea through the Yangtze River estuary, a boat may directly reach the various coastal provinces as well as the rest of the world. Ocean transportation plays a major role in the foreign trade of Shanghai. 98% of the foreign trade exported material of Shanghai Port, including bulk goods, oil and regular international container shipping line, is through ocean transportation.
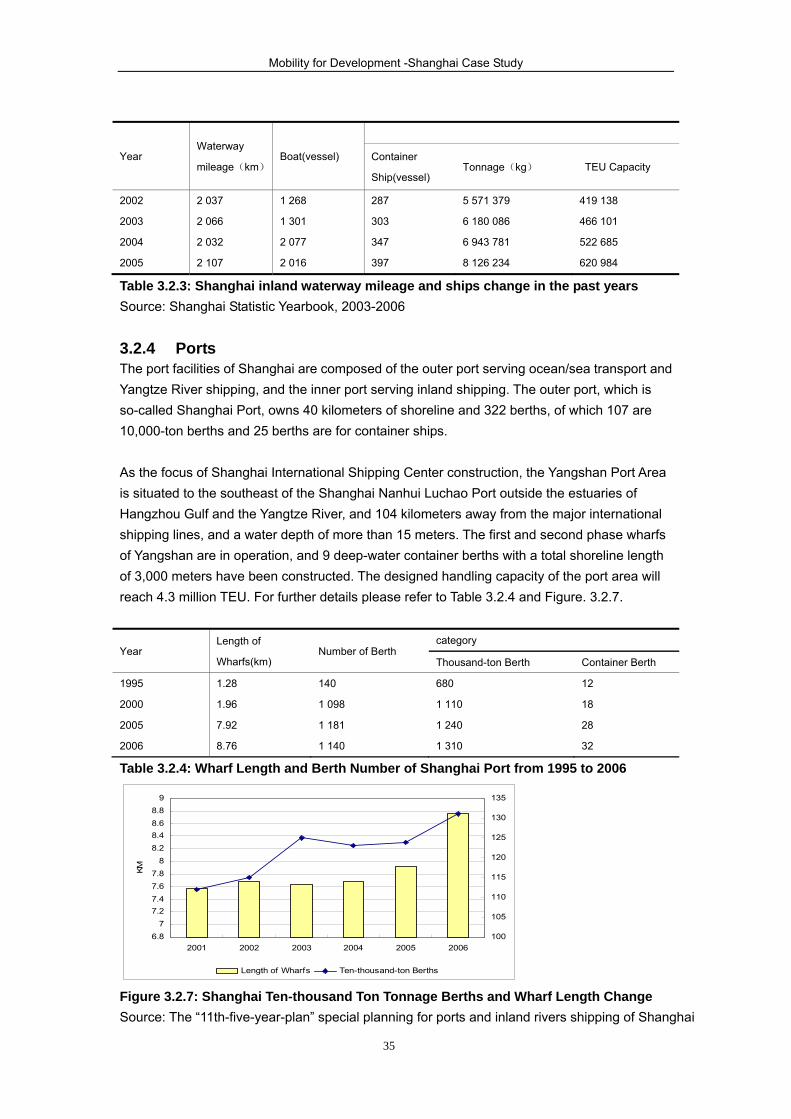
Mobility for Development -Shanghai Case Study
35
Year Waterway
mileage(km) Boat(vessel)
Container
Ship(vessel) Tonnage(kg) TEU Capacity
2002 2 037 1 268 287 5 571 379 419 138
2003 2 066 1 301 303 6 180 086 466 101
2004 2 032 2 077 347 6 943 781 522 685
2005 2 107 2 016 397 8 126 234 620 984
Table 3.2.3: Shanghai inland waterway mileage and ships change in the past years Source: Shanghai Statistic Yearbook, 2003-2006 3.2.4 Ports The port facilities of Shanghai are composed of the outer port serving ocean/sea transport and Yangtze River shipping, and the inner port serving inland shipping. The outer port, which is so-called Shanghai Port, owns 40 kilometers of shoreline and 322 berths, of which 107 are 10,000-ton berths and 25 berths are for container ships. As the focus of Shanghai International Shipping Center construction, the Yangshan Port Area is situated to the southeast of the Shanghai Nanhui Luchao Port outside the estuaries of Hangzhou Gulf and the Yangtze River, and 104 kilometers away from the major international shipping lines, and a water depth of more than 15 meters. The first and second phase wharfs of Yangshan are in operation, and 9 deep-water container berths with a total shoreline length of 3,000 meters have been constructed. The designed handling capacity of the port area will reach 4.3 million TEU. For further details please refer to Table 3.2.4 and Figure. 3.2.7.
Year Length of
Wharfs(km) Number of Berth
category
Thousand-ton Berth Container Berth
1995 1.28 140 680 12
2000 1.96 1 098 1 110 18
2005 7.92 1 181 1 240 28
2006 8.76 1 140 1 310 32
Table 3.2.4: Wharf Length and Berth Number of Shanghai Port from 1995 to 2006
6.87
7.27.47.67.8
88.28.48.68.8
9
2001 2002 2003 2004 2005 2006
KM
100
105
110
115
120
125
130
135
Length of Wharfs Ten-thousand-ton Berths
Figure 3.2.7: Shanghai Ten-thousand Ton Tonnage Berths and Wharf Length Change Source: The “11th-five-year-plan” special planning for ports and inland rivers shipping of Shanghai

Mobility for Development -Shanghai Case Study
36
3.2.5 Aviation By 2005, Shanghai had opened its air flight to 162 cities at home and abroad (of which 76 are domestic cities and 86 are international and regional cities), and 52 foreign and Chinese airlines (of which 11 are domestic airlines and 41 are foreign airlines) had opened their regular flights to Shanghai.
Region 2000 2001 2002 2003 2004
Domestic Cities 68 75 79 75 76
International Cities 53 70 62 69 86
Total 121 145 141 144 162
Table 3.2.5: Cities to which Shanghai has opened its air traffics Source: The “11th-five-year-plan” planning for air transport of Shanghai
Shanghai Airports include Hongqiao Airport and Pudong International Airport, and both airports can allow large passenger airplanes to take off and land. Pudong International Airport also owns an air cargo transport base, and may provide 24-hour service for all types of airplanes. Please refer to Figure 3.2.8
Situated in the western part of Shanghai, only 13 kilometers away from the CBD, Hongqiao Airport has one runway and one taxiway. The runway is 3,400 meters long and 57.6 meters wide, and the parking apron is about 486,000 square meters. After many international flights moved to the Pudong Airport, Hongqiao Airport has mainly functioned as an airport for domestic flights. However, it has also kept its function as an emergency landing area for international flights. Situated in the eastern of Shanghai, Pudong International Airport covers an area of 40 square kilometers, about 30 kilometers away from the CBD and 40 kilometers from Hongqiao Airport. It has a north-south runway
of 4,000 meters long and 60 meters wide, two parallel taxiways. At present, flights through Pudong Airport account for 60% or so of the total for all Shanghai airports.
Figure 3.2.8: Airports in Shanghai
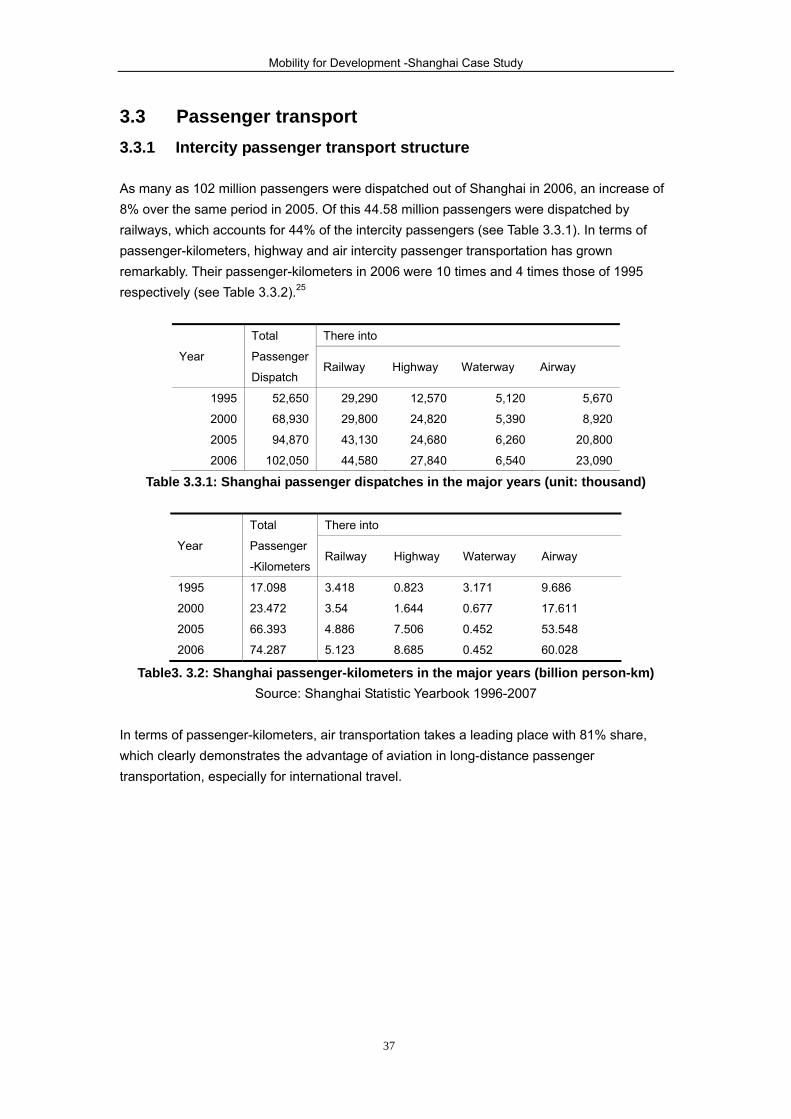
Mobility for Development -Shanghai Case Study
37
3.3 Passenger transport 3.3.1 Intercity passenger transport structure As many as 102 million passengers were dispatched out of Shanghai in 2006, an increase of 8% over the same period in 2005. Of this 44.58 million passengers were dispatched by railways, which accounts for 44% of the intercity passengers (see Table 3.3.1). In terms of passenger-kilometers, highway and air intercity passenger transportation has grown remarkably. Their passenger-kilometers in 2006 were 10 times and 4 times those of 1995 respectively (see Table 3.3.2).25
Year
Total
Passenger
Dispatch
There into
Railway Highway Waterway Airway
1995 52,650 29,290 12,570 5,120 5,670
2000 68,930 29,800 24,820 5,390 8,920
2005 94,870 43,130 24,680 6,260 20,800
2006 102,050 44,580 27,840 6,540 23,090
Table 3.3.1: Shanghai passenger dispatches in the major years (unit: thousand)
Year
Total
Passenger
-Kilometers
There into
Railway Highway Waterway Airway
1995 17.098 3.418 0.823 3.171 9.686
2000 23.472 3.54 1.644 0.677 17.611
2005 66.393 4.886 7.506 0.452 53.548
2006 74.287 5.123 8.685 0.452 60.028
Table3. 3.2: Shanghai passenger-kilometers in the major years (billion person-km) Source: Shanghai Statistic Yearbook 1996-2007
In terms of passenger-kilometers, air transportation takes a leading place with 81% share, which clearly demonstrates the advantage of aviation in long-distance passenger transportation, especially for international travel.

Mobility for Development -Shanghai Case Study
38
44%
7%
27%
12%
6%
1%
23%
81%0% 20% 40% 60% 80% 100%
passenger
passenger-kilometers
railw ay highw ay w aterw ay airw ay
Figure 3.3.1: Transportation Structure of Intercity Passenger of Shanghai (2006) The passenger haul distance has increased year by year. Meanwhile, air transport has the longest haul distance of more than 1,500 km and the figure is still rising. The haul distance of highways has increased significantly since 2000, and that of railways remains unchanged. It is worth noting that transport distance by water (not including ocean route) descends sharply, which means inland waterways have decreasing importance in passenger transportation in Shanghai. Please refer to Table 3.3.3, Figure 3.3.2.
Year Average mode
Railway Highway Waterway Airway
1995 325 117 65 619 1,708
2000 341 119 66 126 1,974
2005 700 113 304 72 2,574
2006 728 115 312 69 2,600
Table 3.3.3: Passenger haul distance by different transport modes (·km)
0
500
1000
1500
2000
2500
3000
1995 2000 2005 2006
km
Average Railw ay Highw ay Waterw ay Airw ay
Figure 3.3.2: Comparison of passenger haul distance among different transportation modes travelling to and from Shanghai
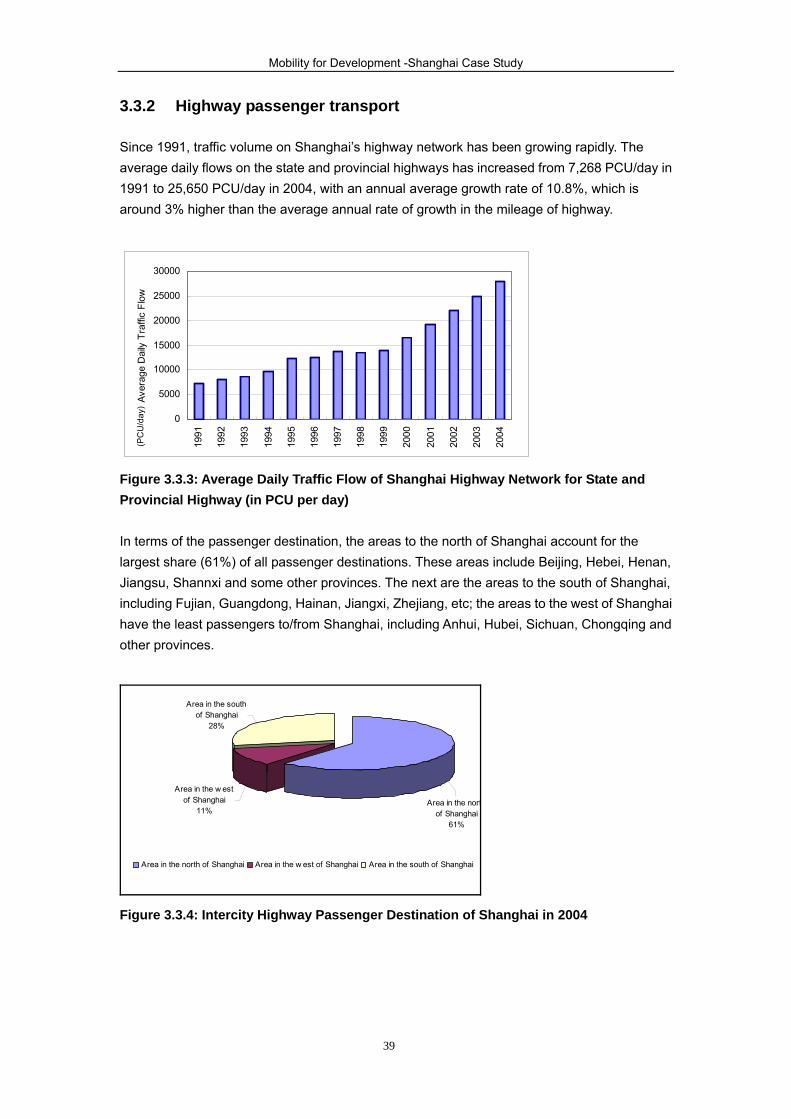
Mobility for Development -Shanghai Case Study
39
3.3.2 Highway passenger transport Since 1991, traffic volume on Shanghai’s highway network has been growing rapidly. The average daily flows on the state and provincial highways has increased from 7,268 PCU/day in 1991 to 25,650 PCU/day in 2004, with an annual average growth rate of 10.8%, which is around 3% higher than the average annual rate of growth in the mileage of highway.
Figure 3.3.3: Average Daily Traffic Flow of Shanghai Highway Network for State and Provincial Highway (in PCU per day) In terms of the passenger destination, the areas to the north of Shanghai account for the largest share (61%) of all passenger destinations. These areas include Beijing, Hebei, Henan, Jiangsu, Shannxi and some other provinces. The next are the areas to the south of Shanghai, including Fujian, Guangdong, Hainan, Jiangxi, Zhejiang, etc; the areas to the west of Shanghai have the least passengers to/from Shanghai, including Anhui, Hubei, Sichuan, Chongqing and other provinces.
Area in the southof Shanghai
28%
Area in the nortof Shanghai
61%
Area in the w estof Shanghai
11%
Area in the north of Shanghai Area in the w est of Shanghai Area in the south of Shanghai
Figure 3.3.4: Intercity Highway Passenger Destination of Shanghai in 2004
0
5000
10000
15000
20000
25000
30000
1991
1992
1993
1994
1995
1996
1997
1998
1999
2000
2001
2002
2003
2004
Aver
age
Dai
ly T
raffi
c Fl
ow(P
CU
/day
)
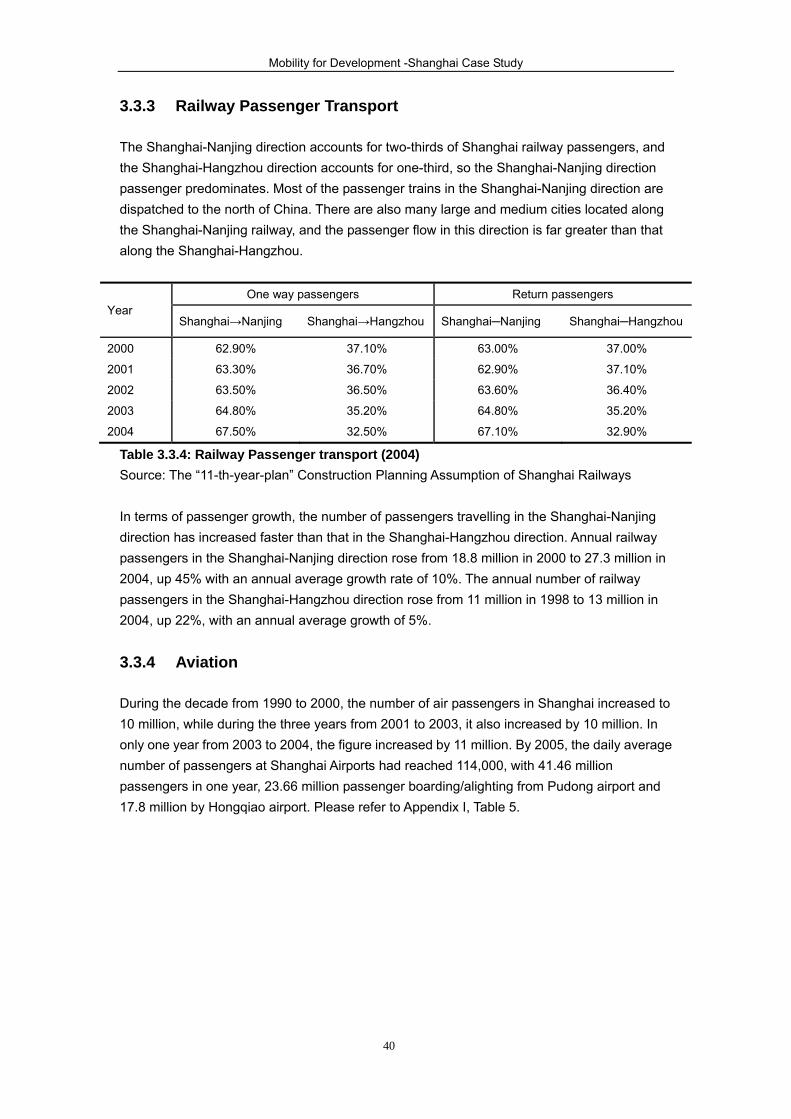
Mobility for Development -Shanghai Case Study
40
3.3.3 Railway Passenger Transport The Shanghai-Nanjing direction accounts for two-thirds of Shanghai railway passengers, and the Shanghai-Hangzhou direction accounts for one-third, so the Shanghai-Nanjing direction passenger predominates. Most of the passenger trains in the Shanghai-Nanjing direction are dispatched to the north of China. There are also many large and medium cities located along the Shanghai-Nanjing railway, and the passenger flow in this direction is far greater than that along the Shanghai-Hangzhou.
Year One way passengers Return passengers
Shanghai→Nanjing Shanghai→Hangzhou Shanghai─Nanjing Shanghai─Hangzhou
2000 62.90% 37.10% 63.00% 37.00%
2001 63.30% 36.70% 62.90% 37.10%
2002 63.50% 36.50% 63.60% 36.40%
2003 64.80% 35.20% 64.80% 35.20%
2004 67.50% 32.50% 67.10% 32.90%
Table 3.3.4: Railway Passenger transport (2004) Source: The “11-th-year-plan” Construction Planning Assumption of Shanghai Railways
In terms of passenger growth, the number of passengers travelling in the Shanghai-Nanjing direction has increased faster than that in the Shanghai-Hangzhou direction. Annual railway passengers in the Shanghai-Nanjing direction rose from 18.8 million in 2000 to 27.3 million in 2004, up 45% with an annual average growth rate of 10%. The annual number of railway passengers in the Shanghai-Hangzhou direction rose from 11 million in 1998 to 13 million in 2004, up 22%, with an annual average growth of 5%. 3.3.4 Aviation During the decade from 1990 to 2000, the number of air passengers in Shanghai increased to 10 million, while during the three years from 2001 to 2003, it also increased by 10 million. In only one year from 2003 to 2004, the figure increased by 11 million. By 2005, the daily average number of passengers at Shanghai Airports had reached 114,000, with 41.46 million passengers in one year, 23.66 million passenger boarding/alighting from Pudong airport and 17.8 million by Hongqiao airport. Please refer to Appendix I, Table 5.

Mobility for Development -Shanghai Case Study
41
3.4 Cargo transport 3.4.1 Cargo transport structure The total cargo tonnage for Shanghai in 2005 reached 713.04 million tons, up 63% over that of 1995. Its highway and air cargo has grown continuously, while the water and railway cargo dropped first and then rose. Please refer to Figure 3.4.1 and Table 3.4.1.
0
50000
100000
150000
200000
250000
300000
350000
400000
1995 1996 1997 1998 2000 2004 2005
thou
sand
ton
s
Railw ay Highw ay Waterw ay Airw ay
Figure 3.4.1: Cargo Transport by Various Transportation modes (unit: thousands of tons)
Year Total Composition
Railway Highway Waterway Airway
1995 436 210 41 660 245 730 148 450 370
1996 458 210 62 130 250 230 145 440 410
1997 459 380 58 170 259 910 140 820 480
1998 462 300 52 920 263 520 145 290 570
2000 501 620 32 630 283 690 184 420 880
2004 657 890 38 620 315 540 301 480 2 250
2005 713 040 38 410 326 840 345 570 2 220
Table 3.4.1: Cargo Transport by Various Transport Modes in the Shanghai Region (unit: thousands of tons) Source: Shanghai Statistic Yearbook 1996-2006 In terms of transportation mode structure, the proportion of cargo moved by water rose dramatically, up from 34% in 1995 to 48.5% of total cargo in 2005. Although highway cargo also rose dramatically, its corresponding proportion of total cargo transport dropped slightly. In the meantime, the share of railway transport decreased and the proportion of air transport grew slowly, but the amount of air cargo grew very fast.

Mobility for Development -Shanghai Case Study
42
9.6%5.4%
56.3%
45.8%
34.0%
48.5%
0.1%0.3%
0% 20% 40% 60% 80% 100%
1995
2005
railw ay highw ay w aterw ay airw ay
Figure 3.4.2: Cargo transport structure in the Shanghai area 3.4.2 Highway cargo transport Highway cargo transportation (including ton-kilometers) has been growing. The total amount of highway cargo in Shanghai reached 315.54 million tons in 2004, and its cargo transport turnover reached 7,083.79 million ton kilometers, up 28.4% and 45.6% compared with the figures of 1995 respectively. The corresponding average haul distance also rose greatly, and in 2004 it was 1.5 times that of 1995, indicating that the proportion of medium- and long-distance transport by highway is increasing, but the distance is still short.
Year Total cargo tonnage
(million ton)
Ton-kilometers
(million ton km)
Average distance
(km)
1995 245.73 4,864.14 14.2
2000 283.69 5,637.38 18.8
2003 306.78 6,878.98 20.9
2004 315.54 7,083.79 21.8
Table 3.4.2: Ton-kilometers and transport distance of Shanghai in the past years Source: Shanghai Statistic Yearbook 1996~2005 The major goods carried by truck are light industrial products, foods, industrial products and building materials, etc., of which light industrial products and foods account for the highest percentage at 28.1% and minerals account for the lowest percentage to 2.7%. Please refer to Appendix II, Figure 3. 3.4.3 Water transport As shown in Table 3.4.3, since 2000, Shanghai port’s cargo throughput has been growing quickly. It reached 537 million tons in 2006, up 21.3% over the last year. Shanghai’s port has surpassed Singapore’s port to become the largest cargo port in the world; its container processed 21.71 million TEU, accounting for about 24% of all the large ports nationwide, ranking third place worldwide only next to Hong Kong and Singapore for container handling. Please refer to Appendix I, Tables 6-7. Compared to the figures of 1995, the total cargo and containers handled through Shanghai have grown 3.2 times and 14 times respectively.

Mobility for Development -Shanghai Case Study
43
Year
Freight throughput Freight throughput There into Foreign-trade
goods
(thousand
ton)
There into
(thousand TEU) (thousand ton) Import export import export
1995 1 526 165 670 120 970 44 700 40 860 26 050 14 810
2000 5 612 204 400 137 910 66 490 76 330 45 490 30 840
2005 18 084 443 170 275 390 167 780 184 920 100 980 83 940
2006 21 710 537 480 345 980 191 510
Table 3.4.3: Cargo throughput of Shanghai’s port 3.4.4 Railway cargo transport Because of various historical reasons, railway cargo transport shrank prior to 2000. Since 2000 the tonnage of railway freight has shown growth. By 2004 Shanghai’s total railway cargo had reached 38.62 million tons. In contrast, railway container cargo has been rising steadily since 1995 and reached 3.65 million TEU in 2004, 2.3 times the figure of 1995. Please refer to Figure 3.4.3and Table 3.4.4
15000
20000
25000
30000
35000
40000
45000
1995 1996 1997 1998 1999 2000 2001 2002 2003 2004
thou
sand
ton
1500
2000
2500
3000
3500
4000
thou
sand
TEU
Total freight(Thousand ton) Container(Thousand TEU)
Figure 3.4.3: Shanghai railway cargo transport growth
Year Total freight (thousands of tons) Container(Thousand TEU)
imports exports imports exports
1995 13,760 27,896 833 733
2000 10,548 22,077 1,202 1,246
2003 12,083 24,188 1,267 1,867
2004 12,844 25,776 1,392 2,261
Table 3.4.4: Railway freight transport growth

Mobility for Development -Shanghai Case Study
44
Comment from stakeholder dialogue: In Shanghai it was pointed out that the highway authority is often in conflict with the planning authority. It was also pointed out that municipal developments are limited to the outer ring road. Beyond that, development is regulated at the district and town level. Here there is an incentive to sell as much land as possible to generate fiscal revenue; hence there is little incentive to go for high-rise buildings and dense forms of land use, and industrial buildings tend to be single story. This is not conducive to public transport that requires relatively dense populations to make it efficient and accessible to many people.
3.4.5 Air cargo transport As many as 900 airplanes took off from and land at Shanghai’s airports each day in 2005 (of which 488 were in Pudong Airport and 412 in Hongqiao Airport). Compared to 1995, Shanghai’s airport cargo increased more than 5 times. With the eastern transfer of flights from Hongqiao to Pudong, the cargo and mail handling proportion of Pudong International Airport climbed year after year, from 30% in 2000 to 85% in 2004.
Year Throughput of cargo and post
(thousands of tons)
1995 366
2000 879
2003 1 615
2004 2 250
Table3.4.5: Shanghai airports cargo transport growth Source: the 11th five-year-plan of Shanghai Air Transport
In 2002 as many as 211,958 tons of air cargo and mail were transported out of Shanghai, of which the amount of transport to Beijing accounted for the largest proportion, reaching 26%. As many as 402,211 tons of cargo and mail were transported out of Shanghai airports through international flights, of which Asian countries accounted for the largest proportion, reaching 23%.
3.5 Conclusions Shanghai’s transport network infrastructure has been greatly improved in recent years. In terms of highways and railways, the combination of construction of intercity freeways and railways in the YRD as well as the increases in train speeds six-fold, has greatly strengthened the relation between Shanghai and neighboring areas. The opening of new train services, such as post parcel transport, regular freight trains and double-deck container trains, has expanded the economic influence of Shanghai to the hinterland area. In terms of water transport, the development of Shanghai’s ports and inland waterways is in full swing. Its total port handling capacity is increasing rapidly, its cargo transport structure is optimized continuously, and the percentage of its foreign trade and container cargo transport are rising. As a result Shanghai has been become a new international shipping center.

Mobility for Development -Shanghai Case Study
45
Shanghai’s air transport capacity is also growing swiftly and its airports have joined the list of the world’s busiest airports. While the comprehensive transport system of Shanghai has made great strides, it still has the following problems: • The present highways are not synthetically related to Shanghai’s urban development and
are not suitable for the town system as determined by the new round master plan of Shanghai.
• Shanghai has only two external railways: Shanghai-Nanjing and Shanghai-Hangzhou railways; their capacity cannot meet personal travel requirements occurring in peak times such as festivals and holidays; their cargo transport facilities cannot meet the new cargo transport demand.
• Shanghai’s container wharfs continue to be operated under an excessively heavy load, and the container sea-railway combined transport capacity has developed slowly;
• The number of deep-water berths cannot meet the developing tendency of large and specialized ships;
• Shanghai’s inland river-ways are constructed at a slow speed, and the port distribution system is not perfect, especially the distribution system of the Yangshan deepwater port area which needs to be improved.
• The infrastructures and hubs such as the Shanghai airport runways, the construction of terminal buildings and cargo terminals have not been delivered to the expected standards;
• The construction of the comprehensive connecting ground transport facilities for the airports still need to accelerate.

Mobility for Development -Shanghai Case Study
46
4. Shanghai urban transport This chapter focuses on the transport systems in Shanghai’s city center (mainly within the outer-ring) with a detailed analysis of its demand and supply. Firstly, the situation of Shanghai's traffic demand, including the travel characteristics of both residents and motorized vehicles, is described; then the city's transport supply system, including the city’s road system, public transport system and non-motorized transport system are analyzed. Finally, some typical transport demand management policies are discussed to achieve the balance of supply and demand in Shanghai.
4.1 Features of travel demand According to the Third Transport Survey Report of Shanghai (2004), transport demand within central city in Shanghai has been increasing dramatically. The features of both resident travel and motorized vehicle travel prove that the increasing trend of transport demand is irresistible. The total number of daily trips by residents and number of daily trips made using motorized vehicles rose 45% and 220% respectively from 1995 to 2005.
45%
220%
0%
50%
100%
150%
200%
250%
Resident travel Motorized vehicle travel
Resident travel Motorized vehicle travel
Figure 4.1.1: Growth rate of total trips by residents and motorized vehicles

Mobility for Development -Shanghai Case Study
47
4.1.1 Features of personal travel Trip rate In 2004 the number of daily personal trips of Shanghai was about 41 million, up 45% over the figure of 1995, of which the number of trips by the permanent population was nearly 38 million, and those by the floating population nearly 3 million per day.
28300
41000
0
10000
20000
30000
40000
50000
thou
sand
/day
1995 2004
Figure 4.1.2: Total person trips Commuter trips have been increasing with the increase of population. The daily average figure was 23 million, up 20% over the figure of 1995. However, the non-commuting trips have been increasing faster with the increase of economic activities; the average daily figure reached 18 million person times, up 100% over the figure of 1995. The current public transport system has difficulty meeting the demand of growing non-commuting travel.
19200
23000
9100
18000
0
10000
20000
30000
thou
sand
/day
commuting trips other trips
1995 2004
Figure 4.1.3: Total trips of the commuting and others In 2004 the daily trips of the permanent population in the city center of Shanghai (inside inner ring) was 13.60 million, up 25% over the figure of 1995. With a large section of the population moving out of the city center because of the high price of houses and urban expansion, the number of daily trips of the permanent population in the outside area (between the inner ring and outer ring) grew faster, up 70% over the figure of 1995, reaching 13.20 million. In the same time period its share of all trips rose from 27% to 32%. In the suburbs the permanent
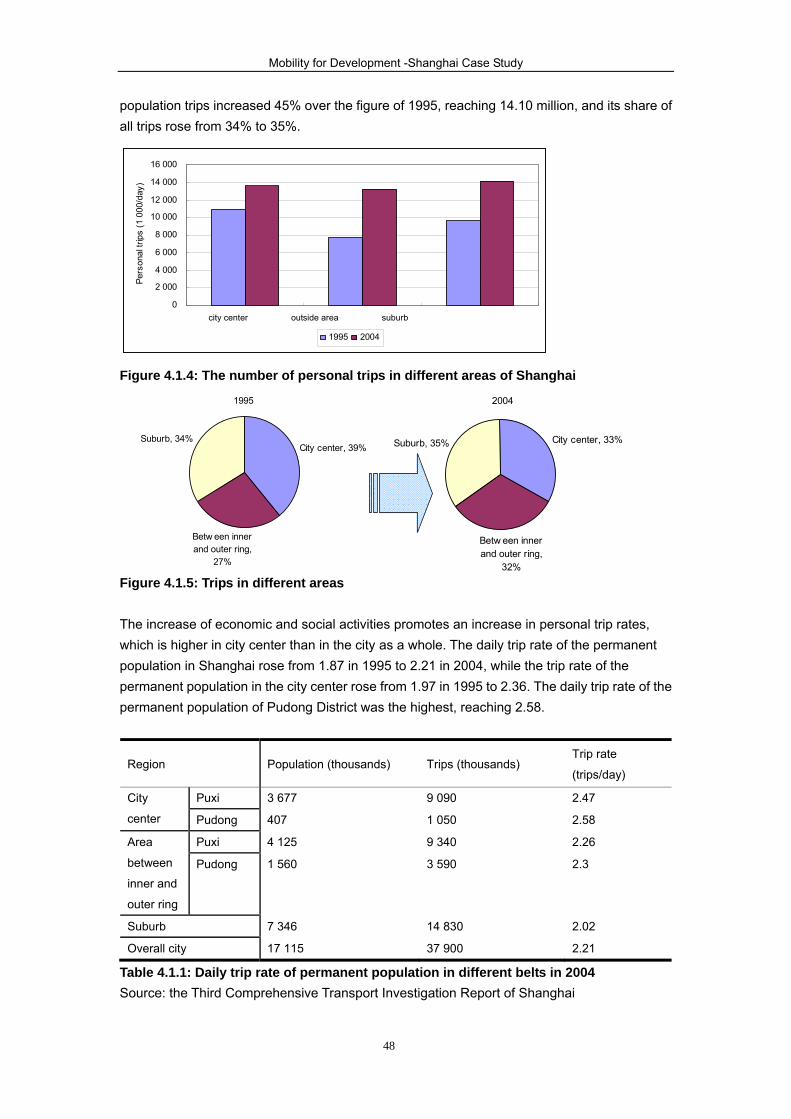
Mobility for Development -Shanghai Case Study
48
population trips increased 45% over the figure of 1995, reaching 14.10 million, and its share of all trips rose from 34% to 35%.
Figure 4.1.4: The number of personal trips in different areas of Shanghai
1995
City center, 39%
Betw een innerand outer ring,
27%
Suburb, 34%
2004
City center, 33%
Betw een innerand outer ring,
32%
Suburb, 35%
Figure 4.1.5: Trips in different areas The increase of economic and social activities promotes an increase in personal trip rates, which is higher in city center than in the city as a whole. The daily trip rate of the permanent population in Shanghai rose from 1.87 in 1995 to 2.21 in 2004, while the trip rate of the permanent population in the city center rose from 1.97 in 1995 to 2.36. The daily trip rate of the permanent population of Pudong District was the highest, reaching 2.58.
Region Population (thousands) Trips (thousands) Trip rate
(trips/day)
City
center
Puxi 3 677 9 090 2.47
Pudong 407 1 050 2.58
Area
between
inner and
outer ring
Puxi 4 125 9 340 2.26
Pudong 1 560 3 590 2.3
Suburb 7 346 14 830 2.02
Overall city 17 115 37 900 2.21
Table 4.1.1: Daily trip rate of permanent population in different belts in 2004 Source: the Third Comprehensive Transport Investigation Report of Shanghai
0
2 000
4 000
6 000
8 000
10 000
12 000
14 000
16 000
central area outside area surburb
Per
sona
l trip
s (1
000
/day
)
1995 2004
city center outside area suburb
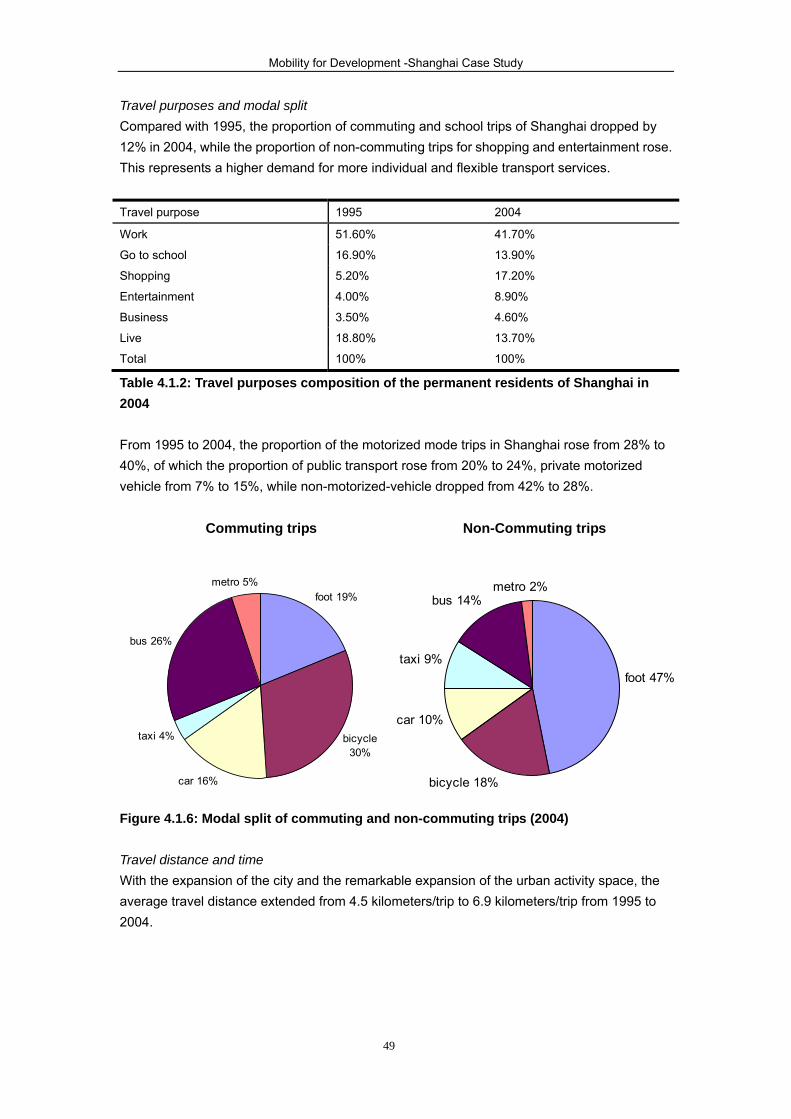
Mobility for Development -Shanghai Case Study
49
Travel purposes and modal split Compared with 1995, the proportion of commuting and school trips of Shanghai dropped by 12% in 2004, while the proportion of non-commuting trips for shopping and entertainment rose. This represents a higher demand for more individual and flexible transport services.
Travel purpose 1995 2004
Work 51.60% 41.70%
Go to school 16.90% 13.90%
Shopping 5.20% 17.20%
Entertainment 4.00% 8.90%
Business 3.50% 4.60%
Live 18.80% 13.70%
Total 100% 100%
Table 4.1.2: Travel purposes composition of the permanent residents of Shanghai in 2004 From 1995 to 2004, the proportion of the motorized mode trips in Shanghai rose from 28% to 40%, of which the proportion of public transport rose from 20% to 24%, private motorized vehicle from 7% to 15%, while non-motorized-vehicle dropped from 42% to 28%. Commuting trips Non-Commuting trips
foot 19%
bicycle30%
car 16%
taxi 4%
bus 26%
metro 5%
foot 47%
bicycle 18%
car 10%
taxi 9%
bus 14%metro 2%
Figure 4.1.6: Modal split of commuting and non-commuting trips (2004) Travel distance and time With the expansion of the city and the remarkable expansion of the urban activity space, the average travel distance extended from 4.5 kilometers/trip to 6.9 kilometers/trip from 1995 to 2004.

Mobility for Development -Shanghai Case Study
50
4.5
6.9
0
1
2
3
4
5
6
7tra
vel d
ista
nce(
km/tr
ip)
1995 2004
1995 2004
Figure 4.1.7: Increase of commuting distance Among different trip modes, travel by metro takes the longest time, reaching 70 minutes, which indicates that the metro plays an increasingly important role in long distance travel; the average travel time by bus was also nearly one hour per trip, and most of other modes will take less than half an hour. For different trip purposes, the average travel time was nearly equal, at around 30 minutes +/- 10 minutes.
Trip mode Bus Metro Car Taxi Bicycle E-bike/Gas-moped Motorcycle Foot
Average
time 56 70.1 40.9 32.3 21.7 24.1 20.5 16.8
Trip purpose Work School Shopping Leisure Business Life Home
Average
time 33.5 31 20.4 21.1 42.1 29.3 29.9
Table: 4.1.3: Travel time of different modes and purposes in Shanghai (min.) Source: the third comprehensive transport survey report of Shanghai Spatial distribution of personal travel From 1995 to 2004, the construction of cross-river facilities stimulated the growth of cross-river travel demand, and daily trips crossing the river increased from 1.1 million to 1.8 million, up 73%. In the process of relocating people from the center to the periphery, the transport linkage between the different areas was still quite strong. Between 1995 and 2004 the number of daily trips entering and leaving the central area grew from 5.1 million to 7.2 million, up 54%. In the same period the number of daily average trips entering and leaving city center grew by 175%, up from 1.2 million to 3.1 million.

Mobility for Development -Shanghai Case Study
51
0
1000
2000
3000
4000
5000
6000
7000
8000
thou
sand
trip
s
Cross-river Trip Enter and leavecentral area
Enter and leavedow ntow n
1995 2004
Figure 4.1.8: Growth of trips in different belts Figure 4.1.9 shows that Shanghai’s traffic volume is still concentrated in the central urban area, of which the flows between Pudong New District, Huangpu District, Xuhui District, Changning District and Yangpu District are the largest.
Figure 4.1.9: Travel flows in Shanghai Source: Third Comprehensive Transport Survey Report of Shanghai
Above: Travel flows in the central city (2004) Left: Travel flows in the whole city
Jiading district Baoshan district
Qinpu district
Songjiang district
Jinshan district
Fenxian district
Minhang district
Pudong new district
Nanhui district
Hongkou Zhabei Yangpu
Putuo
Changning
Xuhui
Luwan Huangpu
Jinan
Pudong new district
Putuo
Jin an
Lu wan Changning
Huangpu
Yangpu
ZhabeiHongkou

Mobility for Development -Shanghai Case Study
52
4.1.2 Personal motorized vehicle travel Motorization and trips In 2004 the daily average number of Shanghai’s surface motorized vehicle trips of was 7.14 million, among which the number of auto trips was five million, up 220% over that of 1995, and the motorcycle made 2.14 million trips per day. The number of auto trips in the city center was the largest, reaching 1.95 million.
1500
5000
0
1000
2000
3000
4000
5000
6000
thou
sand
/day
1995 2004
1995 2004
Figure 4.1.10: Growth of personalized motorized vehicle travel in Shanghai
1950 1900
1150
0
500
1000
1500
2000
ten
thou
sand
/day
City center Betw een inner andouter ring
Suburb
City center Betw een inner and outer ring Suburb
Figure 4.1.11: Motorized vehicle travel in different regions in 2004 Features of passenger vehicle travel Compared with 1995, the fleet size of passenger vehicles in Shanghai increased threefold to 2004 and the trips and daily mileage per vehicle also grew, but the mileage utilization rate and the passenger occupancy rate dropped.
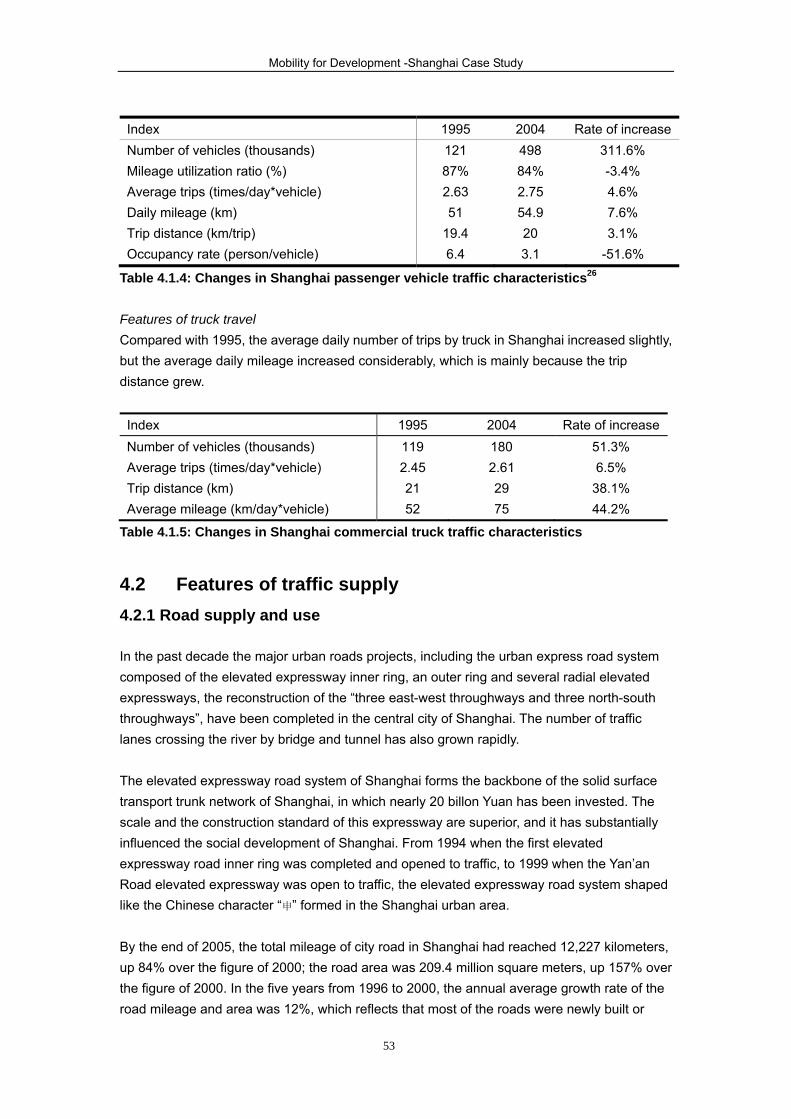
Mobility for Development -Shanghai Case Study
53
Index 1995 2004 Rate of increase Number of vehicles (thousands) 121 498 311.6% Mileage utilization ratio (%) 87% 84% -3.4% Average trips (times/day*vehicle) 2.63 2.75 4.6% Daily mileage (km) 51 54.9 7.6% Trip distance (km/trip) 19.4 20 3.1% Occupancy rate (person/vehicle) 6.4 3.1 -51.6%
Table 4.1.4: Changes in Shanghai passenger vehicle traffic characteristics26 Features of truck travel Compared with 1995, the average daily number of trips by truck in Shanghai increased slightly, but the average daily mileage increased considerably, which is mainly because the trip distance grew.
Index 1995 2004 Rate of increase Number of vehicles (thousands) 119 180 51.3% Average trips (times/day*vehicle) 2.45 2.61 6.5% Trip distance (km) 21 29 38.1% Average mileage (km/day*vehicle) 52 75 44.2%
Table 4.1.5: Changes in Shanghai commercial truck traffic characteristics
4.2 Features of traffic supply 4.2.1 Road supply and use In the past decade the major urban roads projects, including the urban express road system composed of the elevated expressway inner ring, an outer ring and several radial elevated expressways, the reconstruction of the “three east-west throughways and three north-south throughways”, have been completed in the central city of Shanghai. The number of traffic lanes crossing the river by bridge and tunnel has also grown rapidly. The elevated expressway road system of Shanghai forms the backbone of the solid surface transport trunk network of Shanghai, in which nearly 20 billon Yuan has been invested. The scale and the construction standard of this expressway are superior, and it has substantially influenced the social development of Shanghai. From 1994 when the first elevated expressway road inner ring was completed and opened to traffic, to 1999 when the Yan’an Road elevated expressway was open to traffic, the elevated expressway road system shaped like the Chinese character “申” formed in the Shanghai urban area. By the end of 2005, the total mileage of city road in Shanghai had reached 12,227 kilometers, up 84% over the figure of 2000; the road area was 209.4 million square meters, up 157% over the figure of 2000. In the five years from 1996 to 2000, the annual average growth rate of the road mileage and area was 12%, which reflects that most of the roads were newly built or
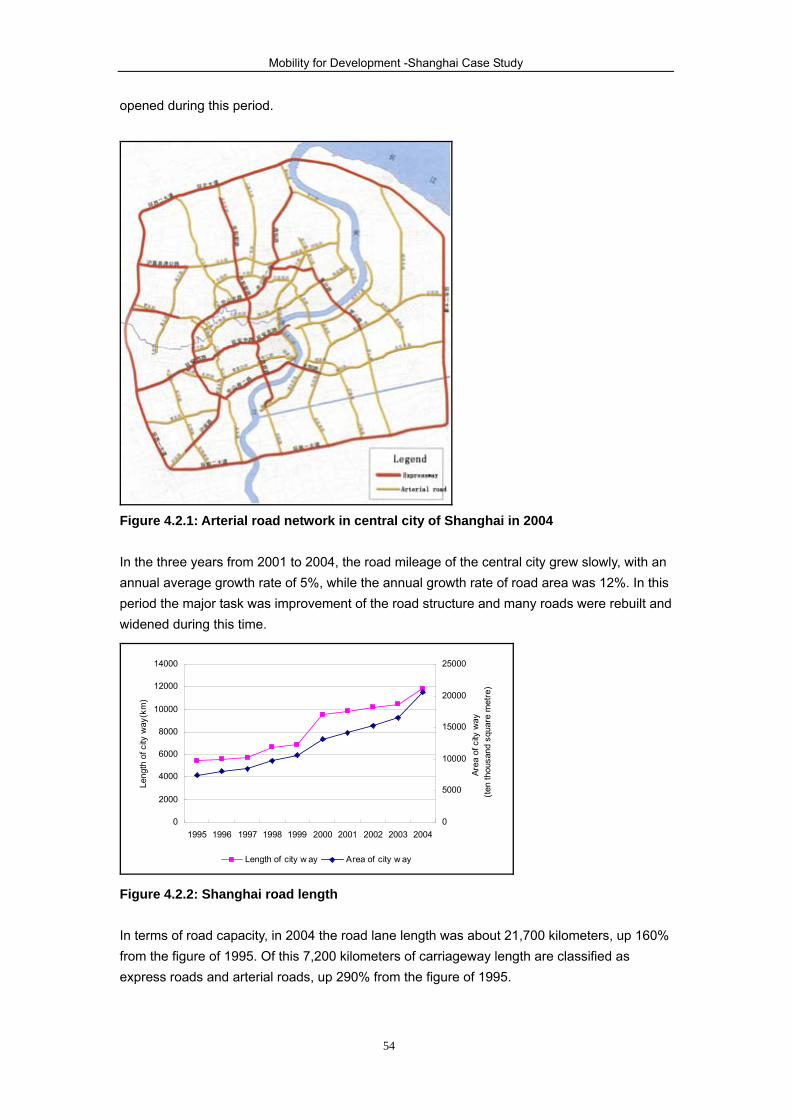
Mobility for Development -Shanghai Case Study
54
opened during this period.
Figure 4.2.1: Arterial road network in central city of Shanghai in 2004 In the three years from 2001 to 2004, the road mileage of the central city grew slowly, with an annual average growth rate of 5%, while the annual growth rate of road area was 12%. In this period the major task was improvement of the road structure and many roads were rebuilt and widened during this time.
0
2000
4000
6000
8000
10000
12000
14000
1995 1996 1997 1998 1999 2000 2001 2002 2003 2004
Leng
th o
f city
way
(km
)
0
5000
10000
15000
20000
25000
Area
of c
ity w
ay (t
en th
ousa
nd s
quar
e m
etre
)
Length of city w ay Area of city w ay
Figure 4.2.2: Shanghai road length In terms of road capacity, in 2004 the road lane length was about 21,700 kilometers, up 160% from the figure of 1995. Of this 7,200 kilometers of carriageway length are classified as express roads and arterial roads, up 290% from the figure of 1995.

Mobility for Development -Shanghai Case Study
55
Region Expressway Arterial
Road
Secondary trunk
Road
Branch Road Total
Central
zone
Puxi27 255 599 325 823 2002
Pudong28 21 169 132 228 550
Peripheral
zone
Puxi 607 767 489 1,402 3,266
Pudong 416 391 356 957 2,120
Suburb 1,072 2,899 2,267 7,544 13,782
Overall city 2,372 4,825 3,569 10,954 21,720
Table 4.2.1: Road lane growth in different areas in Shanghai (kilometers of carriageway length, 2004) Source: Shanghai Statistic Yearbook 4.2.2 Public transport supply and use Due to the long delay in infrastructure construction and the high population density in city center, the city planners have adopted the strategy of constraining the use of cars. The fast growth of motorization in Shanghai and other areas of China, as well as the car industry promotion policy, require large amounts of road space. The extensive construction in urban roads lessened traffic congestion for short periods after the completion of the major roads. Soon after, however, the roads were crowded with more traffic in the central city, and travel congestion resulted during rush hour. More recently the government recognized that public transport systems (especially metro systems) may be the solution, and a large scale metro construction is now ongoing. Road-based public transport system The Shanghai road-based public transport system is composed of bus and para-transit. There are 43 public transport operating companies.29 By the end of 2005, there were 18,000 buses with 1,180 thousand seats, 948 bus/trolley lines with a total length of 22,000 km in Shanghai. The local buses serve 7.48 million passengers daily. Shanghai has constructed 5 bus-only lanes with a total length of 21.6 km. But the actual effect is questionable because of weak enforcement. By 2010, there is forecast to be 110 km of bus-only ways inside the inner ring, in order to improve the bus service and meet the travel demands of 2010 World Expo. A BRT system is being planned for about 300 km and the first phase will be the semi-circular road connecting Shanghai West and South Station. The public transport lines in the suburban areas will share policy with urban bus lines. As previously, a bus priority policy is only applied to urban bus lines. A subsidy policy for public transport systems was brought into effect due to rising fuel prices in 2004. The specific measure is that if the diesel oil price exceeds 3 Yuan/liter more than the normal price, the additional cost will be shared by the bus companies and government equally by reducing the company business tax.

Mobility for Development -Shanghai Case Study
56
The bus fare system is based on a “zonal+distance” structure. In the central area the fare of bus transport is 2 Yuans with air-conditioning, 1 Yuan without. In the suburbs the fare increases with travel distance and includes an initial base charge of 1 Yuan and a distance charge of 0.2-0.25 Yuan per kilometer. The bus fare is collected through a fare box or transit IC cards which can also be used in the metro, taxis and ferries. The fare is free for elderly people over 70 years old. There are also preferential ticket fares for passenger transfer between buses as well as metro (see the detailed policy in Chapter 6). The para-transit system in Shanghai mainly refers to taxi. There are 45,000 taxis registered with carrying capacity of 2.96 million passengers every day. Average trip distance is 6.1 km; a taxi will drive 348 km/day on average. Since 11 May 2006, the base of taxi fare has been increased from 10 Yuan to 11 Yuan for the first 3 km and the distance charge of 2 Yuan/km has been adjusted to 2.1 Yuan/km, due to the rise of petrol price. Metro system There are currently 5 metro lines in Shanghai with 68 stations and a total operating length of 147.9 km. The number of passengers serviced by the Shanghai metro system increased sharply from 2000 to 2005, with an annual increase of nearly 37%. The total passengers per day rose to 1.63 million at the end of 2005. As a result, the Metro is always serious crowded especially on Line #1 and Line #3.
Figure 4.2.3: Metro lines in Shanghai
Line 1
Line 2
Line 3
Line 4
Line 5
Line #1, length 32.4 km, opened to traffic in 1995 Line #2, length 25.2 km, opened to traffic in 2000 Line #3, length 40.3 km, opened to traffic in 2000 Line #4, length 33 km, opened to traffic in 2005 Line #5, length 17 km, opened to traffic in 2003 The total length is 147.9 km Line #3 and Line #4 share the same 11-km track
Mobility for Development -Shanghai Case Study
57
The metro fare structure is distance-based, and the basic fare is 3 Yuan within a distance of 6 km, then the fare increases 1 Yuan per 10 km. Passengers can either purchase a single ticket or use transit IC card. With the extension of the city, more and more passengers must transfer to reach their destinations. Since 25 December 2005, a fare discount policy for exchanges between the public transport lines has been implemented. 4.2.3 Non-motorized transportation system Another characteristic of urban transport in Shanghai is walking and cycling, which account for 23.45 million trips daily. This is largely due to the contribution of land-use control with a dense and highly mixed use, coupled with the availability of infrastructure provided for non-motorized travel. The non-motorized travel has contributed to the alleviation of traffic congestion. The non-motorized network system, however, is always under the threat to be replaced by motorized vehicles, with the unexpected increase in motorized travel. According to the Third Transport Survey Report of Shanghai (2004), transport demand within the central city in Shanghai has been increasing, with the motorized travel increasing more. The share of non-motorized trips is as high as 57.2 % (bicycle and foot). Compared with other cities in the world, Shanghai has a relatively developed non-motorized transport system including pedestrian and non-motorized cycle system. In 2004, the total number of registered two-wheelers is 10.44 million, of which there are 9.37 million pedal bicycles, 0.84 million electric bicycles and 0.23 million LPG scooters. The daily trips by two-wheelers reached 12.9 million, in which there are 10.7 million pedal bicycle trips, a decrease of 3% compared to 2003, and 2.2 million trips made by electric bicycle and LPG powered scooter, an increase by 1.4 times.
4.3 Transport demand management policy Although the construction of the Shanghai urban transport infrastructure has achieved great success, there is an imbalance between transport demand and supply that causes many adverse problems, such as traffic congestion, traffic accidents and so on. To solve the above problems, the Shanghai government has instigated many transport demand management policies and measures to relieve the situation to a certain degree. Among these, the policies for public transport privilege, license plate auctioning, parking charging and motorcycle limitation have so far been the most successful.
Comment from the stakeholder dialogue: New York and London were cited as cities where long-distance commuter public transport was possible because of how the city and commuting patterns have developed over time. In other cities where extensive suburbs have dominated city growth, public transport has failed to serve the needs adequately as these populations tend to be spread out over very large areas.

Mobility for Development -Shanghai Case Study
58
4.3.1 Public transport priority policy According to the public interest priority and the highest efficiency principle, Shanghai carries out the “public transport first” policy30 where land use for public transport shall be ensured first, public transport spending shall be invested first, public transport shall be operated efficiently, and the transfer convenience of public transport shall also be ensured. Shanghai should continuously increase the public transport modal share. The aim of the transport model is “taking the public transport as the main mode and private car as the assistant mode”. The three-year Action Plan of Developing Public Transport Priority from 2007 to 2009 of Shanghai, which was compiled as required by the strategic objective of “public transport first”, has been formally put into operation. Shanghai will invest about 110 billion Yuan in pushing forward this action plan. According to this plan, by 2010, Shanghai will realize the full coverage of 500-meter service radius of public transport stops in the central city and suburban towns, and the public transport travel between any two points in the central city will be completed within one hour. More bus services will be provided in suburban areas. By that time, the public transport trips will account for more than 60% of the motorized vehicle passenger trip, and for more than 33% of the total trips. 4.3.2 The license plate auctioning policy Since 1994, in order to control the fast growth of motorized vehicles in Shanghai and reduce the pressure on urban traffic, the license tags of private cars in Shanghai have been auctioned by tender with a reserved price. Since 2000, Shanghai has changed this into public auction without a lowest price for the license tag limit. In 2006, 68,654 license tags were granted, and the average successful bidding price was as high as RMB 46,435. The auction policy of license tags has restrained the increase in car ownership in Shanghai, achieving for example a lower motorization rate than Beijing. The auctioning system is different from that of Singapore. The license is valid for life once it is purchased and can be transferred to other people. This policy has alleviated the contradiction between road supply and traffic demand to a certain degree. The license tag auction has also brought unexpected influences, such as a decrease in demand for cheaper vehicles, and lots of automobilists licensing their cars in adjacent cities and using them in Shanghai. 4.3.3 Parking charging policy Shanghai guides the planning, construction and management of its parking facilities with a transport areas differentiation policy.31 The specific measures are that the central business district provide few parking spaces and charge a higher price to control vehicles from entering this area; the other areas in central area provide a higher number of parking spaces to allow more vehicles to enter this area. The

Mobility for Development -Shanghai Case Study
59
peripheral area focuses on solving the parking conflicts in residential communities, and has planned preferentially charged public parking lots by the transport hubs near the outer ring to encourage car passengers to switch to public transport before they enter the urban center. The suburban area provides sufficient parking places in connection with town construction to match a policy of less control on using cars. The parking facilities are divided into different types: residential parking, workplace parking, public parking, street parking, and special bus parking, etc. We should draft different strategies according to different situation we are facing. The consideration has been taken to implement various policies according to the different characteristics of parking types. For example, ensuring that the residential car shall be parked according to the principle of “one parking space for one car”; coordinating the setting up of workplace parking with capacity of nearby roads; strictly controlling the on-street parking through the administrative and economic measures; giving priority to construction of bus depots.
Area
Daytime
Night-time
Monthly
(night-time,
weekend
and holiday)
Manual charging Parking Meter charging
Within the first
hour
Over one hour
every half an
hour
the first hour Over one
hour every
half an hour
0-15
min
15-30
min
30-60
min
Key area 15 10 4 4 7 10 10 400/month
The rest areas within
the inner ring 10 6 3 3 4 6 8 300/month
Zone between the
inner and outer ring
(including towns
outside the outer ring)
7 4 2 2 3 4 5 200/month
Table 4.3.1: Parking charge standards 4.3.4 Motorcycle limitation policy As motorcycles can travel more flexibly and faster, their number could grow very rapidly without any limitation. However, a lot of speeding motorcycles can disturb the normal transport order, reduce the safety of road traffic, lower the operational efficiency of urban transport and cause many problems to the environment. Therefore, Shanghai has drafted and implemented policies to gradually reduce motorcycles, carried out regional controls on the use of motorcycles, and strengthened the oversight of motorcycles. The specific measures are that motorcycles are forbidden to travel through the roads of the central city; the roads and areas where motorcycles are forbidden will be expanded gradually; the policy of “the discarded motorcycles shall not be renewed” is implemented; the relevant policies of “switching the motorcycle plates to car plates” have been prepared and implemented; the charging standards are raised; the punishment for cyclists violating traffic regulations is more serious. As a result, the influence of motorcycles on traffic order is reduced.

Mobility for Development -Shanghai Case Study
60
Comment from stakeholder dialogue: Many of the issues related to land use and transport integration in Shanghai are similar to the rest of China. There is a feeling that if this can be solved in Shanghai, the outlook for sustainable mobility in other urban cities in China may also improve.
4.4 Conclusions The urban transport system of Shanghai, especially its public transport, is gradually going towards sustainable development under the guidance of the governmental policy of “transport first, bus priority”. The buses have been renewed, new higher grade vehicles have been introduced, and the service quality of public transport has been considerably enhanced. The services of the taxi industry have been standardized and its management strengthened. In addition, the Shanghai public transportation system has been greatly upgraded with large-scale metro construction. The car plate auction and higher parking costs have delayed fast motorization in Shanghai. After long a period where the widespread use of bikes was controlled due to the perception that they caused the low efficiency of traffic circulation, people have recognized the importance of the bicycle system in city center from both efficiency and environment concerns. The heavy investment and quick-pace of construction of the urban transport infrastructure has created a road network with sufficient capacity, which we never thought possible before, but congestion is still serious after short periods of relief. There are also many problems facing urban transport in Shanghai, such as traffic congestion, air pollution, traffic accidents, spatial segregation and so on. Traffic flow on Shanghai’s roads has increased so sharply that in peak times, the proportion of congested roads in the city center is more than 40% and the congested intersections are over 50%. Besides air pollution, there is complex pollution of petrol and soot. Overall the pollution resulting from car emissions in the center city is becoming more and more serious although some adjustment of energy source structure has been implemented.32
Mobility for Development -Shanghai Case Study
61
5. Information and telecommunications services Besides the movement of people and goods, the transfer of information constitutes an important part of the urban mobility system. In some cases, it can substitute for or activate the “actual” movements of people and goods. Therefore, information transfer is often referred to as “virtual” mobility. Before the 1990s, when Shanghai lagged far behind in urban infrastructure construction investment, information exchange in the city mainly relied on traditional modes: post, telegraph, telephone and fax. Since the development of the Pudong Special Economic Zone and the launch of large-scale infrastructure construction, Shanghai began to equip itself with the most advanced information and communication technologies. Within less than 20 years, it has entered directly into the age of wireless communication and high-speed internet access. Today, information and communications technology (ICT) is completely merged into the daily life of the citizens. Based on Shanghai, we could assume that the influence of ICT on the organization of every day life in Chinese urban society might be generally comparable with that in Western cities. During this rapid technological progress, the post and telecommunication sector in Chinese cities has also gone through four important reforms of its organization and management. In the 1980s, two new departments – local telephone department and long-distance telecommunication department - were created as a result of the first reform to the Post and Telecommunication Bureau (PTB) in Shanghai. With the existing Post Department, the PTB constituted thus three independent departments. This structure was thereafter thoroughly transformed in 1998 by the second reform which separated completely the telecommunication activities from the post activities. Local telephone departments and long-distance telecommunication departments have left the former PTB to form “China Telecom”, a company which is run under market rules. The post business is undertaken by the new Post Bureau who kept its nature of public service operated by the government. The telecommunications sector was further restructured by two important reforms to constitute four national operators: • In July 1999, the mobile communications business was separated from “China Telecom”
to create “China Mobile”, the only GSM network operator in China. • A few years later, “China Unicom” was founded for developing a national CDMA network
as a competitor of “China Mobile”. • In May 2002, in order to break the historical monopolizing position of “China Telecom” in
the national market of fixed telephone and to promote benign competition in this field, the state government decided to divide “China Telecom” into two parts: “China Netcom” runs the fixed telephone business in 10 northern Provinces of China, while the other keeps the name of “China Telecom” and is the only operator in the other provinces.
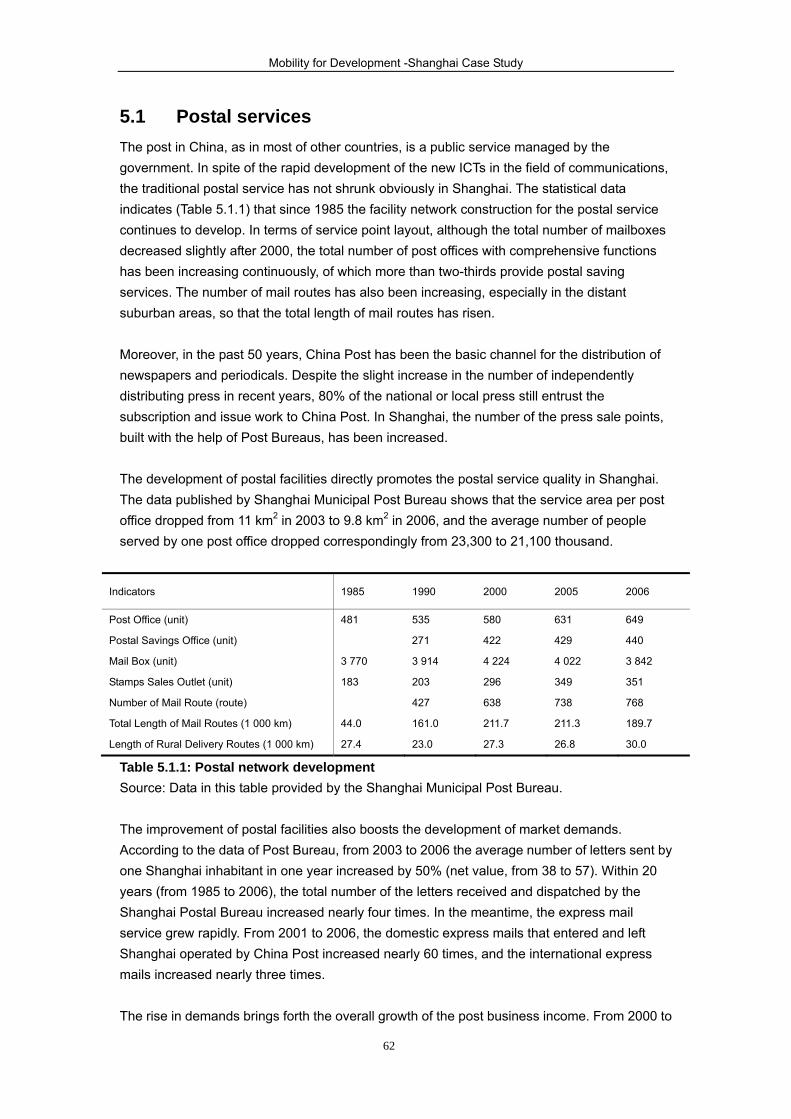
Mobility for Development -Shanghai Case Study
62
5.1 Postal services The post in China, as in most of other countries, is a public service managed by the government. In spite of the rapid development of the new ICTs in the field of communications, the traditional postal service has not shrunk obviously in Shanghai. The statistical data indicates (Table 5.1.1) that since 1985 the facility network construction for the postal service continues to develop. In terms of service point layout, although the total number of mailboxes decreased slightly after 2000, the total number of post offices with comprehensive functions has been increasing continuously, of which more than two-thirds provide postal saving services. The number of mail routes has also been increasing, especially in the distant suburban areas, so that the total length of mail routes has risen. Moreover, in the past 50 years, China Post has been the basic channel for the distribution of newspapers and periodicals. Despite the slight increase in the number of independently distributing press in recent years, 80% of the national or local press still entrust the subscription and issue work to China Post. In Shanghai, the number of the press sale points, built with the help of Post Bureaus, has been increased. The development of postal facilities directly promotes the postal service quality in Shanghai. The data published by Shanghai Municipal Post Bureau shows that the service area per post office dropped from 11 km2 in 2003 to 9.8 km2 in 2006, and the average number of people served by one post office dropped correspondingly from 23,300 to 21,100 thousand.
Indicators 1985 1990 2000 2005 2006
Post Office (unit) 481 535 580 631 649
Postal Savings Office (unit) 271 422 429 440
Mail Box (unit) 3 770 3 914 4 224 4 022 3 842
Stamps Sales Outlet (unit) 183 203 296 349 351
Number of Mail Route (route) 427 638 738 768
Total Length of Mail Routes (1 000 km) 44.0 161.0 211.7 211.3 189.7
Length of Rural Delivery Routes (1 000 km) 27.4 23.0 27.3 26.8 30.0
Table 5.1.1: Postal network development Source: Data in this table provided by the Shanghai Municipal Post Bureau. The improvement of postal facilities also boosts the development of market demands. According to the data of Post Bureau, from 2003 to 2006 the average number of letters sent by one Shanghai inhabitant in one year increased by 50% (net value, from 38 to 57). Within 20 years (from 1985 to 2006), the total number of the letters received and dispatched by the Shanghai Postal Bureau increased nearly four times. In the meantime, the express mail service grew rapidly. From 2001 to 2006, the domestic express mails that entered and left Shanghai operated by China Post increased nearly 60 times, and the international express mails increased nearly three times. The rise in demands brings forth the overall growth of the post business income. From 2000 to

Mobility for Development -Shanghai Case Study
63
2006, the business income of Shanghai Postal Bureau doubled, amounting to 43.59 million Yuan, and the postal saving business increased nearly twice, with the final balance reaching over 520 million Yuan (Table 5.1.2).
Indicators 1985 1990 1996 2000 2005 2006
Mails (100 million units) 2.19 2.96 6.82 4.61 7.08 10.36
#Domestic Express Mails (1,000 pieces) 2.3 330.0 4 112 7 099 15 412 19 301
#International Express Mails (1,000 pieces) 19.7 150.0 490 521 1 443 1 823
Total Copies of Newspapers and Magazines
Subscribed and Sold (100 million pieces) 11.76 8.71 11.63 11.30 12.33 12.45
Volume of Postal Business (100 million Yuan)* 22.40 38.49 43.59
Postal Saving Deposit Balance (100 million Yuan) 10.98 107.5 153.50 510.80 522.90
Table 5.1.2: Major indicators of postal business in main years Source: Data in this table are provided by Shanghai Municipal Post Bureau. Note: Data not available for the volume of Postal Business, because it is combined with that of telecommunication business before 2000. As economic reform progresses in China, the restructuring has spread to the field of public services. The transformation of the postal service into a commercial activity has already been put on the agenda of state government in the 10th five-year plan. Under the political guidance defined by the central government, the postal reform in Chinese cities has unfolded in succession. In Shanghai, the “Shanghai Postal Company” was created as a commercial operator in February 2007. It is different from the Shanghai Postal Management Bureau, which plays the role of local administrative authority in this sector. However, this reform has resulted in the dissatisfaction of various groups in society, who maintain that the postal service should stay as a common good. They insisted that, since 1990, although the postal cost rose swiftly (Table 5.1.3), the dramatic loss of the postal business still cannot be reversed.
1955 1990 1996 1999 2006
Local mail 0.08 0.20 0.50 0.80 1.20
National mail 0.04 0.10 0.50 0.60 0.80
Table 5.1.3: Five important fee adjustments of China Post since the founding of the People’s Republic of China (RMB) Note: The basic fee denoted by this table refers to the ordinary letters whose weight is less than 20 g; If the letter is between 20 and 100 grams, the fee will be accumulated every 20 grams (If less than 20 grams, the calculation will be made according to 20 grams); if the letter exceeds 100 grams, the fee of the letter will be calculated separately. What especially needs to be explained is that different from the ordinary postal service operated exclusively by the public postal company (bureau), the emerging market of express delivery service developed with the modern logistic industry is open to private operators. With the development of a modern logistics industry, it becomes a huge emerging market. In this market, one part is run by China Post, the other part, operated by privates companies, develops the most rapidly.

Mobility for Development -Shanghai Case Study
64
The four biggest international logistical companies - DHL, UPS, Fedex and TNT, have obtained the major share of the express delivery market in China. They mainly face business-type customers and present an obviously competitive advantage in the field of international transportation and express delivery. At the local scale, the express mailing service of the Shanghai Post Company faces a challenge from numerous medium and small private delivery companies. The investigation conducted by Shanghai Investigation Brigade of National Statistical Bureau from 2004 indicated that the number of private delivery enterprises in Shanghai was 467. They provide not only door-to-door-service to individual customers, but also undertake the delivery tasks of some Internet sellers. In 2006, the total business volume of express delivery realized by them was 164 million pieces (excluding the business volume in the branches in other provinces and municipalities), their daily average business volume is 450,000 pieces, accounting for nearly 90% of the total express business volume of Shanghai, and 7.8 times the express business volume operated by Shanghai Post Company in the same period.
5.2 Telecommunication: Installed telephone & mobile phone In Shanghai, telecommunication technology has upgraded very fast. The statistical data on infrastructure (Table 5.2.1) cannot show the improvement in quality and efficiency of services, but they definitely demonstrate the popularity of telecommunication in the daily life of people (Table 5.2.2). For telephones, the total number of users increased nearly four times in the past decade, increasing from 3 million in 1996 to more than 11 million in 2006. The development of household telephones is the most remarkable: its popularity rate has developed from less than 50% to 147.7%, that is to say, a large number of families have installed more than one telephone line. The growth of mobile phone users is still swift. The number of mobile phones users increased almost forty times in the past ten years. The popularity of mobile phones reached a penetration rate of 88.7% in 2006. This growth does not show any sign of slowing down. In the last four years, the annual growth rate of mobile phone users has always been above 10%.
Indicators 1996 2000 2003 2004 2005 2006
Long Distance Call Line (2M) 20 853 32 530 46 136 94 818
Total Length of Long-distance Optical Cable (km) 1 770 4 215 4 525 5 141 3 042
Total Length of Digital Microwave Line (km) 151 196 196 196 123
Digital and Data Users (1 000 users) 3.17 18.84 26.1 25.4 24.0 18
Capacity of Office Telephone Exchanges(Including
Access Network Capacity) (1 000 units) 8 730 9 120 13 570 13 910
Table 5.2.1: Development of the telecommunication network Source: Data in this table are provided by Shanghai Communications Administration. Note: Access network refers to the capacity of telephone exchanges installed in the office of telecommunication service providers for communication between user nodes.
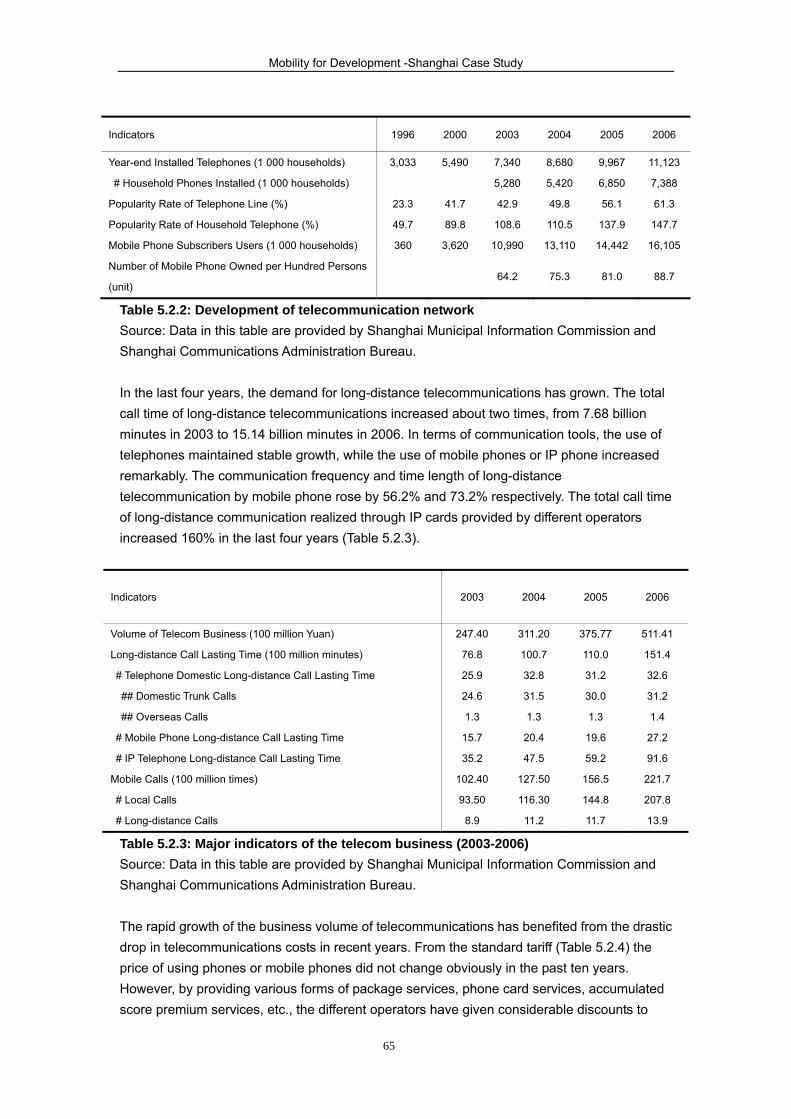
Mobility for Development -Shanghai Case Study
65
Indicators 1996 2000 2003 2004 2005 2006
Year-end Installed Telephones (1 000 households) 3,033 5,490 7,340 8,680 9,967 11,123
# Household Phones Installed (1 000 households) 5,280 5,420 6,850 7,388
Popularity Rate of Telephone Line (%) 23.3 41.7 42.9 49.8 56.1 61.3
Popularity Rate of Household Telephone (%) 49.7 89.8 108.6 110.5 137.9 147.7
Mobile Phone Subscribers Users (1 000 households) 360 3,620 10,990 13,110 14,442 16,105
Number of Mobile Phone Owned per Hundred Persons
(unit) 64.2 75.3 81.0 88.7
Table 5.2.2: Development of telecommunication network Source: Data in this table are provided by Shanghai Municipal Information Commission and Shanghai Communications Administration Bureau. In the last four years, the demand for long-distance telecommunications has grown. The total call time of long-distance telecommunications increased about two times, from 7.68 billion minutes in 2003 to 15.14 billion minutes in 2006. In terms of communication tools, the use of telephones maintained stable growth, while the use of mobile phones or IP phone increased remarkably. The communication frequency and time length of long-distance telecommunication by mobile phone rose by 56.2% and 73.2% respectively. The total call time of long-distance communication realized through IP cards provided by different operators increased 160% in the last four years (Table 5.2.3).
Indicators 2003 2004 2005 2006
Volume of Telecom Business (100 million Yuan) 247.40 311.20 375.77 511.41
Long-distance Call Lasting Time (100 million minutes) 76.8 100.7 110.0 151.4
# Telephone Domestic Long-distance Call Lasting Time 25.9 32.8 31.2 32.6
## Domestic Trunk Calls 24.6 31.5 30.0 31.2
## Overseas Calls 1.3 1.3 1.3 1.4
# Mobile Phone Long-distance Call Lasting Time 15.7 20.4 19.6 27.2
# IP Telephone Long-distance Call Lasting Time 35.2 47.5 59.2 91.6
Mobile Calls (100 million times) 102.40 127.50 156.5 221.7
# Local Calls 93.50 116.30 144.8 207.8
# Long-distance Calls 8.9 11.2 11.7 13.9
Table 5.2.3: Major indicators of the telecom business (2003-2006) Source: Data in this table are provided by Shanghai Municipal Information Commission and Shanghai Communications Administration Bureau. The rapid growth of the business volume of telecommunications has benefited from the drastic drop in telecommunications costs in recent years. From the standard tariff (Table 5.2.4) the price of using phones or mobile phones did not change obviously in the past ten years. However, by providing various forms of package services, phone card services, accumulated score premium services, etc., the different operators have given considerable discounts to
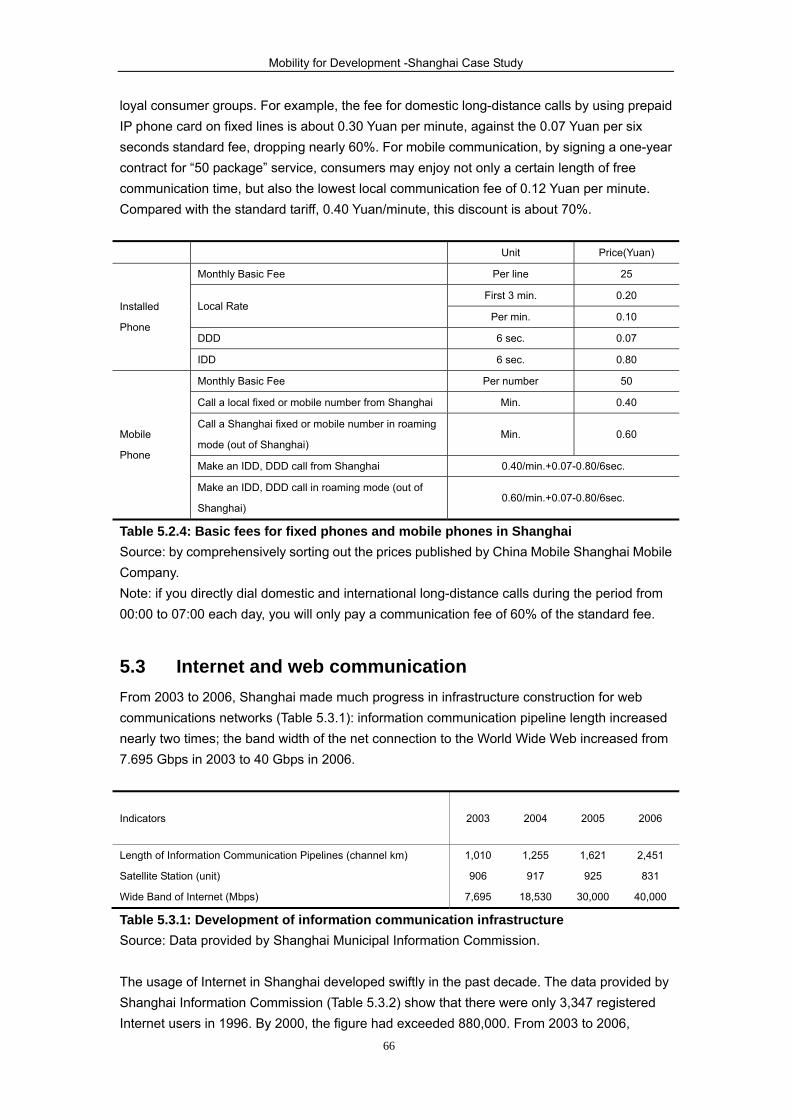
Mobility for Development -Shanghai Case Study
66
loyal consumer groups. For example, the fee for domestic long-distance calls by using prepaid IP phone card on fixed lines is about 0.30 Yuan per minute, against the 0.07 Yuan per six seconds standard fee, dropping nearly 60%. For mobile communication, by signing a one-year contract for “50 package” service, consumers may enjoy not only a certain length of free communication time, but also the lowest local communication fee of 0.12 Yuan per minute. Compared with the standard tariff, 0.40 Yuan/minute, this discount is about 70%. Unit Price(Yuan)
Installed
Phone
Monthly Basic Fee Per line 25
Local Rate First 3 min. 0.20
Per min. 0.10
DDD 6 sec. 0.07
IDD 6 sec. 0.80
Mobile
Phone
Monthly Basic Fee Per number 50
Call a local fixed or mobile number from Shanghai Min. 0.40
Call a Shanghai fixed or mobile number in roaming
mode (out of Shanghai) Min. 0.60
Make an IDD, DDD call from Shanghai 0.40/min.+0.07-0.80/6sec.
Make an IDD, DDD call in roaming mode (out of
Shanghai) 0.60/min.+0.07-0.80/6sec.
Table 5.2.4: Basic fees for fixed phones and mobile phones in Shanghai Source: by comprehensively sorting out the prices published by China Mobile Shanghai Mobile Company. Note: if you directly dial domestic and international long-distance calls during the period from 00:00 to 07:00 each day, you will only pay a communication fee of 60% of the standard fee.
5.3 Internet and web communication From 2003 to 2006, Shanghai made much progress in infrastructure construction for web communications networks (Table 5.3.1): information communication pipeline length increased nearly two times; the band width of the net connection to the World Wide Web increased from 7.695 Gbps in 2003 to 40 Gbps in 2006.
Indicators 2003 2004 2005 2006
Length of Information Communication Pipelines (channel km) 1,010 1,255 1,621 2,451
Satellite Station (unit) 906 917 925 831
Wide Band of Internet (Mbps) 7,695 18,530 30,000 40,000
Table 5.3.1: Development of information communication infrastructure Source: Data provided by Shanghai Municipal Information Commission. The usage of Internet in Shanghai developed swiftly in the past decade. The data provided by Shanghai Information Commission (Table 5.3.2) show that there were only 3,347 registered Internet users in 1996. By 2000, the figure had exceeded 880,000. From 2003 to 2006,

Mobility for Development -Shanghai Case Study
67
registered Internet users increased more than two times from 4.32 million to 9.57 million. That is to say, today, more than half of the permanent habitants of Shanghai (52.7%) use the Internet. The increase of the household broadband users is the most remarkable, from 924,900 users to 3,016,800 (an increase of 326%).
Indicators 1996 2000 2003 2004 2005 2006
Local Information Exchange Flow (1 000 km) 1 000 1 330 1 300 21 130
Users of Internet (1 000 users) 3.34
7
882.
4 4 320 6 330 8 030 9 570
Users of Internet per Thousand People (users) 32.2 46.8 59.0 52.7
Users of Wide Band for Public (1 000 users) 924.
9
1
588.2 2 474
3
016.8
Users of Wide Band for Public per Hundred Household
(users) 19.0 32.4 49.8 60.4
Table 5.3.2: Internet use development Source: Data provided by Shanghai Municipal Information Commission. Notes: Users of Internet per thousand people were calculated by resident population. In Shanghai, “China Telecom” is still the main Internet service provider (ISP) for traditional dialing access by phone line where transmission rates are limited to 128 Kbps. By composing the access number 16300, registered or non-registered users may connect to the Internet, with a basic fee of 3 Yuan per hour. Meanwhile, China Telecom provides another access number, 16388, for users who only want to connect to the national Wide Web, “Chinanet”. These users benefit ^from a special basic fee of 5 Yuan per 2 hours, and the charge in a month is limited at 50 Yuan in maximum.
ISP Technology applied
Dial-up Shanghai Telecom ISDN
Broadband Shanghai Telecom ADSL
LAN
Shanghai Telecom FTTB
Shanghai Cable FTTB
Great Wall Broadband FTTB
China (Shanghai) Netcom FTTB
Wireless
Shanghai Telecom WiFi
China (Shanghai) Mobile GSM+WiFi
China (Shanghai) Unicom CDMA+WiFi
Table 5.3.3: Main ISP in Shanghai Today, high speed internet access (HSIA) service has replaced the traditional telephone dialing service and is the dominant access mode for household users. The situation of HSIA ISPs is more complicated (Table 5.3.3). Four major ISPs compete in the market in Shanghai: China Telecom (Shanghai), Shanghai Cable Network, Great Wall Broadband Network and China Netcom (Shanghai). In addition, there are two ISPs for wireless HSIA: China Mobile (Shanghai) and China Unicom (Shanghai).

Mobility for Development -Shanghai Case Study
68
According to the technology applied, the fixed HSIA may be divided into ADSL access and FTTB (Fiber to the Building) access. Relying on its traditional monopolizing position in telephone operation, China Telecom (Shanghai) is the only ISP providing ADSL services. It is also the only one who operates all four kinds of access services including ISDN, broadband (ADSL or FTTB) and WiFi. Shanghai Cable Network, the second ISP in Shanghai, relies on its existing cable TV network and its wide customers groups. It has completed dual digitalization on the cable TV network for more than two million households. Great Wall Broadband Network is a high-tech ISP company jointly founded in 2000 by several state-owned listing companies. Besides Shanghai, it has set up its branches in more than 30 cities nationwide. It needs to not only rent Internet bandwidth from China Telecom (Shanghai), but also invest independently in realizing its own network infrastructure. China Netcom (Shanghai), an operator similar to the Great Wall Broadband Network, no longer provides Internet access service to individual users. Instead, it focuses on the user groups in various residential communities in cooperation with real estate developers. The rapid growth of broadband users in the last few years has benefited greatly from the benign competition between different ISPs. In particular, the drop of the initial equipment installation charge makes the HSIA available for more and more peoples. In the late 1990s, when the HSIA appeared in the consumers’ market, its capacity was limited. Moreover, the high initial installation charge became a main obstacle for the growth of user number. In the scramble for the users’ market, several ISPs accelerated infrastructure construction on the one hand, and competed with each other on the initial equipment installation charge on the other hand. The two most important broadband ISPs in Shanghai - Shanghai Telecom and Shanghai Cable Network, reduced respectively their initial equipment installation charges from 1,300 and 2,000 Yuan to 900 and 800 Yuan in 2001, then 310 and 420 Yuan in 2003. That is to say, the reduction of equipment installation charge in two years reached 76% and 79% respectively for two ISPs (Table 5.3.4).
ISP Before 2001 2001 2002 2003
Shanghai Telecom (Yuan) 1,300 900 630 310
Shanghai Cable (Yuan) 2,000 800 580 420
Table 5.3.4: Changes in Shanghai Telecom and Shanghai Cable installation charges (2001-2003) Today, the competition in this emerging market has led to relative market share and service charge stability today. On this basis, the new competition between different ISPs has shifted to the daily user fee for HSIA (Table 5.3.5). Other than providing HSIA in different rate-limits for the subscribed costumers that pay the package deals monthly, the ISPs also propose a tariff for time-limited HSIA usage and some discounts for students, senior citizens and other special

Mobility for Development -Shanghai Case Study
69
social groups. These measures have effectively reduced the daily cost in using the HSIA.
Type Telecom SCN GWBN
Monthly charging user Installation charge 310 220 500
512K 130 - 100
1M 140 120 130
2M 150 - 150
Package deal for IMbps
connection
(including installation charge)
6 months - 770 810
12 months 1,400-1,680 1,200 1,320
Table 5.3.5: Basic fee comparison of the three major cable broadband access service providers in Shanghai
5.4 Broadcasting and television stations Radio and television constitute two indispensable tools for information and communications. A survey conducted by China Dominant-journalism Development Center (CDDC) in December 1997 shows that television, radio broadcasting and newspapers are the three most important media for Shanghai residents to obtain daily information (5.4.1).
activities time activities Time
1 TV 108.13 7 Lecture 12.68
2 Radio 45.03 8 Writing 11.69
3 Newspaper 44.71 9 Conference 11.23
4 Book 32.67 10 VCD 8.56
5 Talking 30.09 11 Phone 780
6 Music(CD, MP3) 13.40 12 Writing with Computer 7.72
Table 5.4.1: Average amount of time spent on the following information behaviors in a day for individual Shanghai resident (minutes) Source: Zhang Guoliang, Shanghai Citizen and Media Culture Facing the New Century, 2002 As in other Chinese cities, radio broadcasting and television was originally operated in Shanghai by municipal services: Shanghai TV Station and Shanghai People’s Broadcasting Station. Since the 1990s, Shanghai has carried on a series of reforms while accelerating infrastructure construction. In order to introduce competition into this industry, the Shanghai Cable TV Station was founded in December 1992 (opening 10 program channels, of which only one plays its own program and 9 transfer the programs of others TV stations). In 1993, one part of the Shanghai TV Station (Shanghai TV 2) was peeled off to create “Shanghai Orient TV Station” (OTV). Similarly, one part of Shanghai People’s Broadcasting Station (Pujiang Voice Station) was transformed into independent “Shanghai Orient Broadcasting Station” in the same year. One year later, the Shanghai Education TV Station was founded and put into operation.

Mobility for Development -Shanghai Case Study
70
These organizational reforms and the competition infused new energy into the development of the broadcasting and television industry in Shanghai. That can be proved by the rapid increase of program production, program broadcasting time, number of programs provided etc., both in radio broadcasting and in television (Table 5.4.2, Table 5.4.3)
1990 1995 2000 2005 2006
Number of programs 5 11 13 25 25
Program Hours per Day (hour) 35.9 85.3 156.4 410.2 437
Production of Programs (hour) 2,172 5,985 10,383 47,115 66,275
Population Coverage Rate 96 96 100 100 100
Table 5.4.2: Television programs and population coverage (1990-2006) Source: Shanghai Municipal Administration of Culture, Radio, Film & TV.
1990 1995 2000 2005 2006
Number of programs 10 20 20 21 21
Program Hours per Day (hour) 123.0 284.6 297.0 346.6 355.5
Production of Programs (hour) 9,222 54,179 64,903 83,665 90,582
Table 5.4.3: The broadcasting program (1990-2006) Source: Shanghai Municipal Administration of Culture, Radio, Film & TV. However, the competition also brought forth such problems as repetitive allocation of resources and their low use efficiency. The two Shanghai TV stations, as separate entities, are less advantaged in national competition with China Central TV Station and other provincial TV stations. Since 2001, a “regrouping” reform has been carried out to the local broadcasting stations and TV stations. It consists of reintegrating the Shanghai People’s Broadcasting Station, Shanghai Orient Broadcasting Station, Shanghai TV Station, Orient TV Station, Shanghai Cable TV Station and other units, and on this basis, built “Shanghai Media Group” (SMG), which incorporated broadcasting, TV, newspaper, Internet content provider, etc. In 2005, the new SMG group successfully completed the integration of its TV and broadcasting information resources, entertainment program resources, and maintained their mutual cooperation and internal competition by “specifying” the channels. The broadcasting programs of the reformed SMG claimed a market share of 90.6% in Shanghai area and 91.1% in the broadcasting “golden times” (from 9;00 to 12:00 and from 17:00 to 19:00) Shanghai area. The market share of its TV programs in “golden period” (from 19:00 to 22:00) in Shanghai area is close to 70%. In the meantime, SMG developed its nationwide TV media platform through the launch of its new satellite channel “Dragon TV”. This channel covers all the big Chinese cities - the municipalities directly under the administration of the State Council, provincial capital cities and cities specifically designated in the state plan, by exchanging cable TV broadcasting rights. Its programs are also broadcasted by satellite to Japan, USA, Australia, Macao and other countries and regions upon their approval, covering a global population of more than 0.6 billion.
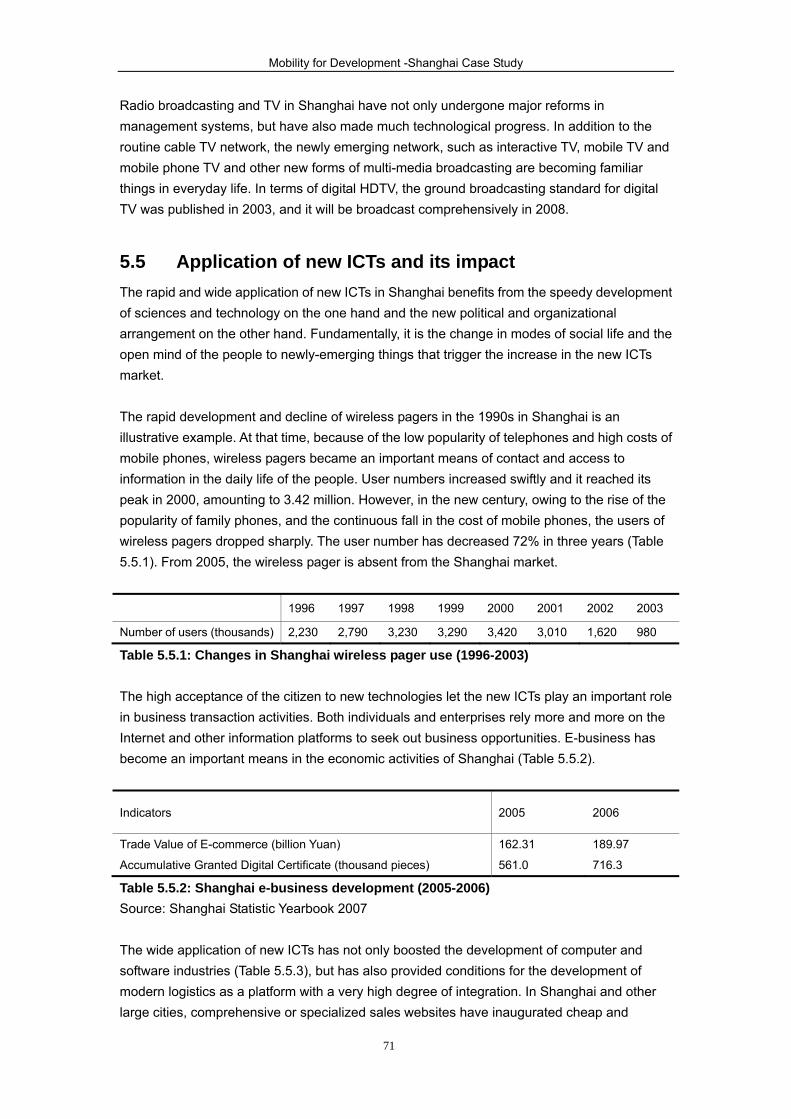
Mobility for Development -Shanghai Case Study
71
Radio broadcasting and TV in Shanghai have not only undergone major reforms in management systems, but have also made much technological progress. In addition to the routine cable TV network, the newly emerging network, such as interactive TV, mobile TV and mobile phone TV and other new forms of multi-media broadcasting are becoming familiar things in everyday life. In terms of digital HDTV, the ground broadcasting standard for digital TV was published in 2003, and it will be broadcast comprehensively in 2008.
5.5 Application of new ICTs and its impact The rapid and wide application of new ICTs in Shanghai benefits from the speedy development of sciences and technology on the one hand and the new political and organizational arrangement on the other hand. Fundamentally, it is the change in modes of social life and the open mind of the people to newly-emerging things that trigger the increase in the new ICTs market. The rapid development and decline of wireless pagers in the 1990s in Shanghai is an illustrative example. At that time, because of the low popularity of telephones and high costs of mobile phones, wireless pagers became an important means of contact and access to information in the daily life of the people. User numbers increased swiftly and it reached its peak in 2000, amounting to 3.42 million. However, in the new century, owing to the rise of the popularity of family phones, and the continuous fall in the cost of mobile phones, the users of wireless pagers dropped sharply. The user number has decreased 72% in three years (Table 5.5.1). From 2005, the wireless pager is absent from the Shanghai market.
1996 1997 1998 1999 2000 2001 2002 2003
Number of users (thousands) 2,230 2,790 3,230 3,290 3,420 3,010 1,620 980
Table 5.5.1: Changes in Shanghai wireless pager use (1996-2003) The high acceptance of the citizen to new technologies let the new ICTs play an important role in business transaction activities. Both individuals and enterprises rely more and more on the Internet and other information platforms to seek out business opportunities. E-business has become an important means in the economic activities of Shanghai (Table 5.5.2).
Indicators 2005 2006
Trade Value of E-commerce (billion Yuan) 162.31 189.97
Accumulative Granted Digital Certificate (thousand pieces) 561.0 716.3
Table 5.5.2: Shanghai e-business development (2005-2006) Source: Shanghai Statistic Yearbook 2007 The wide application of new ICTs has not only boosted the development of computer and software industries (Table 5.5.3), but has also provided conditions for the development of modern logistics as a platform with a very high degree of integration. In Shanghai and other large cities, comprehensive or specialized sales websites have inaugurated cheap and

Mobility for Development -Shanghai Case Study
72
convenient modern sales methods in cooperation with local express delivery companies, and have thus become a powerful force in the retail business.
Indicators 2004 2005 2006
Operating Revenue of Information Service Industry (billions Yuan) 65.56 91.68 122.15
# Computer Service & Software Industry 30.28 45.52 61.67
# Self-program Software 9.08 11.89 10.41
System Integration 9.42 10.01 12.06
Enterprises of Over 100 million Software Revenue (unit) 35 43 56
Software of Information Service Industry (thousand persons) 99.0 144.6 180.3
# Computer Service & Software Industry (thousand persons) 7.10 11.83 14.12
Table 5.5.3: Information service industry operation (2004-2006) Source: Shanghai Statistic Yearbook 2007 In addition to creating new operating models and value in business, new ICTs also provide new channels and techniques to the public management and the public services for the government. Under the overall layout of the national project called “Government Online”, all the governmental authorities in Shanghai have established their own official websites. This creates favorable conditions for the transparency of governmental affairs, public participation and monitoring by the public. At the same time, the Shanghai Municipal People’s Government also improved the urban public service quality fully using the NICTs. It firstly presented in China the “Citizen mailbox”, an individual E-mail service with the true name of citizens, as the “ID cards online” for Shanghai residents. The “citizen mailboxes” have become the direct communication means between government and individuals on the one hand, and have been connected with social security services and other basic life expenditure information (water, electricity and coal) for citizens to manage and pay for their daily needs. From 2004, when the mailboxes were formally launched, to the end of 2006, more than 1.24 million Shanghai citizens have registered for “citizen mailboxes”. In addition, Shanghai also pushed out electronic account “social security cards” with information integration functions in the social security system. In the field of urban transportation, Shanghai vigorously improved transport information services on the one hand, and pushed out pre-charged “public transportation cards” with universal payment functions on the other hand. The importance of the role played by NICTs in the daily life of Shanghai citizens will continue to increase (Table 5.5.4).
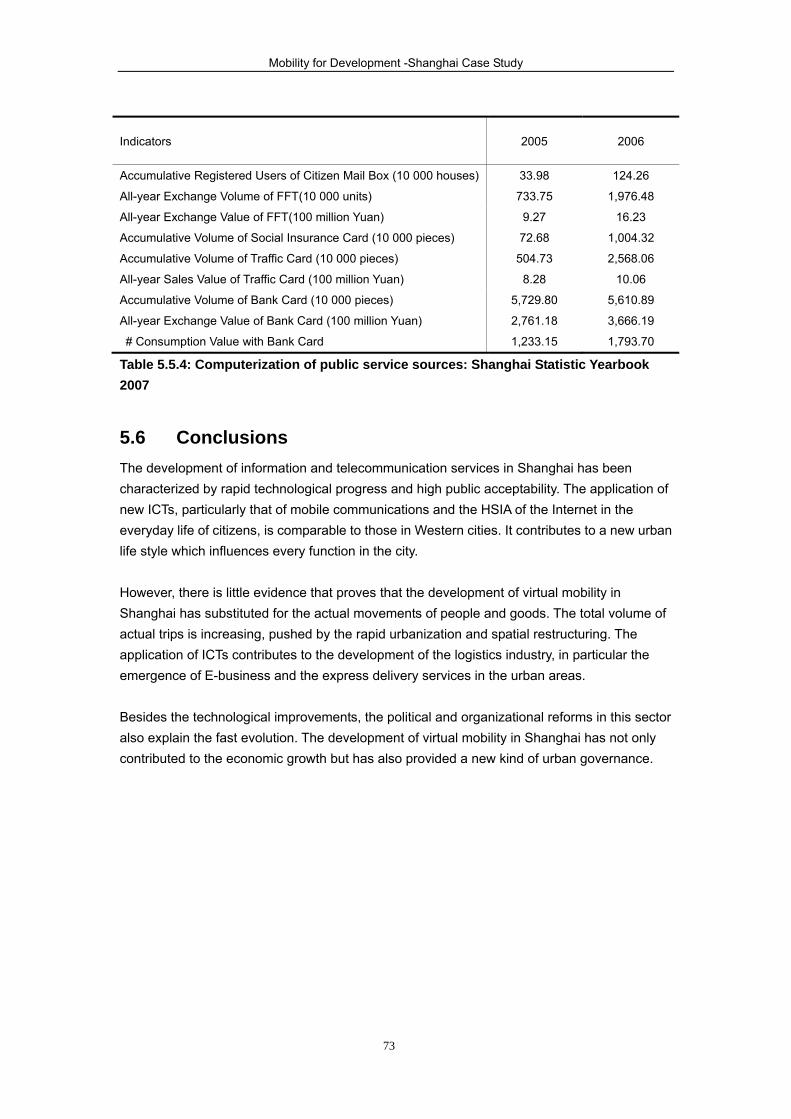
Mobility for Development -Shanghai Case Study
73
Indicators 2005 2006
Accumulative Registered Users of Citizen Mail Box (10 000 houses) 33.98 124.26
All-year Exchange Volume of FFT(10 000 units) 733.75 1,976.48
All-year Exchange Value of FFT(100 million Yuan) 9.27 16.23
Accumulative Volume of Social Insurance Card (10 000 pieces) 72.68 1,004.32
Accumulative Volume of Traffic Card (10 000 pieces) 504.73 2,568.06
All-year Sales Value of Traffic Card (100 million Yuan) 8.28 10.06
Accumulative Volume of Bank Card (10 000 pieces) 5,729.80 5,610.89
All-year Exchange Value of Bank Card (100 million Yuan) 2,761.18 3,666.19
# Consumption Value with Bank Card 1,233.15 1,793.70
Table 5.5.4: Computerization of public service sources: Shanghai Statistic Yearbook 2007
5.6 Conclusions The development of information and telecommunication services in Shanghai has been characterized by rapid technological progress and high public acceptability. The application of new ICTs, particularly that of mobile communications and the HSIA of the Internet in the everyday life of citizens, is comparable to those in Western cities. It contributes to a new urban life style which influences every function in the city. However, there is little evidence that proves that the development of virtual mobility in Shanghai has substituted for the actual movements of people and goods. The total volume of actual trips is increasing, pushed by the rapid urbanization and spatial restructuring. The application of ICTs contributes to the development of the logistics industry, in particular the emergence of E-business and the express delivery services in the urban areas. Besides the technological improvements, the political and organizational reforms in this sector also explain the fast evolution. The development of virtual mobility in Shanghai has not only contributed to the economic growth but has also provided a new kind of urban governance.

Mobility for Development -Shanghai Case Study
74
6. Shanghai’s transport system operating costs and
efficiency
6.1 General information In 2007, along with the improvement of Shanghai transport facilities and the increase in transport services supply, the operating efficiency of the Shanghai transport system improved while the cost per unit of transport service continued to decrease. However, due to the sharp growth in demand for transport services, the overall cost of transportation is still increasing rapidly. The transport and communication costs are also taking an ever increasing share of the family spending budget.
6.2 The operation situation of transport enterprises By the end of 2005 there were 2,531 transport enterprises in Shanghai, realizing a total profit of about 30 billion Yuan. As it can be seen from Figure 6.2.1, the number of transport enterprises and their profits has seen huge increases since 2000, especially in 2003. The general development of transport industry in Shanghai shows a smooth trend.
0
500
1 000
1 500
2 000
2 500
3 000
1997 1998 1999 2000 2001 2002 2003 2005year
num
ber o
f ent
erpr
ises
0
5 000 000
10 000 000
15 000 000
20 000 000
25 000 000
30 000 000
35 000 000to
tal p
rofit
(1 0
00 y
uan)
number of enterprises total profit(1 000 yuan)
Figure 6.2.1: The number and the total profit of the transport and postal services enterprises Source: Shanghai Statistical Yearbook on Industry, Energy and Transport 1997-2006 Note: Total profit means the ultimate outcome of production and business activities, which is the sum of operating profit, investment income, subsidies income, net income besides the business and the profit and loss adjustment of preceding year. Behind this general trend of transport industry development, the difference between each mode is obvious: Railway transport - the number of railway transport companies remains at two after a fluctuation at the beginning of this century. The profits on railways have undergone big ups and downs each year. Generally speaking, by summing up the profits made from 1997 to 2005, railway transport was in deficit. Road transport - the number of road transport enterprises has increased by more than 100%

Mobility for Development -Shanghai Case Study
75
The profits on highway mildly cooled down after experienced a sharp increase from 2001 to 2003. Water transport - the number of water transport enterprise has been growing after a decrease to 41 in 2001. Water transport industry has got rid of the deficit since 2003. It has grown rapidly to be the economic power of the Shanghai transport sector, with its profits in 2005 up to four times as much as that in 2003 and equating to approximately 75% of profit of the entire Shanghai transport industry. Aviation transport - the number of air enterprises has been growing since 2001. There were 13 air enterprises by the end of 2005. Its profit in 2005 accounted for approximately 15% of the total profit of the transport industry in Shanghai (see Appendix II, Figure 4-7).
6.3 General transport and communication costs and expenditures 6.3.1 Transport and communication consumer price index As it can be seen in Figure 6.3.1, the price index of transportation and communication for Shanghai citizens had been ascending year after year from 1990 to 2000, and the total growing rate is a little larger than the overall resident consumer price index. However, since 2001, in contrast to the upward trend of the overall resident consumer price index, the transport and communication consumer price index has decreased in recent years.
Figure 6.3.1: Overall residential consumer price index (1991-2006,1990=100) Source: Shanghai Statistical Yearbook 2007 6.3.2 Transport and communication expenditures According to the statistics on the average consumption expenditure of Shanghai citizens from 1990 to 2005, the proportion of traditional consumption items (such as food, clothes and household facilities) in total household expenditures was gradually going down. The Engle’s Coefficient standing for the share of urban household consumer spending devoted to food declined from 56.5% to 35.9%. At the same time, the share devoted to transport and communications rose from 3.0% to 14.4%, and the speed of growth was second only to healthcare.
0
50
100
150
200
250
300
1991 1992 1993 1994 1995 1996 1997 1998 1999 2000 2001 2002 2003 2004 2005 2006year
cons
umpt
ion
pric
e in
dex
overall residents consumer transport and communication
cons
umer
pric
ein
dex
(199
1~20
06,1
990=
100)

Mobility for Development -Shanghai Case Study
76
Year Total Consumption
Expenditures Food Clothing
Household Facilities, Articles and
Services
Medicines and Medical
Services
1990 100 56.5 10.8 10.1 0.6
1995 100 53.4 9.6 10.9 1.9
2000 100 44.5 6.4 7.7 5.6
2005 100 35.9 6.8 5.8 5.8
Year Transport and
Communications
Education, Culture and
Recreation Services Housing
Miscellaneous Commodities
and Services
1990 3.0 11.9 4.6 2.5
1995 5.5 8.6 6.8 3.3
2000 8.6 14.5 9 3.7
2005 14.4 16.5 10.2 4.6
Table 6.3.1: Structure of per capita consumer expenditures of urban households Source: Shanghai Statistical Yearbook 2007
In 2006, the transportation and communication expenditure for Shanghai citizens reached 2,333 Yuan per capita, or 15.8% of total expenditures. It ranked third in total household expenditure, behind food (35.6%) and education, culture and recreation services (16.5%). Overall both the absolute expenditure on transportation and communication and its proportion in the total expenditure have been on the trend of continuous growth since the 1990s (Figure 6.3.1). Researchers who analyzed the data from 1998 to 2003 had estimated that the proportion of transportation and communication expenditure would reach 15.8% in 2012 from 13.1% in 2006.33 The data in Figure 6.3.2 suggests that the growth of actual expenditure of transportation and communication has far exceeded this projection.
500
1 000
1 500
2 000
2 500
1980 1985 1990 1995 1996 1997 1998 1999 2000 2001 2002 2003 2004 2005 2006year
cons
umpt
ion
expe
nditu
re(y
uan)
0%
2%4%
6%
8%10%
12%
14%16%
18%
prop
ortio
n
Consumption Expenditures in Transport and Communications (yuan)
the proportion of transport and communication consumption expenditure in the total
Figure 6.3.2: Trend in consumption expenditures on transportation and communication per capita Source: Shanghai Statistical Yearbook 2007
As it can be seen from Figure 6.3.3, from 1990 to 2000, the growth trend of the disposable income and the transportation & communications consumption expenditures (TCCE) are similar. Since 1998, the increase in TCCE has exceeded the increase in per capita disposable income.

Mobility for Development -Shanghai Case Study
77
5 000
10 000
15 000
20 000
25 000
1980 1985 1990 1995 1996 1997 1998 1999 2000 2001 2002 2003 2004 2005 2006year
Aver
age
Per C
apita
Dis
posa
ble
Inco
me
(yua
n)
500
1 000
1 500
2 000
2 500
Tran
spor
t and
Com
mun
icat
ions
Con
sum
ptio
n Ex
pend
iture
s(y
uan)
Average Per Capita Disposable Income(yuan) Transport and Communications Consumption Expenditures (yuan)
Figure 6.3.3: Comparison of disposable income and the TCCE Source: Shanghai Statistical Yearbook 2007 Seeing from Table 6.3.2, among the several cities in Yangtze River Delta region, the cost for urban transport in Shanghai is highest, particularly for car use on parking and licenses. The license costs RMB 45,000 Yuan or more in Shanghai while in Ningbo it only costs RMB 170Yuan. The public policy in the cost control for transport and communications in Shanghai shows an intention to reduce the travel cost for public transport and meanwhile increase that of private cars.
City
Bus Fares Taxi Car
ordinary air
conditioning Basic fare Rate
Petrol
Price-93# License Parking
Shanghai 1.0
Yuan 2.0 Yuan
10 Yuan/3
km 2.0 Yuan/km 3.46 Yuan/L
45 000
Yuan
10
Yuan
Nanjing 0.7
Yuan 1.4 Yuan
7 Yuan/3
km
(Excluding wait) 2.4
Yuan/km 3.39 Yuan/L 500 Yuan 6 Yuan
Suzhou 1.0
Yuan 2.0 Yuan
10 Yuan/3
km 1.8 Yuan/km _ _ _
Hangzhou 1.0
Yuan 2.0 Yuan
10 Yuan/4
km 2.0 Yuan/km 3.40 Yuan/L 200 Yuan 4 Yuan
Ningbo 1.0
Yuan 2.0 Yuan
8 Yuan/4
km 1.8 Yuan/km 3.44 Yuan/L 170 Yuan 5 Yuan
Wenzhou 1.5
Yuan 2.0 Yuan
10 Yuan/4
km 1.5 Yuan/km 3.44 Yuan/L
15 000
Yuan 5 Yuan
Table 6.3.2: Travel cost in YRD cities in 2005 Source: Fares of Transport and Communication, Pioneering With Science and Technology, 2005.04 Due to expansion of urban space and rise of living standards, the increasing demand of transportation and communication will continue for a long time. Therefore, although the consumer price index of transport and communication has decreased slowly in recent years (as it is said in 6.3.1), the absolute cost of transportation and communication of Shanghai people continues to grow. It is grateful to see that the policy-maker is trying to reduce the cost
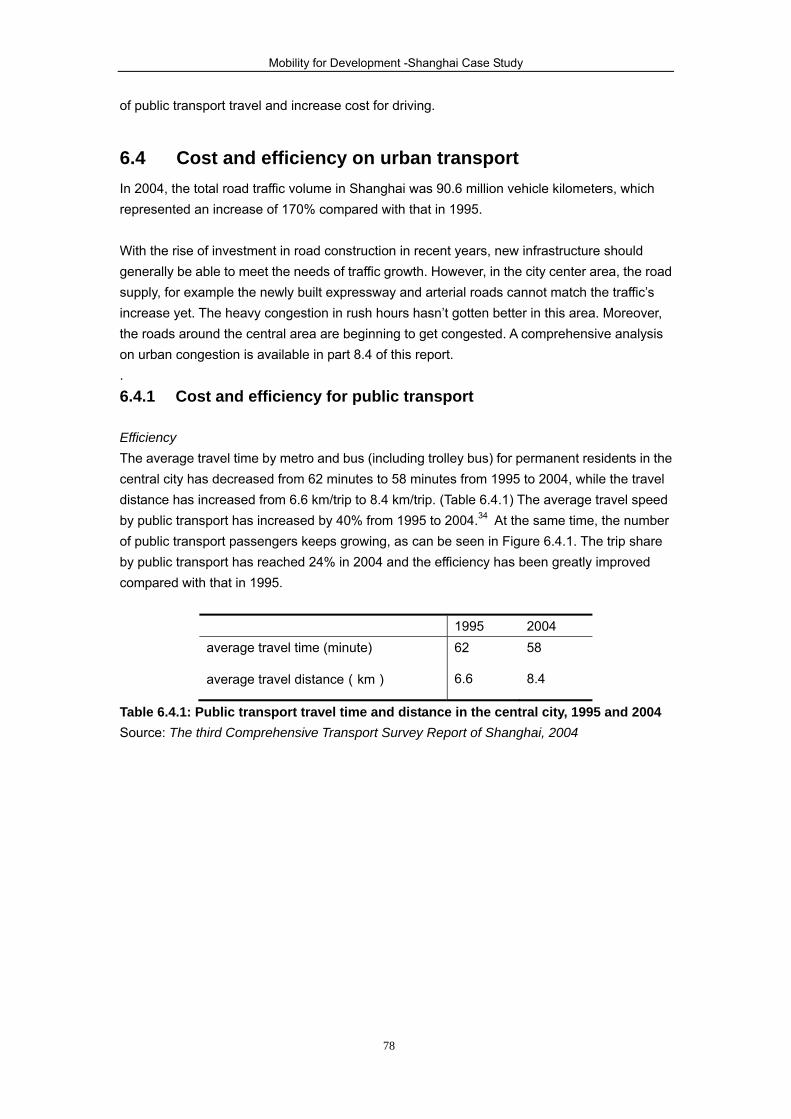
Mobility for Development -Shanghai Case Study
78
of public transport travel and increase cost for driving.
6.4 Cost and efficiency on urban transport In 2004, the total road traffic volume in Shanghai was 90.6 million vehicle kilometers, which represented an increase of 170% compared with that in 1995. With the rise of investment in road construction in recent years, new infrastructure should generally be able to meet the needs of traffic growth. However, in the city center area, the road supply, for example the newly built expressway and arterial roads cannot match the traffic’s increase yet. The heavy congestion in rush hours hasn’t gotten better in this area. Moreover, the roads around the central area are beginning to get congested. A comprehensive analysis on urban congestion is available in part 8.4 of this report. . 6.4.1 Cost and efficiency for public transport Efficiency The average travel time by metro and bus (including trolley bus) for permanent residents in the central city has decreased from 62 minutes to 58 minutes from 1995 to 2004, while the travel distance has increased from 6.6 km/trip to 8.4 km/trip. (Table 6.4.1) The average travel speed by public transport has increased by 40% from 1995 to 2004.34 At the same time, the number of public transport passengers keeps growing, as can be seen in Figure 6.4.1. The trip share by public transport has reached 24% in 2004 and the efficiency has been greatly improved compared with that in 1995.
1995 2004 average travel time (minute) 62 58
average travel distance(km) 6.6 8.4
Table 6.4.1: Public transport travel time and distance in the central city, 1995 and 2004 Source: The third Comprehensive Transport Survey Report of Shanghai, 2004

Mobility for Development -Shanghai Case Study
79
01 0002 0003 0004 0005 0006 0007 0008 0009 000
10 000
1995 1996 2000 2004 2006year
Pas
seng
er V
olum
e o
f Pub
licTr
ansp
orta
tion
( tho
usan
d pe
rson
-tim
es)
Metro Buses and Trolley Buses Taxi
Figure 6.4.1: Passengers using public transport (1,000/day) Source: The third Comprehensive Transport Survey Report of Shanghai, 2004 and Shanghai Statistical Yearbook 2007 Note: The figure lacks the data of the volume of the taxi passenger in 2006
As five metro lines have been put into operation one by one, the number of metro passengers has increased sharply. The time between two trains during rush hour has been reduced to about 6 minutes. That of Line #1 has been reduced to 3 minutes (see Appendix I, Table 8). According to transport survey conducted at the beginning of 2005, passengers taking the metro make more short-distance trips than long-distance ones, the passengers traveling within 6 km making up 38% of the total flow of passengers, while those going beyond 16 km only make up 11%.35 Thus, metro transport cannot play its important role in medium- and long-distance travel. In order to encourage long-distance travel, the metro ticket price was adjusted in September 2005. The basic price was raised from 2 Yuan to 3 Yuan, with 1 Yuan more for every additional 10 km. The new research report published in 2006 shows that the average waiting time and the onboard traveling time of metro passengers increased to 4 minutes and 16.8 minutes in 2005 from 3.2 minutes and 10.8 minutes in 2003 respectively. It means that the number of medium- and long-distance passengers increases with the increase in traveling time on the metro. Cost As it shows in Table 6.4.2, the cost of traveling by bus is the lowest for short-distance trips. The metro in Shanghai is now cheaper than other public transport modes for long-distance trips (longer than 20 km), and it also has speed and frequency. The metro can now provide higher efficiency and lower trips costs for medium- and long-distance travel than bus and car. However, the cost is still quite high for low-income people. The minimum two-way metro tickets will cost 17.7% of the daily income of lower paid people Shanghai.

Mobility for Development -Shanghai Case Study
80
Mode Standard of Charge Travel Cost (Yuan)
Basic Price Rate 3km 6km 10km 20km 30km 40km
Metro 3 Yuan/6 km 1 Yuan/10 km 3 3 4 5 6 7
Buses and Trolley
Buses (air
conditioning)
2 Yuan/13 km
0.20-0.25 Yuan/1
km (progressing
every 1 Yuan)
2 2 2 4 7 9
Taxi 11 Yuan/3 km 2.1 Yuan/1 km 11 17 26 47 68 89
Table 6.4.2: Public transport cost in Shanghai Source: http://life.people.com.cn/GB/1089/3684366.html - 11 Sep. 2005 http://www.jt.sh.cn/node110/node113/200609/con120161.htm http://www.jt.sh.cn/node41/200507/con116882.htm Note: Transfer preference is not considered. In order to encourage people to travel by public transport in Shanghai, a number of incentive measures have been carried out: • If the expenditure through the prepaid transport card exceeds 70 Yuan in a month, the
holder can benefit from 10% discount on the following ticket fare. • For the bus transfers realized within 90 minutes in the air-conditioned buses of the 409
bus lines, the passenger can benefit from a 0.5 Yuan discount per transfer. • For the transfer to metro from bus realized within 90 minutes, the passenger would also
benefit from 0.5 Yuan discount per transfer time. 6.4.2 Cost and efficiency for motorized vehicles Efficiency
index
Commercial Freight
Trucks Passenger Vehicle Motorcycle
1995 2004 1995 2004 2004
Total number (10 thousand) 11.9 18 12.1 49.8 80.3
% of travel making day 70 86 74 90
Trips /day 2.45 2.61 2.63 2.75 2.09
Average travel distance (km/trip) 21 29 19 20 12
Daily mileage(km) 52 75 51 55 25
Passenger occupancy 6.4 3.1 1.15
Table 6.4.3: Vehicle travel features, 1995-2004 Note: exclude freight taxi and special car for truck; exclude bus, taxi and special car for passenger vehicle. Generally the trips, the traveling time and the daily mileage of motorized vehicles have all increased from 1995 to 2004. Freight vehicles travel more and longer. Passenger vehicle occupancy rates decreased by half, while many passenger vehicles became private cars.
Mobility for Development -Shanghai Case Study
81
Cost The cost of car use in Shanghai includes vehicle purchase expense, license fee, and maintenance fee, fuel expense, parking fee, road toll and road pricing. By the price index of consumption, the price of transport vehicles are coming down year by year, in contrast the operating cost is higher and higher. The price index of transport vehicles was 97.9 in 2001 and 91.3 in 2006 (see Appendix I, Table 9). Since the auction system of vehicle license plate was adopted in Shanghai, the average price of car license plate has increased although the government has adjusted the released number of license plates according to the deal price. As the number of cars in city will be continually controlled, the license plates will not be released in large amounts. The estimated price will be very high. (Figure 6.4.2)
0
10 000
20 000
30 000
40 000
50 000
60 000
70 000
80 000
2001 2002 2003 2004 2005 2006year
num
ber o
f rel
ease
0
5 000
10 000
15 000
20 000
25 000
30 000
35 000
40 000
45 000
aver
age
pric
e(yu
an)
number of release average price(yuan)
Figure 6.4.2: Car license auction in Shanghai Source: http://www.alltobid.com/chepai/chepaisi.htm Based on the price index of fuel purchase in Shanghai, fuel prices have increased greatly since 2003. The rise of fuel price directly results in the increased cost for traveling by car (see Figure 6.4.3).
.0
50.0
100.0
150.0
200.0
250.0
300.0
1996 2000 2001 2002 2003 2004 2005 2006
year
PUR
CH
ASIN
G P
RIC
E IN
D(1
995=
100)
Figure 6.4.3: Fuel price index (1995=100) Source: Shanghai Statistical Yearbook 2007
Mobility for Development -Shanghai Case Study
82
Land is a limited resource for urban development in Shanghai. Due to the rise of land price, the parking charge will continually keep a high level and is highest among Chinese cities (see Appendix I, Table 10). In Shanghai, every month, vehicle owners in urban area should pay the road use charges and road maintenance fee, as it can be seen in Table 6.4.4 and Table 6.4.5. The general level of road tolls in Shanghai is lower than that in Beijing and Nanjing (Table 6.4.5), but that for car and motorcycle is relatively higher. In addition, the road use charge is fixed and paid every month in Shanghai, while, in other cities, it is levied according to road usage. As a result the overall cost for urban road use is higher than that in Beijing and Nanjing.
Freight Trucks Passenger Vehicles Trailers Motorcycles
Maintenance 190 200 110 30
Road Using Charge 135 150 38.5 15
Table 6.4.4: Maintenance and road use charges in Shanghai (Unit: Yuan/ton/month) Source: Shanghai Municipal People's government Order No. 119, the Regulations on the Control of Shanghai highway maintenance (Revised) Shanghai Municipal People's government Order No. 102, the Regulations on the Control of Shanghai road tolls on loans road Note: for passenger vehicles, 10 seats=1 ton; the unit for motorcycles is Yuan per month
Type unit Beijing Shanghai Nanjing
Passenger Vehicles Yuan/month/ton 220 200 260
Freight Trucks Yuan/month/ton 220 190 200
Motorcycles Yuan/month/vehicle 15 30 14
Besides: car with less than 5
seats Yuan/month/vehicle 120
Passenger Vehicles with less
than 5 seats Yuan/month/vehicle 200
Table 6.4.5: Maintenance in Beijing, Shanghai and Nanjing Source: Shanghai Municipal People's government Order No. 119, the Regulations on the Control of Shanghai highway maintenance (Revised) http://www.ylfzhj.bj.cn/jsp/display.jsp?colid=0402&id=ID031218000 http://www.njjtgf.cn/Lawsnews.aspx?classcode=/LAWS/YLF/ Note: for passenger vehicles,10 seats=1 ton Shanghai levies different road charges upon vehicles of local area and from other cities. Comparatively, the latter should pay higher road charges. The charge that vehicles from other cities should pay in Shanghai is as 3-5 times as that in Nanjing. The road toll of freeway in Shanghai is the same as that in Guangzhou. (Appendix I, Table11-12).

Mobility for Development -Shanghai Case Study
83
6.4.3 Cost of urban occasional freight transport In terms of urban freight transport cost, the price of the goods delivering taxi service could be a credible reference. It gives an idea on the general situation of the urban logistics industry in Shanghai.
Mode
Standard of Charge Calculation of Travel Cost (Yuan)
Basic Price
(Starting Price) Rate 3km 6km 10km 20km 30km 40km
Freight
Taxi(0.6T) 18 Yuan/3 km 2.5 Yuan/1 km 18 26 36 61 86 111
Freight
Taxi(0.9T) 23 Yuan/3 km 3.0 Yuan/1 km 23 32 44 74 104 134
Table 6.4.6: Freight transport costs in Shanghai Source: http://www.jt.sh.cn/node41/200507/con116882.htm The goods delivering taxi service was initiated by the proposal of municipal government in August 1999. Five enterprises were created. The vehicles are recognizable by the model, the color and the taxi indicators installed. And the local authority conferred a special license plate started with BH to these vehicles. As with the ordinary taxi for passengers, the vehicles are equipped with the counter and the tariff of service is regulated by the authority; who keeps the prices at a relative low level. In 2004, the number of goods delivering taxis reached 2,800 from 380 at the beginning. This service became the main commercial mode for the goods transports and delivery in the urban area in the daytime, as the truck can only go into the central city after evening. A lot of commercial enterprises have entrusted these taxi companies with their logistics work, which makes 45% of the business volume for the taxis. The remainder is made up of more occasional goods delivery services for individuals or enterprises.
6.5 Efficiency and cost of intercity transport In recent years, road freight transport suffered the problems like poor communication between the demand and offer, the rise of charge for road pricing and fuel.36Since 2002, the annual output per vehicle in freight transport in Shanghai decreased year by year. (Figure 6.5.1) However, due to the limited capacity of railway transport, the road system takes the main role for freight transport on land, which is still developing and ranked first among all kinds of transport modes before 2005.

Mobility for Development -Shanghai Case Study
84
020 000
40 00060 000
80 000100 000
120 000140 000
160 000180 000
200 000
1996 1997 1998 1999 2000 2001 2002 2003 2004 2005year
annu
al to
nnag
e(1
000
tons
.km
)
Figure 6.5.1: Annual ton-kilometers of each truck (1,000 ton-km) Source: Shanghai Statistical Yearbook on Industry, Energy and Transport 1997-2006 There are two railway transport lines linking to other parts of mainland China: Shanghai-Nanjing (to the north) and Shanghai-Hangzhou (to the south). In 2004, there were 94 pair passenger trains and 50 pair freight trains per day in the peak traffic period on the Shanghai-Nanjing Line. Real traffic is 119% and 111% of the planned traffics respectively. The limited transport capacity becomes the main trouble for the railway transport development. After the fifth promotion of train speed, the highest speed of passenger trains reached 160 km/hour, while we can only travel on highway transport at 110 km/hour. The efficiency of railway transport has been greatly enhanced. (Appendix II, Figure 8-10) Showed by the railway transport index, such as rate of on-time departure of freight trains, rate of on-time departure of passenger trains, trains loaded per day, running speed of freight trains, and waiting time for freight transfer, the efficiency of railway freight transport keeps steady growth, but the facilities have been fully explored, so the potential of increasing railway transport efficiency would be limited without the construction of new infrastructure. 6.5.1 Cost of highway and railway freight Take the transport cost of one-ton container for example. An analysis is made of the transport cost and time for several freight companies from Shanghai to get to Beijing, Guangzhou, Hangzhou and Nanjing by highway and railway. Obviously, in the long-distance transport (to Beijing and Guangzhou), the cost for railway is much less than that for highway, but it takes longer time than by truck. While in short-distance transport (to Hangzhou and Nanjing), the road is cheaper and much less time consuming. The freight companies rarely provide short-distance railway transport service.
Mobility for Development -Shanghai Case Study
85
Highway Freight Transport Price and Time Consuming
Destinations
Distance Company
A
Company
B
Company
C
Company
D
average
price(Yuan)
Time
Consuming
(day) km
Beijing 1,394 450 400 400 400 413 3
Guangzhou 1,613 580 550 550 450 533 3
Hangzhou 190 280 220 200 190 223 1
Nanjing 295 300 240 250 230 255 1
Railway Freight Transport Price and Time Consuming
Destination Distance
Company A Company E average
price(Yuan)
Time Consuming
(day) Km
Beijing 1,463 300 400 350 3~4
Guangzhou 1,810 300 380 340 4~5
Hangzhou 203 -- -- -- --
Nanjing 301 -- 380 380 2
Table 6.5.1: The cost of transporting one ton of goods by Shanghai freight companies Source: http://www.szy56.com/wfbj.asp http://www.szy56.com/wfbj8.asp
http://www.021huoyun.net/cn_dl.htm
http://guoaohuoyun.do56.com/
http://www.021wuliu.com/bangchang1/glys.asp
http://www.qlm56.com/yunjia.htm
6.5.2 Cost of highway and railway passenger transport By analyzing the ticket fare and transport speed of the highway and railway from Shanghai to Hangzhou, Nanjing, Beijing and Guangzhou, the cost and efficiency of railway passenger transport is better than that of highway passenger transport. After the fifth promotion of train speed, the Ministry of Railway confirms faster speed with the same ticket price. The cheapest ticket is about one-fourth of highway transport. In contrast to the limited capacity of railway transport, highway transport capacity is much more abundant and becomes a favorable supplement to railway. At the same time, the highway transport is more flexible, so it still achieves fast development although its transport fee is higher. Taking Shanghai-Hangzhou for example, it is very difficult to buy a train ticket during the rush hour in the weekend. Many people choose to travel by long-distance coaches.
Mobility for Development -Shanghai Case Study
86
Service(times/day) Distance(km) Fare (Yuan) Fares per distance(Yuan/km) speed(km/hrs)
Railway Highway Railway Highway Railway
Highway Railway
Highway Railway
Highway lowest highest lowest highest lowest highest
Hangzhou 67 107 203 176 15 90 60 0.07 0.44 0.34 85 130 80~100
Nanjing 76 27 301 306 24 130 97 0.08 0.43 0.32 60 130 80~100
Beijing 10 3 1 463 1 262 88 500 311 0.06 0.34 0.25 65 135 80~100
Guangzh
ou 5 5 1 810 1 797 160 600 376 0.09 0.33 0.21 60 110 80~100
Table 6.5.2: Highway and railway passenger transport service between Shanghai and major cities Source: http://www.123cha.com/train/html/Shanghai/shanghai.html http://www.tixcn.com/
6.5.3 Aviation transport The capacity of aviation transport in Shanghai has been developed greatly, and the growth rate of passenger and freight transport kept above 10% every year. Since the opening of Pudong international airport, the number of linked cities and departure flights is increasing year yearly. The average distance traveled expanded from 1,974 km in 2000 to 2,600 km in 2006. And the overall service of Shanghai’s airports has been greatly increased. (Appendix II, Figure 11-13) In recent years, domestic civilian aviation companies have seen great development, which brings about a differentiation of ticket fares and lowers effectively the cost of transport. An inquiry on 23 July 2007, shows the price of single ticket and the number of departure flights on this day. The gap between the different flight fares is big. Travel by flight will no longer be the most expensive way, especially for domestic travel whose cost is lower than that of private car use on the freeway. (Table 6.5.3) Destinations Lowest Fare(Yuan) Highest Fare(Yuan) Number of Flights(a week)
London 2 250 28 720 36
Tokyo 1 890 5 030 209
New York 3 350 23 030 4
Hong Kong 1 000 2 400 400
Beijing 450 1 130 675
Guangzhou 420 1 280 204
Table 6.5.3: The fares and the number of flights of Shanghai civil aviation Source: http://www.qunar.com/twell/zh/city_flights/shanghai/index.htm
www.shanghaiairport.com
Note: The fare information comes from internet at July 23, 2007; the fare is for July 30, 2007
By analyzing the transport price of one-ton freight from Shanghai to Beijing, Guangzhou, Nanjing and Hangzhou, it draws the conclusion that the price of aviation transport provided by Shanghai freight companies is 7-8 times higher than that of highway transport, and 10 times

Mobility for Development -Shanghai Case Study
87
higher than railway transport. The transport price and linked cities of international freight flights of Shanghai aviation is shown in the Table 6.5.4.
Distance
(km)
Company A Company C average
price
Basic
Price
Yuan/kg
100kg
Yuan/kg
300kg
Yuan/kg
1ton
Yuan
Basic
Price
Yuan/kg
100kg
Yuan/k
g
300kg
Yuan/
kg
1ton
Yuan
1ton
Yuan
Beijing 1 178 5.9 4.2 3.8 3 306 5.9 4.1 3.5 3 506 3 406
Guangzhou 1 308 6.2 4.6 4.3 3 806 6.4 4.5 3.8 3 806 3 806
Nanjing 273 2.8 2.5 2.2 1 803 2.3 1.6 1.4 1 402 1 603
Hangzhou 176 3 2.2 2 1 803 1.9 1.3 1.1 1 102 1 452
Table 6.5.4: Shanghai airline domestic freight transport price list Source: http://www.szy56.com/wfbj6.asp
http://www.qlm56.com/yunjia1.htm
6.5.4 Water transport and ports Efficiency The development of sea shipping and ocean-going freight has kept a steady growth since 2001, especially the latter, which has grown from 79,900 ton-km to 112,900 ton-km, an increase of 41%. Port efficiency has also increased year on year. The average berthing time of ships in ports decreased by 67% from 1996 to 2006 and the average load per vessel has increased by 100%. The operating efficiency of water transport and port in Shanghai turns out very well and continues to be improved.
0
20
40
60
80
100
120
2000 2001 2002 2003 2004 2005year A
nnua
l Pro
duct
ion
per V
esse
l Ton
nage
(1 0
00 to
ns.k
m)
Annual Production per Sea-going Vessel Tonnage
Annual Production per Occan-going Vessel Tonnage
Figure 6.5.2: Annual production per vessel tonnage (1,000 tons-km) Source: Shanghai Statistical Yearbook on Industry, Energy and Transport 1997-2006

Mobility for Development -Shanghai Case Study
88
0.0
0.5
1.0
1.5
2.0
2.5
1995 1996 1997 1998 2000 2001 2002 2003 2004 2005
year
aver
age
berth
es ti
me
(day
)
Ships of Foreign Trade
Figure 6.5.3: Average time of vessels berthing at harbors (day) Source: Shanghai Statistical Yearbook on Industry, Energy and Transport 1997-2006
0
2 000
4 000
6 000
8 000
10 000
12 000
1995 1996 1997 1998 2000 2001 2002 2003 2004 2005year A
vera
ge T
onna
ge o
f Fre
ight
by
Each
Ves
sel
(ton
)
all ships Ships of Foreign Trade
Figure 6.5.4: Average tonnage of freight by each vessel (ton) Source: Shanghai Statistical Yearbook on Industry, Energy and Transport 1997-2006 Cost The Ministry of Communications of China started to implement the Freight on Record System from 1 January 1997. The companies who provide international marine shipping container transport services in Shanghai and Ningbo ports should report the transport price to Shanghai Shipping Exchange. There are about 78 marine shipping companies, including 14 well-known foreign shipping container companies. The prices are communicated to the public by the website “www.chineseshipping.com.cn”. According to the data released in the web site on 22 July 2007 (Table 6.5.5), short-distance shipping prices in Shanghai port are higher than those in Ningbo port; while inverse for long-distance shipping prices. As far as the average value is concerned, the Shanghai port holds an obviously advantageous position in the long-distance shipping transport. A 20-foot container transport price in Shanghai Port of international service is shown in Appendix I, Table 13.

Mobility for Development -Shanghai Case Study
89
Destination Departing Number of Statistical
Company Price (US dollar)
lowest highest average
Hong Kong Shanghai 4 60 180 106 Ningbo 3 35 100 55
Singapore Shanghai 7 345 600 487 Ningbo 3 265 400 330
Rotterdam Shanghai 7 1,150 2,500 1,364 Ningbo 4 1,050 2,500 1,450
Hamburg Shanghai 10 1,150 2,500 1,375 Ningbo 5 1,000 2,500 1,470
Table 6.5.5: 20-foot container transport price of Shanghai, Ningbo Port Source: http://www.chineseshipping.com.cn/filing/openprice.asp - 22 July 2007
6.6 Conclusions Concerning water and aviation transport, the efficiency of transport from Shanghai to the outside has achieved much improvement since 2001. The good management and operation of transport enterprises have led to an increase in profits since 2003. This has contributed to making Shanghai a world center of trade and shipping. Meanwhile, the further development of international trade in Shanghai will definitely boost the construction of the water and aviation transport industry and operating efficiency of the system. The development of the railway industry has been limited by its capacity. There is little potential to promote the overall transport efficiency without capacity extension, and its profits are relatively low. As far as road transport is concerned, the profit value has increased dramatically. But its future is not promising due to factors like transport cost and industry system. It should further integrate resources, enhance the level of information and networks, and lower transport cost in the future development. For intercity passenger transport, the limited space in the central area for road construction will become the problem for improving the operating efficiency of individual vehicles. Therefore, the improvement of intercity transport should depend on public transport with high capacity and a more efficient transfer system. It would also be an inevitable choice to meet the increasing demand of travel for the residents, characterized by the growth of travel distance and frequency, and the increasing expenditure on transport and communication.

Mobility for Development -Shanghai Case Study
90
7. Investment in Shanghai’s transport system
7.1 Brief Shanghai’s investments in transport are ahead of those of other major cities in China. The 10th Five Year Plan is the starting phase for implementing a new round of the master plan, as well as the key stage of constructing “Four Centers”. 37 It invests 80.04 billion Yuan in transport facilities, an increase of 74% compared to that in the 9th Five Year Plan. Investment for urban roads is 16.45 billion Yuan and 7.725 billion Yuan for bridges and tunnels respectively, which is the same as in the previous plan. Investment for highways is 20.92 billion Yuan, twice that in the 9th Five Year Plan. 34.94 billion Yuan for metro is an increase of 137% compared with before. The period of the 10th Five Year Plan is the high time for freeway development in Shanghai. It invests 23.1 billion Yuan and basically completes the freeway network. In addition, it is also the period for Shanghai to invest the most amount of money in constructing the international shipping hub, with 16.2 billion Yuan for port construction, which is 4 times as much investment in infrastructure facilities as in the 9th Five Year Plan and ranks the top in history. The key target of investment more focused on key transport infrastructure, such as the construction of a container port which attracts 15.3 billion Yuan, taking up 92.7% of the total investment. Shanghai’s economy is growing fast and investments in transport construction are continually expanding. During the period between 1996 and 2005, total investment for roads, highways and rail transport added up to 149.49 billion Yuan. It has been a powerful driver behind urban transport development.
Year GDP Total investment to transport
infrastructure
% of
GDP Investment of metro
% of
GDP
1996 290.22 8.682 2.99% 1.226 0.42%
1997 336.02 9.349 2.78% 2.479 0.74%
1998 368.82 9.635 2.61% 1.244 0.34%
1999 403.49 6.249 1.55% 2.927 0.73%
2000 455.12 11.439 2.51% 6.852 1.51%
2001 495.08 14.286 2.88% 6.4 1.29%
2002 540.88 21.966 4.06% 12.47 2.31%
2003 625.08 22.158 3.54% 8.99 1.44%
2004 745.03 21.577 2.90% 7.076 0.95%
2005 915.42 24.149 2.64% 10.5 1.15%
Table 7.1.1: Transport investment in Shanghai (billion) Source: Shanghai Statistical Yearbook, 1996-2005 Note: 2002 investments in the metro include magnetic levitation at 5.580 million. At the same time, the investment preference for transport is shifting from construction of urban roads to the metro. The proportion of investment in urban roads decreased from 40.4% in the

Mobility for Development -Shanghai Case Study
91
8th Five Year Plan to 21.37% in the 10th Five Year Plan. Comparatively, the investment in the metro rose from 20.8% to 50.2%.
Item
8th five-year 9th five-year 10th five-year
Investmen
t % of investment
Investmen
t % of investment
Investmen
t % of investment
Urban Road 8.34 40.40% 16.6 36.10% 16.45 21.37%
Bridge and tunnel 3.16 15.30% 7.92 17.20% 7.72 5.33%
Highway 4.84 23.50% 6.75 14.70% 20.92 23.10%
Metro 4.28 20.80% 14.73 32.00% 45.43 50.2%
Total 20.62 100.00% 46.0 100% 90.52 100.00%
Table 7.1.2: Investment in transport systems in Shanghai during the 8th, 9th and 10th five-year plans (in billions) Source: The third Comprehensive Transport Survey Report of Shanghai, 2004
Item Name Investment(Billion) Started(Year) Completion(Year)
Urban
Road Middle ring (Puxi) 4.03 2005
Metro
No.4 Line 12.8
No.7 Line 9.2 2005
No.8 Line 11.8
No.9 Line 10.9
Tunnel river tunnel 0.95 2005
Railway South Station of Shanghai 5.0 2006
Railway of Pudong 7.6 2005
Aviation Hongqiao Airport extension 15.3 2006
Pudong Airport extension 20.0 2005
Port Yangshan Deep sea Port (1st phase) 14.31 2005
Table 7.1.3: Recent major transport infrastructure construction in Shanghai
7.2 Investment in metro transport 7.2.1 Brief In the period of the 10th Five Year Plan, the major metro projects invested around 10 billion Yuan. This includes No. 4 metro line (12.8 billion Yuan), No. 8 metro line (11.8 billion Yuan), No. 7 metro line (9.2 billion Yuan) and No. 9 metro line (10.9 billion Yuan). According to the Shanghai Metro Basic Network, from now to 2012, the Shanghai Shentong Group will invest more than 160 billion Yuan to build up 13 metro lines with a total length of up to 510 km. They will form the basic network of metro transport in Shanghai and will carry 40% of the daily passenger, becoming the backbone of the Shanghai public transport system.

Mobility for Development -Shanghai Case Study
92
7.2.2 Reform of investment and financing system of Shanghai metro transport
In the period of the 10th Five Year Plan, Shanghai will spend 45.43 billion Yuan to construct the metro, equivalent to 1.37% of GDP. It is impractical to follow the old path to only employ the Shanghai Metro Company to take all of the work. Accordingly, the Shanghai government decided to deepen the reform of investment and financing system in April 2000, carrying out the reform of 4 Separations, namely separating investment, construction, management and supervision of the metro. It enforces the government managing function on public investment, drives the constructing and managing of metro into regulated, orderly and sound market competition, and sets up an effective government supervision system at the same time. On 28 April 2000, companies such as Shentong Group, Shanghai Metro Line Construction Co. Ltd., and Shanghai Metro Incorporation, Shanghai Modern Rail Transit Co. Ltd. were set up respectively. Shanghai Metro Line Construction Co. Ltd was set up to construct the metro. Shanghai Metro Incorporation was the department of management in metro. Shanghai Modern Rail Transit Co. Ltd was supervising the metro. Shentong Group was set up to be the principal part of investment in rail transport, owing assets and management rights. The 4 Separations solved the financing problem. In 2000, it was difficult to attract money to boost metro transport construction. After the foundation of Shentong Group, by means of shareholder of land, loan and financing and bond releasing, it formed a multi-source financing system, and the metro transport also expanded from single line to a network. When the financing problem was solved, new problems appeared, such as poor safety and supervision of metro system, different ticket systems in No.1, No.2 and No.3 metro lines, and inconvenience of metro transfer, etc. Therefore, the Shanghai Metro Line Company merged into the Shentong Group in 2004, which means that the investment body and construction body merged into one company, 4 years after the implementation of 4 Separations. 7.2.3 Investment and financing for constructed metro in Shanghai The main body for No.1 metro line includes Shanghai Jiushi Corporation and Shanghai Chengtou Corporation (called Chengtou Corporation for short in the following). The two companies took charge of financing for construction and reimbursement of the loan. No.1 metro line was transferred to Shanghai Shentong Group (called Shentong for short in the following) after construction. Then Shentong injected the assets of metro train and fare collection system of No.1 metro line into Shentong Metro which has been listed in stock market. The main body for No.2 metro line is Chengtou and districts Government Company along the line, who took charge of financing for construction and returning the loan. Chengtou put this investment into the stock of Shentong Group after the No.2 metro line was completed. The investment from the district along the line was purchased by Shentong Group. The main body for No.3 metro line is Shentong Group and districts along the line, which form the Shanghai Metro Transport Pearl Line Development Co., Ltd. Shentong Group controlled the project company. Afterwards, No.4 and No.5 metro lines follow the same mode of that of No.3 line.

Mobility for Development -Shanghai Case Study
93
The total investment for No.1 metro line is 5.744 billion Yuan (95%), while business loan is 0.3 billion Yuan (3%); total investment for No.2 metro line is 11.158 billion Yuan, among which the capital fund is 7.708 billion Yuan (69%), loan from foreign governments is 3.45 billion Yuan (31%) (Jiushi and Chengtou taking charge of borrowing and returning); total investment for No.5 metro line is 3.125 billion Yuan and is all a capital fund; the total investment for No.3 and No.4 metro lines is 22.56 billion Yuan, for which the capital fund is 7.1 billion Yuan (31%), the remainder is from project financing. Generally speaking, the first phase of metro transport construction mainly depended on investment from government. According to the regulation, the minimum fund prepared for new construction project will be 40% of the total investment. The proportion of the capital fund far exceeds the standard controlled by central government, so Shanghai’s government takes much pressure to raise capital fund in the past.
7.3 Conclusions The huge investments in transportation are only possible with the active role of the Shanghai government. Shanghai’s economy is growing fast, and investment in transportation construction has expanded continually. In the 10th Five Year Plan, Shanghai will invest 80.04 billion Yuan in transport facilities, an increase of 74% compared to that in the 9th Five Year Plan, on urban roads, highways, bridges, tunnels and the metro. It is because of the large scale investment lasting for quite a long time that the transportation systems in Shanghai have been upgraded tremendously. In the past, metro transport construction depended on investment from government, placing much pressure on them to raise the capital funds. The involvement of developers and local government in metro and road construction has proven to be the only way to sustain huge investments in metro transport infrastructure.
Comment from stakeholder dialogue: There is general consensus that mobility is in danger of significantly degrading in Shanghai due to the lack of integration as the urban area expands. It is not clear whether the situation is serious enough yet to drive an institutional response. Participants felt that more economic pain from a significant decline in competitiveness may be required.

Mobility for Development -Shanghai Case Study
94
8. Sustainable transport development challenges in
Shanghai After entering the 21st century with accelerated urbanization, Shanghai has experienced substantial development in both transport supply and operational efficiency, which are effectively facilitating local economic and social development. At the same time, the development of the transport system is closely connected with other aspects of sustainable urban development, including environmental protection, traffic safety, energy consumption and social justice. Therefore, it is necessary for the city of Shanghai to pay close attention to the issues related to coordination between social progress, natural resource use and environmental protection in the development of transportation.
8.1 Traffic safety In the 20 years from 1980 to 2000, the number of traffic accidents increased by 275%, with the death toll increasing 235%, and the economic loss by traffic accidents hitting 211 times that of 1980. After the RTA (Road Traffic Accident) surveillance system was completed in 2002, traffic safety measures have been gradually strengthened. Deaths, injuries and direct pecuniary losses from road traffic accidents in Shanghai have significantly decreased in recent years (more figures on tendency of traffic accidents conditions in Shanghai, please see Appendix II, Figure 14-15).
0
10 000
20 000
30 000
40 000
50 000
60 000
2002 2003 2004 2005 2006
year
num
ber
Accidents Amounts Death toll Injured
Figure 8.1.1: Traffic accidents in Shanghai from 2002 to 2006 In 2006, Shanghai’s RTA number was 6583, causing 1,231 deaths and 6,661 injuries, leading to 32.889 million Yuan in direct pecuniary losses; the RTA number dropped by 2655, or 28.74% over the previous year. The death toll and injuries decreased by 162 and 2,189 persons respectively, which is 11.63% and 24.73% lower than the previous year; the direct pecuniary loss decreased by 46.721 million Yuan, accounting for 58.69% of that in 2005; the death toll per 10,000 vehicles dropped from 6.6 in 2005 to 5.8 people.
Mobility for Development -Shanghai Case Study
95
8.1.1 Statistical analysis of road traffic accidents Age distribution
0
50
100
150
200
250
300
350
0- 7- 13- 21- 31- 41- 51- 61- 66-
age
deat
h to
ll
2002 2003 2004
Figure 8.1.2: Age distribution of people killed in traffic accidents Source: Survey on death and injuries in Shanghai traffic accidents from 2002-2004 and the strategies on prevention, Master Degree Paper, Shanghai Jiaotong University, 2005.4. The figure shows that the ages between 31 and 41 years old are high risk for RTA deaths. People of this age are exposed to heavy traffic (See Appendix II, Table 14). Vocation distribution Of the 32,452 accidents occurring from 2002 to 2004, 25.27% were from the transport industry. Among the dead, workers occupied the largest percentage (21.96%). Furthermore, since 2002, non-local people fatalities have increased each year. The increase of 109 cases in 2004 is 1.42 times that in 2002. Deaths and injuries of motorcycle riders, pedestrians and passengers Motorcycle injuries, at 1,500 and 2,500, remain the highest in the injured pool. Pedestrian and passenger injuries exceeded 1,000 people in 2002 and 2006. As for different areas, motorcycle rider deaths in urban areas were lower than that in rural areas every year except in 2005, which reflects the weakness in administration on rural motorcycle operations. In contrast, pedestrian and passenger deaths in urban areas exceeded that in rural areas, due to more turmoil in the road conditions in urban area (see Appendix II, Figure 16-17). Accident high-risk time The high-risk time is from 16:00 to 21:00 with 2,065 accidents, while from 7:00 to 9:00 has 702 accidents. The total accidents during these two periods accounted for 42% of the total number in 2006. According to statistics, since 2004, the high-risk periods for fatal accidents are at weekends. However accidents on weekends and holidays were under remarkable control in 2006.
Mobility for Development -Shanghai Case Study
96
8.1.2 Road traffic accident factors First, necessary traffic facility constructions have failed to keep up with the accelerated road construction in recent years, especially in the suburbs. In 2004, fatal traffic accidents in the suburban area accounted for more than 85% of all total accidents in Shanghai. Secondly, weak legal consciousness is the main subjective reason for frequent road accidents. Motor vehicle speeding, reverse driving, failing to keep safe distances and illegal lane changes are major factors causing accidents and fatalities. Statistics shows that these kind of accidents accounted for 16,244 cases or 59.9% of all kinds of accidents, leading to 421 deaths, representing 27.3% of the total death toll in 2004. In addition, driving without a license caused more accidents and the ratio of accidents caused by private vehicles rose due to the high ratio of accidents caused by fresh license holders. In 2006, accidents caused by new drivers with less than 3 years driving experience accounted for 1,493 with 264 deaths.
8.2 Environmental impact 8.2.1 Ambient air environment In 2006, there were 324 days rated as good-air quality in Shanghai. The good-air quality rate was 88.8%, 0.6% higher than in 2005. There were 321 days when inhalable particulates ranked as the top pollutants, accounting for 87.94% of the year; 27 days when SO2 became the top issue, 10 days when NO2 was the top pollutant, which accounted for 7.4%, and 2.74% of the year respectively. Five-year (2002-2006) monitoring data show that good air-quality was increasing on the whole. The good air-quality rate exceeded 85% from 2003 to 2006 continuously.
Comment from the stakeholder dialogue: Transportation will carry on developing, but at the same time the economic, social, and environmental issues will increase; the social impact is mainly through accident fatalities.
Mobility for Development -Shanghai Case Study
97
Inhalable particulates
0.07
0.08
0.09
0.1
0.11
0.12
2002 2003 2004 2005 2006year
mg/
m3
PMIO 2nd Standard
Figure8.2.1: Trend in inhalable particulates, 2002-2006 The annual daily average of inhalable particulates in urban areas was 0.086mg/m3 in 2006, which met the 2nd standard level specified in National Ambient Air Quality Standard (GB3095-1996), declining 0.002 mg/m3 from 2005. Sulfur dioxide The annual daily average density of sulfur dioxide (SO2) in the urban area was 0.051mg/m3 in 2006, which met the 2nd standard level specified in National Ambient Air Quality Standard (GB3095-1996), 0.010mg/m3 lower than in 2005. Five-year monitoring data showed that with the exception of 2005, the annual daily average density of SO2 in the urban area in the other four years was better than the 2nd standard level. However, the increasing tendency towards SO2 emissions is definitely due to fast economic growth and the associated demand on energy consumption.
0
0.01
0.02
0.03
0.04
0.05
0.06
0.07
2002 2003 2004 2005 2006year
mg/
m3
SO2 2nd Standard
Figure8.2.2: SO2 trends, 2002-2006
Mobility for Development -Shanghai Case Study
98
Nitrogen dioxide The annual daily average density of NO2 in the urban area was 0.055mg/m3 in 2006, which was compliant with the 2nd standard level specified in National Ambient Air Quality Standard (GB3095-1996), and which was 0.006mg/m3 lower than in 2005.
0
0.01
0.02
0.03
0.04
0.05
0.06
0.07
0.08
0.09
2002 2003 2004 2005 2006year
mg/
m3
NO2 2nd Standard
Figure 8.2.3: NO2 trends, 2002-2006
The recent five-year monitoring data showed that the annual daily average of NO2 in the urban area was better than the 2nd standard level. The overall level of NO2 emission was kept almost at the same level. Acid rain and dust In 2006 the average pH value of precipitation was 4.73 and the occurrence of acid rain was 56.4%, an increase of 16.4% compared to 2005. The annual average amount of dust citywide was 8.0 tons/km2 per month and the amount of dust on roads was 20.1 tons/km2 per month, which were 0.8 tons/km2 per month and 2.3/km2 per month lower respectively than in 2005.
4.2
4.4
4.6
4.8
5
5.2
5.4
5.6
2002 2003 2004 2005 2006year
pH v
alue
0%
10%
20%
30%
40%
50%
60%
acid
rain
fren
qenc
y
pH value Acid Rain Frequency
Figure 8.2.4: Acid rain frequency and precipitation pH value, 2002-2006 One report has estimated that 86% of CO and 81% of NOx are from urban vehicle emission in Shanghai.38 Data from the eighteen air quality survey stations along the major roads in Shanghai showed that sixteen stations measured NOx pollution levels over the national standards, and 12 stations reported a higher CO level over the national standards.39

Mobility for Development -Shanghai Case Study
99
8.2.2 Ambient acoustic environment In 2006, the areal noise met its corresponding functional requirement, while traffic noise failed to meet its corresponding functional requirement. Areal ambient noise In 2006, the average equivalent sound level for the areal ambient noise was 56.6dB (A) in the daytime, 0.7dB (A) lower than that in 2005. While at night, it was 49.7dB (A) which is 0.1dB (A) lower than the value in 2005. Five-year monitoring data showed that areal noise was compliant to the corresponding standards and the overall level of which kept stable.
0
20
40
60
80
100
120
>70 65-70 60-65 55-60 50-55 <50decibel
num
ber o
f mon
itorin
g po
int
number of monitoring point
Figure 8.2.5: Distribution of equivalent sound level of grid ambient noise in 2006
Traffic noise The average equivalent sound level of traffic noise during the day and night time on the roadsides in Shanghai was 72.0dB(A) and 64.9dB(A) respectively in 2006, the value in the daytime was the same as that in 2005 and the value of night time was 0.9dB(A) lower than in 2005. According to the latest five-year monitoring data, traffic noise failed to meet the corresponding functional requirement in all the years except the year of 2002. The tendency of the level of traffic noise from 2002 to 2004 was on the rise, and it was stable from 2004 to 2006. 8.2.3 Greenhouse gas emissions Data shows that SO2 emissions in Shanghai were 44.7 million tons, dust emissions were 10.7 million tons, and CO2 emissions were 138 million tons in 2002. With faster growth, CO2 emissions reached 150 million tons in 2004, 20 million tons more than 2000 and 12 million tons more than 2002. The relatively low energy efficiency, the higher proportion of coal consumption, the higher energy intensity of industry, rapid increase in motorized vehicles and other factors, all have significantly impacted on greenhouse gas emissions. Without further control, the air quality in Shanghai will be badly polluted, and the CO2 from the transport sector will continue to rise.
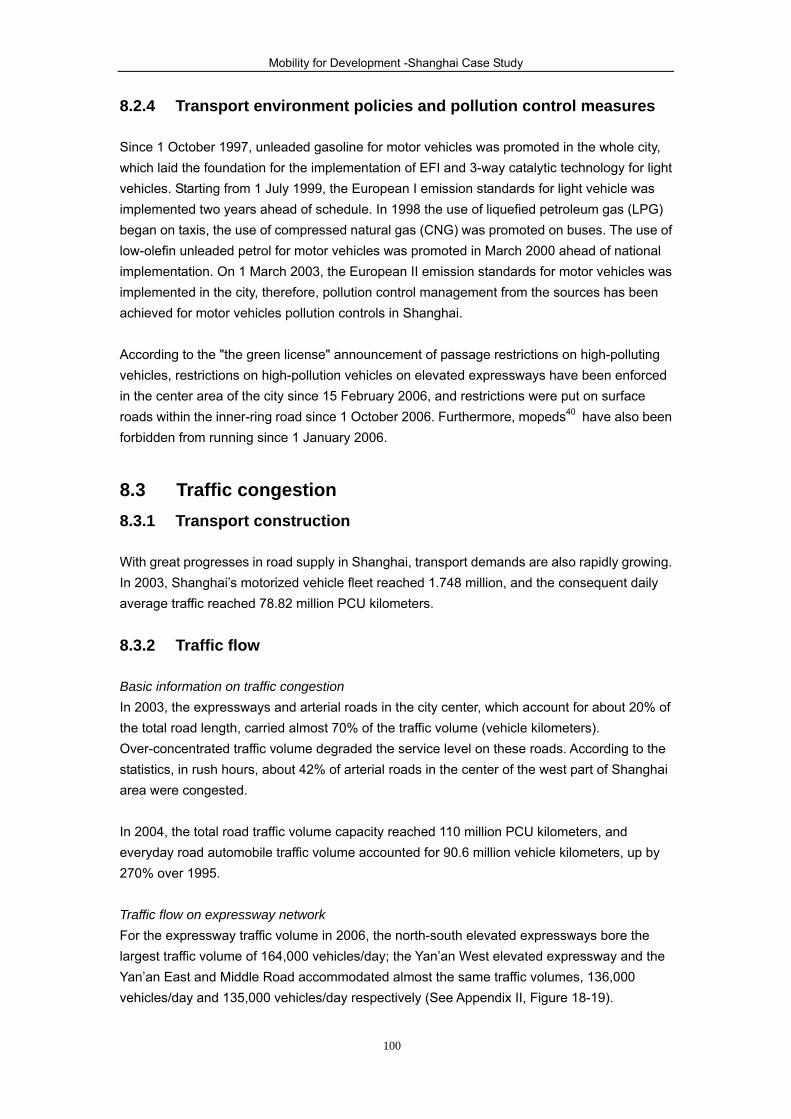
Mobility for Development -Shanghai Case Study
100
8.2.4 Transport environment policies and pollution control measures Since 1 October 1997, unleaded gasoline for motor vehicles was promoted in the whole city, which laid the foundation for the implementation of EFI and 3-way catalytic technology for light vehicles. Starting from 1 July 1999, the European I emission standards for light vehicle was implemented two years ahead of schedule. In 1998 the use of liquefied petroleum gas (LPG) began on taxis, the use of compressed natural gas (CNG) was promoted on buses. The use of low-olefin unleaded petrol for motor vehicles was promoted in March 2000 ahead of national implementation. On 1 March 2003, the European II emission standards for motor vehicles was implemented in the city, therefore, pollution control management from the sources has been achieved for motor vehicles pollution controls in Shanghai. According to the "the green license" announcement of passage restrictions on high-polluting vehicles, restrictions on high-pollution vehicles on elevated expressways have been enforced in the center area of the city since 15 February 2006, and restrictions were put on surface roads within the inner-ring road since 1 October 2006. Furthermore, mopeds40 have also been forbidden from running since 1 January 2006.
8.3 Traffic congestion 8.3.1 Transport construction With great progresses in road supply in Shanghai, transport demands are also rapidly growing. In 2003, Shanghai’s motorized vehicle fleet reached 1.748 million, and the consequent daily average traffic reached 78.82 million PCU kilometers.
8.3.2 Traffic flow Basic information on traffic congestion In 2003, the expressways and arterial roads in the city center, which account for about 20% of the total road length, carried almost 70% of the traffic volume (vehicle kilometers). Over-concentrated traffic volume degraded the service level on these roads. According to the statistics, in rush hours, about 42% of arterial roads in the center of the west part of Shanghai area were congested. In 2004, the total road traffic volume capacity reached 110 million PCU kilometers, and everyday road automobile traffic volume accounted for 90.6 million vehicle kilometers, up by 270% over 1995. Traffic flow on expressway network For the expressway traffic volume in 2006, the north-south elevated expressways bore the largest traffic volume of 164,000 vehicles/day; the Yan’an West elevated expressway and the Yan’an East and Middle Road accommodated almost the same traffic volumes, 136,000 vehicles/day and 135,000 vehicles/day respectively (See Appendix II, Figure 18-19).

Mobility for Development -Shanghai Case Study
101
Since its opening in 2000, the outer ring has experienced consistent growth in traffic flow, reaching 81,000 PCU/day, with the daily average traffic volume increasing by 10.7% every year. The traffic volume across the Suzhou River In 2006, apart from the medium ring bridges, the daily traffic flow across the river of the year reached 1.06 million vehicles/day, up by 10.5% over 2005.
0
200
400
600
800
1 000
1 200
2000 2001 2002 2003 2004 2005 2006year
traffi
c flo
w (1
000
pcu
/d)
traff ic f low (1 000 pcu/d)
Figure 8.3.1: Growth trend in traffic volume across the Suzhou River (including the medium ring road and bridge) Source: Road Traffic Report on Central City of Shanghai, 2006
Traffic across the Huangpu River In 2006, the daily traffic flow across the Huangpu river reached 554,000 vehicles/day, up by 14.6% over 2005.
0
100
200
300
400
500
600
2000 2001 2002 2003 2004 2005 2006year
traffi
c flo
w (1
000
pcu
/d)
traff ic f low (1 000 pcu/d)
Figure 8.3.2: Growth trend in traffic volume across the Huangpu River, 2000-2006 Source: Road Traffic Report on Central City of Shanghai, 2006
8.3.3 Traffic speed analysis Speed in city center According to Figure 8.3.3~4, the service level in the city center, especially on the expressways and arterial roads in the Puxi area, remained poor with the average speed on arterial road at 14 to 16 km/h.
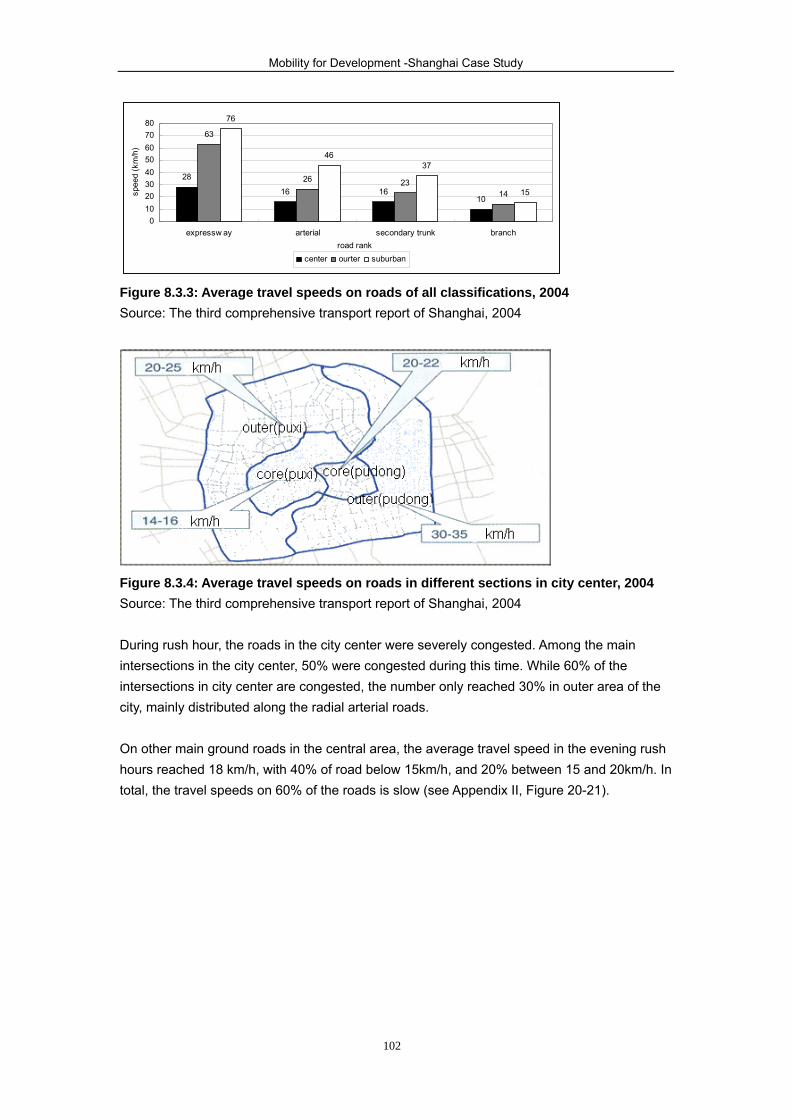
Mobility for Development -Shanghai Case Study
102
28
16 1610
63
26 2314
76
4637
15
01020304050607080
expressw ay arterial secondary trunk branchroad rank
spee
d (k
m/h
)
center ourter suburban
Figure 8.3.3: Average travel speeds on roads of all classifications, 2004 Source: The third comprehensive transport report of Shanghai, 2004
Figure 8.3.4: Average travel speeds on roads in different sections in city center, 2004 Source: The third comprehensive transport report of Shanghai, 2004
During rush hour, the roads in the city center were severely congested. Among the main intersections in the city center, 50% were congested during this time. While 60% of the intersections in city center are congested, the number only reached 30% in outer area of the city, mainly distributed along the radial arterial roads. On other main ground roads in the central area, the average travel speed in the evening rush hours reached 18 km/h, with 40% of road below 15km/h, and 20% between 15 and 20km/h. In total, the travel speeds on 60% of the roads is slow (see Appendix II, Figure 20-21).
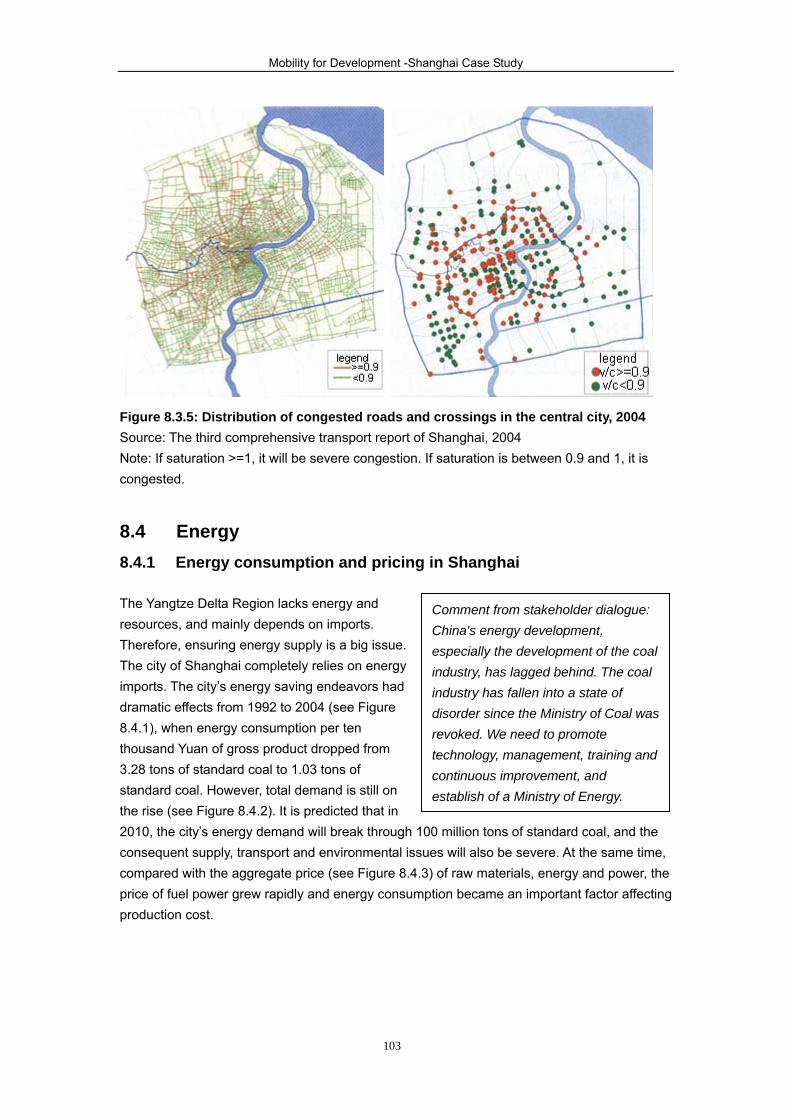
Mobility for Development -Shanghai Case Study
103
Figure 8.3.5: Distribution of congested roads and crossings in the central city, 2004 Source: The third comprehensive transport report of Shanghai, 2004 Note: If saturation >=1, it will be severe congestion. If saturation is between 0.9 and 1, it is congested.
8.4 Energy 8.4.1 Energy consumption and pricing in Shanghai The Yangtze Delta Region lacks energy and resources, and mainly depends on imports. Therefore, ensuring energy supply is a big issue. The city of Shanghai completely relies on energy imports. The city’s energy saving endeavors had dramatic effects from 1992 to 2004 (see Figure 8.4.1), when energy consumption per ten thousand Yuan of gross product dropped from 3.28 tons of standard coal to 1.03 tons of standard coal. However, total demand is still on the rise (see Figure 8.4.2). It is predicted that in 2010, the city’s energy demand will break through 100 million tons of standard coal, and the consequent supply, transport and environmental issues will also be severe. At the same time, compared with the aggregate price (see Figure 8.4.3) of raw materials, energy and power, the price of fuel power grew rapidly and energy consumption became an important factor affecting production cost.
Comment from stakeholder dialogue: China's energy development, especially the development of the coal industry, has lagged behind. The coal industry has fallen into a state of disorder since the Ministry of Coal was revoked. We need to promote technology, management, training and continuous improvement, and establish of a Ministry of Energy.
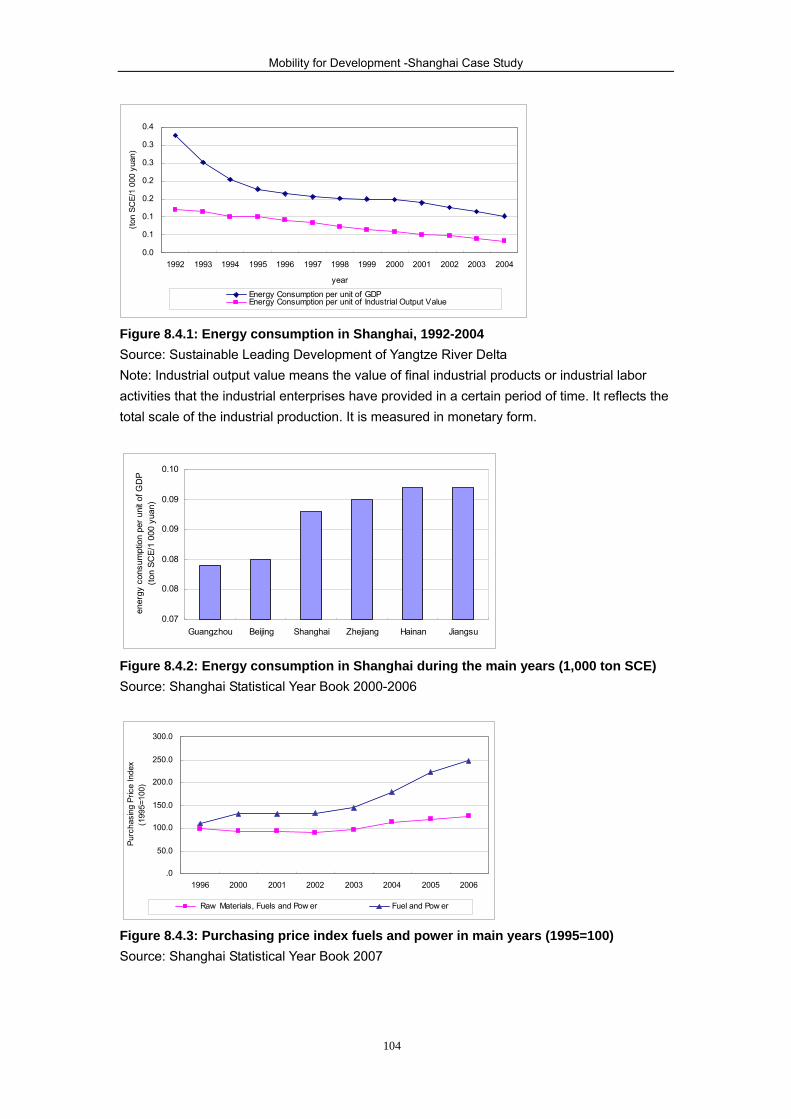
Mobility for Development -Shanghai Case Study
104
Figure 8.4.1: Energy consumption in Shanghai, 1992-2004 Source: Sustainable Leading Development of Yangtze River Delta Note: Industrial output value means the value of final industrial products or industrial labor activities that the industrial enterprises have provided in a certain period of time. It reflects the total scale of the industrial production. It is measured in monetary form.
0.07
0.08
0.08
0.09
0.09
0.10
Guangzhou Beijing Shanghai Zhejiang Hainan Jiangsu
ener
gy c
onsu
mpt
ion
per u
nit o
f GD
P(to
n SC
E/1
000
yuan
)
Figure 8.4.2: Energy consumption in Shanghai during the main years (1,000 ton SCE) Source: Shanghai Statistical Year Book 2000-2006
.0
50.0
100.0
150.0
200.0
250.0
300.0
1996 2000 2001 2002 2003 2004 2005 2006
Purc
hasi
ng P
rice
Inde
x(1
995=
100)
Raw Materials, Fuels and Pow er Fuel and Pow er
Figure 8.4.3: Purchasing price index fuels and power in main years (1995=100) Source: Shanghai Statistical Year Book 2007
0.0
0.1
0.1
0.2
0.2
0.3
0.3
0.4
1992 1993 1994 1995 1996 1997 1998 1999 2000 2001 2002 2003 2004
year
(ton
SCE/
1 00
0 yu
an)
Energy Consumption per unit of GDPEnergy Consumption per unit of Industrial Output Value
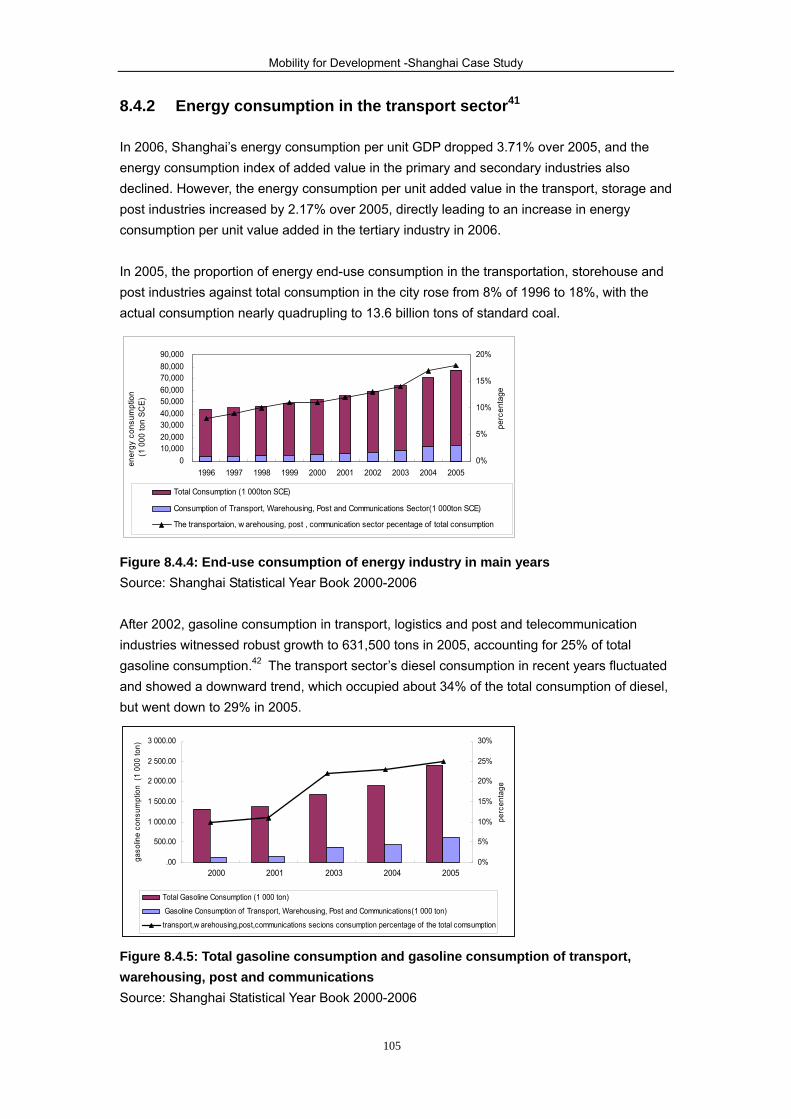
Mobility for Development -Shanghai Case Study
105
8.4.2 Energy consumption in the transport sector41 In 2006, Shanghai’s energy consumption per unit GDP dropped 3.71% over 2005, and the energy consumption index of added value in the primary and secondary industries also declined. However, the energy consumption per unit added value in the transport, storage and post industries increased by 2.17% over 2005, directly leading to an increase in energy consumption per unit value added in the tertiary industry in 2006. In 2005, the proportion of energy end-use consumption in the transportation, storehouse and post industries against total consumption in the city rose from 8% of 1996 to 18%, with the actual consumption nearly quadrupling to 13.6 billion tons of standard coal.
010,00020,00030,00040,00050,00060,00070,00080,00090,000
1996 1997 1998 1999 2000 2001 2002 2003 2004 2005
ener
gy c
onsu
mpt
ion
(1 0
00 to
n SC
E)
0%
5%
10%
15%
20%
perc
enta
geTotal Consumption (1 000ton SCE)
Consumption of Transport, Warehousing, Post and Communications Sector(1 000ton SCE)
The transportaion, w arehousing, post , communication sector pecentage of total consumption
Figure 8.4.4: End-use consumption of energy industry in main years Source: Shanghai Statistical Year Book 2000-2006 After 2002, gasoline consumption in transport, logistics and post and telecommunication industries witnessed robust growth to 631,500 tons in 2005, accounting for 25% of total gasoline consumption.42 The transport sector’s diesel consumption in recent years fluctuated and showed a downward trend, which occupied about 34% of the total consumption of diesel, but went down to 29% in 2005.
Figure 8.4.5: Total gasoline consumption and gasoline consumption of transport, warehousing, post and communications Source: Shanghai Statistical Year Book 2000-2006
.00
500.00
1 000.00
1 500.00
2 000.00
2 500.00
3 000.00
1 2 3 4 5
gaso
line
cons
umpt
ion
(1 0
00 to
n)
0%
5%
10%
15%
20%
25%
30%
perc
enta
ge
Total Gasoline Consumption (1 000 ton)
Gasoline Consumption of Transport, Warehousing, Post and Communications(1 000 ton)
transport,w arehousing,post,communications secions consumption percentage of the total comsumption
2000 2001 2003 2004 2005
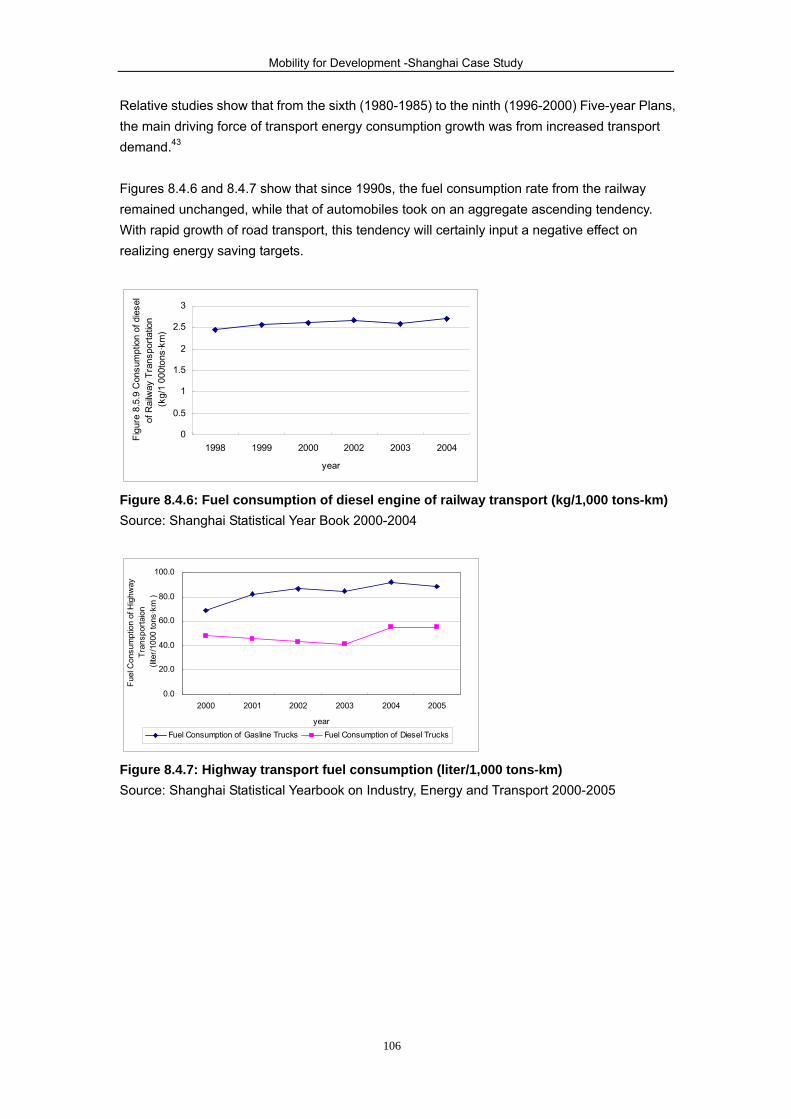
Mobility for Development -Shanghai Case Study
106
Relative studies show that from the sixth (1980-1985) to the ninth (1996-2000) Five-year Plans, the main driving force of transport energy consumption growth was from increased transport demand.43 Figures 8.4.6 and 8.4.7 show that since 1990s, the fuel consumption rate from the railway remained unchanged, while that of automobiles took on an aggregate ascending tendency. With rapid growth of road transport, this tendency will certainly input a negative effect on realizing energy saving targets.
0
0.5
1
1.5
2
2.5
3
1998 1999 2000 2002 2003 2004
year
Figu
re 8
.5.9
Con
sum
ptio
n of
die
sel
of R
ailw
ay T
rans
porta
tion
(kg/
1 00
0ton
s·km
)
Figure 8.4.6: Fuel consumption of diesel engine of railway transport (kg/1,000 tons-km) Source: Shanghai Statistical Year Book 2000-2004
0.0
20.0
40.0
60.0
80.0
100.0
2000 2001 2002 2003 2004 2005
year
Fuel
Con
sum
ptio
n of
Hig
hway
Tran
spor
taio
n (l
iter/1
000
tons
·km
)
Fuel Consumption of Gasline Trucks Fuel Consumption of Diesel Trucks
Figure 8.4.7: Highway transport fuel consumption (liter/1,000 tons-km) Source: Shanghai Statistical Yearbook on Industry, Energy and Transport 2000-2005

Mobility for Development -Shanghai Case Study
107
0 10 20 30 40 50
Consumption of dieseltruck in highw ayTransportation
Consumption of dieselengine in Railw ay
Transportation
Diesel Consumption (liter/1 000tons km)
Figure 8.4.8: Railway and highway transport diesel consumption, 2004 (liter/1,000tons-km) Source: Shanghai Statistical Yearbook on Industry, Energy and Transport 2005 The comparison of diesel consumption rate between railways and trucks in 2002- 2004 (Figure 8.4.8), indicates that railway transport had a much lower energy consumption than road transport. At the same time, the gap between the two proves that changes in the transport mode will greatly influence transport energy consumption. However a truck can provide door-to-door service, while a train cannot. But if there is a shift to more long distance freight by train, the overall situation will become more energy efficient. In the near future, the rapid growth in transport demand is expected to continue. Therefore, adjusting the mode of transport to lower rate of energy consumption and promoting renewable alternative energy will become the main ways to reduce GHG emissions. In Shanghai, public transport is playing an important role, which is quite favorable for energy savings. In addition the city needs to further enhance the rail and water transport and to expand their transport capacity. The city also needs to further promote environmental protection and energy saving standards in vehicles, and to actively promote the development and use of alternative energy sources.
8.5 Mobility Divide Improvements in urban transport facilities greatly enhance mobility with its two-fold effect. Urban transport construction plays a positive role in enlarging the opportunity of urban employment and living activities. However, improved mobility also segregates urban space and disrupts equality on the interest of different social group. 8.5.1 Urban space expansion by enhanced mobility Rail transport promotes the city’s spatial expansion Metro Line #1 is the north-south arterial of the mass transit network in Shanghai, opened in 1995 with a total length of 21 kilometers. It greatly enhanced the accessibility of the suburban area. From 1995 to 2000, one of Shanghai’s main expanded areas was located in Minhang

Mobility for Development -Shanghai Case Study
108
District in the southwest, where a lot of real estate investment was attracted. From 2000 to 2004, the southwest urban area was expanded continuously. The built-up area of Minghang District has extended to Chunshentang area, with the north border extending to Huanbei Road. In 2000, Metro Line #2 and LRT Line #3 were successively put into operation, greatly enhancing accessibility along the lines and accelerating expansion of the urban area in axial outwards. Suburban mobility enhancement by bus system improvement Since the 1990s, Shanghai has experienced substantial progresses in the planning, construction and management of public transport. Residents travel on buses with more comfort and transfer convenience than before. During 1995-2000, more than 20 kilometers of exclusive bus lanes were built up. But in the past, with expansion of the urban area, many residents moved to peripheral new communities with a “transport vacuum”, and suffered from great inconvenience to travel. To solve this problem, the Shanghai Municipal Urban Transportation Administration Bureau put focus on transport facility construction for the communities with over 5,000 residents. In 2006, nearly 180 new bus lines were created, extended or adjusted. In many places of Jinshan District and Fengxian District, bus lines were opened for the first time, and in Songjiang, Jiading, Fengxian and Baoshan Districts, many “rural bus” lines were connected to central city lines. 8.5.2 Segregation of urban space by enhanced mobility The elevated expressways as“申”sign divides the urban space into several parts, and weakened the uniformity of the city. With the construction of the medium ring, the whole city was completely divided. The construction of elevated expressways segregated the downtown area and completely destroyed the original connections within and between communities along the two sides of the expressways. 8.5.3 Urban interest differential by imbalanced mobility Mobility improvement affects residence of different social groups With the residential area development occurring along the main transport axis, the low-income families are being squeezed out by the higher earning newcomers to areas with poorer transportation, with the result that the low-income families will spend more time travelling. As an example, Hongqiao Road is a main transport axis running in the southwest, reaching Hongqiao Airport in the west and Huaihai West Road and Xujiahui sub-center in the east. With its obvious location advantages, the Gubei Residential Area for foreigners and Hongqiao Villa Area developed from east to west along this road, mainly for rich residents who often travel by cars. Furthermore, this high-income residential area extends along Huqingping Road in the west and across Yan’an West Road in the south. Due to developed road systems and insufficient public transport, the rich people with private
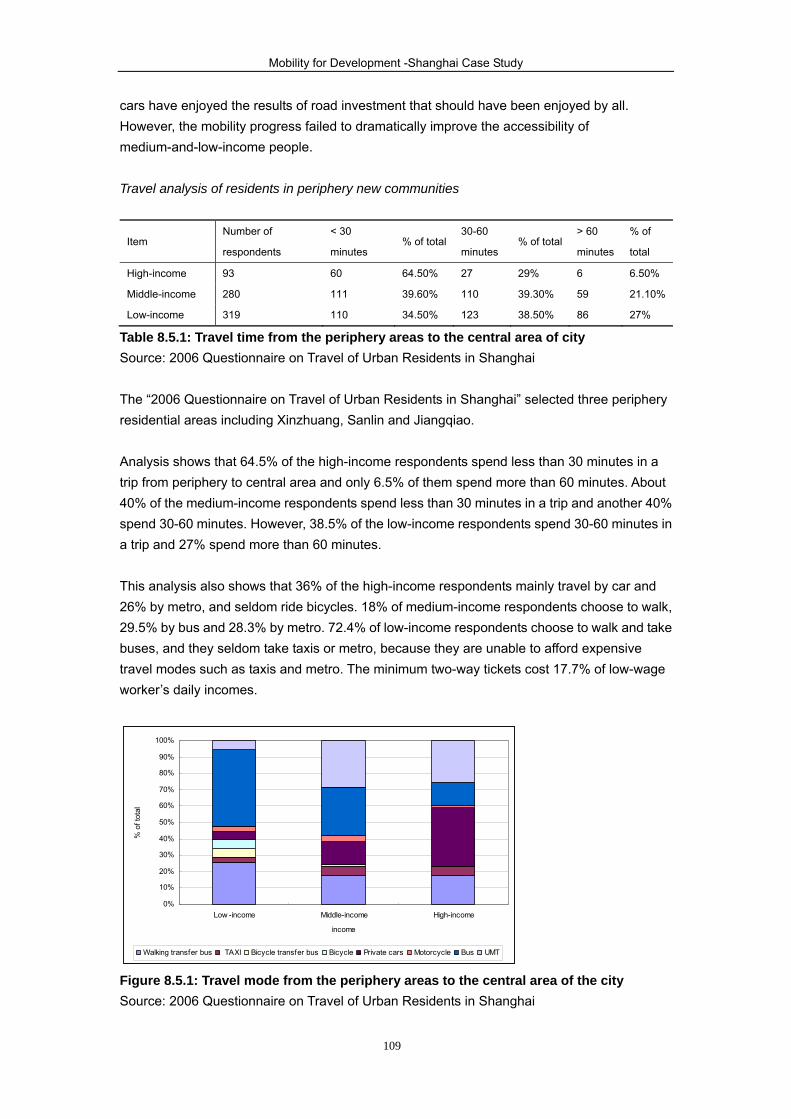
Mobility for Development -Shanghai Case Study
109
cars have enjoyed the results of road investment that should have been enjoyed by all. However, the mobility progress failed to dramatically improve the accessibility of medium-and-low-income people. Travel analysis of residents in periphery new communities
Item Number of
respondents
< 30
minutes % of total
30-60
minutes % of total
> 60
minutes
% of
total
High-income 93 60 64.50% 27 29% 6 6.50%
Middle-income 280 111 39.60% 110 39.30% 59 21.10%
Low-income 319 110 34.50% 123 38.50% 86 27%
Table 8.5.1: Travel time from the periphery areas to the central area of city Source: 2006 Questionnaire on Travel of Urban Residents in Shanghai
The “2006 Questionnaire on Travel of Urban Residents in Shanghai” selected three periphery residential areas including Xinzhuang, Sanlin and Jiangqiao. Analysis shows that 64.5% of the high-income respondents spend less than 30 minutes in a trip from periphery to central area and only 6.5% of them spend more than 60 minutes. About 40% of the medium-income respondents spend less than 30 minutes in a trip and another 40% spend 30-60 minutes. However, 38.5% of the low-income respondents spend 30-60 minutes in a trip and 27% spend more than 60 minutes. This analysis also shows that 36% of the high-income respondents mainly travel by car and 26% by metro, and seldom ride bicycles. 18% of medium-income respondents choose to walk, 29.5% by bus and 28.3% by metro. 72.4% of low-income respondents choose to walk and take buses, and they seldom take taxis or metro, because they are unable to afford expensive travel modes such as taxis and metro. The minimum two-way tickets cost 17.7% of low-wage worker’s daily incomes.
0%
10%
20%
30%
40%
50%
60%
70%
80%
90%
100%
Low -income Middle-income High-income
income
% o
f tot
al
Walking transfer bus TAXI Bicycle transfer bus Bicycle Private cars Motorcycle Bus UMT
Figure 8.5.1: Travel mode from the periphery areas to the central area of the city Source: 2006 Questionnaire on Travel of Urban Residents in Shanghai
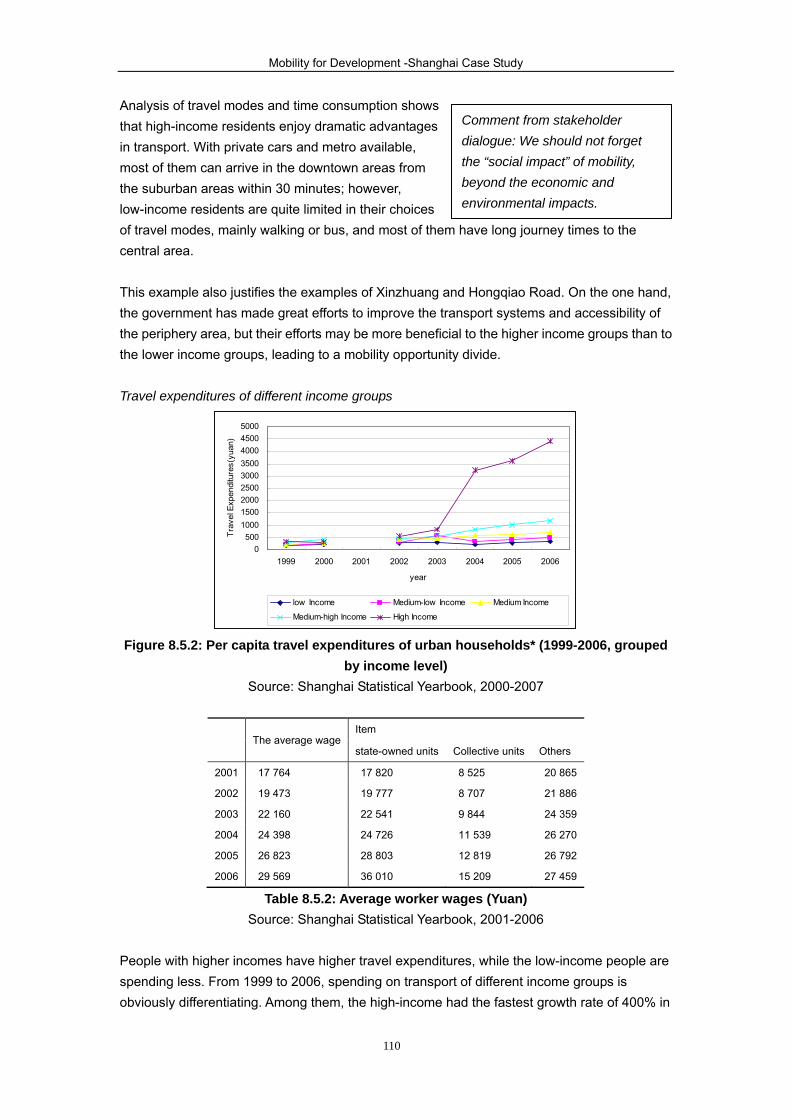
Mobility for Development -Shanghai Case Study
110
Analysis of travel modes and time consumption shows that high-income residents enjoy dramatic advantages in transport. With private cars and metro available, most of them can arrive in the downtown areas from the suburban areas within 30 minutes; however, low-income residents are quite limited in their choices of travel modes, mainly walking or bus, and most of them have long journey times to the central area. This example also justifies the examples of Xinzhuang and Hongqiao Road. On the one hand, the government has made great efforts to improve the transport systems and accessibility of the periphery area, but their efforts may be more beneficial to the higher income groups than to the lower income groups, leading to a mobility opportunity divide. Travel expenditures of different income groups
0500
100015002000250030003500400045005000
1999 2000 2001 2002 2003 2004 2005 2006
year
Trav
el E
xpen
ditu
res(
yuan
)
low Income Medium-low Income Medium Income
Medium-high Income High Income
Figure 8.5.2: Per capita travel expenditures of urban households* (1999-2006, grouped by income level)
Source: Shanghai Statistical Yearbook, 2000-2007
The average wage Item
state-owned units Collective units Others
2001 17 764 17 820 8 525 20 865
2002 19 473 19 777 8 707 21 886
2003 22 160 22 541 9 844 24 359
2004 24 398 24 726 11 539 26 270
2005 26 823 28 803 12 819 26 792
2006 29 569 36 010 15 209 27 459
Table 8.5.2: Average worker wages (Yuan) Source: Shanghai Statistical Yearbook, 2001-2006
People with higher incomes have higher travel expenditures, while the low-income people are spending less. From 1999 to 2006, spending on transport of different income groups is obviously differentiating. Among them, the high-income had the fastest growth rate of 400% in
Comment from stakeholder dialogue: We should not forget the “social impact” of mobility, beyond the economic and environmental impacts.
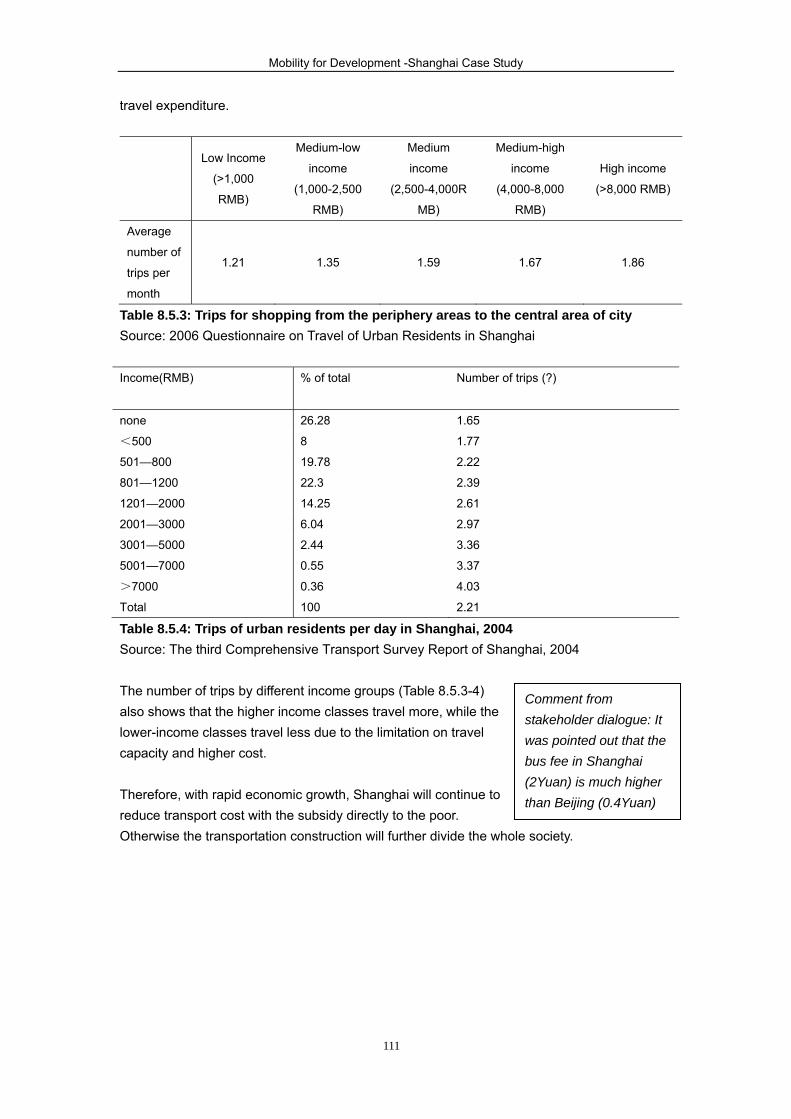
Mobility for Development -Shanghai Case Study
111
travel expenditure.
Low Income
(>1,000
RMB)
Medium-low
income
(1,000-2,500
RMB)
Medium
income
(2,500-4,000R
MB)
Medium-high
income
(4,000-8,000
RMB)
High income
(>8,000 RMB)
Average
number of
trips per
month
1.21 1.35 1.59 1.67 1.86
Table 8.5.3: Trips for shopping from the periphery areas to the central area of city Source: 2006 Questionnaire on Travel of Urban Residents in Shanghai Income(RMB) % of total Number of trips (?)
none 26.28 1.65
<500 8 1.77
501—800 19.78 2.22
801—1200 22.3 2.39
1201—2000 14.25 2.61
2001—3000 6.04 2.97
3001—5000 2.44 3.36
5001—7000 0.55 3.37
>7000 0.36 4.03
Total 100 2.21
Table 8.5.4: Trips of urban residents per day in Shanghai, 2004 Source: The third Comprehensive Transport Survey Report of Shanghai, 2004 The number of trips by different income groups (Table 8.5.3-4) also shows that the higher income classes travel more, while the lower-income classes travel less due to the limitation on travel capacity and higher cost. Therefore, with rapid economic growth, Shanghai will continue to reduce transport cost with the subsidy directly to the poor. Otherwise the transportation construction will further divide the whole society.
Comment from stakeholder dialogue: It was pointed out that the bus fee in Shanghai (2Yuan) is much higher than Beijing (0.4Yuan)
Mobility for Development -Shanghai Case Study
112
8.5.4 Reflections on the disadvantaged (1) Suburb resident travels The Public transport system in periphery areas is still far from developed, with many problems like insufficient bus lines; long headway and long waiting time; crowding on the bus; early ending of operation in the evening, improper station locations, etc. Therefore, only when better public transport service is provided for the disadvantaged living in the suburban area, can convenient mobility be ensured for the residents in more remote areas. According to the plans, by 2010, bus stations within a 500-meter service radius will cover urban areas, people can enter metro network by one bus from suburban area. (2) Preferential tickets By the end of June 2007, the city of Shanghai had implemented preferential ticket prices for transfer on all the 396 bus lines within the inner ring and new encouragement policies will be promoted soon. (3) Non-motorized vehicle system There are about 10 million bicycles in Shanghai. However, the number of bicycle lanes has been reduced, forcing bicycle riders to ride on sidewalks, posing potential conflicts. Enormous investments on urban transport facilities are car-oriented rather than human-oriented, so that the interests and rights of bicycle riders are seriously affected. In order to change this situation, “Research On Non-motorized Vehicle Transport Planning in Central City of Shanghai” was conducted in June 2006. Recently the number of electric bikes is growing very fast, due to the longer distance travel. New regulation for speed control is needed to ensure the safety.
8.6 Conclusions It can be concluded from the analysis above that motorization will bring more serious environmental problems. With the high density of buildings and population in the city center, people are more easily exposed to the concentration of pollution. Government should take action now to control the environmental problem. Road construction in the city center areas cannot relieve the congestion as expected. The growing number of motor vehicles and increased traffic volumes have degraded the road service level in recent years.
Comment from stakeholder dialogue: It would be better to act now rather than deal with various and increased negative impacts later, after they have become a reality.
Comment from Stakeholder Dialogue: Electric mopeds are getting more numerous in Shanghai, bicycles are more common in Beijing.
Mobility for Development -Shanghai Case Study
113
Also, motorization is becoming the major factor impacting energy consumption for the transport sector with increasing demand. The proportion of energy end-use consumption in the transport sector rose dramatically against total energy consumption. For a long time in the future, passenger and freight transport will continue to increase. Therefore, adjusting the mode of transport to lower the energy consumption rate and promoting renewable alternative energy will become the main ways to reduce GHG emissions. In Shanghai, to promote energy efficiency, rail transport needs more attention. Public transport is also quite favorable for energy savings. In addition, the city needs to further enhance rail and water transport and to expand their transport capacity. And the city also needs to improve environmental protection and energy saving standards in vehicles, and to actively promote the development and use of alternative energy sources. The bicycle is the most efficient mode of transport for short distance travel and energy savings. We must keep the bicycle system and the matching built environment. The big increase in transport expenditure may be affordable for the rich people but will limit opportunities for the poor, especially in rural and urban periphery areas where there are fewer jobs and services available and a direct subsidy is needed for them.
Mobility for Development -Shanghai Case Study
114
9. Policy and special issues
9.1 Analysis of Shanghai’s transport policy 9.1.1 Continue to strengthen key transport infrastructure construction In recent years, transport demands in Shanghai have rapidly increased, urban transportation facilities have become highly saturated, roads severely congested, and the density of suburban road network has remained low. Shanghai will continue to strengthen the construction of key transport infrastructure. But the main efforts will be put on mass capacity transport modes, such as the intercity express rail, the metro system and freight rail to link to the container ports. Public transport construction will be the key concern and investment will be prioritized to further metro construction during the Eleventh Five-year Plan.44 Shanghai will also gradually introduce an exclusive bus lane system. By 2010, there will be 300 km of exclusive bus lanes, together with 400 km of metro, constituting the backbone network of the urban public transport system. In terms of intercity passenger transport, the intercity express railway system will be gradually constructed so as to alleviate traffic tension on the Shanghai-Nanjing and Shanghai- Hangzhou corridors and to further consolidate the dominant role of railways in intercity passenger transport. Regarding freight transport system, the government will further strengthen the construction of high capacity roads and construct arterial freight transport networks connecting ports, airports, railway hubs, and logistics parks and advanced manufacturing estate. Apart from road projects, exclusive railway freight transportation lines, such as Pudong railway, are also under construction. Due to the difficulty of province-wide coordination between different government transport authorities, the highway is usually considered the simplest solution. However the limited land and geographical setting of Shanghai, is making it very difficult for Shanghai to provide enough traffic lanes to match the demand from the surrounding provinces for freight and passenger transport. As a result a comprehensive transport plan should be prepared to integrate the various transport modes over the whole GYDR.
Comment from stakeholder dialogue: We need to make overall plans and take all factors into the consideration for waterways, railways and other transport modes. The key point is the efficient use of resources, combined with the rational allocation of resources.
Comment from stakeholder dialogue: A new logistics center for containers outside Shanghai has been proposed. The containers would then go by rail to and from the port of Shanghai.

Mobility for Development -Shanghai Case Study
115
Comment from stakeholder dialogue: The example of Singapore was raised where high-density living is encouraged and car ownership discouraged. Hong Kong was raised as a city where the new towns are quite well integrated into the overall development plans
The construction of the metro is key to establishing a sustainable transport system in Shanghai. The metro construction plan is very ambitious. But success will not just be measured by its scale, but also by its impact on economic vitality and social justice. Will there be a huge government deficit? And will it be affordable within the limited family budget available? 9.1.2 Coordinating urban land use and transport Coordination of land use and transport will be key to sustainable development, during the process of Shanghai metropolitan spatial restructure. Shanghai will strengthen planning control and implement a transport impact analysis system. In accordance with the principle of “dual increases and dual decreases” (increasing in green space and public space, decreasing in building density and height in the city center), the government will strictly control the building floor space ratio and functional layout of buildings while using the capacity of the available transport facilities as part of the conditions for land development. It has been proven that land-use density and mixture are very important factors that impact on people’s travel mode choice. The urban planning control system, generally speaking, is working well to control unplanned and low-density development. However there is the scattered industrial land development in suburban Shanghai. Regulation should be strengthened to encourage land development at a relatively high density as well as mixed-use development, in order to promote public transport and reduce travel demands. Suburb development should be focused on the strategy of urban development guided by public transport, guaranteeing the land reserved for public transport interchange facilities and enhancing the capacity of transfer facilities to encourage new development along public transport corridors. Although the basic public transport service can be provided to the newly developed areas at the urban edge, lack of service frequency (even for the metro), lack of reliability (bus), and personal preferences with the growth in income, smarter mobility management schemes should be fully explored to shift the mode choice from cars. With the high building density and heavy traffic, the city center is heavily polluted along major traffic routes, where there are also many people. With the decline of the environmental quality, can we still keep the higher urban activity density in the city center where people will still prefer to
Comment from stakeholder dialogue: There is an incentive to sell as much land as possible to generate fiscal revenue, hence there is little incentive to go for high rise buildings and dense forms of land use, and industrial buildings tend to be single story in suburbs in China.

Mobility for Development -Shanghai Case Study
116
stay for living, working or recreation? Controls on vehicle emissions and guarantees for the quality of city center should be very important.
9.1.3 Control of motorized vehicles Controlling motorized vehicles has been a successful practice in Shanghai from the 1990s to keep the dynamic balance between road supply and increasing vehicle demand. It is a very unique public policy under the great pressure from the car industry lobby. With the accelerated construction of the urban road network, the government will still implement quota auctions on motorized vehicle licenses to control the amount of motorized-vehicles, thereby trying to keep the operations of road network at a reasonable service level. The government adjusts monthly licenses according to urban transport status and purchase prices of licenses. The license auction system also has its negative influences. Although the city implements policies such as travel limits on non-local licensed vehicles during rush hour on elevated expressways, the number of non-local licenses purchased by local residents has been growing by year, leading to an outflow of a large quantity of road construction and maintenance fees to other places. The city will consider other measures such as road congestion charging, fuel tax and parking limits as the main policy instruments in the future. With the increasing motorization in Shanghai (as the car license will be valid for a long time) the policy only delays over fast motorization, but what will happen in next ten or twenty years? A new taxation system should also be introduced to encourage people to buy a smaller car instead of a big car.
Comment from stakeholder dialogue: Land-use planning is seen as key to solving the mobility issues in Shanghai. Many of the issues related to land-use and transport integration in Shanghai are similar to the rest of China. There is a feeling that if this can be solved in Shanghai, China too may improve sustainable mobility in other urban cities.
Comment from stakeholder dialogue: Governments play an even more important role in developing countries as consumers have not yet reached the same environmental awareness and mainly want individual means of transportation.
Comment from stakeholder dialogue: Chinese people now tend to buy big cars instead of small cars, the media and policy should encourage the small car. Government vehicles should also be limited.

Mobility for Development -Shanghai Case Study
117
9.1.4 Building a multi-mode urban transport system based on public transport priorities
The municipal government has tried to promote transportation hub construction to consolidate public transport routes and network through these hubs, to improve transfer conditions and to expand service coverage area by the public transport system. By constructing transfer hubs, the city can more effectively link all transport modes, fully leveraging the advantages of various transport modes and building up a multi-modal urban transport system. The construction of the multi-modal transport system will face the challenge of institutional fragmentation, and the ability to coordinate the various stakeholders within Shanghai, the Yangtze River Delta region and central government will be critical to success.
9.1.5 Protect activity space for slow transport The government has tried to progressively guide long-distance bicycle rides to transform into public transport, improve traffic conditions and prioritize the bicycle functions for shorter trips and for connecting to public transport. It should further separate motorized and non-motorized traffic, create conditions for reconstruction and construction of bicycle lanes parallel to motor vehicle lanes and gradually form regional bicycle lane networks. It is also necessary to promote public parking facilities for bicycles in downtown areas and in public transport hubs. The government should strengthen regulations for mopeds and encourage moped/electric bicycle riders to take public transport. Highly polluting mopeds have been replaced. By the end of 2005, the city has eliminated the use of fuel moped for environmental concern. The bicycle is still the most sustainable mode of urban transport. Many services and job opportunities are still available for residents within bicycle (e-bike) range. The policy trying to transfer the long distance bicycle passenger to bus will be very difficult to realize. The slow speed of the buses and the coverage of metro lines cannot compete with the bicycle for short distance travel. In the last ten years with the 13% drop in bicycle share, congestion has not been improved. If we totally transfer the traditional built environment into wide streets and big blocks, can public transport provide the same mobility as the bicycle without an extra financial
Comment from stakeholder dialogue: Each stakeholder has a critical role to play to improve mobility:
• Governments should set a framework, provide education and investment for infrastructure
• Private companies can provide various mobility related technologies • Research institutions and universities can collect and analyze data, put trends in
perspective on urban planning, infrastructure and safety related issues, and develop research projects
• Media has also a critical role to provide a positive image of public transportation (e.g. in Bogota where they advocated in favor of the bus rapid transport system)
• Cooperation between these various organizations is needed.

Mobility for Development -Shanghai Case Study
118
burden to government? Or should we force people to use the car even for short distance travel? The characteristics of the walking and bicycle oriented built environment is very important now for more sustainable mobility. Can the bike keep its mode share is the challenge. 9.1.6 Traffic management The operation of “unblocking the road” has greatly improved the traffic management ability of local government and the physical quality of traffic infrastructure, such as the CCTV system with many monition camera and traffic counting loops has been widely installed, the road intersection has been widened in order to speed up the traffic. However, the operation could not be considered a successful on the whole. The traffic management measure, the software, had not been fully explored as suggested in the dialogue, such as the flexible working hours schedule, updating the traffic signal, etc. The achievement of information technology can also greatly improve the efficiency of the existing transport infrastructure and make the transport more accessible and more transparence for passenger and freight movement.
9.2 Key transport infrastructure construction 9.2.1 Hongqiao transport hub station T he next World Expo will be held in Shanghai in 2010 and it is estimated there will be 70 million visitors. To accommodate the extra demands, several projects are under construction or in planning, such as the Hongqiao airport transport hub, intercity rail system etc. The Hongqiao transport hub station is scheduled to be put into use in 2009, occupying an area of 13.22 km2. After its implementation, it will integrate modernized transport facilities including Beijing-Shanghai Fast Train, Shanghai-Hangzhou Maglev Line, Pudong Maglev Line and five metro lines. It will become the important channel for Shanghai to reach the whole country and play an important role for development of the tertiary industry in Shanghai.45 9.2.2 Shanghai-Hangzhou maglev line The Shanghai-Hangzhou Maglev Line is under planning and will extend for about 175 kilometers. The total project budget is about 35 billion Yuan. The Zhejiang section will extend for about 105 kilometers, all elevated, to Hangzhou East Station via Jiaxing Station. The Shanghai-Hangzhou Maglev Line is defined as urban-suburban line, with its normal speed reaching 450 km/h although it will run less than 200 km/h in the central city.46 According to the original schedule, this project should be finished in 2008 and put into operation in 2010 before Shanghai Expo. However, due to the lack of an environmental assessment, progress on this project has been delayed.
Comment from stakeholder dialogue: ITS should be encouraged in improving urban mobility for car traffic and also for public transport, such as in Europe and South Korea.

Mobility for Development -Shanghai Case Study
119
9.2.3 Intercity railway planning in Yangtze River Delta region In 2004, Yangtze River Delta region intercity passenger travel was over 2 billion passengers. It is predicted that by 2010, this number will increase to 3.05 billion, and reach 5.5 billion in 2020. A “Plan for Intercity Rail Network in Round Bohai Area of Beijing, Tianjin and Hebei Province, Yangtze River Delta region and Pearl River delta region” has been draw for the period from 2005 to 2020 The target of theses plans concerning the GYDR is set up to construct main framework of intercity rail transport network with Shanghai as the center, Shanghai-Nanjing and Shanghai-Hangzhou lines as the wings. The networks will cover main cities in the regions and develop 1-2 hour urban circular space around the cities of Shanghai, Nanjing and Hangzhou By 2020, the total mileage of intercity rail transport will reach 815 kilometers. Intercity rail transport in the Yangtze River Delta region will be operated like a city bus in frequency and ticketing. The train will travel at 250-350 km/h. The Shanghai-Nanjing intercity express train will travel for 80 minutes while the trains stopping at major stations will travel for 96 minutes; The Shanghai-Hangzhou intercity express train will travel for 45 minutes while the trains stopping at every station will travel for less than 60 minutes; the space and time distances between cities will be greatly shortened.47
9.3 Transports during Shanghai Expo 2010 During 184 days of Shanghai Expo in 2010, the visitors per day, per peak day and per extreme peak day are anticipated at 400,000, 600,000 and 800,000 respectively. A survey shows that the visitor distribution by day will be extremely uneven. Without any transport demand management in May, daily average visits will reach about 800,000. So the potential transport demand on extreme peak days will be ever higher. Therefore in both transport and accommodation, the demand will exceed Shanghai’s capacity to receive so many visitors. As a result the transport should be carefully planed and managed. (1) Construction of metro transport Three metro lines will connect to the Expo site with a carrying capacity of 78 000 passengers/hour. (2) Bus lane for city bus and Expo bus Shanghai will try to build a 300-kilometer exclusive bus lane (110 kilometers in central area) by 2010. The driving speed could reach above 15 km/hour in rush hours, with rate of punctuality up to 90%. During Shanghai Expo 2010, exclusive bus lane for Expo will be set on the middle ring to provide routes for coaches with large carrying capacities directly to the entrance of Expo site.

Mobility for Development -Shanghai Case Study
120
(3) Water bus People can also take boats to go around the Expo site in 2010. Several water gates will be constructed. About 5-8% of the visitors will get to the Expo site by boat. (4) P+R (Parking + Ride) hubs Shanghai will also construct transport transfer hubs with large capacity. There will be several transfer gates for people to park their car far away from the expo site and take public transport to the site. (5) Accommodation service in the peripheral new towns There will be a huge demand for accommodation during the Expo period. There are not enough hotel beds for all of the visitors. We should think of building accommodation facilities in the peripheral new towns and also providing good public transport linkage from the new towns to the expo site. This strategy will also be consistent with the Shanghai metropolitan spatial strategy to encourage the development in suburban town. The transport plan of Shanghai Expo 2010 is not only aimed at the success of the half year event, but also to upgrade the transport system for the whole city. Shanghai will grasp this opportunity to construct a multi-modal transport system, including entirely upgrading the transport system and smoothly integrating urban and rural areas.
Figure 8.6.1: Mass transit network plan in Yangtze River Delta area Source: On Mid-Hub-City and Subsidiary-Hub-Cities of N-H Line

Mobility for Development -Shanghai Case Study
121
9.4 Conclusions Among Shanghai’s transport policies, the practice to put public transport as a priority, control automobile development, protect slow transport and build a multi-modal transport system will certainly benefit sustainable development of the urban transport system. At the same time, the policy to focus on freeway construction and to comparatively overlook the construction of national and provincial roads had led to problems in that the transportation capacity of national roads is saturated while the freeway flow is too low in some sections. So there are still challenges in achieving operational efficiency and sustainability of the transport system. For future development, urban transport policies should be weighted towards aggregate efficiency and capacity as well as environmental influences. This needs coordination. The World Expo in 2010 provides an opportunity to upgrade and integrate the Shanghai urban transport system within the Yangtze River Delta Region.
Comment from stakeholder dialogue: Shanghai may be heading for a crisis. The planning authority needs to exercise control over a larger area than the current administrative boundaries. “The planning authority needs to be sized appropriately to the mobility issues they are trying to solve”
Appendices
122
Appendices
Appendix I - Tables
Cargo throughput
(thousand tons) Proportion of the Yangtze River Delta Proportion of Nation
Shanghai 443 170 32.79% 13.11%
Ningbo 268 220 19.85% 7.94%
Zhoushan 90 520 6.70% 2.68%
Nanjing 105 000 7.77% 3.11%
Suzhou 119 000 8.81% 3.52%
Nantong 83 000 6.14% 2.46%
Zhenjiang 58 000 4.29% 1.72%
Hangzhou 46 260 3.42% 1.37%
Huzhou 35 420 2.62% 1.05%
Jiangyin 42 780 3.17% 1.27%
the Yangtze River Delta 135 135 39.98%
Table 1: Cargo throughput of main ports in the YRD in 2005 Source: Development report of the YRD in 2006: functional relationships among cities in the evolution
City National rankings of
passenger throughput
Passenger throughput
ranking in the YRD
Passenger throughput
( thousand)
The proportion in
the nation
Shanghai
Pudong 2 1 23 665 8.32%
Shanghai
Hongqiao 4 2 11 797 4.15%
Hangzhou 8 3 8 092 2.85%
Nanjing 15 4 5 385 1.89%
Ningbo 28 5 2 532 0.89%
Wuxi 48 6 619 0.22%
Zhoushan 53 7 397 0.14%
Changzhou 58 8 316 0.11%
Huangyan 64 9 225 0.08%
Nantong 83 10 89 0.03%
The YRD 59 122 20.79%
Table 2: Airport passenger throughput of the YRD in 2005 (in 1,000 passengers) Source: Development report of the Yangtze River Delta in 2006
Appendices
123
Cargo throughput ranking Cargo throughput
(thousand tons)
The proportion in the nation
Pudong 1 1 857 29.33%
Hongqiao 5 359 5.68%
Hangzhou 8 165 2.62%
Nanjing 10 139 2.20%
Ningbo 26 30 0.48%
Wuxi 37 11 0.18%
Zhoushan 65 1 0.02%
Changzhou 46 4 0.06%
Huangyan 54 2 0.03%
Nantong 61 1 0.02%
The Yangtze River Delta 2 572 40.63%
Table 3: Airport cargo throughput of the YRD in 2005 (in thousand tons) Source: Development report of the Yangtze River Delta in 2006
Period Name Code Length(KM) Flows(PCU/DAY)
1988 Shanghai-Jiading
Freeway A12 26.0 -
1990-2000
Shanghai-Nanjing
Freeway A11 24.2 37 798
Shanghai-Hangzhou
Freeway A8 47.6 48 902
2000-2005
Outer-ring A20 97.5 107 816
Yingbing Road A1 11.2 -
Jiading-Jinshan
Freeway A5 67 -
Hu-Lu Freeway A2 42.4 24 070
Xin-Feng-Jing
Freeway A4 57.2 19 458
Tong-San Freeway A6 21.1 -
Ting-Feng Freeway A7 18.5 -
Hu-Qing-Ping
Freeway A9 48.4 35 128
Hu-Jia-Liu Freeway A12 9.6 23 582
Suburb-Ring A30 189.4 11 582
2005 Total 562 -
Table 4: Shanghai freeway - code and length (2005)

Appendices
124
Year Airport Flight landing and taking off
(Thousand)
Passenger Thru put
(Ten Thousand Passengers)
2001
Hongqiao 116.5 13 761.4
Pudong 77.6 6 899.0
Total 194.1 20 660.4
2002
Hongqiao 117.9 13 667.1
Pudong 107.3 11 047.7
Total 225.2 24 714.8
2003
Hongqiao 109.4 9 692.4
Pudong 134.3 15 063.6
Total 243.7 24 756.0
2004
Hongqiao 150.7 14 918.5
Pudong 178.7 21 043.6
Total 329.4 35 962.1
2005 Total 380.0 41 460.0
Table 5: Shanghai air passenger transport business Source: Shanghai Air Transport “11th-five-year-plan” Planning
Number Port Container throughput
(Thousand TEU) Rate of increase(%)
1 Singapore 23 200 8.7
2 Hong Kong 22 600 3
3 Shanghai 18 080 24.3
4 Shenzheng 16 200 18.6
5 Busan 11 840 3
6 Kaohsiung 9 470 -2.5
7 Rotterdam 9 300 12
8 Hamburg 8 100 15.5
9 Los Angeles 7 500 2.5
10 Long Beach 6 700 16
Table 6: The ten largest container ports worldwide in 2005
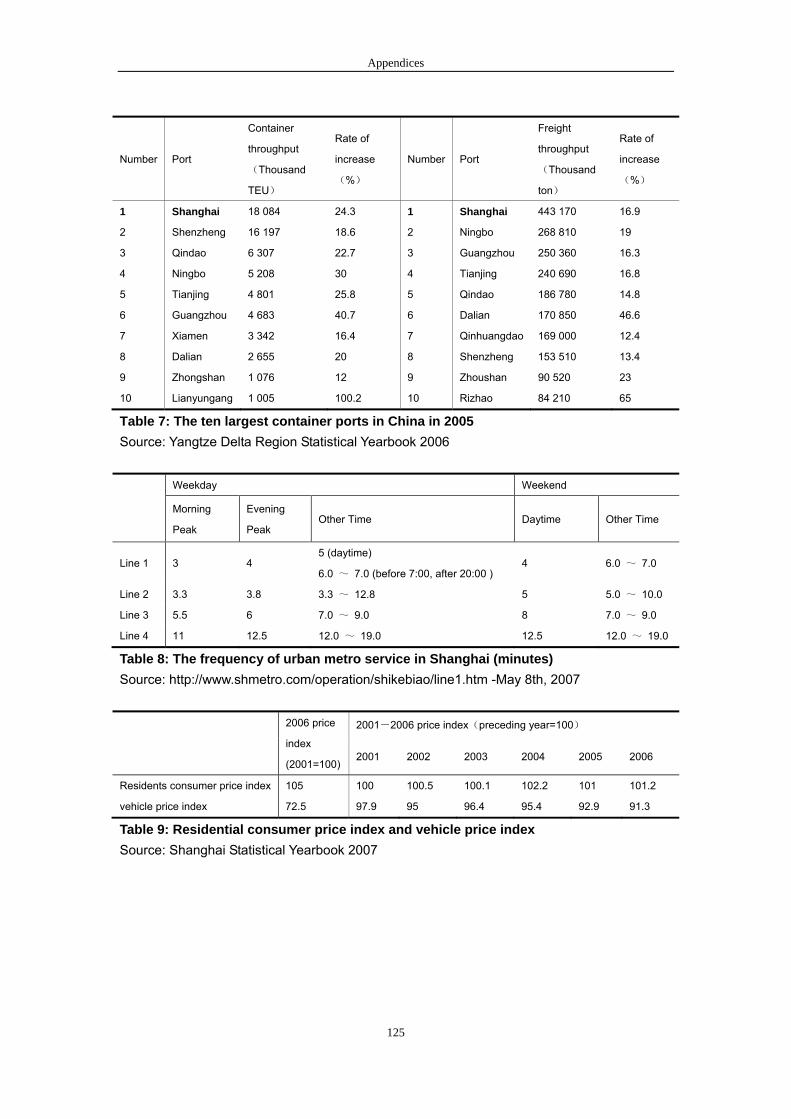
Appendices
125
Number Port
Container
throughput
(Thousand
TEU)
Rate of
increase
(%)
Number Port
Freight
throughput
(Thousand
ton)
Rate of
increase
(%)
1 Shanghai 18 084 24.3 1 Shanghai 443 170 16.9
2 Shenzheng 16 197 18.6 2 Ningbo 268 810 19
3 Qindao 6 307 22.7 3 Guangzhou 250 360 16.3
4 Ningbo 5 208 30 4 Tianjing 240 690 16.8
5 Tianjing 4 801 25.8 5 Qindao 186 780 14.8
6 Guangzhou 4 683 40.7 6 Dalian 170 850 46.6
7 Xiamen 3 342 16.4 7 Qinhuangdao 169 000 12.4
8 Dalian 2 655 20 8 Shenzheng 153 510 13.4
9 Zhongshan 1 076 12 9 Zhoushan 90 520 23
10 Lianyungang 1 005 100.2 10 Rizhao 84 210 65
Table 7: The ten largest container ports in China in 2005 Source: Yangtze Delta Region Statistical Yearbook 2006
Weekday Weekend
Morning
Peak
Evening
Peak Other Time Daytime Other Time
Line 1 3 4 5 (daytime)
6.0 ~ 7.0 (before 7:00, after 20:00 ) 4 6.0 ~ 7.0
Line 2 3.3 3.8 3.3 ~ 12.8 5 5.0 ~ 10.0
Line 3 5.5 6 7.0 ~ 9.0 8 7.0 ~ 9.0
Line 4 11 12.5 12.0 ~ 19.0 12.5 12.0 ~ 19.0
Table 8: The frequency of urban metro service in Shanghai (minutes) Source: http://www.shmetro.com/operation/shikebiao/line1.htm -May 8th, 2007
2006 price
index
(2001=100)
2001-2006 price index(preceding year=100)
2001 2002 2003 2004 2005 2006
Residents consumer price index 105 100 100.5 100.1 102.2 101 101.2
vehicle price index 72.5 97.9 95 96.4 95.4 92.9 91.3
Table 9: Residential consumer price index and vehicle price index Source: Shanghai Statistical Yearbook 2007

Appendices
126
Area
Daylight
night A
month
charge by people charge by timer
the
first
hour
the follow
hours(every
a half hour)
the first hour the follow
hours(every
a half hour)
0~15
minitue
15~30
minitue
30~60
minitue
Central Area 15 10 4 4 7 10 10 400
other area in the inner ring 10 6 3 3 4 6 8 300
between the inner and outer
ring(including the town out of
the outer ring)
7 4 2 2 3 4 5 200
Table 10: Parking fees in Shanghai (in Yuan) Source: http://sh.eastday.com/eastday/node545/node2328/userobject1ai35261.html
Standard of Charge
Passenger Vehicles Freight Trucks
≤7
seats
8-19
seats
20-4
0
seats
≥40
seats
≤2
tons 2-5tons
5-10tons;
20-foot
container
truck
10-15
tons
>15 tons;
40-foot
container
truck
Shangha
i
VOC
30 30 50 50 20 50 110 160 160
Nanjing Highway 10 12 15 15 12 15 25 30 45
Nanjin-Hefen
Freeway 10 20 25 25 15 25 35 40 55
Table 11: Road tolls in Shanghai and Nanjing (in Yuan/vehicle·time) Source: Shanghai Municipal People's government Order No. 102, the Regulations on the Control of Shanghai road tolls on loans road http://www.ylfzhj.bj.cn/jsp/display.jsp?colid=0402&id=ID031218000 http://www.njjtgf.cn/Lawsnews.aspx?classcode=/LAWS/YLF/ Note: VOC—Vehicles from Other City
car medium-size full-size mega-size
Shanghai-Nanjing Freeway 0.4-0.6 0.8 1-1.2 1.6
Guangzhou-Kaiping Freeway 0.45 0.9 1.462 2.138
Table 12: Freeway charge standards (in Yuan/km) Source: http://www.huandonglg.com/www.htm

Appendices
127
Departing Sea Route Country Destination Price Date
Shanghai Australia, New
Zealand Australia Sydney 980 2007-8-17
Shanghai Africa South Africa Cape town 1 155 2007-8-17
Shanghai Middle East ,India
and Pakistan Indis Nhava sheva 950 2007-8-17
Shanghai America America Los Angeles 1 456 2007-8-17
Shanghai Europe,
Mediterranean Netherlands Rotterdam 1 600 2007-8-17
Shanghai Japan, South Korea Japan Tokyo 180 2007-8-17
Shanghai America America Long beach 1 456 2007-8-17
Shanghai Middle East ,India
and Pakistan Germany Hamburg 1 600 2007-8-17
Shanghai Southeast Asia Singapore Singapore 510 2007-8-17
Shanghai Southeast Asia China Hong Kong 60 2007-8-17
Table 13: 20-foot container transport price in Shanghai port (in US dollar) Source: http://www.shanghai-shipping.com/chinese/web/rate.asp
Age
2002 2003 2004 Sum
Death
toll
Proportion
(%)
Death
toll
Proportion
(%)
Death
toll
Proportion
(%)
Death
toll
Proportion
(%)
0- 18 1.28 15 1.07 30 1.94 63 1.45
7- 26 1.86 22 1.57 26 1.69 74 1.7
13- 64 4.57 59 4.21 86 5.57 209 4.81
21- 203 14.5 240 17.13 248 16.07 691 15.91
31- 311 22.21 286 20.41 324 20.99 921 21.2
41- 254 18.14 275 19.63 304 19.7 833 19.18
51- 194 13.86 208 14.85 216 13.9 618 14.23
61- 74 5.29 73 5.21 52 3.37 199 4.58
66- 256 18.29 223 15.92 257 16.66 736 16.94
Tota
l 1 400 100 1 401 100 1 543 100 4 344 100
Table 14: Age distribution of people killed in road traffic accidents in Shanghai, 2002-2004 Source: Survey on death and injuries in Shanghai traffic accidents from 2002-2004 and the strategies on prevention, Master Degree Paper, Shanghai Jiaotong University, 2005.4. 61223186046244E46.pdf

Appendices
128
Appendix II - Figures
Figure 1: Change inn number of passengers by waterway in the GYRD from 2001 to 2005 (in thousand) Source: The Industrial Map of the Yangtze River Delta (2006-2007)
Figure 2: Change in passenger-kilometers by waterway in the GYRD from 2001 to 2005 (billion passenger-kilometers ) Source: The Industrial Map of the YRD (2006-2007) Development report of the YRD in 2006
0
0.2
0.4
0.6
0.8
1
1.2
1.4
1.6
2001 2002 2003 2004 2005
Year
pass
enge
r tur
nove
r by
wat
er
Shanghai Jiangsu Zhejiang GYRD
Pass
enge
r tur
nove
r by
wat
erw
ay
(bi
llion
peop
le·
kilo
met
ers)
0
5,000
10,000
15,000
20,000
25,000
30,000
35,000
40,000
2001 2002 2003 2004 2005
Year
Pass
enge
r tra
ffic
by w
ater
Shanghai Jiangsu Zhejiang GYRD
再
pass
enge
r by
wat
erw
ay (t
hous
and)

Appendices
129
0% 5% 10% 15% 20% 25% 30%
mixed transportation
light industry and food
industrial products
architectural material
mineral
timber
farm product
Figure 3: Proportion of cargo transport by truck
0
0.5
1
1.5
2
2.5
3
3.5
1997 1998 1999 2000 2001 2002 2003 2005year
num
ber o
f ent
erpr
ise
-140 000-120 000-100 000-80 000-60 000-40 000-20 000020 00040 00060 000
tota
l pro
fit (1
000
yua
n)
number of enterprises total profit(1 000 yuan)
Figure 4: Number and profit of railway transport enterprises Source: Shanghai Statistical Yearbook on Industry, Energy and Transport 1997-2006

Appendices
130
0
200
400
600
800
1000
1200
1997 1998 1999 2000 2001 2002 2003 2005year
num
ber o
f ent
erpr
ises
0
100 000
200 000
300 000
400 000
500 000
600 000
tota
l pro
fit (1
000
yua
n)
number of enterprises total profit(1 000 yuan)
Figure 5: Number and profit of highway transport enterprises Source: Shanghai Statistical Yearbook on Industry, Energy and Transport 1997-2006
0
20
40
60
80
100
120
140
160
1997 1998 1999 2000 2001 2002 2003 2005year
num
ber o
f ent
erpi
ses
-5 000 000
0
5 000 000
10 000 000
15 000 000
20 000 000
25 000 000
tota
l pro
fit (1
000
yua
n)
number of enterprises total profit(1 000 yuan)
Figure 6: Number and profit of waterway transport enterprises Source: Shanghai Statistical Yearbook on Industry, Energy and Transport 1997-2006
0
2
4
6
8
10
12
14
1997 1998 1999 2000 2001 2002 2003 2005year
num
ber o
f ent
erpr
ises
-1 000 000
0
1 000 000
2 000 000
3 000 000
4 000 000
5 000 000
tota
l pro
fit (1
000
yua
n)
number of enterprises total profit(1 000 yuan)
Figure 7: Number and total profit of civilian aviation enterprises Source: Shanghai Statistical Yearbook on Industry, Energy and Transport 1997-2006

Appendices
131
91
92
93
94
95
96
97
98
99
100
101
1996 1997 1998 1999 2000 2001 2002 2003 2004 2005
year
Punc
tual
ity R
ate
%
Punctuality Rate of Freight Car Punctuality Rate of Passenger Trains
Figure 8: Punctuality rate of trains (%) Source: Shanghai Statistical Yearbook on Industry, Energy and Transport 1997-2006
0
5
10
15
20
25
30
1996 1997 1998 1999 2000 2001 2002 2003 2004 2005
year
Aver
age
Wai
ting
Tim
e fo
r Han
dlin
g of
Frig
ht P
er c
ar (h
s)
Figure 9: Average waiting time for handling of fright per car (in hrs) Source: Shanghai Statistical Yearbook on Industry, Energy and Transport 1997-2006
0
5
10
15
20
25
30
35
40
1996 1997 1998 1999 2000 2001 2002 2003 2004 2005year
Trav
ellin
g Sp
eed
of F
reig
ht C
ar(
km/h
s)
Figure 10: Traveling speed of freight vehicle (km/h) Source: Shanghai Statistical Yearbook on Industry, Energy and Transport 1997-2006

Appendices
132
0
500
1 000
1 500
2 000
2 500
3 000
1995 1996 1997 1998 1999 2000 2001 2002 2003 2004 2005 2006year
Aver
age
Turn
over
Dis
tanc
e(k
m/p
erso
n)
Figure11: Average travel distance of departing passengers (in km/person) Source: Shanghai Statistical Yearbook 2007
0
50
100
150
200
2000 2001 2002 2003 2004 2005year
num
ber o
f citie
s
Cities Available of Air Service International Cities and Hongkong,Macao,(city)
Figure 12: Cities with air service (city) Source: Shanghai Statistical Yearbook on Industry, Energy and Transport 1997-2006

Appendices
133
0
50 000
100 000
150 000
200 000
250 000
1999 2000 2001 2002 2003 2004 2005year
Freq
uenc
y of
Tak
eoff
and
Land
ing
of th
e Ai
rpor
ts(ti
mes
/yea
r)
Pudong Airport Hongqiao Airport
Figure 13: Frequency of takeoff and landing at Pudong and Hongqiao Airports (in airplane/year) Source: http://www.shanghaiairport.com/attach//file_content/A11612232890316096F9.pdf http://www.shanghaiairport.com/attach//file_content/A11
0
1 000
2 000
3 000
4 000
5 000
6 000
7 000
8 000
9 000
10 000
2002 2003 2004 2005year
num
ber
Rural Area Accidents Amounts Rural Area Death toll Rural Area Injured
Figure 14: Traffic accidents in rural Shanghai from 2002 to 2006

Appendices
134
0
5 000
10 000
15 000
20 000
25 000
30 000
35 000
40 000
45 000
50 000
2002 2003 2004 2005year
num
ber
Urban Accidents Amounts Urban Death toll Urban Injured
Figure 15: Traffic accidents in urban Shanghai from 2002 to 2006 Source: Traffic and Transport (2003.2; 2004.2; 2005.1; 2006.2; 2007.1)
0
200
400
600
800
1 000
1 200
1 400
mot
ors
pass
enge
rsan
d pe
ds.
mot
ors
pass
enge
rsan
d pe
ds.
mot
ors
pass
enge
rsan
d pe
ds.
mot
ors
pass
enge
rsan
d pe
ds.
mot
ors
pass
enge
rsan
d pe
ds.
2002 2003 2004 2005 2006
year
num
ber
urban area death toll urban area injured rural area death toll rural area injured
Figure 16: Comparison of deaths and injuries in urban and rural areas, 2002-2006

Appendices
135
0
500
1 000
1 500
2 000
2 500
mot
ors
pass
enge
rsan
d pe
ds.
mot
ors
pass
enge
rsan
d pe
ds.
mot
ors
pass
enge
rsan
d pe
ds.
mot
ors
pass
enge
rsan
d pe
ds.
mot
ors
pass
enge
rsan
d pe
ds.
2002 2003 2004 2005 2006
year
num
ber
Total death toll Total injured
Figure 17: Deaths and injuries for passengers/peds and motors, 2002-2006
0
20
40
60
80
100
120
140
160
180
South-NorthElevated
Road
West Yan'anElevated
Road
East/MiddleYan'anElevated
Road
Inner Ring HuminElevated
Road
Middle Ring YixianElvated Road
category
AAD
T (1
000
Veh
)
Figure 18: Comparisons of Shanghai expressways daily average flows in the city center Source: Road Traffic Report on Central City of Shanghai, 2006
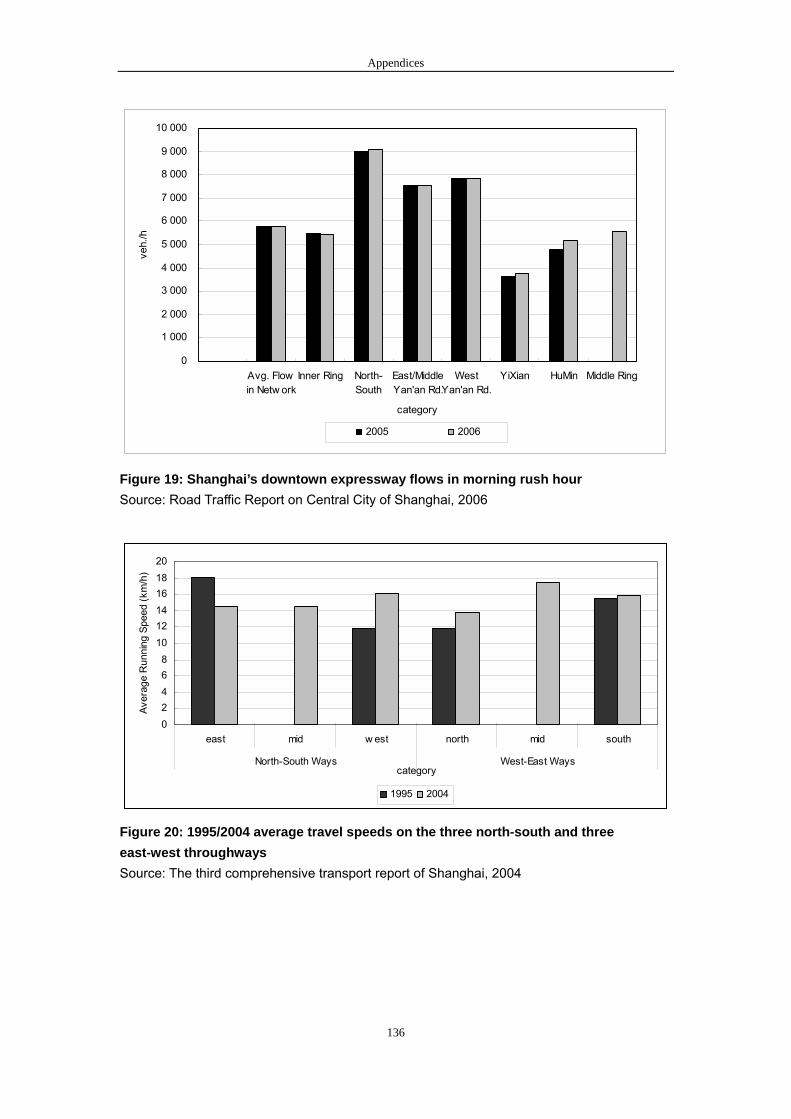
Appendices
136
0
1 000
2 000
3 000
4 000
5 000
6 000
7 000
8 000
9 000
10 000
Avg. Flowin Netw ork
Inner Ring North-South
East/MiddleYan'an Rd.
WestYan'an Rd.
YiXian HuMin Middle Ring
category
veh.
/h
2005 2006
Figure 19: Shanghai’s downtown expressway flows in morning rush hour Source: Road Traffic Report on Central City of Shanghai, 2006
02468
101214161820
east mid w est north mid south
North-South Ways West-East Wayscategory
Aver
age
Run
ning
Spe
ed (k
m/h
)
1995 2004
Figure 20: 1995/2004 average travel speeds on the three north-south and three east-west throughways Source: The third comprehensive transport report of Shanghai, 2004

Appendices
137
Figure 21: 2004 distribution of rush-hour travel speeds on main ground roads in central area Source: The Third Comprehensive Transport Report of Shanghai, 2004
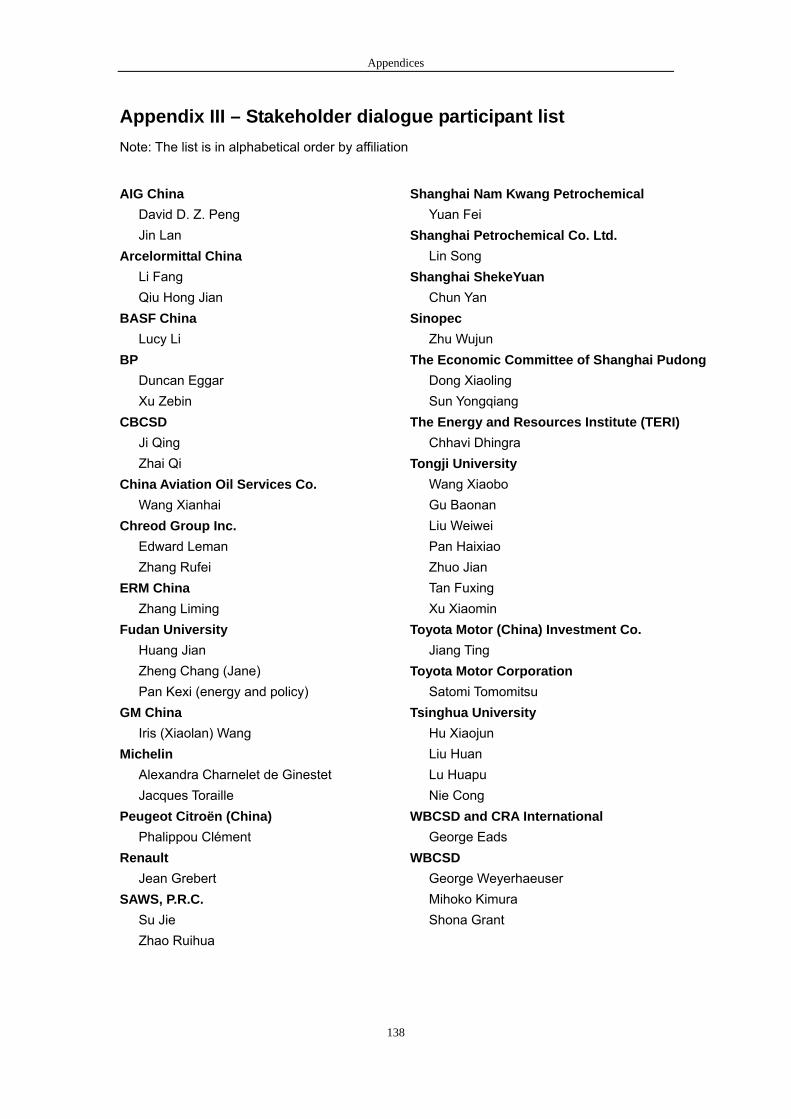
Appendices
138
Appendix III – Stakeholder dialogue participant list Note: The list is in alphabetical order by affiliation
AIG China David D. Z. Peng Jin Lan Arcelormittal China Li Fang Qiu Hong Jian BASF China Lucy Li BP Duncan Eggar Xu Zebin CBCSD Ji Qing Zhai Qi China Aviation Oil Services Co. Wang Xianhai Chreod Group Inc. Edward Leman Zhang Rufei ERM China Zhang Liming Fudan University Huang Jian Zheng Chang (Jane) Pan Kexi (energy and policy) GM China Iris (Xiaolan) Wang Michelin Alexandra Charnelet de Ginestet Jacques Toraille Peugeot Citroën (China) Phalippou Clément Renault Jean Grebert SAWS, P.R.C. Su Jie Zhao Ruihua
Shanghai Nam Kwang Petrochemical Yuan Fei Shanghai Petrochemical Co. Ltd. Lin Song Shanghai ShekeYuan Chun Yan Sinopec Zhu Wujun The Economic Committee of Shanghai Pudong Dong Xiaoling Sun Yongqiang The Energy and Resources Institute (TERI) Chhavi Dhingra Tongji University Wang Xiaobo Gu Baonan Liu Weiwei Pan Haixiao Zhuo Jian Tan Fuxing Xu Xiaomin Toyota Motor (China) Investment Co. Jiang Ting Toyota Motor Corporation Satomi Tomomitsu Tsinghua University Hu Xiaojun Liu Huan Lu Huapu Nie Cong WBCSD and CRA International George Eads WBCSD George Weyerhaeuser Mihoko Kimura Shona Grant

Appendices
139
Appendix IV - Notes from the stakeholder dialogue The morning session began with a welcome address from Mr. Jacques Toraille, the Director of Sustainable Development at Michelin. This was followed by the inaugural address by Mr. Zhai Qi from the China Business Council for Sustainable Development (CBCSD) who introduced the CBCSD and the WBCSD as well as the topic of sustainable mobility. The introductory session was followed by the first panel discussion on sustainable mobility. Session 1: Sustainable mobility The first plenary session was chaired by Mr. Zhai Qi from CBDSD. The panel comprised Dr George Eads, Vice President, CRA International; Ms. Su Jie, Director, Mobility Safety Bureau, People’s Republic of China; and Professor Pan Haixiao, Department of Urban Planning, Tongji University. Dr Eads started the session by summarizing the WBCSD’s Mobility 2030 report, and outlining the challenges of making mobility sustainable. He presented the 7 goals for sustainable mobility and gave a frank assessment of the current outlook for sustainable mobility globally. This was followed by Ms Su Jie who explained the situation in China around road safety and the current priorities for the Transport Safety Division. The last presentation was by Professor Pan Haixiao who summarized the findings of the Shanghai case study on sustainable mobility. See separate presentations for more details. The presentations were then followed by a table top discussion around three questions that were introduced by Dr Eads: • Are the economic and environmental impacts of road transportation threatening to get in
the way of economic growth? Three tables discussed this topic. • What additional role might rail-based transport (urban and/or intercity) play in improving
sustainable mobility in China? One table discussed this topic • How important is it to pursue an integrated approach to achieving sustainable mobility in
China? Two tables discussed this topic.

Appendices
140
Session 2: Status of sustainable mobility in China The second plenary session was chaired by Mr. David Peng, Senior Deputy President for AIG China. The panel comprised Ms Iris Wang, Manager of Corporate Social Responsibility for GM China; Professor Lu Huapu, Director, Transport Research Institute, Tsinghua University; and Mr. Edward Leman, President, Chreod Group Inc. Ms Wang started the session with the reasoning behind GM’s engagement on sustainable mobility in China. This was followed by Professor Lu Huapu who summarized the work that Tsinghua University is doing with BP on sustainable urban mobility in China. The last presentation by Mr. Edward Leman examined why mobility matters by sharing a perspective on the history and future direction of integrated land and transport planning in metropolitan Shanghai. Regarding Shanghai he noted that “I am unaware of any place in human history that has built so much road infrastructure in such a short period of time”. See separate presentations for more details. The presentations were followed by interventions from each of the chairpersons from the morning table top discussion that presented the views of each group. The key points made for each discussion topic are listed below in the order in which they were shared. Topic 3: How important is it to pursue an integrated approach to achieving sustainable mobility in China? • Integration between transport and urban planning is essential • Chinese cities are investing heavily in infrastructure but this is not keeping up with
demand no matter how many roads are built. As a consequence there needs to be constraints on the number of motorized road vehicles in cities.
• Initiatives such as flexible working hours can reduce peak flows • Pedestrian movement should be prioritized first in city plans • Safety equipment needs to be improved within mobility infrastructure • Focus should also be placed on large transportation hubs and the public should be
involved in consultation process related to mobility planning. • Shanghai albeit unique, is seen as a city that could be an example for other cities in China
if it can find a way to successfully integrate the movement of people, goods and services in a sustainable way.
• Also felt that Shanghai may be heading for a crisis, the planning authority needs to exercise control over a larger area than the current administrative boundaries “the planning authority needs to be sized appropriately to the mobility issue they are trying to solve”
• Example given of railways which are controlled nationally with little or no control from Shanghai although exception now likely to be made with the first regional railway likely to be built in the YRD.
Topic 2: What additional role might rail-based transport (urban and/or intercity) play in improving sustainable mobility in China? • Japan was seen as a successful example of a country that has developed shorter

Appendices
141
distance rail transport. • Within Shanghai the metro dominates, while the railways are not important • Approval process for new rail investments seen as bureaucratic and full of problems • There are also limited statistics on the railways although this comment was disputed by
some participants. Topic 1: Are the economic and environmental impacts of road transportation threatening to get in the way of economic growth? • Recognition that mobility is critical for economic growth but also has adverse and
negative implications. • China needs to develop emissions standards. They exist for Shanghai and Beijing but not
for China. Considerations should be given to how smaller companies can comply with the stricter regulations.
• Policy implementation is the role of government but it needs to take into account the views of key stakeholders. Recommendation made to engage industrial associations in the process to avoid conflict of interests at individual company level
• Auto industry has seen rapid growth in China and expectation that a prosperous auto-industry would contribute to the long term economic development of China
• Recognition that limiting private vehicles is a controversial issue in China • Recommendation made to improve the professionalism of logistics operations • One of key issues is the allocation of investment levels on private and public modes.
Example given of Shanghai where government removed the monthly ticket system and people moved away from public transport to private modes (Bike).
• Point also made that government expected more people to move from bicycle to public transport when more have gone from bicycles to private vehicles as they view this as giving more personal freedom (as the bike did albeit for shorter distances).
• Issue of institutional silos was raised where decisions are not coordinated across institutions. Divergent and conflicting institutional priorities also raised. Example given of some cities that promote the use of larger vehicles over smaller vehicles to optimize use of available road space without taking into account the environmental considerations. China needs to develop smaller and less energy intensive vehicles.
• Road management and administration also identified as areas that could be improved. • Also noted that co-ordination is easier said than done due to the high number of
institutions and agencies at a municipal, regional and national level. The railways are actually unique as there is only one body.
• Question was raised on examples of cities that have been successful in delivering a sustainable mobility system
• France was given as an example of a country where there was now under one Minister responsible for sustainable development, transport and urban planning.
• Suggestion made for government to set visionary targets. Example given of Sweden with a vision of “no road accidents”
• Question raised as to whether companies would consider changing the incentive system on company cars and encourage management to use public transport. Belief that many more people would use public transport if service was better.

Appendices
142
Summary of the day Dr. Eads and Professor Pan summarized the main discussion points from the dialogue. Professor Pan noted the following: • In China transportation is always linked to roads – it should be broadened to multiple
modes • In the YRD the economic linkages go well beyond the administrative boundaries.
Recommend one administrative authority for transportation and urban planning in the region
• Recognition that planning alone is not enough and mobility controls have also to be put in place in the urban areas
• The walking and bicycling environment needs to be secured and prioritized • Land use needs greater control in the suburban areas and transportation should be
integrated into the suburban planning • Freight transport needs further consideration from both an energy efficiency and
environmental standpoint. Trucks may not always be the best solution. Dr. Eads who had been involved in all of the previous dialogues involving the WBCSD on sustainable mobility noted some of the difference and similarities between Dar es Salaam, Bangalore and Shanghai. Dar es Salaam is very poor and struggling with many aspects, Bangalore is thriving and growing rapidly but investing significantly less per capita in infrastructure than Shanghai. Despite the stark differences they also share the following characteristics: • In all cases mobility is critical to development • All are congested albeit the absolute levels of mobility services are very different • All need to significantly improve the integration within city planning • Governance is a critical issue – it is not just about technology • Clear that the cities could learn from one another. Shanghai has grown so much and so
fast and we are fortunate that this growth has undergone a lot of analysis and research. There is likely to be much to learn from Shanghai for other cities in China and elsewhere
Appendices
143
Appendix V - References cited 1 The Yangtze Delta Region is defined two ways: The first definition, or Greater Yangtze Delta Region, includes the administrative boundaries of Shanghai City, Jiangsu Province and Zhejiang Province. The second definition refers to the area composed of the sixteen cities in Shanghai City, Jiangsu Province and Zhejiang Province. This report adopts the first definition.
2 Source: Tsinghua University Sustainable Urban Mobility Project, Phase I Summary Report.
3 People have long thought that bicycle travel could be replaced with well-serviced bus systems in China, but it has not been a success.
4 Some people in China believe that because of the mixture of traffic, bicycles are the main reason for traffic congestion and reduced flow: if every traveler were to take a motorized vehicle, traffic could be improved. A limitation on bicycle use may force people to use cars, even for a short distance, especially as bicycle travel is becoming unsafe.
5 The direction of traffic will be changed according to peak traffic flows.
6 See note 1.
7 http://news.xinhuanet.com/fortune/2006-12/04/content_5429849.htm
8 People who have registered with the municipal government and obtained a citizen carnet, Hukou.
9 http://www.123chinanews.com/chinanews/model_books_temp3.cfm?book_no=2695001652792
10 http://www.investment.gov.cn/2005-10-21/1129906656057.html
11 http://www.shanghai.gov.cn/shanghai/node2314/node15822/node15823/node15851
12 All the import and export goods are expressed in US$ in the Statistical Book.
13 Shanghai Statistical Yearbook 2007.
14 http://www.js.xinhuanet.com/zhuanti/2006-04/17/content_6764816.htm
15 http://sh.eastday.com/qtmt/20070821/u1a344241.html
16 http://www.yancheng.gov.cn/web/jjjs/gmjjzyzbrjsp.htm
17 Huning: Shanghai-Nanjing
18 Huhang:Shanghai-Hangzhou
19 http://news.xinhuanet.com/fortune//2007-07/03/content_6320128.htm
20 Navigable inland waterway.
21 Urban Transportation Planning Institute, Urban Planning Administration Bureau (2005), Shanghai third transportation survey report, Shanghai.
22 For example, according to the road space occupied, one bus is equivalent to two PCU.
23 Wang Zhan, WTO and Development in Shanghai, Shanghai University of Finance and Economics Press.
24The highways of Shanghai are categorized as freeway, first-grade highways, second-grade highway, third-grade highway, fourth-grade highway and non-classified highway in terms of technical standards, and into state highways, provincial highways, county highways and village highways in terms of

Appendices
144
administration.
25 Ye Guixun, Spatial Development Strategies for Shanghai, China Architecture & Building Press, November, 19-20
26 Excluding busses and taxis.
27 West part of Shanghai.
28 East part of Shanghai.
29 source: http://www.bjbus.org/viewthread-2608
30 Urban Planning Administration Bureau, Shanghai City Government (2004), Shanghai Urban Transport White Paper, Shanghai.
31 Shanghai Urban Planning Bureau, Shanghai Urban Planning & Technical Administration and supporting documents.
32 Fu Qingyan, Yang Dongqin, Huang Rong, Chen Guohai, Qiu Jibing, Chen Changhong, The atmosphere capacity in the development of motor vehicles in Shanghai. Environment science supplement of 25th volume.
33 Forecast for development trend of consumption makeup for Shanghai urban citizens.
34 Source: The third Comprehensive Transport Survey Report of Shanghai, 2004
35 http://finance.sina.com.cn/xiaofei/shenghuo/20050527/11121630531.shtml
36 The market situation, problems and development trend of road freight in China.
37 The state strategy is to build Shanghai as an international finance, economic and shipping center.
38 Source: Tsinghua University Sustainable Urban Mobility Project, Phase I Summary Report.
39 Source: The third comprehensive Transport Survey( Shanghai).
40 Fuel-powered, small cylinder, two-stroke motorcycle.
41 Transport industry.
42 Only represents the commercial transportation industry.
43 Studies on China’s Energy Consumption and Countermeasures.
44 From 2006 to 2010.
45 http://www.myliving.cn/house/teji/qipu_gh_two.htm
46 http://scitech.people.com.cn/GB/1057/4196224.html
47 On Mid-Hub-City and Subsidiary-Hub-Cities of N-H Line. August 2006. Urban Mass Transit. Chen Ye.

About the WBCSDThe World Business Council for Sustainable Development (WBCSD) brings together some 200international companies in a shared commitment to sustainable development througheconomic growth, ecological balance and social progress. Our members are drawn from morethan 30 countries and 20 major industrial sectors. We also benefit from a global network ofabout 60 national and regional business councils and partner organizations.
Our mission is to provide business leadership as a catalyst for change toward sustainabledevelopment, and to support the business license to operate, innovate and grow in a worldincreasingly shaped by sustainable development issues.
Our objectives include:
Business Leadership – to be a leading business advocate on sustainable development;
Policy Development – to help develop policies that create framework conditions for thebusiness contribution to sustainable development;
The Business Case – to develop and promote the business case for sustainable development;
Best Practice – to demonstrate the business contribution to sustainable development and sharebest practices among members;
Global Outreach – to contribute to a sustainable future for developing nations and nations intransition.
www.wbcsd.org
Development Focus AreaCo-chair: Roberto Salas (GrupoNueva)Focus Area Core Team: AES Corporation, Anglo American, BP, ERM, GE, GrupoNueva, Toyota
Photo credits IstockphotoCopyright © WBCSD. April 2008.

4, chemin de Conches Tel: +41 (0)22 839 31 00 E-mail: [email protected] Conches-Geneva Fax: +41 (0)22 839 31 31 Web: www.wbcsd.orgSwitzerland
WBCSD North America Office Tel: +1 202 420 77 45 E-mail: [email protected] R Street NW Fax: +1 202 265 16 62Washington, DC 20009
Secretariat