mlc masterkey business super investment menu
TRANSCRIPT

MLC MasterKey Business Super Investment Menu
The FundMLC Super FundABN 70 732 426 024
Issued by the TrusteeNULIS Nominees (Australia) LimitedABN 80 008 515 633 AFSL 236465
Preparation date1 October 2021

This menu gives you information about theinvestments available through MLC MasterKey Business Super
A financial adviser can help you decide whichinvestment options are right for you.

Contents
4Investing with us
6Things to consider before you invest
12Understanding your investment options
14Investing in MLC investment options
51Investment options other than MLC portfolios
66Fees and costs for your investment options
68Cost of product for your investment options
The information in this documentforms part of the MLC MasterKeyBusiness Super Product DisclosureStatement (PDS), dated 1 October2021. Together with the FeeBrochure, your Insurance Guide andthe Claims Guide, these documentsshould be considered before makinga decision about whether to investor continue to hold the product.They are available at mlc.com.au/pds/mkbs
This document has been prepared on behalf of NULIS Nominees (Australia) Limited, ABN 80 008 515 633, AFSL 236465 (NULIS) asTrustee of the MLC Super Fund, ABN 70 732 426 024 (the Fund). NULIS is part of the group of companies comprising IOOF HoldingsLtd ABN 49 100 103 722 and its related bodies corporate (IOOF Group).
The information in this document is general in nature and doesn’t take into account your objectives, financial situation or individualneeds. Before acting on any of this information you should consider whether it is appropriate for you. You should consider obtainingfinancial advice before making any decisions based on this information.
References to ‘we’, ‘us’ or ‘our’ are references to the Trustee, unless otherwise stated.
This offer is made in Australia in accordance with Australian laws.
MLC Asset Management Services Limited, ABN 38 055 638 474, AFSL 230687 (MLC Asset Management), each referenced investmentmanager and JANA Investment Advisers Pty Ltd, ABN 97 006 717 568, AFSL 230693 have given written consent to be named in thisdocument and to the inclusion of statements made by them. As at the date of this document, these consents have not been withdrawn.
In some cases, information in this document has been provided to us by third parties. While it is believed the information is accurateand reliable, the accuracy of that information is not guaranteed in any way.
Subject to super law, the final authority on any issue relating to your account is the Fund’s Trust Deed, and the relevant insurance policy,which govern your rights and obligations as a member.
The information in this document may change from time to time. Any updates or changes that aren’t materially adverse will be availableat mlc.com.au. You also can obtain a paper copy of these updates at no additional cost by contacting us.
An online copy of this document is available at mlc.com.au/pds/mkbs
MLC MasterKey Business Super Investment Menu | 3

We provide a broad range ofinvestment options and you canchoose any combination of theseto put your investment plan intoaction.We offer multi-asset investment optionsthat invest across multiple asset classes,and an extensive range of options thatinvest in a single asset class, andinvestment options managed by externalmanagers.
We’ve appointed MLC Asset Managementto advise on and manageour MLC investment options. Ourinvestment experts, at MLC AssetManagement, have extensive knowledgeand experience in designing andmanaging portfolios using amulti-manager investment approach.
Investing in MLC portfoliosOur portfolios have different investmentobjectives because we know everyone hasdifferent requirements about how theirmoney should be managed.
Our portfolios make sophisticatedinvesting straightforward.
Our investment experts, at MLC AssetManagement, structure our portfolios todeliver more reliable returns in manypotential market environments. And, astheir assessment of world marketschanges, our portfolios are evolved tocapture new opportunities and managenew risks.
MLC Asset Management uses specialistinvestment managers in our portfolios.They research hundreds of investmentmanagers from around the world andselect the managers they believe are thebest for our portfolios. These investmentmanagers may be specialist in-housemanagers, external managers or acombination of both.
Importantly, we stay true to the objectivesof our portfolios, so you can keep on trackto meeting your goals.
Selecting investment optionsWe’ve appointed JANA InvestmentAdvisers Pty Ltd (JANA) to advise us onour Investment Menu. It is one of theleading investment consultants inAustralia with over 30 years of experienceand $850 billion of funds under advice (asat 30 June 2021). JANA is partly owned byIOOF Holdings Ltd.
The Investment Menu is regularlyreviewed by a committee of experiencedinvestment professionals.
A number of factors are taken intoconsideration when choosing theinvestment options. These may includethe investment objective, fees, externalresearch ratings and performance, as wellas our ability to efficiently administer theinvestment option. The selection ofoptions issued by companies eitherwholly or partially owned by the IOOFGroup is done on an arm’s-length basis inline with our Conflicts ManagementPolicy.
Investment switchingYou can change your investment optionsany time. We do not charge a fee for youto do this. However, buy-sell spreads mayapply.
Delayed and suspendedtransactionsWe may delay or suspend transactions,for example where an investmentmanager delays or suspends unit pricing,or when there are adverse marketconditions.
We may process withdrawal and switchrequests in instalments over a period oftime and may also suspend processing ofwithdrawal and switch requests we havereceived. In certain circumstances we mayrefuse a request. Where requests aredelayed, suspended or being paid ininstalments, the unit prices used fortransactions will be those available on theday the transaction takes effect, ratherthan the day of the request. In the eventthat the investment option becomessuspended (e.g. due to illiquidity), you willbe unable to make additional
contributions, withdrawals or switchesinto or out of that suspended investmentoption. As part of the suspension:
Any contributions or rollovers thatwould otherwise be invested in thesuspended investment option inaccordance with your investmentstrategy will instead be invested in analternative option, e.g. the MLC CashFund, until you provide us withalternative instructions; Any insurance cover you hold maycease if there are insufficient monies inyour non-suspended investmentoptions to cover the cost of theinsurance; andYou may only withdraw your funds inaccordance with any withdrawal offerthat we make.
We are not responsible for losses thatdelayed or suspended transactions maycause.
4 | MLC MasterKey Business Super Investment Menu
Investing with us

Monitoring of frequentswitchingThis product is not appropriate formembers who wish to switch theirinvestments frequently in the pursuit ofshort-term gains.
We monitor all investment options forabnormal transaction activity becausethis sort of activity can have adverseimpacts for other members.
To maintain equity, we have the right todeal with members who frequently switchby:
delaying, limiting, rejecting or applyingspecial conditions to future switchrequestspermanently cancelling membershiprejecting applications to open newaccounts in the Fund, and/orrejecting contributions and rollovers toexisting accounts
Withdrawals from the FundThe transaction will generally beprocessed using the unit price for the daythe Trustee receives relevant documentsand all requirements have been met.
The Fund Profile Tool
This easy to use, interactive tool willgive you insight into how your moneyis managed including where yourmoney is invested, how yourinvestments are performing and theinvestment fees and costs charged.
For information on the investmentoptions go to mlc.com.au/fundprofiletool
MLC MasterKey Business Super Investment Menu | 5

Before you invest, there are some thingsyou need to consider.
How much risk you're prepared to acceptis determined by various factors,including:
your investment goalsthe savings you'll need to reach thesegoalsyour age and how many years you haveto investwhere your other assets are investedthe return you may expect from yourinvestments, andhow comfortable you are withinvestment risk.
Investment riskAll investments come with some risk.Some investment options will have morerisk than others, as it depends on anoption’s investment strategy and assets.
The value of an investment with a higherlevel of risk will tend to rise and fall moreoften and by greater amounts thaninvestments with lower levels of risk, ieit’s more volatile.
While it may seem confronting,investment risk is a normal part ofinvesting. Without it you may not get thereturns you need to reach yourinvestment goals. This is known as therisk/return trade-off.
Many factors influence an investment’svalue. These include, but aren’t limited to:
market sentimentchanges in inflationgrowth and contraction in Australianand overseas economieschanges in interest ratesdefaults on loanscompany specific issuesliquidity (the ability to buy or sellinvestments when you want to)changes in the value of the Australiandollarinvestments and withdrawals by otherinvestors
changes in Australian and overseaslaws, anda counterparty not meeting itsobligations eg when buying securities,the seller may not deliver on thecontract by failing to provide thesecurities.
VolatilityPeriods of volatility can be unsettling andmay occur regularly. You may find itreassuring to know that ofteninvestments that produce higher returnsand growth over long periods tend to bemore volatile in the short term.
By accepting that volatility will occur,you’ll be better able to manage yourreaction to short-term movements. Thiswill help you stay true to your long-terminvestment strategy.
When choosing your investment, it’simportant to understand that:
its value and returns will vary over timeassets with higher long-term returnpotential usually have higher levels ofshort-term riskreturns aren’t guaranteed and you maylose moneyfuture returns will differ from pastreturns, andyour future super savings (includingcontributions and returns) may not beenough to provide sufficiently for yourretirement.
Diversify to reduce volatility andother risksDiversification – investing in a range ofinvestments – is a sound way to reducethe short-term volatility of a portfolio’sreturns. That’s because different types ofinvestments perform well in differenttimes and circumstances. When some areproviding good returns, others may notbe.
Portfolios can be diversified acrossdifferent asset classes, industries,securities and countries, as well as acrossinvestment managers with differentapproaches.
The more you diversify, the less impactany one investment can have on youroverall returns.
One of the most effective ways ofreducing volatility is to diversify across arange of asset classes.
Diversification across asset classes isjust one way of managing risk. Ourmulti-asset portfolios diversify acrossasset classes and investmentmanagers. Please refer to 'Approach toinvesting' in the 'Investing in MLCinvestment options' section for moreinformation.
A financial adviser can help you clarifygoals and assist with creating afinancial plan which helps you managerisk and consider issues such as:
how many years you have to investthe savings you'll need to reach yourgoalsthe return you may expect fromyour investments, andhow comfortable you are withvolatility.
6 | MLC MasterKey Business Super Investment Menu
Things to considerbefore you invest

Types of assetsAsset classes are commonly grouped as defensive or growth, based on their different characteristics.
Defensive assets, such as cash and fixed income, may help provide positive returns in a portfolio when share markets are weak. On theother hand growth assets, such as shares and property, may be included in a portfolio because of their potential to produce higher returnsthan cash in the long term.
Multi-asset portfolios are usually invested across both defensive and growth assets because their risk and return characteristics tendto be diverse. However in some market conditions, all types of assets may move in the same direction, delivering low or negative returnsat the same time.
The main differences between defensive and growth assets are:
GrowthDefensive
To provide long-term capital growth.To stabilise returns.How they are generally used
Expected to produce higher returns, and be morevolatile, than defensive assets over the longterm.
Expected to produce lower returns, and be lessvolatile, than growth assets over the long term.
Risk and return characteristics
Asset classesAsset classes are groups of similar types of investments. Each class has its risks and benefits, and goes through its own market cycle.
A market cycle can take a couple of years or many years as prices rise, peak, fall and stabilise. Through investing for the long term, atleast through a whole market cycle, you can improve your chance of benefiting from a period of strong returns and growth to offsetperiods of weakness.
The illustration below shows indicative returns and volatility for the main asset classes over a whole market cycle. However, each marketcycle is different, so unfortunately it isn’t possible to accurately predict asset class returns or their volatility. Depending on the conditionsat the time, actual returns could be significantly different from those shown.
Indicative volatility
Lower Higher
Higher
Shares
Fixed income
Indi
cati
ve re
turn
s
Cash
Indicative returns and volatility over a market cycle
Alternatives
Infrastructure
Property
Private equity
A137770-0921
Source: MLC Asset ManagementSource: MLC Asset Management
MLC MasterKey Business Super Investment Menu | 7

Here are the main asset class risks andbenefits.
Cash
Cash is generally a low risk investment.
Things to consider:
Cash is often included in a portfolio tomeet liquidity needs and stabilisereturns.The return is typically all income andis referred to as interest or yield.Cash is usually the least volatile type ofinvestment. It also tends to have thelowest return over a market cycle.The value of an investment in highquality cash securities tends not tochange. However, in extreme marketenvironments cash interest rates oryields could become negative, resultingin a gradual decline in the value of yourinvestment over time.Many cash funds invest in fixed incomesecurities that have a very short termuntil maturity.
Fixed income (including term deposits)
When investing in fixed income you’reeffectively lending money to businessesor governments. Bonds are a commonform of fixed income security. Fixedincome is also known as fixed interest.
Things to consider:
Fixed income securities are usuallyincluded in a portfolio for theirrelatively stable return characteristics.Returns typically comprise interest andchanges in the market value of the fixedincome security. While income fromfixed income securities usuallystabilises returns, falls in their marketvalue may result in a loss on yourinvestment. Market values may fall dueto concern about defaults on loans oran increase in interest rates.Values of fixed income securities tendto move in opposite directions tointerest rates. So when interest ratesrise, fixed income securities’ valuestend to fall and when interest rates fall,values can rise. When interest rates andinterest income are low or negative,even small rises in interest rates may
lead to falling market values and losses.Duration is a common measure of aninvestment’s sensitivity to changes ininterest rates. To illustrate, if interestrates rise sharply by 1%, and a fixedincome fund has a duration of threeyears, the fund would likely loseapproximately 3% of its value. Thelonger the duration of a fixed incomeinvestment, the more its value will beimpacted by rising or falling interestrates, and the greater its interest raterisk.Market values of fixed income securitiesmay rise or fall due to changes inperceptions of the business orgovernment issuing the securities beingable to meet their interest andrepayment obligations. This is knownas default risk or credit risk. Issuerswith higher credit quality areconsidered investment grade and havea lower credit risk than issuers belowinvestment grade. Fixed incomesecurities with higher credit risk arereferred to as credit or highyield. Higher credit risk securitiesgenerally have higher potential returns(yields) to compensate investors fortheir higher risk. There are different types of fixedincome securities and these will havedifferent returns and volatility.Investing in fixed income securitiesoutside Australia may expose yourportfolio to movements in exchangerates.
Alternatives
These are a very diverse group of assets.Some examples may include hedge funds,real return strategies, and gold.
Things to consider:
Because alternatives are diverse, theymay be included in a portfolio for theirdefensive or growth characteristics.Alternative investments are usuallyincluded in portfolios to increasediversification and provide returns thataren’t strongly linked with theperformance of mainstream assets.
Investment managers includealternative investments in a portfoliobecause they generally expect thereturn and diversification benefits ofalternative investments to outweighthe higher costs often associated withthem.Some alternative strategies aremanaged to deliver a targeted outcome.For example, real return strategies aimto produce returns exceeding increasesin the costs of living (ie inflation).For some alternatives, such ashedge funds, derivatives may beused extensively and it can be lessobvious which assets you’re investingin compared to other asset classes.Some alternative investmentsare illiquid, which makes them difficultto buy or sell.Because most alternative investmentsaren’t listed on an exchange,determining their value for a fund’s unitprice can be difficult and may involvea considerable time lag.Alternatives invested outside Australiamay expose your portfolio tomovements in exchange rates.
Infrastructure
Infrastructure businesses own, operate,and maintain a diverse range ofinfrastructure assets such as toll roads,rail facilities, telecommunicationsnetworks, and airports. Access to thesebusinesses may be through companies orsecurities listed on a securities exchange,through unlisted trusts, or directownership.
Things to consider:
Infrastructure is usually included in aportfolio for its growth and defensivecharacteristics.As many infrastructure assets are oftenhighly regulated monopolies, theirrevenue streams tend to be moreregular and stable than other growthassets. Returns typically comprise income aswell as changes in the value of theassets through time.
8 | MLC MasterKey Business Super Investment Menu
Things to considerbefore you invest

Returns are driven by many factorsincluding the economic environmentin various countries.As a result of differences in valuationfrequency, listed infrastructuresecurities’ returns may appear morevolatile than unlisted infrastructure.Listed infrastructure securities arelisted on an exchange, so their pricesconstantly reflect the market’s changingview of their values, while unlistedinfrastructure asset valuations aretypically periodic and regular. Investments in listed infrastructuresecurities generally provide investorsgreater diversification across countries,sectors and businesses thaninvestments that aren’t listed.The global infrastructure market offersmore diversification than the Australianmarket.Unlisted infrastructure is less liquidwhich makes it more difficult for aninvestment manager to buy or sell. Investing outside Australia may exposeyour portfolio to movements inexchange rates.
Property
Access to property may be through trustslisted on a securities exchange (known aslisted property securities, Real EstateInvestment Trusts, or REITs), unlistedproperty trusts, or direct ownership.Investments may include retail,commercial, industrial and residentialproperties in Australia and around theworld.
Things to consider:
Property is usually included in aportfolio for its growth and defensivecharacteristics.Returns typically comprise income(such as rental or REIT income) andchanges in value.Returns are driven by many factorsincluding the economic environmentin various countries.Returns from property can be volatile.Because listed property securities arelisted on an exchange, their pricesconstantly reflect the market’s changingview of REIT values. Unlisted property
values are more difficult to determineand usually involve a considerable timelag. As a result of these differences invaluation frequency, listed propertysecurities’ returns may be more volatilethan unlisted property.Investments in listed propertysecurities generally provide investorsgreater diversification across countries,sectors, properties, and property-relatedcompanies than investments that aren’tlisted. And the global listed propertysecurities market is even morediversified than the Australian market.Unlisted property is illiquid whichmakes it more difficult for aninvestment manager to buy or sell. Investing outside Australia may exposeyour portfolio to movements inexchange rates.
Australian shares
This asset class consists of investmentsin companies listed on the AustralianSecurities Exchange (and other regulatedexchanges). Shares are also known asequities.
Things to consider:
Australian shares can be volatile andare usually included in a portfolio fortheir growth characteristics.The Australian share market is lessdiversified than the global marketbecause Australia is currentlydominated by a few industries such asFinancials and Resources.Returns usually comprise dividendincome and changes in share prices.Dividends may have the benefit of taxcredits attached to them (known asfranking or imputation credits).Returns are driven by many factorsincluding the performance of theAustralian economy.Companies listed on the Australianshare market can be grouped as small,medium and large capitalisation (cap)based on factors including the totalmarket value of their listed shares andliquidity. Investors in small capcompanies generally experience greaterprice volatility than shares in large capcompanies because small cap
companies trade less frequently and inlower volumes. They may alsounderperform large cap companies formany years.
Global shares
Global shares consist of investments incompanies listed on securities exchangesaround the world.
Things to consider:
Global shares can be volatile and areusually included in a portfolio for theirgrowth characteristics.The number of potential investmentsis far greater than in Australian shares.Returns usually comprise dividendincome and changes in share prices.Returns are driven by many factorsincluding the economic environmentin various countries.When you invest globally, you’re lessexposed to the risks associated withinvesting in just one economy.Investing outside Australia meansyou’re exposed to movements inexchange rates.
Private equity
When investing in private equity you'reeffectively owning shares inprivately-owned businesses that aren'tlisted on exchanges.
Things to consider:
Private equity is usually included in aportfolio for its growth characteristics.Returns are driven by many factorsincluding the economic environmentin different countries.Private equity can be volatile.Private equity may be included in aportfolio to provide higher returns thanlisted share markets in the long run, andto increase diversification.Private equity is illiquid which makesit difficult to buy or sell.To access private equity you generallyneed to invest in a managed fund thatinvests in private equity.Because private equity isn't listed onan exchange, determining its value fora fund’s unit price can be difficult andmay involve a considerable time lag.
MLC MasterKey Business Super Investment Menu | 9

Investment approachesInvestment managers have differentapproaches to selecting investments,which invariably results in differentreturns. No single investment approachis guaranteed to outperform all others inall market conditions.
There are generally two broad approaches:passive and active management.
Passive management
Passive, or index, managers chooseinvestments to form a portfolio which willdeliver a return that closely tracks amarket benchmark (or index). Passivemanagers tend to have lower costsbecause they don’t require extensiveresources to select investments.
Active management
Active managers select investments theybelieve, based on research, will performbetter than a market benchmark over thelong term.
They buy or sell investments when theirmarket outlook alters or investmentinsights change.
The degree of active management affectsreturns. Less active managers take smallpositions away from the marketbenchmark and more active managerstake larger positions. Generally, the largeran investment manager's positions, themore their returns will differ from thebenchmark.
Active managers have differentinvestment styles that also affect theirreturns. Some common investment stylesare:
Bottom-up – focuses on forecastingreturns for individual companies, ratherthan the market as a whole.Top-down – focuses on forecastingbroad macroeconomic trends and theireffect on the market, rather thanreturns for individual companies.Growth – focuses on companies theyexpect will have strong earningsgrowth.
Value – focuses on companies theybelieve are undervalued (their pricedoesn’t reflect earning potential).Income – focuses on generating aregular income stream through selectingcompanies, trusts and other securitiesthey believe will deliver income, orthrough using derivatives and otherstrategies.Core – aims to produce competitivereturns in all periods.
Responsible investingEnvironmental, social, governance (ESG),and ethical factors impact thesustainability of companies andgovernments and therefore influence thereturns from investing. Incorporating ESGand ethical considerations intoinvestment decisions is known asresponsible investing.
Examples of ESG and ethical factors are:
Environmental - climate change, wasteand pollution, resource depletion.Social and labour standards - workingconditions, employee relations anddiversity, health and safety.Governance - executive pay, bribery andcorruption, tax strategy.Ethical considerations - other factorsthat could be detrimental to the broadercommunity.
We don’t (as Trustee) take into accountlabour standards, environmental, socialand ethical considerations for thepurposes of selecting, retaining orrealising investments.
How responsible investing applies to theinvestment options available to you, isoutlined below.
MLC investment options
Investment management decisions forthe MLC investment options are made byour investment experts at MLC AssetManagement, and the investmentmanagers they select.
MLC Asset Management expects activeinvestment managers to consider materialeffects any factors may have oninvestment returns, including ESG andethical factors. MLC Asset Management
and the investment managers also engagewith companies, providing an opportunityto enhance and protect the long-termvalue of investments.
We don’t intend for the MLC investmentoptions to invest in tobaccomanufacturing companies. There may,from time to time, be a small level ofunintended tobacco-related exposure.
The MLC investment options aren’tpromoted as socially responsible or ethicalinvestments.
Externally-managed investmentoptions
How the externally managed investmentoptions consider ESG and ethical factorsis outlined in their PDS, available at mlc.com.au/findafund in the 'External funds'tab.
You can also choose to invest in a SociallyResponsible Investment (SRI) option,Perpetual Wholesale Ethical SRI Fund,available on the Investment Menu. Wherean investment option is promoted by theinvestment manager as an SRI, we assessthe degree of responsible investmentintegration into their investmentphilosophy and the process they use priorto adding the investment option tothe Investment Menu.
Investment techniquesOur investment experts and investmentmanagers may use different investmenttechniques that can change the value ofan investment.
Some of the main investment techniquesare explained below.
Derivatives
Derivatives may be used in any of theinvestment options.
Derivatives are contracts that have a valuederived from another source such as anasset, market index or interest rate. Thereare many types of derivatives includingswaps, options and futures. They are acommon tool used to manage risk orimprove returns.
10 | MLC MasterKey Business Super Investment Menu
Things to considerbefore you invest

Some derivatives allow investmentmanagers to earn large returns from smallmovements in the underlying asset’sprice. However, they can lose largeamounts if the price movement in theunderlying asset is unfavourable.
Risks particular to derivatives include therisk that the value of a derivative may notmove in line with the underlying asset,the risk that counterparties to thederivative may not be able to meetpayment obligations and the risk that aparticular derivative may be difficult orcostly to trade.
Our Derivatives Policy permits the use ofderivatives in MLC investment optionswhere consistent with an investmentoption’s objective, risk profile, disclosureand governing documents, legislative andregulatory requirements. They may beused for:
hedgingefficient portfolio management, andinvestment return generation.
Further information on our DerivativesPolicy is available at mlc.com.au/derivativesforsuper
How the external investment managersinvest in derivatives is included intheir PDS, available at mlc.com.au/findafund in the 'External funds' tab.
Currency management
If an investment manager invests inassets in other countries, its returns inAustralian dollars will be affected bymovements in exchange rates (as well aschanges in the value of the assets).
A manager of international assets maychoose to protect Australian investorsagainst movements in foreign currency.This is known as ‘hedging’. Alternatively,the manager may choose to keep theassets exposed to foreign currencymovements, or ‘unhedged’.
Returns from exposure to foreign currencycan increase diversification in a portfolio.
Gearing
If gearing could cause a meaningfulchange in an investment option's value,we’ve made a note of it in the investmentoption's profile.
Gearing can be achieved by using loans(borrowing to invest), or through investingin certain derivatives, such as futures.
Gearing magnifies exposure to potentialgains and losses of an investment. As aresult, you can expect larger fluctuations(both up and down) in the value of yourinvestment compared to the sameinvestment which is not geared.
Investment managers can take differentapproaches to gearing. Some change thegearing level to suit different marketconditions. Others maintain a target levelof gearing.
It’s important to understand the potentialrisks of gearing, as well as its potentialbenefits. When asset values are rising bymore than the costs of gearing, the returnswill generally be higher than if theinvestment wasn't geared. When assetvalues are falling, gearing can multiply thecapital loss.
If the fall is dramatic there can be evenmore implications for geared investments.For example, where the lender requiresthe gearing level to be maintained belowa predetermined limit, if asset values falldramatically, the gearing level may riseabove the limit, forcing assets to be soldwhen values may be continuing to fall.
In turn, this could lead to more assetshaving to be sold and more losses realised.Withdrawals (and applications) may besuspended in such circumstances,preventing you from accessing yourinvestments at a time when values arecontinuing to fall.
Although this is an extreme example,significant market falls have occurred inthe past. Recovering from such falls cantake many years and the gearedinvestment’s unit price may not return toits previous high.
Other circumstances (such as the lenderrequiring the loan to be repaid for otherreasons) may also prevent a geared
investment from being managed asplanned, leading to losses.
You need to be prepared for all types ofenvironments and understand theirimpact on your geared investment.
Short selling
If short selling could cause a meaningfulchange in an investment option's value,we’ve made a note of it in the investmentoption's profile.
Short selling is used by an investmentmanager when it has a view that an asset’sprice will fall. The manager borrows theasset from a lender, usually a broker, andsells it with the intention of buying it backat a lower price. If all goes to plan, a profitis made. The key risk of short selling isthat, if the price of the asset increases, theloss could be significant.
MLC MasterKey Business Super Investment Menu | 11

The information below explains terms used in the profiles for each investment option in the Investment Menu.
ExplanationTermsDescribes what the investment option aims to achieve over a certain timeframe. Most investment optionsaim to produce returns that are comparable to a benchmark.
Investment objective
The investment objective outlines whether returns used to judge an investment option's success shouldhave fees and tax included.
Investment objectives may consider fees and tax in the following ways:
After investment fees and tax (or 'after fees and tax') means that a number of items have been deductedwhen calculating the performance against an investment objective. These may include investmentfees and costs, transaction costs and tax on investment earnings. Normally, other costs such asadministration fees and costs, and other taxes haven’t been deducted.Before fees and tax means that we haven’t deducted investment fees or tax on investment earningswhen calculating the performance against an investment objective. However, some of the more variablecosts have been deducted, such as performance fees, investment costs and transaction costs.
More information on fees and tax, and how they're deducted, is available from sections 6 and 7 of thePDS.
Benchmarks are usually market indices that are publicly available. Shares are often benchmarked againsta share market index and fixed income against a fixed income market index. Other benchmarks can bebased on particular industries (eg mining), company size (eg small caps) or the wider market (eg S&P/ASX
Benchmark
200 or the MSCI World Index). Benchmarks for multi-asset portfolios may be:
made up of a combination of market indices weighted according to the asset allocation (commonlyknown as composite benchmarks), ora single measure, such as inflation. A common index of inflation, which is the rise in the cost of living,is the Consumer Price Index (CPI).
When comparing returns to a benchmark you should consider:
whether the investment option’s return is calculated before or after fees and tax are deductedthe period over which the return should be measured, andthat an investment option is unlikely to achieve its objective in all market environments.
Describes how the investment option is managed.How the investment optionis managed
Suggests why you may be interested in investing in this particular investment option. Your own personalobjectives and circumstances will also affect your decision.
The investment optionmay be suited to you if...
Investment managers suggest minimum timeframes for each investment option. Investing for theminimum suggested time or longer improves your chances of achieving a positive return. However,investing for the minimum time doesn’t guarantee a positive return outcome because every market cycle
Minimum suggestedtime to invest
is different. Your personal circumstances should determine how long you hold an investment.
Asset allocations are displayed in different ways, reflecting how the investment option is managed:Asset allocation Strategic asset allocations (also known as benchmark or long-term asset allocations) provide anindication of the proportion of an investment option invested in each asset class.Ranges indicate the minimum and maximum that may be allocated to an asset class.
Actual asset allocations aren't shown in this investment menu as they constantly change due to movementsin asset values, and activities such as buying and selling of assets by investment managers. As a result,actual asset allocations can move above and below the strategic asset allocation. While usually remainingwithin any ranges provided, actual asset allocations may temporarily move outside the ranges due tomovements in asset values.Recent actual asset allocations are available at mlc.com.au/fundprofiletoolStrategic asset allocations and ranges may change from time-to-time. We'll notify you of any materialupdates.
12 | MLC MasterKey Business Super Investment Menu
Understanding your investment options

ExplanationTermsWe include the Standard Risk Measure (SRM) to help you compare investment risk across the investmentoptions offered. The SRM is based on industry guidance and is the estimated number of negative annualreturns over any 20 year period. The SRM is not a complete assessment of investment risk, for instance
Standard Risk Measure
it doesn't:
detail the size a negative return could be or the potential for a positive return to be less than a memberrequires to meet their objectivescapture the risk of the investment manager not meeting its investment objective, ortake into account the impact of administration fees and tax, which would increase the chance of anegative return.
Members should still ensure they are comfortable with the risks and potential losses associated with theirchosen investment. Information on how the SRM is calculated is available at mlc.com.au/srm
Estimated number of negative annual returns in any20 year periodRisk labelRisk band
Less than 0.5Very low1
0.5 to less than 1Low2
1 to less than 2Low to medium3
2 to less than 3Medium4
3 to less than 4Medium to high5
4 to less than 6High6
6 or greaterVery high7
MLC MasterKey Business Super Investment Menu | 13

When you’re invested in an MLC portfolio,your money is with Australia’s mostexperienced multi-manager.
MySuper provides a mix of growth anddefensive assets which changesdepending on your age.
If you don't make a choice, your moneywill be invested in MySuper, our defaultinvestment option. We've outlined its keyfeatures in the first column on the nextpage. Or, you can choose an investmentoption from the following three groups:MLC multi-asset portfolios, MLC assetclass funds, or Cash.
MLC multi-asset portfoliosEveryone has different ideas about howtheir money should be managed, sothree sets of multi-asset portfolios havebeen developed to offer you a range ofoptions:
MLC Inflation PlusMLC Horizon, andMLC Index Plus portfolios.
These portfolios use the approach toinvesting described on page 16.
To help you decide which type of portfoliosuits you, we’ve outlined their keyfeatures on the following page.
MLC asset class fundsYou may decide to tailor your investmentstrategy using our asset class funds.
These funds invest in one asset class andsuit investors looking for a completeinvestment solution for that asset class.
CashWe also offer the MLC Cash Fund as a cashoption.
14 | MLC MasterKey Business Super Investment Menu
Investing in MLC investment options

Key features of the MLC multi-asset portfolios
MLC Index Plusportfolios
MLC Horizonportfolios
MLC Inflation Plusportfolios
MySuper
Aims to deliver returns thatmeet the portfolios’benchmark, and
deliver returns abovethe portfolios’benchmark, and
deliver returns aboveinflation over a definedtimeframe, and
deliver returns aboveinflation over any 10year period, andlimit the risk ofnegative annual returns
reduce risk in theportfolios when ourinvestment experts
reduce risk in theportfolios when ourinvestment experts
limit the risk of anegative return overthat timeframe.to less than 4 years in
any 20 year period. consider risks are toohigh.
consider risks are toohigh.
May suit you if you... want to keep costsdown by using mostlylower cost investment
value activemanagement
value activemanagement
want to rely on us tochange yourinvestments throughyour working life
want to rely largely onthe market for returns,and
want to rely oninvestment experts todeliver returns above
managers, includingindex (passive)managers
value activemanagement while alsokeeping costs down
inflation, rather thanjust relying on the
want to know the assetallocation is activelymanaged to reduce risk
want to rely largely onthe market for returns,and
market, andthrough a mix of activeand lower costinvestment managers
and achieve returns.expect the assetallocation to changesignificantly over time
expect the assetallocation to be activelymanaged to reduce risk
want to rely largely onthe market for returns,and
in order to manage riskand achieve returns. and achieve returns.
want to know the assetallocation is activelymanaged to reduce riskand achieve returns.
How your portfolio ismanaged
diversified acrossmostly mainstreamasset classes
diversified acrossmainstream assetclasses, with some
broadly diversifiedacross many assetclasses, including
the mix of growth anddefensive assetschanges depending onyour age exposure to alternative
assets and strategiesalternative assets andstrategies
asset allocationmanaged withindefined ranges, and
diversified across manyasset classes includingunlisted assets such as
asset allocationmanaged withindefined ranges, and
flexible asset allocation,and use specialist index and
index enhancedmanagers to keep costs
private equity,property, infrastructureand other alternative
mostly activemanagers. mostly active
managers. down, and activemanagers to helpstrategiesmanage the portfolios’asset allocation
managed withindefined ranges, and
risks and returns.
combines active andpassive managers.
More details on these portfolios are available in the investment option profiles on the following pages.
MLC MasterKey Business Super Investment Menu | 15

Approach to investingFor over 35 years our investment expertshave been designing portfolios using amulti-manager approach, to help investorsachieve their goals.
The four key aspects of this investmentapproach are:
1. Portfolio design
Our multi-asset portfolios focus on whataffects investor outcomes the most - assetallocation.
Each asset class has its own return andrisk characteristics. Money is allocatedbetween asset classes based on thefollowing beliefs:
Risk can’t be avoided, but can bemanaged
To navigate our portfolios throughdifferent environments, our investmentexperts consider how economic andmarket conditions might unfold. Theinsights from this analysis are used towork out the combination of asset classesthat they believe will best achieve aportfolio’s objective.
This helps prepare our portfolios forfuture market ups and downs.
Returns and risks vary through time
Analysis of how economic and marketconditions might develop shows ourinvestment experts how the potentialreturns and risks of each asset class couldchange over the next three to seven years.
With this information, our portfolios’asset allocations are adjusted to improvetheir return potential or reduce their risk.
Diversification matters
Asset classes perform differently indifferent market conditions.
Investing in many asset classes helpssmooth out the overall portfolios' returns,as asset class ups and downs can offsetone another.
2. Managing the portfolio
Our portfolios have different investmentobjectives. That’s why our investmentexperts select a different mix of assetsand investment managers for each.
The investment managers may bespecialist in-house managers, externalmanagers or a combination of both.
Our investment experts researchhundreds of investment managers fromaround the world and select the managersthey believe are the best for our portfolios.
They are then combined in our portfoliosso they complement each other.
This multi-manager approach helps toreduce risk and deliver more consistentreturns.
You can find out about the investmentmanagers at mlc.com.au/investmentmanagers
3. Ongoing review
To make sure our portfolios are workinghard for investors, our investment expertscontinuously review and actively managethem.
This includes adjusting the assetallocation, investment strategies andmanagers.
This may be because our investmentexperts' assessment of the future marketenvironment has altered or becausethey've found new ways to balance riskand return in the portfolios.
4. Portfolio implementation
We deliver better returns by avoidingunnecessary costs. Our investmentexperts help us do this by carefullymanaging cash flows, tax and changes inour portfolios.
16 | MLC MasterKey Business Super Investment Menu

MySuperMySuper provides a mix of growth and defensive assets which changes depending on your age. When you’re younger you’ll be investedin more growth assets and from age 55, we’ll gradually decrease your growth assets and increase your defensive assets. We’ll make thisgradual shift until you turn 65.
% o
f M
ySu
per
inve
stm
ent
Age55Under 550
50
100
65 Growth Defensive
Strategic asset allocation range
MySuper
MySuper is broadly diversified across mainstream asset classes, with some exposure toprivate and alternative assets and strategies. It uses both active and passive investmentmanagers. These managers invest in many companies and securities in Australia and
How the investment option is managed
overseas.
In accordance with our investment experts' view of how the economic and marketconditions might change, allocations to the asset classes are actively adjusted away fromthe strategic asset allocation, while aiming to remain within the defined ranges shownbelow.
The investment option may be suited toyou if...
you want your investments to change with you through your working life, withoutactively choosing your investmentsyou want to grow your super through a strong bias to growth assetsyou want a long-term investment, andyou understand that there can be large fluctuations in the value of your investment.
7 yearsMinimum suggested time to invest
The portfolio’s Benchmark is a combination of market indices. Details are available at mlc.com.au/mysuperbenchmark
Benchmark
As MySuper is age based the following tables help explain how MySuper works for you at various stages in your life.
MLC MasterKey Business Super Investment Menu | 17

MySuper
At age 56At age 55Under age 55To outperform inflation,measured by the Consumer PriceIndex, by 3.4% pa after
To outperform inflation,measured by the Consumer PriceIndex, by 3.5% pa after
To outperform inflation,measured by the Consumer PriceIndex, by 3.5% pa after
Investment objective
investment fees and taxes, overinvestment fees and taxes, overinvestment fees and taxes, overany 10 year period.any 10 year period.any 10 year period.
Strategic asset allocation(and ranges)
22%
78%Growth assets
Defensive assets
M153052-0219
Strategic asset allocation(and ranges)
M153051-0219
21%
79%Growth assets
Defensive assets
Strategic asset allocation(and ranges)
109-206 MLCE9579_33x33_MKBS Investment Menu – MLC MySuper Pie Charts_PRES_1D_01
33.5mm W x 33.5mm H - under age 55
33.5mm W x 33.5mm H - under age 63
33.5mm W x 33.5mm H - at age 60
33.5mm W x 33.5mm H - at age 64
33.5mm W x 33.5mm H - at age 61 33.5mm W x 33.5mm H - at age 62
25%
75%Growth assets
Defensive assets
26%
74%Growth assets
Defensive assets
27%
73%Growth assets
Defensive assets
29%
71%Growth assets
Defensive assets
31%
69%Growth assets
Defensive assets
21%
79%Growth assets
Defensive assets
Asset allocation
5% (0% - 30%)5% (0% - 30%)5% (0% - 30%)Cash7% (1% - 21%)6% (0% - 20%)6% (0% - 20%)Fixed income - diversified
11% (5% - 25%)11% (5% - 25%)11% (5% - 25%)Fixed income - credit5% (0% - 15%)5% (0% - 15%)5% (0% - 15%)Alternatives and other6% (0% - 20%)6% (0% - 20%)6% (0% - 20%)Infrastructure7% (0% - 20%)7% (0% - 20%)7% (0% - 20%)Property
28% (15% - 45%)29% (15% - 45%)29% (15% - 45%)Global shares26% (10% - 40%)26% (10% - 40%)26% (10% - 40%)Australian shares
5% (0% - 15%)5% (0% - 15%)5% (0% - 15%)Private equity22% (6% - 36%)21% (5% - 35%)21% (5% - 35%)Defensive assets
78% (64% - 94%)79% (65% - 95%)79% (65% - 95%)Growth assetsHigh (estimate of 4 to 6
negative annual returns in any20 year period)
High (estimate of 4 to 6negative annual returns in any
20 year period)
High (estimate of 4 to 6negative annual returns in any
20 year period)
Standard Risk Measure
18 | MLC MasterKey Business Super Investment Menu

At age 59At age 58At age 57To outperform inflation,measured by the Consumer PriceIndex, by 3.3% pa after
To outperform inflation,measured by the Consumer PriceIndex, by 3.4% pa after
To outperform inflation,measured by the Consumer PriceIndex, by 3.4% pa after
Investment objective
investment fees and taxes, overinvestment fees and taxes, overinvestment fees and taxes, overany 10 year period.any 10 year period.any 10 year period.
Strategic asset allocation(and ranges)
25%
75%Growth assets
Defensive assets
M153055-0219
Strategic asset allocation(and ranges)
24%
76%Growth assets
Defensive assets
M153054-0219
Strategic asset allocation(and ranges)
23%
77%Growth assets
Defensive assets
M153053-0219
Asset allocation
6% (0% - 30%)5% (0% - 30%)5% (0% - 30%)Cash9% (2% - 23%)8% (1% - 22%)8% (1% - 22%)Fixed income - diversified11% (4% - 24%)11% (5% - 25%)11% (5% - 25%)Fixed income - credit5% (0% - 15%)5% (0% - 15%)5% (0% - 15%)Alternatives and other5% (0% - 19%)6% (0% - 20%)6% (0% - 20%)Infrastructure7% (0% - 19%)7% (0% - 20%)7% (0% - 20%)Property
27% (14% - 44%)28% (14% - 44%)28% (14% - 44%)Global shares25% (9% - 39%)25% (10% - 40%)25% (10% - 40%)Australian shares5% (0% - 15%)5% (0% - 15%)5% (0% - 15%)Private equity
25% (9% - 39%)24% (8% - 38%)23% (7% - 37%)Defensive assets75% (61% - 91%)76% (62% - 92%)77% (63% - 93%)Growth assets
High (estimate of 4 to 6 negativeannual returns
in any 20 year period)
High (estimate of 4 to 6 negativeannual returns
in any 20 year period)
High (estimate of 4 to 6 negativeannual returns
in any 20 year period)
Standard Risk Measure
MLC MasterKey Business Super Investment Menu | 19

MySuper
At age 62At age 61At age 60To outperform inflation,measured by the Consumer PriceIndex, by 3.2% pa after
To outperform inflation,measured by the Consumer PriceIndex, by 3.3% pa after
To outperform inflation,measured by the Consumer PriceIndex, by 3.3% pa after
Investment objective
investment fees and taxes, overinvestment fees and taxes, overinvestment fees and taxes, overany 10 year period.any 10 year period.any 10 year period.
Strategic asset allocation(and ranges)
109-206 MLCE9579_33x33_MKBS Investment Menu – MLC MySuper Pie Charts_PRES_1D_01
33.5mm W x 33.5mm H - under age 55
33.5mm W x 33.5mm H - under age 63
33.5mm W x 33.5mm H - at age 60
33.5mm W x 33.5mm H - at age 64
33.5mm W x 33.5mm H - at age 61 33.5mm W x 33.5mm H - at age 62
25%
75%Growth assets
Defensive assets
26%
74%Growth assets
Defensive assets
27%
73%Growth assets
Defensive assets
29%
71%Growth assets
Defensive assets
31%
69%Growth assets
Defensive assets
21%
79%Growth assets
Defensive assets
Asset allocation
6% (0% - 30%)6% (0% - 30%)6% (0% - 30%)Cash11% (3% - 26%)10% (3% - 25%)10% (2% - 24%)Fixed income - diversified11% (4% - 24%)11% (4% - 24%)11% (4% - 24%)Fixed income - credit 5% (0% - 15%)5% (0% - 15%)5% (0% - 15%)Alternatives and other5% (0% - 19%)5% (0% - 19%)5% (0% - 19%)Infrastructure7% (0% - 19%)7% (0% - 19%)7% (0% - 19%)Property
26% (13% - 43%)27% (13% - 43%)27% (13% - 43%)Global shares24% (9% - 39%)24% (9% - 39%)24% (9% - 39%)Australian shares5% (0% - 15%)5% (0% - 15%)5% (0% - 15%)Private equity
27% (12% - 42%)26% (11% - 41%)25% (10% - 40%)Defensive assets73% (58% - 88%)74% (59% - 89%)75% (60% - 90%)Growth assets
High (estimate of 4 to 6 yearnegative annual returns in any 20
year period)
High (estimate of 4 to 6 yearnegative annual returns in any 20
year period)
High (estimate of 4 to 6 yearnegative annual returns in any 20
year period)
Standard Risk Measure
20 | MLC MasterKey Business Super Investment Menu

Age 65 and overAt age 64At age 63To outperform inflation,measured by the Consumer PriceIndex, by 3.0% pa after
To outperform inflation,measured by the Consumer PriceIndex, by 3.1% pa after
To outperform inflation,measured by the Consumer PriceIndex, by 3.2% pa after
Investment objective
investment fees and taxes, overinvestment fees and taxes, overinvestment fees and taxes, overany 10 year period.any 10 year period.any 10 year period.
Strategic asset allocation(and ranges)
34%
66%Growth assets
Defensiveassets
M153061-0219
Strategic asset allocation(and ranges)
109-206 MLCE9579_33x33_MKBS Investment Menu – MLC MySuper Pie Charts_PRES_1D_01
33.5mm W x 33.5mm H - under age 55
33.5mm W x 33.5mm H - under age 63
33.5mm W x 33.5mm H - at age 60
33.5mm W x 33.5mm H - at age 64
33.5mm W x 33.5mm H - at age 61 33.5mm W x 33.5mm H - at age 62
25%
75%Growth assets
Defensive assets
26%
74%Growth assets
Defensive assets
27%
73%Growth assets
Defensive assets
29%
71%Growth assets
Defensive assets
31%
69%Growth assets
Defensive assets
21%
79%Growth assets
Defensive assets
Asset allocation
14% (8% - 36%)11% (5% - 34%)9% (3% - 32%)Cash11% (4% - 24%)11% (3% - 25%)10% (3% - 25%)Fixed income - diversified10% (3% - 22%)10% (4% - 23%)11% (4% - 23%)Fixed income - credit4% (0% - 14%)5% (0% - 14%)5% (0% - 15%)Alternatives and other5% (0% - 17%)5% (0% - 18%)5% (0% - 18%)Infrastructure6% (0% - 17%)6% (0% - 18%)6% (0% - 18%)Property
24% (11% - 39%)25% (12% - 40%)26% (12% - 42%)Global shares22% (8% - 36%)23% (8% - 37%)23% (9% - 38%)Australian shares4% (0% - 14%)4% (0% - 14%)5% (0% - 15%)Private equity
34% (20% - 47%)31% (17% - 45%)29% (14% - 44%)Defensive assets66% (53% - 80%)69% (55% - 83%)71% (56% - 86%)Growth assets
High (estimate of 4 to 6 yearnegative annual returns in any 20
year period)
High (estimate of 4 to 6 yearnegative annual returns in any 20
year period)
High (estimate of 4 to 6 yearnegative annual returns in any 20
year period)
Standard Risk Measure
MLC MasterKey Business Super Investment Menu | 21

MySuper
As MySuper is age based the following tables help explain how MySuper works for you at various stages in your life.
To achieve this mix of growth and defensive assets which changes as you get older, MySuper uses a combination of the three investmentportfolios shown below. When you're younger you'll be 100% invested in one portfolio, MySuper Growth. From age 55, we add a secondportfolio, MySuper Conservative Growth, where a portion of your MySuper balance will be invested. Shortly after you turn 62, you'll beinvested across three portfolios, with a portion of your MySuper balance invested in MySuper Cash Plus.
These investment portfolios work together for you so that your balance in MySuper includes both growth assets and defensive assets.
From age 55, we’ll check how much you have in each portfolio, and adjust your weightings based on your age, as shown below. We’ll dothis every three months based on the date of your birthday. Any contributions made to MySuper will also be split across these threeportfolios based on your age.
Your allocation to each MySuper portfolio at different agesAgeMySuper Cash Plus Portfolio (%)MySuper Conservative Growth
Portfolio (%)MySuper Growth Portfolio (%)
100%Under 55 years1%99%554%96%567%93%5710%90%5813%87%5916%84%6019%81%6122%78%62
2%23%75%635%23%72%648%24%68%65 and over
The percentage figures in the table above have been rounded to whole numbers.
MySuper Cash PlusPortfolio
MySuper ConservativeGrowth Portfolio
MySuper GrowthPortfolio
To outperform the BloombergAusBond Bank Bill Index, beforefees and taxes, over any 1 year
To outperform inflation,measured by the Consumer PriceIndex, by 2% pa after investment
To outperform inflation,measured by the Consumer PriceIndex, by 3.5% pa after
Investment objective
period.fees and taxes, over any 7 yearinvestment fees and taxes, overperiod. any 10 year period.
Strategic asset allocationStrategic asset allocation(and ranges)
Strategic asset allocation(and ranges)
Asset allocation
100%10% (0% - 30%)5% (0% - 30%)Cash30% (15% - 45%)6% (0% - 20%)Fixed income - diversified10% (0% - 20%)11% (5% - 25%)Fixed income - credit4% (0% - 15%)5% (0% - 15%)Alternatives and other3% (0% - 15%)6% (0% - 20%)Infrastructure5% (0% - 15%)7% (0% - 20%)Property17% (5% - 35%)29% (15% - 45%)Global shares17% (5% - 35%)26% (10% - 40%)Australian shares4% (0% - 15%)5% (0% - 15%)Private equity
48% (35% - 65%)21% (5% - 35%)Defensive assets52% (35% - 65%)79% (65% - 95%)Growth assets
Very low (estimate of less than1 negative annual return inany 20 year period)
Medium to high (estimate of 3 to4 negative annual returns in any20 year period)
High (estimate of 4 to 6negative annual returns inany 20 year period)
Standard Risk Measure
22 | MLC MasterKey Business Super Investment Menu

MLC Inflation Plus - Conservative PortfolioAims to deliver a return of 1.7% pa above inflation (after fees and tax) subject to limiting the risk ofnegative returns over 3 year periods.
Investment objective
This careful risk management approach means there may be times, such as when interest rates areunusually low, when the portfolio requires an extended time period to achieve its return objective.In most circumstances the portfolio is expected to provide positive returns over 3 year periods,although there will sometimes be negative returns over shorter periods.
The measure of inflation is the Consumer Price Index, calculated by the Australian Bureau of Statistics.Benchmark
The key aspects of the way the portfolio is managed are:How the investment option ismanaged
1 Flexible asset allocation – the asset allocation is actively managed in accordance with our investmentexperts' changing view of potential opportunities and risks in investment markets.
2 Diversification – the portfolio invests across a wide range of assets and strategies. These mayinclude both mainstream (eg shares and government bonds) and alternative investments (eg hedgefunds) that may not be widely used in other investment funds. Specialist investment managersfrom around the world are carefully selected to manage the assets and strategies.
3 Strong focus on risk management – the portfolio has the flexibility not to invest in an asset classif that would cause too much risk of a negative return over 3 years. This means the portfolio mayhave no exposure to growth assets in some market conditions.
By managing the portfolio in this way, movements in the portfolio’s value (both up and down) shouldbe less significant.
The portfolio uses all aspects of the approach to investing, outlined earlier. In addition, the portfoliouses a market-leading Investment Futures Framework to manage risk and identify opportunities.
You can find more information on the Investment Futures Framework at mlcam.com.au/futuresframework
The investment option may besuited to you if...
you’re aiming to achieve a return above inflation but, more importantly, are concerned about losingmoney over a 3 year periodyou understand the return achieved by the portfolio may be significantly higher or lower than itsobjectiveyou want our investment experts to flexibly adjust the portfolio's asset allocation in accordancewith their changing view of potential opportunities and risks in investment markets, andyou want to manage investment risk by diversifying across asset classes and strategies.
3 to 5 yearsMinimum suggested time toinvest
Asset allocation RangesAsset class0% - 100%Cash0% - 60%Australian fixed income0% - 60%Global fixed income0% - 30%Alternatives0% - 30%Property0% - 40%Global shares0% - 40%Australian shares0% - 15%Private equity
30% - 100%0% - 60%
Total fixed income and cashTotal shares and property
Medium (estimate of 2 to 3 negative annual returns in any 20 year period)Standard Risk Measure
MLC MasterKey Business Super Investment Menu | 23
MLC InflationPlus portfolios

MLC Inflation Plus - Moderate PortfolioAims to deliver a return of 3% pa above inflation (after fees and tax) subject to limiting the risk ofnegative returns over 5 year periods.
Investment objective
This careful risk management approach means there may be times, such as when interest rates areunusually low, when the portfolio requires an extended time period to achieve its return objective.In most circumstances the portfolio is expected to provide positive returns over 5 year periods,although there will sometimes be negative returns over shorter periods.
The measure of inflation is the Consumer Price Index, calculated by the Australian Bureau of Statistics.Benchmark
The key aspects of the way the portfolio is managed are:How the investment option ismanaged
1 Flexible asset allocation – the asset allocation is actively managed in accordance with our investmentexperts' changing view of potential opportunities and risks in investment markets.
2 Diversification – the portfolio invests across a wide range of assets and strategies. These mayinclude both mainstream (eg shares and government bonds) and alternative investments (eg hedgefunds) that may not be widely used in other investment funds. Specialist investment managersfrom around the world are carefully selected to manage the assets and strategies.
3 Strong focus on risk management – the portfolio has the flexibility not to invest in an asset classif that would cause too much risk of a negative return over 5 years. This means the portfolio mayhave low exposure to growth assets in some market conditions.
By managing the portfolio in this way, movements in the portfolio’s value (both up and down) shouldbe less significant.
The portfolio uses all aspects of the approach to investing, outlined earlier. In addition, the portfoliouses a market-leading Investment Futures Framework to manage risk and identify opportunities.You can find more information on the Investment Futures Framework at mlcam.com.au/futuresframework
The investment option may besuited to you if...
you’re aiming to achieve a return above inflation but, more importantly, are concerned about losingmoney over a 5 year periodyou understand the return achieved by the portfolio may be significantly higher or lower than itsobjectiveyou want our investment experts to flexibly adjust the portfolio's asset allocation in accordancewith their changing view of potential opportunities and risks in investment markets, andyou want to manage investment risk by diversifying across asset classes and strategies.
5 to 7 yearsMinimum suggested time toinvest
Asset allocation RangesAsset class0% - 100%Cash0% - 60%Australian fixed income0% - 60%Global fixed income0% - 30%Alternatives0% - 40%Property0% - 50%Global shares0% - 50%Australian shares0% - 15%Private equity
5% - 100%Total fixed income and cash0% - 80%Total shares and property
High (estimate of 4 to 6 negative annual returns in any 20 year period)Standard Risk Measure
24 | MLC MasterKey Business Super Investment Menu
MLC InflationPlus portfolios

MLC Inflation Plus - Assertive PortfolioAims to deliver a return of 4% pa above inflation (after fees and tax) subject to limiting the risk ofnegative returns over 7 year periods.
Investment objective
This careful risk management approach means there may be times, such as when interest rates areunusually low, when the portfolio requires an extended time period to achieve its return objective.In most circumstances the portfolio is expected to provide positive returns over 7 year periods,although there will sometimes be negative returns over shorter periods.
The measure of inflation is the Consumer Price Index, calculated by the Australian Bureau of Statistics.Benchmark
The key aspects of the way the portfolio is managed are:How the investment option ismanaged
1 Flexible asset allocation – the asset allocation is actively managed in accordance with our investmentexperts' changing view of potential opportunities and risks in investment markets.
2 Diversification – the portfolio invests across a wide range of assets and strategies. These mayinclude both mainstream (eg shares and government bonds) and alternative investments (eg hedgefunds) that may not be widely used in other investment funds. Specialist investment managersfrom around the world are carefully selected to manage the assets and strategies.
3 Strong focus on risk management – the portfolio has the flexibility not to invest in an asset classif that would cause too much risk of a negative return over 7 years. This means the portfolio mayhave low exposure to growth assets in some market conditions. However, the portfolio’s 7 yearinvestment time frame means it will usually have a significant investment in growth assets.
By managing the portfolio in this way, movements in the portfolio’s value (both up and down) shouldbe less significant.
The portfolio uses all aspects of the approach to investing, outlined earlier. In addition, the portfoliouses a market-leading Investment Futures Framework to manage risk and identify opportunities.You can find more information on the Investment Futures Framework at mlcam.com.au/futuresframework
Techniques such as gearing, short selling and derivatives may be used to adjust the portfolio’sexposure to assets. These techniques and their risks are outlined in the 'Investment techniques'section.
The investment option may besuited to you if...
you’re aiming to achieve a return above inflation but, more importantly, are concerned about losingmoney over a 7 year periodyou understand the return achieved by the portfolio may be significantly higher or lower than itsobjectiveyou want our investment experts to flexibly adjust the portfolio's asset allocation in accordancewith their changing view of potential opportunities and risks in investment marketsyou want to manage investment risk by diversifying across asset classes and strategies, andyou understand the risks of investing in a geared portfolio and are comfortable with the flexiblemanagement of the gearing level up to 40% to adjust exposure to assets.
7 to 10 yearsMinimum suggested time toinvest
Asset allocation RangesAsset class0% - 100%Cash0% - 60%Australian fixed income0% - 60%Global fixed income0% - 50%Alternatives0% - 50%Property 0% - 70%Global shares0% - 70%Australian shares0% - 17%Private equity0% - 40%Gearing*0% - 120%Total fixed income and cash0% - 120%Total shares and property
100% - 140%Total assets**This means for every $1,000 you invest, the portfolio may borrow up to $400 (and up to $1,400 isinvested in assets). However, if asset values fall dramatically (such as in unusually adverse marketconditions), the portfolio’s gearing level may rise above 40%. More information on the risks of gearingis on page 11.This portfolio is considered a fund of hedge funds by the Australian Securities and InvestmentsCommission because it uses some sophisticated investment techniques. More information about thisportfolio is available at mlc.com.au/fundprofiletool
High (estimate of 4 to 6 negative annual returns in any 20 year period)Standard Risk Measure
MLC MasterKey Business Super Investment Menu | 25

MLC Horizon 1 Bond PortfolioAims to outperform the Benchmark, before fees and tax, over 2 year periods. The return is also expectedto be higher than cash investments.
Investment objective
At the same time, the portfolio aims to preserve your investment over 1 year periods.
The portfolio’s Benchmark is a combination of market indices. Details are available at mlc.com.au/horizon1super
Benchmark
Investment markets are the main driver of the portfolio’s investment returns. The portfolio’s allocationto investment markets is shown in its strategic asset allocation and ranges below. It's invested indefensive assets.
How the investment option ismanaged
Our investment experts actively look for opportunities to provide better returns, or less risk, thanthose generated by the strategic asset allocation. They do this by:
Adjusting the allocations to the asset classes away from the strategic asset allocation, while aimingto remain within the defined ranges shown below.Researching and selecting a broad range of fixed income sectors and strategies.Researching many investment managers from around the world and selecting the managers theybelieve are the best for the portfolio. These active investment managers choose many securitiesin Australia and overseas for investment.
The portfolio uses all aspects of the approach to investing, outlined earlier. In addition, the portfoliouses a market-leading Investment Futures Framework to manage risk and identify opportunities.You can find more information on the Investment Futures Framework at mlcam.com.au/futuresframework
The investment option may besuited to you if...
you want a portfolio of fixed income securities that is predominantly investment grade you are comfortable investing in a portfolio with a duration that’s normally up to 2 years, with lowsensitivity to changes in interest ratesyou want an actively managed portfolio that’s diversified across investment managers, types offixed income, countries, and securities, andpreservation of your investment is important but you understand there are risks of investing infixed income.
2 yearsMinimum suggested time toinvest
Asset class Ranges
Cash 30% 0-60%Australian fixed income 42% 20-70%Global fixed income 28% 15-50%
Defensive assets 100%
Strategic asset allocation
Foreign currency exposures from global fixed income will be substantially hedged to the Australiandollar.
Asset allocation
Low (estimate of less than 1 negative annual return in any 20 year period)Standard Risk Measure
26 | MLC MasterKey Business Super Investment Menu
MLC Horizonportfolios

MLC Horizon 2 Capital Stable PortfolioAims to outperform the Benchmark, before fees and tax, over 3 year periods.Investment objective
We aim to achieve this by actively managing the portfolio. This includes changing the portfolio’sasset allocation to capitalise on investment opportunities or reduce risk if market risk is high.
The portfolio’s Benchmark is a combination of market indices. Details are available at mlc.com.au/horizon2super
Benchmark
Investment markets are the main driver of the portfolio’s investment returns. The portfolio’s allocationto investment markets is shown in its strategic asset allocation and ranges below. The strategic assetallocation has a strong bias to defensive assets and some exposure to growth assets.
How the investment option ismanaged
Our investment experts actively look for opportunities to provide better returns, or less risk, thanthose generated by the strategic asset allocation. They do this by:
Adjusting the allocations to the asset classes away from the strategic asset allocation, while aimingto remain within the defined ranges shown below.Researching and selecting a broad range of mainstream asset classes, and including some exposureto alternative assets and strategies.Researching hundreds of investment managers from around the world and selecting the managersthey believe are the best for the portfolio. These investment managers, who are mainly activemanagers, choose many companies and securities in Australia and overseas for investment.
The portfolio uses all aspects of the approach to investing, outlined earlier. In addition, the portfoliouses a market-leading Investment Futures Framework to manage risk and identify opportunities.You can find more information on the Investment Futures Framework at mlcam.com.au/futuresframework
The investment option may besuited to you if...
you want a portfolio that invests mainly in defensive assetsyou want a portfolio that's diversified across asset classes, investment managers, and securities,and preserving your investment is an important but not overriding concern.
3 yearsMinimum suggested time toinvest
Asset class Ranges
Cash 10% 0-25%Fixed income 51% 30-80%Alternatives and other 13% 0-30%Property 1% 0-15%Global shares 13% 0-25%Australian shares 10% 0-25%Private equity 2% 0-10%
Defensive assets 71% 60-80%Growth assets 29% 20-40%
Strategic asset allocation
Asset allocation
Most global assets are hedged to the Australian dollar. Currency hedging levels for global assets areavailable at mlc.com.au/fundprofiletool
MLC MasterKey Business Super Investment Menu | 27

MLC Horizon 2 Capital Stable Portfolio continuedWhile the portfolio isn’t managed to achieve a particular return above inflation, an average return of3.5% pa above inflation (before fees and tax) is consistent with historical long-term returns frominvestment markets, using an asset allocation similar to the portfolio's.
Long-term returns
The longer you invest, the greater the likelihood of achieving this return above inflation, as investmentmarkets frequently fluctuate over shorter periods of time. Your return will be driven by the manyunpredictable factors influencing investments and markets at the time. When investing, it's importantto be prepared for all sorts of return outcomes.
The graph below is based on more than 100 years of investment market returns. It shows how broadthe ranges of investment market returns have been. Returns measured over longer periods havenarrower ranges because investment market fluctuations tend to offset through time.
Ranges of returns for the portfolio's strategic asset allocation based on investment market returnsfrom 1900 to 2021 (before fees and tax)
109-44_MLCE9412 - MKBS Investment Menu_MKSPF Investment Menu - MLC Horizon 2 Capital Stable Portfolio LTR graph_1A
A135623-0821
90%
70%
50%
30%
10%
-10%
-30%
-50%1 year 3 years 5 years 10 years 15 years 20 years
Middle return in the range (median)Range of returns
% p
a
Source: Calculated by MLC Asset Management using the strategic asset allocation as at 30 June 2021 andinvestment market data from Global Financial Data, Inc. and FactSet.
These historical ranges of returns are for investment markets weighted according to the portfolio’sstrategic asset allocation. Historical returns aren’t a reliable indicator of the portfolio’s futureinvestment returns.
Medium (estimate of 2 to 3 negative annual returns in any 20 year period)Standard Risk Measure
28 | MLC MasterKey Business Super Investment Menu
MLC Horizonportfolios
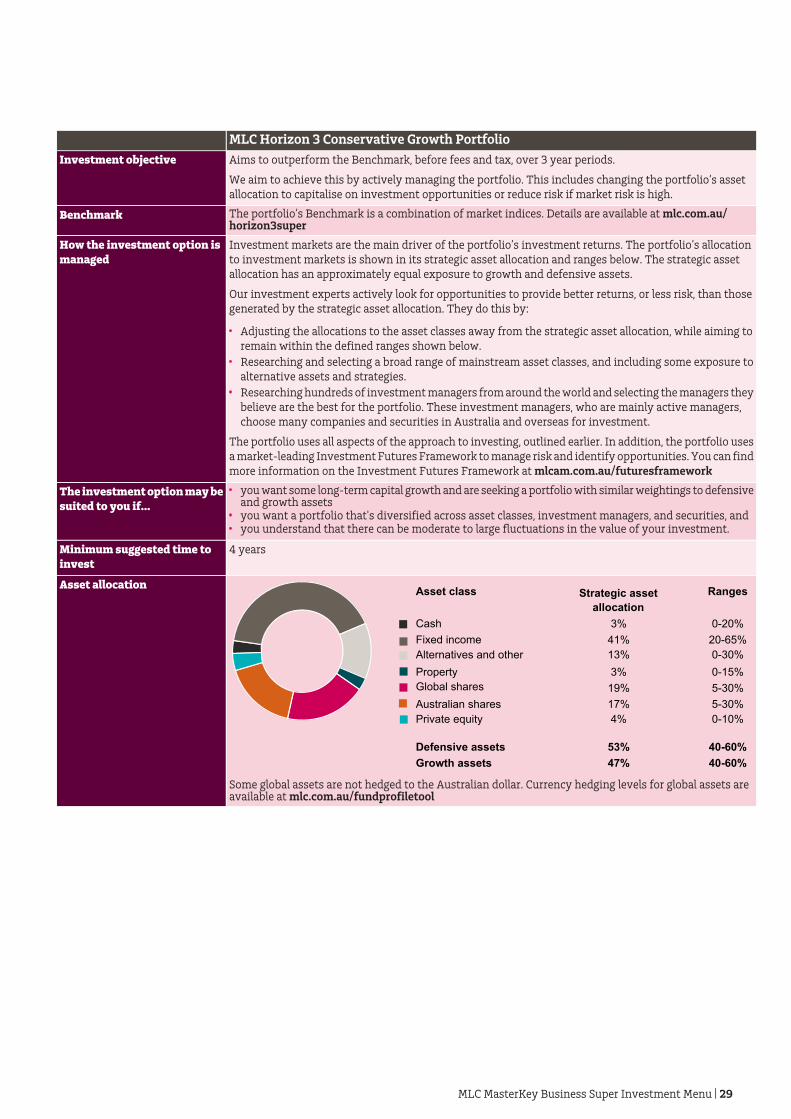
MLC Horizon 3 Conservative Growth PortfolioAims to outperform the Benchmark, before fees and tax, over 3 year periods.Investment objective
We aim to achieve this by actively managing the portfolio. This includes changing the portfolio’s assetallocation to capitalise on investment opportunities or reduce risk if market risk is high.
The portfolio’s Benchmark is a combination of market indices. Details are available at mlc.com.au/horizon3super
Benchmark
Investment markets are the main driver of the portfolio’s investment returns. The portfolio’s allocationto investment markets is shown in its strategic asset allocation and ranges below. The strategic assetallocation has an approximately equal exposure to growth and defensive assets.
How the investment option ismanaged
Our investment experts actively look for opportunities to provide better returns, or less risk, than thosegenerated by the strategic asset allocation. They do this by:
Adjusting the allocations to the asset classes away from the strategic asset allocation, while aiming toremain within the defined ranges shown below.Researching and selecting a broad range of mainstream asset classes, and including some exposure toalternative assets and strategies.Researching hundreds of investment managers from around the world and selecting the managers theybelieve are the best for the portfolio. These investment managers, who are mainly active managers,choose many companies and securities in Australia and overseas for investment.
The portfolio uses all aspects of the approach to investing, outlined earlier. In addition, the portfolio usesa market-leading Investment Futures Framework to manage risk and identify opportunities. You can findmore information on the Investment Futures Framework at mlcam.com.au/futuresframework
The investment option may besuited to you if...
you want some long-term capital growth and are seeking a portfolio with similar weightings to defensiveand growth assetsyou want a portfolio that's diversified across asset classes, investment managers, and securities, and you understand that there can be moderate to large fluctuations in the value of your investment.
4 yearsMinimum suggested time toinvest
Asset class Ranges
Cash 3% 0-20%Fixed income 41% 20-65%Alternatives and other 13% 0-30%Property 3% 0-15%Global shares 19% 5-30%Australian shares 17% 5-30%Private equity 4% 0-10%
Defensive assets 53% 40-60%Growth assets 47% 40-60%
Strategic asset allocation
Asset allocation
Some global assets are not hedged to the Australian dollar. Currency hedging levels for global assets areavailable at mlc.com.au/fundprofiletool
MLC MasterKey Business Super Investment Menu | 29

MLC Horizon 3 Conservative Growth Portfolio continuedWhile the portfolio isn’t managed to achieve a particular return above inflation, an average return of4.25% pa above inflation (before fees and tax) is consistent with historical long-term returns frominvestment markets, using an asset allocation similar to the portfolio's.
Long-term returns
The longer you invest, the greater the likelihood of achieving this return above inflation, as investmentmarkets frequently fluctuate over shorter periods of time. Your return will be driven by the manyunpredictable factors influencing investments and markets at the time. When investing, it's importantto be prepared for all sorts of return outcomes.
The graph below is based on more than 100 years of investment market returns. It shows how broadthe ranges of investment market returns have been. Returns measured over longer periods havenarrower ranges because investment market fluctuations tend to offset through time.
Ranges of returns for the portfolio's strategic asset allocation based on investment market returnsfrom 1900 to 2021 (before fees and tax)
109-45_MLCE9413 - MKBS Investment Menu_MKSPF Investment Menu - MLC Horizon 3 Conservative Growth Portfolio LTR graph_1A
M153802-0821
90%
70%
50%
30%
10%
-10%
-30%
-50%1 year 3 years 5 years 10 years 15 years 20 years
Middle return in the range (median)Range of returns
% p
a
Source: Calculated by MLC Asset Management using the strategic asset allocation as at 30 June 2021 andinvestment market data from Global Financial Data, Inc. and FactSet.
These historical ranges of returns are for investment markets weighted according to the portfolio’sstrategic asset allocation. Historical returns aren’t a reliable indicator of the portfolio’s futureinvestment returns.
Medium to high (estimate of 3 to 4 negative annual returns in any 20 year period)Standard Risk Measure
30 | MLC MasterKey Business Super Investment Menu
MLC Horizonportfolios

MLC Horizon 4 Balanced PortfolioAims to outperform the Benchmark, before fees and tax, over 4 year periods.Investment objective
We aim to achieve this by actively managing the portfolio. This includes changing the portfolio'sasset allocation to capitalise on investment opportunities or reduce risk if market risk is high.
The portfolio’s Benchmark is a combination of market indices. Details are available at mlc.com.au/horizon4super
Benchmark
Investment markets are the main driver of the portfolio’s investment returns. The portfolio’s allocationto investment markets is shown in its strategic asset allocation and ranges below. The strategic assetallocation has a strong bias to growth assets and some exposure to defensive assets.
How the investment option ismanaged
Our investment experts actively look for opportunities to provide better returns, or less risk, thanthose generated by the strategic asset allocation. They do this by:
Adjusting the allocations to the asset classes away from the strategic asset allocation, while aimingto remain within the defined ranges shown below.Researching and selecting a broad range of mainstream asset classes, and including some exposureto alternative assets and strategies.Researching hundreds of investment managers from around the world and selecting the managersthey believe are the best for the portfolio. These investment managers, who are mainly activemanagers, choose many companies and securities in Australia and overseas for investment.
The portfolio uses all aspects of the approach to investing, outlined earlier. In addition, the portfoliouses a market-leading Investment Futures Framework to manage risk and identify opportunities.You can find more information on the Investment Futures Framework at mlcam.com.au/futuresframework
The investment option may besuited to you if...
you want long-term capital growth and are seeking a portfolio that has a strong bias to growthassets you want a portfolio that's diversified across asset classes, investment managers, and securities,andyou understand that there can be large fluctuations in the value of your investment.
5 yearsMinimum suggested time toinvest
Asset class Ranges
Cash 1% 0-15%Fixed income 25% 5-40%Alternatives and other 13% 0-35%Property 4% 0-15%Global shares 27% 10-40%Australian shares 24% 20-40%Private equity 6% 0-15%
Defensive assets 33% 20-40%Growth assets 67% 60-80%
Strategic asset allocation
Asset allocation
Some global assets are not hedged to the Australian dollar. Currency hedging levels for global assetsare available at mlc.com.au/fundprofiletool
MLC MasterKey Business Super Investment Menu | 31

MLC Horizon 4 Balanced Portfolio continuedWhile the portfolio isn't managed to achieve a particular return above inflation, an average return of4.75% pa above inflation (before fees and tax) is consistent with historical long-term returns frominvestment markets, using an asset allocation similar to the portfolio's.
Long-term returns
The longer you invest, the greater the likelihood of achieving this return above inflation, as investmentmarkets frequently fluctuate over shorter periods of time. Your return will be driven by the manyunpredictable factors influencing investments and markets at the time. When investing, it's importantto be prepared for all sorts of return outcomes.
The graph below is based on more than 100 years of investment market returns. It shows how broadthe ranges of investment market returns have been. Returns measured over longer periods havenarrower ranges because investment market fluctuations tend to offset through time.
Ranges of returns for the portfolio's strategic asset allocation based on investment market returnsfrom 1900 to 2021 (before fees and tax)
109-46_MLCE9414 - All Investment Menus - MLC Horizon 4 Balanced Portfolio LTR graph_1A
A147985-0821
90%
70%
50%
30%
10%
-10%
-30%
-50%1 year 3 years 5 years 10 years 15 years 20 years
Middle return in the range (median)Range of returns
% p
a
Source: Calculated by MLC Asset Management using the strategic asset allocation as at 30 June 2021 andinvestment market data from Global Financial Data, Inc. and FactSet.
These historical ranges of returns are for investment markets weighted according to the portfolio’sstrategic asset allocation. Historical returns aren’t a reliable indicator of the portfolio’s futureinvestment returns.
High (estimate of 4 to 6 negative annual returns in any 20 year period)Standard Risk Measure
32 | MLC MasterKey Business Super Investment Menu
MLC Horizonportfolios
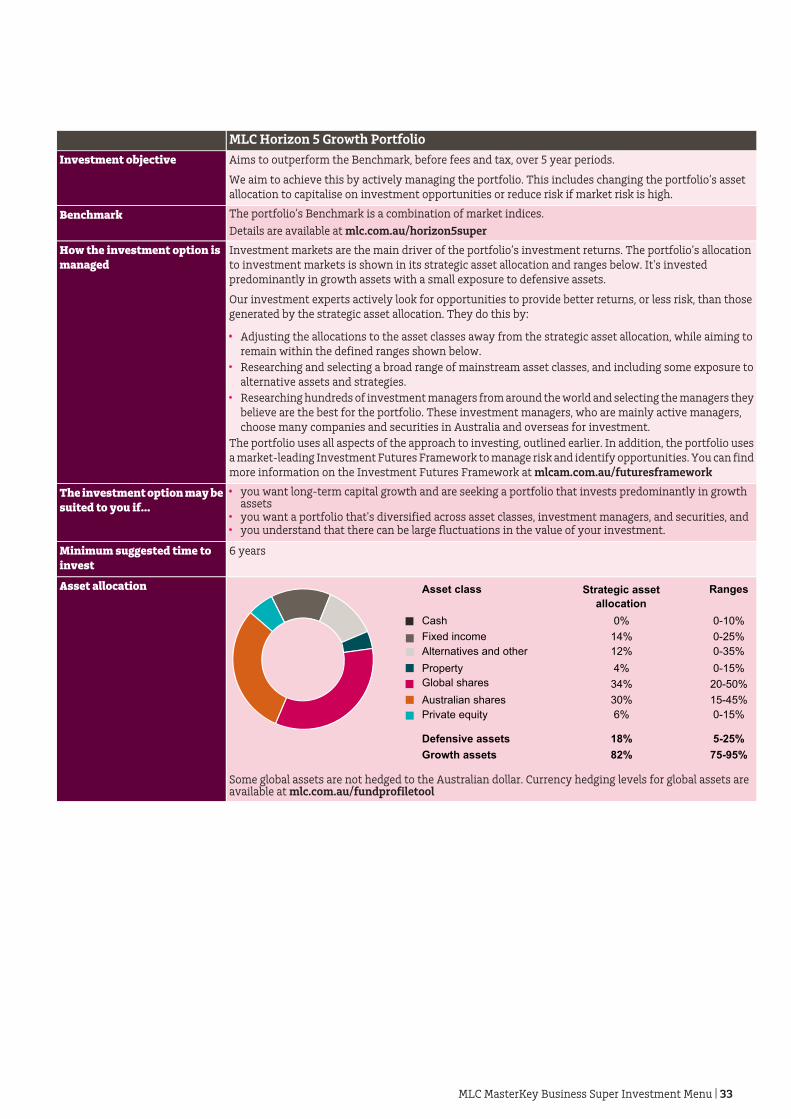
MLC Horizon 5 Growth PortfolioAims to outperform the Benchmark, before fees and tax, over 5 year periods.Investment objective
We aim to achieve this by actively managing the portfolio. This includes changing the portfolio’s assetallocation to capitalise on investment opportunities or reduce risk if market risk is high.
The portfolio’s Benchmark is a combination of market indices. BenchmarkDetails are available at mlc.com.au/horizon5super
Investment markets are the main driver of the portfolio’s investment returns. The portfolio’s allocationto investment markets is shown in its strategic asset allocation and ranges below. It's investedpredominantly in growth assets with a small exposure to defensive assets.
How the investment option ismanaged
Our investment experts actively look for opportunities to provide better returns, or less risk, than thosegenerated by the strategic asset allocation. They do this by:
Adjusting the allocations to the asset classes away from the strategic asset allocation, while aiming toremain within the defined ranges shown below.Researching and selecting a broad range of mainstream asset classes, and including some exposure toalternative assets and strategies.Researching hundreds of investment managers from around the world and selecting the managers theybelieve are the best for the portfolio. These investment managers, who are mainly active managers,choose many companies and securities in Australia and overseas for investment.
The portfolio uses all aspects of the approach to investing, outlined earlier. In addition, the portfolio usesa market-leading Investment Futures Framework to manage risk and identify opportunities. You can findmore information on the Investment Futures Framework at mlcam.com.au/futuresframework
The investment option may besuited to you if...
you want long-term capital growth and are seeking a portfolio that invests predominantly in growthassets you want a portfolio that's diversified across asset classes, investment managers, and securities, andyou understand that there can be large fluctuations in the value of your investment.
6 yearsMinimum suggested time toinvest
Asset class Ranges
Cash 0% 0-10%Fixed income 14% 0-25%Alternatives and other 12% 0-35%Property 4% 0-15%Global shares 34% 20-50%Australian shares 30% 15-45%Private equity 6% 0-15%
Defensive assets 18% 5-25%Growth assets 82% 75-95%
Strategic asset allocation
Asset allocation
Some global assets are not hedged to the Australian dollar. Currency hedging levels for global assets areavailable at mlc.com.au/fundprofiletool
MLC MasterKey Business Super Investment Menu | 33

MLC Horizon 5 Growth Portfolio continuedWhile the portfolio isn’t managed to achieve a particular return above inflation, an average return of5.25% pa above inflation (before fees and tax) is consistent with historical long-term returns frominvestment markets, using an asset allocation similar to the portfolio's.
Long-term returns
The longer you invest, the greater the likelihood of achieving this return above inflation, as investmentmarkets frequently fluctuate over shorter periods of time. Your return will be driven by the manyunpredictable factors influencing investments and markets at the time. When investing, it's importantto be prepared for all sorts of return outcomes.
The graph below is based on more than 100 years of investment market returns. It shows how broadthe ranges of investment market returns have been. Returns measured over longer periods havenarrower ranges because investment market fluctuations tend to offset through time.
Ranges of returns for the portfolio's strategic asset allocation based on investment market returnsfrom 1900 to 2021 (before fees and tax)
109-47_MLCE9415 - All Investment Menus - MLC Horizon 5 Growth Portfolio LTR graph_1A
A145146-0821
90%
70%
50%
30%
10%
-10%
-30%
-50%1 year 3 years 5 years 10 years 15 years 20 years
Middle return in the range (median)Range of returns
% p
a
Source: Calculated by MLC Asset Management using the strategic asset allocation as at 30 June 2021 andinvestment market data from Global Financial Data, Inc. and FactSet.
These historical ranges of returns are for investment markets weighted according to the portfolio’sstrategic asset allocation. Historical returns aren’t a reliable indicator of the portfolio’s futureinvestment returns.
High (estimate of 4 to 6 negative annual returns in any 20 year period)Standard Risk Measure
34 | MLC MasterKey Business Super Investment Menu
MLC Horizonportfolios

MLC Horizon 6 Share PortfolioAims to outperform the Benchmark, before fees and tax, over 5 year periods.Investment objective
We aim to achieve this return while keeping volatility (movements up and down in value) at levelssimilar to the Benchmark.
The portfolio’s Benchmark is a combination of market indices. Details are available at mlc.com.au/horizon6super
Benchmark
Investment markets are the main driver of the portfolio’s investment returns. The portfolio’s allocationto investment markets is shown in its strategic asset allocation and ranges below. It's invested ingrowth assets with minimal exposure to defensive assets.
How the investment option ismanaged
Our investment experts actively look for opportunities to provide better returns, or less risk, thanthose generated by the strategic asset allocation. They do this by:
Adjusting the allocations to the asset classes away from the strategic asset allocation, while aimingto remain within the defined ranges shown below.Researching and selecting a broad range of mainstream asset classes, and including some exposureto alternative assets and strategies.Researching hundreds of investment managers from around the world and selecting the managersthey believe are the best for the portfolio. These investment managers, who are mainly activemanagers, choose many companies and securities in Australia and overseas for investment.
The portfolio uses all aspects of the approach to investing, outlined earlier. In addition, the portfoliouses a market-leading Investment Futures Framework to manage risk and identify opportunities.You can find more information on the Investment Futures Framework at mlcam.com.au/futuresframework
The investment option may besuited to you if...
you want long-term capital growth and are seeking a portfolio that invests in growth assets (primarilyshares)you want a portfolio that's diversified across growth assets, investment managers, and securities,andyou understand that there can be very large fluctuations in the value of your investment.
6 yearsMinimum suggested time toinvest
Asset class Ranges
Cash 0% 0-5%Alternatives and other 12% 0-30%Property 2% 0-15%Global shares 40% 30-60%Australian shares 39% 30-55%Private equity 7% 0-15%
Defensive assets 4% 0-10%Growth assets 96% 90-100%
Strategic asset allocation
Asset allocation
Some global assets are not hedged to the Australian dollar. Currency hedging levels for global assetsare available at mlc.com.au/fundprofiletool
MLC MasterKey Business Super Investment Menu | 35

MLC Horizon 6 Share Portfolio continuedWhile the portfolio isn't managed to achieve a particular return above inflation, an average return of5.5% pa above inflation (before fees and tax) is consistent with historical long-term returns frominvestment markets, using an asset allocation similar to the portfolio's.
Long-term returns
The longer you invest, the greater the likelihood of achieving this return above inflation, as investmentmarkets frequently fluctuate over shorter periods of time. Your return will be driven by the manyunpredictable factors influencing investments and markets at the time. When investing, it's importantto be prepared for all sorts of return outcomes.
The graph below is based on more than 100 years of investment market returns. It shows how broadthe ranges of investment market returns have been. Returns measured over longer periods havenarrower ranges because investment market fluctuations tend to offset through time.
Ranges of returns for the portfolio's strategic asset allocation based on investment market returnsfrom 1900 to 2021 (before fees and tax)
109-48_MLCE9416 - MKBS Investment Menu_MKSPF Investment Menu - MLC Horizon 6 Share Portfolio LTR graph_1A
A147986-0821
90%
70%
50%
30%
10%
-10%
-30%
-50%1 year 3 years 5 years 10 years 15 years 20 years
Middle return in the range (median)Range of returns
% p
a
Source: Calculated by MLC Asset Management using the strategic asset allocation as at 30 June 2021 andinvestment market data from Global Financial Data, Inc. and FactSet.
These historical ranges of returns are for investment markets weighted according to the portfolio’sstrategic asset allocation. Historical returns aren’t a reliable indicator of the portfolio’s futureinvestment returns.
High (estimate of 4 to 6 negative annual returns in any 20 year period)Standard Risk Measure
36 | MLC MasterKey Business Super Investment Menu
MLC Horizonportfolios

MLC Horizon 7 Accelerated Growth PortfolioAims to outperform the Benchmark, before fees and tax, over 5 year periods.Investment objective
We aim to achieve this return while keeping volatility (movements up and down in value) at levelssimilar to the Benchmark.
The portfolio’s Benchmark is a combination of market indices. Details are available at mlc.com.au/horizon7super
Benchmark
Investment markets are the main driver of the portfolio’s investment returns. The portfolio’s allocationto investment markets and gearing level are shown in its strategic asset allocation and ranges below.It's invested in growth assets with minimal exposure to defensive assets.
How the investment option ismanaged
Our investment experts actively look for opportunities to provide better returns, or less risk, thanthose generated by the strategic asset allocation. They do this by:
Adjusting the allocations to the asset classes away from the strategic asset allocation, while aimingto remain within the defined ranges shown below.Researching and selecting a broad range of mainstream asset classes, and including some exposureto alternative assets and strategies.Researching hundreds of investment managers from around the world and selecting the managersthey believe are the best for the portfolio. These investment managers, who are mainly activemanagers, choose many companies and securities in Australia and overseas for investment.
The portfolio uses all aspects of the approach to investing, outlined earlier. In addition, the portfoliouses a market-leading Investment Futures Framework to manage risk and identify opportunities.You can find more information on the Investment Futures Framework at mlcam.com.au/futuresframework
The portfolio has a target gearing level of 30%. This means for every $1,000 you have invested, theportfolio targets borrowings of $300. The actual gearing level changes every day as a result of marketmovements. That’s why the portfolio’s actual gearing level is monitored against its target and theborrowings are regularly moved back to the target level. To maintain the target gearing level, theborrowings may need to be adjusted as well as assets bought and sold. This increased trading willincur transaction costs and realise taxable gains and losses. The actual gearing level may movesignificantly away from the target, without prior notice to you, for reasons including:
significant market volatilitylegislative changesaccessing borrowings, including any lender imposed requirement to repay borrowings, andchanges to gearing costs.
Recent gearing levels are available at mlc.com.au/fundprofiletool
The investment option may besuited to you if...
you want to gear a portfolio that's diversified across growth assets (primarily shares), investmentmanagers, and securities you want to gear a portfolio but don't want the burden of obtaining and managing your own loan you want long-term capital growthyou expect growth in the assets’ value to exceed the costs of gearing, andyou’re comfortable with the risks of gearing including extra volatility and increased risk of capitalloss.
8 yearsMinimum suggested time toinvest
Asset class Ranges
Alternatives and other 7% 0-25%Property 0% 0-15%Global shares 65% 50-85%Australian shares 50% 35-70%Private equity 8% 0-15%
Defensive assets 3% 0-10%Growth assets 127% 120-135%Gearing* (30%)
Strategic asset allocation
*If asset values fall dramatically (such as in unusually adverse market conditions), the portfolio's gearing level may rise above 30%.
Asset allocation
Some global assets are not hedged to the Australian dollar. Currency hedging levels for global assetsare available at mlc.com.au/fundprofiletool
MLC MasterKey Business Super Investment Menu | 37

MLC Horizon 7 Accelerated Growth Portfolio continuedWhile the portfolio isn't managed to achieve a particular return above inflation, an average return of6.25% pa above inflation (before fees and tax) is consistent with historical long-term returns frominvestment markets, using an asset allocation similar to the portfolio's.
Long-term returns
The longer you invest, the greater the likelihood of achieving this return above inflation, as investmentmarkets frequently fluctuate over shorter periods of time. Your return will be driven by the manyunpredictable factors influencing investments and markets at the time. When investing, it's importantto be prepared for all sorts of return outcomes.
The graph below is based on more than 100 years of investment market returns. It shows how broadthe ranges of investment market returns have been. Returns measured over longer periods havenarrower ranges because investment market fluctuations tend to offset through time.
Ranges of returns for the portfolio's strategic asset allocation based on investment market returnsfrom 1900 to 2021 (before fees and tax)
109-54_MLCE9418 - MKISF Investment Menu_MKUT PDS - MLC Wholesale Horizon 7 LTR graph_1A
A135628-0821
90%
70%
50%
30%
10%
-10%
-30%
-50%1 year 3 years 5 years 10 years 15 years 20 years
Middle return in the range (median)Range of returns
% p
a
Source: Calculated by MLC Asset Management using the strategic asset allocation as at 30 June 2021 andinvestment market data from Global Financial Data, Inc. and FactSet.
These historical ranges of returns are for investment markets weighted according to the portfolio’sstrategic asset allocation. Historical returns aren’t a reliable indicator of the portfolio’s futureinvestment returns.
High (estimate of 4 to 6 negative annual returns in any 20 year period)Standard Risk Measure
38 | MLC MasterKey Business Super Investment Menu
MLC Horizonportfolios

MLC Index Plus Conservative Growth PortfolioAims to provide a return that meets the Benchmark, before fees and tax, over 3 year periods.Investment objective
At the same time, we aim to manage risks and returns in the portfolio by changing its asset allocation.
The portfolio’s Benchmark is a combination of market indices. Details are available at mlc.com.au/indexplusconsgrowth
Benchmark
Investment markets are the main driver of the portfolio’s investment returns. The portfolio’s returnsare benchmarked against a combination of investment market indices. To meet the benchmark returnwhile reducing the portfolio’s exposure to market risks, our investment experts:
How the investment option ismanaged
Actively manage the portfolio's exposure to return opportunities and risk by adjusting the allocationsto the asset classes away from the strategic asset allocation, while aiming to remain within thedefined ranges shown below.Research and select mostly mainstream asset classes, with some exposure to alternative assetsand strategies.Research investment managers from around the world and select the managers they believe arethe best for the portfolio. Specialist index and index enhanced managers may be used in certainasset classes, and active managers selectively used where our investment experts believe it makesthe greatest difference to the portfolio's risks or returns. These investment managers choose manycompanies and securities in Australia and overseas for investment.
The strategic asset allocation has an approximately equal exposure to growth and defensive assets.
The portfolio uses all aspects of the approach to investing, outlined earlier. In addition, the portfoliouses a market-leading Investment Futures Framework to manage risk and identify opportunities.You can find more information on the Investment Futures Framework at mlcam.com.au/futuresframework
The investment option may besuited to you if...
you want some long-term capital growth and are seeking a diversified portfolio that has similarweightings to defensive and growth assets you want to keep costs down by using mostly lower cost investment managers, and you understand that there can be moderate to large fluctuations in the value of your investment.
4 yearsMinimum suggested time toinvest
Asset class Ranges
Cash 7% 0-20%Fixed income 41% 15-60%Alternatives and other 6% 0-20%Property 3% 0-15%Global shares 25% 10-35%Australian shares 18% 5-35%
Defensive assets 51% 40-60%Growth assets 49% 40-60%
Strategic asset allocation
Asset allocation
Some global assets are not hedged to the Australian dollar. Currency hedging levels for global assetsare available at mlc.com.au/fundprofiletool
MLC MasterKey Business Super Investment Menu | 39
MLC IndexPlus portfolios

MLC Index Plus Conservative Growth Portfolio continuedWhile the portfolio isn’t managed to achieve a particular return above inflation, an average return of4% pa above inflation (before fees and tax) is consistent with historical long-term returns frominvestment markets, using an asset allocation similar to the portfolio's.
Long-term returns
The longer you invest, the greater the likelihood of achieving this return above inflation, as investmentmarkets frequently fluctuate over shorter periods of time. Your return will be driven by the manyunpredictable factors influencing investments and markets at the time. When investing, it's importantto be prepared for all sorts of return outcomes.
The graph below is based on more than 100 years of investment market returns. It shows how broadthe ranges of investment market returns have been. Returns measured over longer periods havenarrower ranges because investment market fluctuations tend to offset through time.
Ranges of returns for the portfolio's strategic asset allocation based on investment market returnsfrom 1900 to 2021 (before fees and tax)
109-55_MLCE9419 - MKBS Investment Menu_MKSPF Investment Menu - MLC Index Plus Conservative Growth Portfolio LTR graph_1A
A135670-0821
90%
70%
50%
30%
10%
-10%
-30%
-50%1 year 3 years 5 years 10 years 15 years 20 years
Middle return in the range (median)Range of returns
% p
a
Source: Calculated by MLC Asset Management using the strategic asset allocation as at 30 June 2021 andinvestment market data from Global Financial Data, Inc. and FactSet.
These historical ranges of returns are for investment markets weighted according to the portfolio’sstrategic asset allocation. Historical returns aren’t a reliable indicator of the portfolio’s futureinvestment returns.
Medium to high (estimate of 3 to 4 negative annual returns in any 20 year period)Standard Risk Measure
40 | MLC MasterKey Business Super Investment Menu
MLC IndexPlus portfolios

MLC Index Plus Balanced PortfolioAims to provide a return that meets the Benchmark, before fees and tax, over 4 year periods.Investment objective
At the same time, we aim to manage risks and returns in the portfolio by changing its asset allocation.
The portfolio’s Benchmark is a combination of market indices. Details are available at mlc.com.au/indexplusbalanced
Benchmark
Investment markets are the main driver of the portfolio’s investment returns. The portfolio’s returnsare benchmarked against a combination of investment market indices. To meet the benchmark returnwhile reducing the portfolio’s exposure to market risks, our investment experts:
How the investment option ismanaged
Actively manage the portfolio's exposure to return opportunities and risk by adjusting the allocationsto the asset classes away from the strategic asset allocation, while aiming to remain within thedefined ranges shown below.Research and select mostly mainstream asset classes, with some exposure to alternative assetsand strategies.Research investment managers from around the world and select the managers they believe arethe best for the portfolio. Specialist index and index enhanced managers may be used in certainasset classes, and active managers selectively used where our investment experts believe it makesthe greatest difference to the portfolio's risks or returns. These investment managers choose manycompanies and securities in Australia and overseas for investment.
The strategic asset allocation has a strong bias to growth assets and some exposure to defensiveassets.
The portfolio uses all aspects of the approach to investing, outlined earlier. In addition, the portfoliouses a market-leading Investment Futures Framework to manage risk and identify opportunities.You can find more information on the Investment Futures Framework at mlcam.com.au/futuresframework
The investment option may besuited to you if...
you want long-term capital growth and are seeking a diversified portfolio that has a strong bias togrowth assetsyou want to keep costs down by using mostly lower cost investment managers, andyou understand that there can be large fluctuations in the value of your investment.
5 yearsMinimum suggested time toinvest
Asset class Ranges
Cash 3% 0-20%Fixed income 25% 10-40%Alternatives and other 6% 0-20%Property 4% 0-15%Global shares 34% 20-45%Australian shares 28% 15-45%
Defensive assets 31% 20-40%Growth assets 69% 60-80%
Strategic asset allocation
Asset allocation
Some global assets are not hedged to the Australian dollar. Currency hedging levels for global assetsare available at mlc.com.au/fundprofiletool
MLC MasterKey Business Super Investment Menu | 41

MLC Index Plus Balanced Portfolio continuedWhile the portfolio isn’t managed to achieve a particular return above inflation, an average return of4.25% pa above inflation (before fees and tax) is consistent with historical long-term returns frominvestment markets, using an asset allocation similar to the portfolio's.
Long-term returns
The longer you invest, the greater the likelihood of achieving this return above inflation, as investmentmarkets frequently fluctuate over shorter periods of time. Your return will be driven by the manyunpredictable factors influencing investments and markets at the time. When investing, it's importantto be prepared for all sorts of return outcomes.
The graph below is based on more than 100 years of investment market returns. It shows how broadthe ranges of investment market returns have been. Returns measured over longer periods havenarrower ranges because investment market fluctuations tend to offset through time.
Ranges of returns for the portfolio's strategic asset allocation based on investment market returnsfrom 1900 to 2021 (before fees and tax)
109-56_MLCE9420 - MKBS Investment Menu_MKSPF Investment Menu - MLC Index Plus Balanced Portfolio LTR graph_1A
A135672-0821
90%
70%
50%
30%
10%
-10%
-30%
-50%1 year 3 years 5 years 10 years 15 years 20 years
Middle return in the range (median)Range of returns
% p
a
Source: Calculated by MLC Asset Management using the strategic asset allocation as at 30 June 2021 andinvestment market data from Global Financial Data, Inc. and FactSet.
These historical ranges of returns are for investment markets weighted according to the portfolio’sstrategic asset allocation. Historical returns aren’t a reliable indicator of the portfolio’s futureinvestment returns.
High (estimate of 4 to 6 negative annual returns in any 20 year period)Standard Risk Measure
42 | MLC MasterKey Business Super Investment Menu
MLC IndexPlus portfolios

MLC Index Plus Growth Portfolio
Aims to provide a return that meets the Benchmark, before fees and tax, over 5 year periods.Investment objective
At the same time, we aim to manage risks and returns in the portfolio by changing its asset allocation.
The portfolio’s Benchmark is a combination of market indices. Details are available at mlc.com.au/indexplusgrowth
Benchmark
Investment markets are the main driver of the portfolio’s investment returns. The portfolio’s returns arebenchmarked against a combination of investment market indices. To meet the benchmark return whilereducing the portfolio’s exposure to market risks, our investment experts:
How the investment option ismanaged
Actively manage the portfolio's exposure to return opportunities and risk by adjusting the allocationsto the asset classes away from the strategic asset allocation, while aiming to remain within the definedranges shown below.Research and select mostly mainstream asset classes, with some exposure to alternative assets andstrategies.Research investment managers from around the world and select the managers they believe are thebest for the portfolio. Specialist index and index enhanced managers may be used in certain asset classes,and active managers selectively used where our investment experts believe it makes the greatestdifference to the portfolio's risks or returns. These investment managers choose many companies andsecurities in Australia and overseas for investment.
The portfolio's invested predominantly in growth assets with a small exposure to defensive assets.
The portfolio uses all aspects of the approach to investing, outlined earlier. In addition, the portfolio usesa market-leading Investment Futures Framework to manage risk and identify opportunities. You can findmore information on the Investment Futures Framework at mlcam.com.au/futuresframework
The investment option maybe suited to you if...
you want long-term capital growth and are seeking a diversified portfolio that invests predominantlyin growth assetsyou want to keep costs down by using mostly lower cost investment managers, andyou understand that there can be large fluctuations in the value of your investment.
6 yearsMinimum suggested time toinvest
Asset class Ranges
Cash 1% 0-15%Fixed income 12% 0-25%Alternatives and other 6% 0-20%Property 4% 0-15%Global shares 44% 20-55%Australian shares 33% 20-50%
Defensive assets 16% 5-25%Growth assets 84% 75-95%
Strategic asset allocation
Asset allocation
Some global assets are not hedged to the Australian dollar. Currency hedging levels for global assets areavailable at mlc.com.au/fundprofiletool
MLC MasterKey Business Super Investment Menu | 43

MLC Index Plus Growth Portfolio continuedWhile the portfolio isn’t managed to achieve a particular return above inflation, an average return of4.5% pa above inflation (before fees and tax) is consistent with historical long-term returns frominvestment markets, using an asset allocation similar to the portfolio's.
Long-term returns
The longer you invest, the greater the likelihood of achieving this return above inflation, as investmentmarkets frequently fluctuate over shorter periods of time. Your return will be driven by the manyunpredictable factors influencing investments and markets at the time. When investing, it's importantto be prepared for all sorts of return outcomes.
The graph below is based on more than 100 years of investment market returns. It shows how broadthe ranges of investment market returns have been. Returns measured over longer periods havenarrower ranges because investment market fluctuations tend to offset through time.
Ranges of returns for the portfolio's strategic asset allocation based on investment market returnsfrom 1900 to 2021 (before fees and tax)
109-57_MLCE9421 - MKBS Investment Menu_MKSPF Investment Menu - MLC Index Plus Growth Portfolio LTR graph_1A
A135673-0821
90%
70%
50%
30%
10%
-10%
-30%
-50%1 year 3 years 5 years 10 years 15 years 20 years
Middle return in the range (median)Range of returns
% p
a
Source: Calculated by MLC Asset Management using the strategic asset allocation as at 30 June 2021 andinvestment market data from Global Financial Data, Inc. and FactSet.
These historical ranges of returns are for investment markets weighted according to the portfolio’sstrategic asset allocation. Historical returns aren’t a reliable indicator of the portfolio’s futureinvestment returns.
High (estimate of 4 to 6 negative annual returns in any 20 year period)Standard Risk Measure
44 | MLC MasterKey Business Super Investment Menu
MLC IndexPlus portfolios

Fixed income
MLC Diversified Debt FundAims to outperform the Benchmark, before fees and tax, over 3 year periods.Investment objective
50% Bloomberg AusBond Composite 0+ Yr IndexBenchmark50% Bloomberg Barclays Global Aggregate Total Return Index (hedged into Australian dollars)
The fund is diversified across different types of fixed income securities in Australia and around theworld. The securities are predominantly investment grade and typically longer dated. Duration, ameasure of the fund's sensitivity to changes in interest rates, is normally in the range of 3 to 7 years.
How the investment option ismanaged
Foreign currency exposures will be substantially hedged to the Australian dollar.
As a result of capital restructures of bond issuers, the fund may have an incidental exposure to sharesfrom time to time.
you want to invest in a defensive portfolio that’s actively managed and diversified across investmentmanagers, types of fixed income, countries and securities.
The investment option may besuited to you if...
3 to 5 yearsMinimum suggested time toinvest
Asset allocation Strategic asset allocationAsset class50%Australian fixed income50%Global fixed income
Medium (estimate of 2 to 3 negative annual returns in any 20 year period)Standard Risk Measure
MLC MasterKey Business Super Investment Menu | 45
MLC assetclass funds

Property securities
MLC Property Securities FundAims to outperform the Benchmark, before fees and tax, over 5 year periods.Investment objective
S&P/ASX 300 A-REIT Total Return IndexBenchmark
The fund invests primarily in Australian property securities, including listed Real Estate InvestmentTrusts and companies, across most major listed property sectors. A mix of active, index, and otherinvestment manager approaches may be used to achieve the fund's objective.
How the investment option ismanaged
The fund doesn't invest in direct property, but may have some exposure to property securities listedoutside Australia from time to time.
Foreign currency exposures will be substantially hedged to the Australian dollar.
The investment option may besuited to you if...
you want to invest in an actively managed listed property securities portfolio you want diversification across listed property sectors and securities in Australia, and some globalexposure you want long-term growth in the value of your investment, andyou understand that there can be fluctuations in the value of your investment.
7 yearsMinimum suggested time toinvest
Asset allocation RangesAsset class85–100%Australian listed property securities
0–15% Global listed property securities
Very high (estimate of 6 or more negative annual returns in any 20 year period)Standard Risk Measure
MLC Global Property FundAims to outperform the Benchmark, before fees and tax, over 5 year periods.Investment objective
FTSE EPRA Nareit Developed Index (net dividends reinvested, hedged into Australian dollars)Benchmark
The fund invests primarily in listed property securities around the world, including listed Real EstateInvestment Trusts and companies across most major listed property sectors. It doesn’t invest indirect property.
How the investment option ismanaged
Foreign currency exposures will be substantially hedged to the Australian dollar.
The investment option may besuited to you if...
you want to invest in an actively managed global listed property securities portfolio that’s diversifiedacross investment managers, countries, listed property sectors and securitiesyou want long-term growth in the value of your investmentyou understand that there can be fluctuations in the value of your investment, andyou want foreign currency exposures to be mostly hedged to the Australian dollar.
7 yearsMinimum suggested time toinvest
Asset allocation Strategic asset allocationAsset class100% Global listed property securities
Very high (estimate of 6 or more negative annual returns in any 20 year period)Standard Risk Measure
46 | MLC MasterKey Business Super Investment Menu
MLC assetclass funds

Australian shares
MLC Australian Share FundAims to outperform the Benchmark, before fees and tax, over 5 year periods.Investment objective
S&P/ASX 200 Total Return IndexBenchmark
The fund invests primarily in companies listed (or expected to be listed) on the Australian SecuritiesExchange (and other regulated exchanges), and is typically diversified across major listed industrygroups. It may have a small exposure to companies listed outside of Australia from time to time.
How the investment option ismanaged
The investment option may besuited to you if...
you want to invest in an actively managed Australian share portfolio that’s diversified acrossinvestment managers, industries and companiesyou want long-term growth in the value of your investment, andyou understand that there can be very large fluctuations in the value of your investment.
7 yearsMinimum suggested time toinvest
Asset allocation Strategic asset allocationAsset class100%Australian shares
Very high (estimate of 6 or more negative annual returns in any 20 year period)Standard Risk Measure
MLC Australian Share Index Fund1
Aims to match the return of the Benchmark, before taking into account fees and tax.Investment objective
S&P/ASX 200 Total Return Index Benchmark
The fund will hold most of the securities in the Benchmark, allowing for individual security weightingsto vary marginally from the Benchmark.
How the investment option ismanaged
The fund is typically diversified across major listed industry groups.
The fund may invest in securities that have been, or are expected to be, included in the Benchmark.
The investment option may besuited to you if...
you want to invest in a portfolio of Australian shares that produces similar returns to the marketyou want long-term growth in the value of your investment, andyou understand that there can be very large fluctuations in the value of your investment.
7 yearsMinimum suggested time toinvest
Asset allocation Strategic asset allocationAsset class100%Australian shares
Very high (estimate of 6 or more negative annual returns in any 20 year period)Standard Risk Measure1formerly known as MLC-Vanguard Australian Share Index Fund
MLC MasterKey Business Super Investment Menu | 47

Australian shares
MLC IncomeBuilderAims to provide an income stream (excluding capital gains) that grows each year, by investing primarilyin Australian shares.
Investment objective
You can assess performance based on the annual growth in dividends received from the underlyingcompanies.
Benchmark
The fund invests primarily in listed Australian companies that have the potential to provide futuresustainable or growing dividends.
How the investment option ismanaged
The fund is expected to generate tax-efficient returns by:
investing in companies expected to have high franking levels, andcarefully managing the realisation of capital gains, where possible.
The fund is expected to provide returns consistent with investing in a broad range of Australiancompanies.
The fund invests in companies that are listed (or expected to be listed) on the Australian SecuritiesExchange (and other regulated exchanges). It may have a small exposure to companies listed outsideof Australia from time to time.
Income is reinvested in the fund.
you want to invest in shares in Australian companies that are expected to deliver a dividend streamover time that is sustainable or growing.
The investment option may besuited to you if...
7 yearsMinimum suggested time toinvest
Asset allocation Strategic asset allocationAsset class100%Australian shares
Very high (estimate of 6 or more negative annual returns in any 20 year period)Standard Risk Measure
48 | MLC MasterKey Business Super Investment Menu
MLC assetclass funds

Global shares
MLC Global Share FundAims to outperform the Benchmark, before fees and tax, over 5 year periods.Investment objective
MSCI All Country World Net Index ($A)Benchmark
The fund invests primarily in companies listed (or expected to be listed) on share markets anywherearound the world, and is typically diversified across major listed industry groups.
How the investment option ismanaged
Foreign currency exposures will generally not be hedged to the Australian dollar.
The investment option may besuited to you if...
you want to invest in an actively managed global share portfolio that’s diversified across investmentmanagers, countries (developed and emerging), industries and companiesyou want long-term growth in the value of your investmentyou understand that there can be very large fluctuations in the value of your investment, andyou’re comfortable having foreign currency exposure.
7 yearsMinimum suggested time toinvest
Asset allocation Strategic asset allocationAsset class100%Global shares
Very high (estimate of 6 or more negative annual returns in any 20 year period)Standard Risk Measure
MLC Hedged Global Share FundAims to outperform the Benchmark, before fees and tax, over 5 year periods.Investment objective
MSCI All Country World Net Index (hedged into Australian dollars)Benchmark
The fund invests primarily in companies listed (or expected to be listed) on share markets anywherearound the world, and is typically diversified across major listed industry groups.
How the investment option ismanaged
Foreign currency exposures will be substantially hedged to the Australian dollar.
The investment option may besuited to you if...
you want to invest in an actively managed global share portfolio that’s diversified across investmentmanagers, countries (developed and emerging), industries and companiesyou want long-term growth in the value of your investmentyou understand that there can be very large fluctuations in the value of your investment, andyou want foreign currency exposures to be mostly hedged to the Australian dollar.
7 yearsMinimum suggested time toinvest
Asset allocation Strategic asset allocationAsset class100% Global shares
Very high (estimate of 6 or more negative annual returns in any 20 year period)Standard Risk Measure
MLC MasterKey Business Super Investment Menu | 49

CashMLC Cash FundAims to outperform the Benchmark, before fees and tax, over 1 year periods.Investment objective
Reserve Bank of Australia Cash Rate TargetBenchmark
The fund invests in deposits with banks (100% National Australia Bank as at 30 September 2021) andmay also invest in other comparable high quality securities.
How the investment option ismanaged
you want to invest in a low risk cash portfolio.The investment option may besuited to you if...
No minimumMinimum suggested time toinvest
Asset allocation Strategic asset allocationAsset class100%Cash
Very low (estimate of less than 1 negative annual return in any 20 year period)Standard Risk Measure
50 | MLC MasterKey Business Super Investment Menu
MLC assetclass funds

These are single asset class investment options from other managers.
We recognise some investors want extraoptions when it comes to managing theirmoney. The Investment Menu includesoptions from other managers that havetheir own approach to investing, for youand your financial adviser to choosefrom.
An overview of each manager’sinvestment objective and how theinvestment option is invested isprovided. You can find further details oneach investment option in themanagers’ PDS at mlc.com.au/findafund. A copy of each PDS isavailable on request, free of charge, bycalling us on 132 652.
The investment fees will include anycosts incurred by us and rebates fromthe managers.
MLC MasterKey Business Super Investment Menu | 51
Investment options otherthan MLC portfolios

Fixed income
Macquarie Income Opportunities FundThe fund aims to outperform the Benchmark over the medium term (before fees). It aims to providehigher income returns than traditional cash investments at all stages of interest rate and economiccycles.
Investment objective
Bloomberg AusBond Bank Bill IndexBenchmarkThe fund predominantly provides exposure to a wide range of domestic and global investment gradefloating and fixed rate instruments, asset-backed securities, and cash. The fund may also haveopportunistic exposure to other fixed income sectors and instruments such as, high yield and emerging
How the investment option ismanaged
markets debt as well as other fixed income instruments. Interest rate risk will generally be hedgedthrough the use of derivatives such as swaps and futures.
The investment process aims to reduce the risk of the fund being adversely affected by unexpectedevents or downgrades in the credit rating of the fund’s investments. A disciplined framework is usedto analyse each sector and proposed investment to assess its risk.
The fund may be exposed to derivatives to implement its investment strategy. For example, protectionmay be purchased on issuers that are believed to be over-valued or at risk of downgrade. Thesepositions increase in value when the underlying instrument falls in value and decrease in value whenthe underlying instrument rises in value.
The portfolio is generally hedged to Australian dollars. However, any exposure to emerging marketsdebt issued in the local currency of the debt will generally be unhedged. Small active currency positionsmay also be taken when the investment manager believes that there are opportunities to add valueor hedge risks in the portfolio.you want a medium term investment horizon, seeking a steady and reliable income stream.The investment option may be
suited to you if...3 yearsMinimum suggested time to
investAsset allocation RangesAsset class
0% – 100%Investment grade credit*0% – 25%High yield0% – 25%Emerging markets debt**
0% – 100%Cash* Includes Australian and global investment grade credit.** May include holdings of sub-investment grade instruments.
Low to medium (estimate of 1 to 2 negative annual returns in any 20 year period)Standard Risk Measure
PIMCO Diversified Fixed Interest Fund - Wholesale ClassTo achieve maximum total return by investing in underlying funds that invest in Australian andoverseas bonds, and to seek to preserve capital through prudent investment management.
Investment objective
50% Bloomberg Barclays Global Aggregate Index (Hedged in Australian dollars) and 50% BloombergAusBond Composite 0+ Yr Index
Benchmark
The fund invests in indirect and direct government, corporate, mortgage, and other fixed interestsecurities. While the fund invests predominantly in Investment Grade Securities, it may also investin non-Investment Grade fixed interest securities and Emerging Market Debt. The fund currently
How the investment option ismanaged
seeks to achieve its investment objective by investing in other funds where PIMCO Australia Pty Ltdis the Investment Manager and PIMCO Australian Management Limited is the Responsible Entity,primarily being the PIMCO Australian Bond Fund and PIMCO Global Bond Fund.
The fund may also hold cash.
the fund is designed for investors who wish to have a broadly diversified exposure to both domesticand international fixed interest markets.
The investment option may besuited to you if...
5 to 7 yearsMinimum suggested time toinvest
Asset allocation Strategic asset allocationAsset class100%Fixed income and cash
Low to medium (estimate of 1 to 2 negative annual returns in any 20 year period)Standard Risk Measure
52 | MLC MasterKey Business Super Investment Menu
Investment options otherthan MLC portfolios

Fixed income continued
PIMCO Global Bond Fund - Wholesale ClassTo achieve maximum total return by investing in Global fixed interest securities and to seek topreserve capital through prudent investment management.
Investment objective
Bloomberg Barclays Global Aggregate Index hedged in Australian dollarsBenchmark
The fund invests in indirect and direct government, corporate, mortgage, and other fixed interestsecurities. While the fund invests predominantly in Investment Grade securities, it may also investin non-Investment Grade fixed interest securities and Emerging Market Debt.
How the investment option ismanaged
The fund may also hold cash and derivatives.
the fund is designed for investors who wish to have a broadly diversified exposure to internationalfixed interest markets.
The investment option may besuited to you if...
5 to 7 yearsMinimum suggested time toinvest
Asset allocation Strategic asset allocationAsset class100%Fixed income and cash
Low to medium (estimate of 1 to 2 negative annual returns in any 20 year period)Standard Risk Measure
Vanguard® Australian Fixed Interest Index FundTo track the return (income and capital appreciation) of the Benchmark before taking into accountfund fees, expenses and tax.
Investment objective
Bloomberg AusBond Composite 0+ Yr IndexBenchmark
The fund invests in high-quality, income-generating securities issued by the CommonwealthGovernment of Australia, Australian State Government authorities and treasury corporations, as wellas investment-grade corporate issuers. While being low cost, the fund also provides some protection
How the investment option ismanaged
against capital volatility. The investments in the fund are predominantly rated BBB - or higher byStandard & Poor's ratings agency or equivalent.
you have a medium-term investment horizon, seeking a steady and reliable income stream.The investment option may besuited to you if...
3 yearsMinimum suggested time toinvest
Asset allocation Strategic asset allocationAsset class100% Australian fixed interest
Medium (estimate of 2 to 3 negative annual returns in any 20 year period)Standard Risk Measure
MLC MasterKey Business Super Investment Menu | 53

Property securities
Vanguard® Australian Property Securities Index FundTo track the return of the Benchmark before taking into account fees, expenses and tax.Investment objective
S&P/ASX 300 A-REIT IndexBenchmark
The fund provides a low-cost way to invest in property securities listed on the Australian SecuritiesExchange. The property sectors in which the fund invests include retail, office, industrial anddiversified. The fund offers potential long-term capital growth and tax-effective income that may
How the investment option ismanaged
include a tax-deferred component.
The S&P/ASX 300 A-REIT Index comprises property securities (shares) listed on the AustralianSecurities Exchange (ASX). These securities are real estate investment trusts and companies that ownreal estate assets and derive a significant proportion of their revenue from rental income.
The fund will hold all of the securities in the index most of the time, allowing for individual securityweightings to vary marginally from the index from time to time. The fund may invest in securitiesthat have been removed from or are expected to be included in the index.
you want long-term capital growth, some tax-effective income, and you have a higher tolerance forthe risks associated with share market volatility.
The investment option may besuited to you if...
5 yearsMinimum suggested time toinvest
Asset allocation Strategic asset allocationAsset class100% Australian property securities
Very high (estimate of 6 or more negative annual returns in any 20 year period)Standard Risk Measure
54 | MLC MasterKey Business Super Investment Menu
Investment options otherthan MLC portfolios
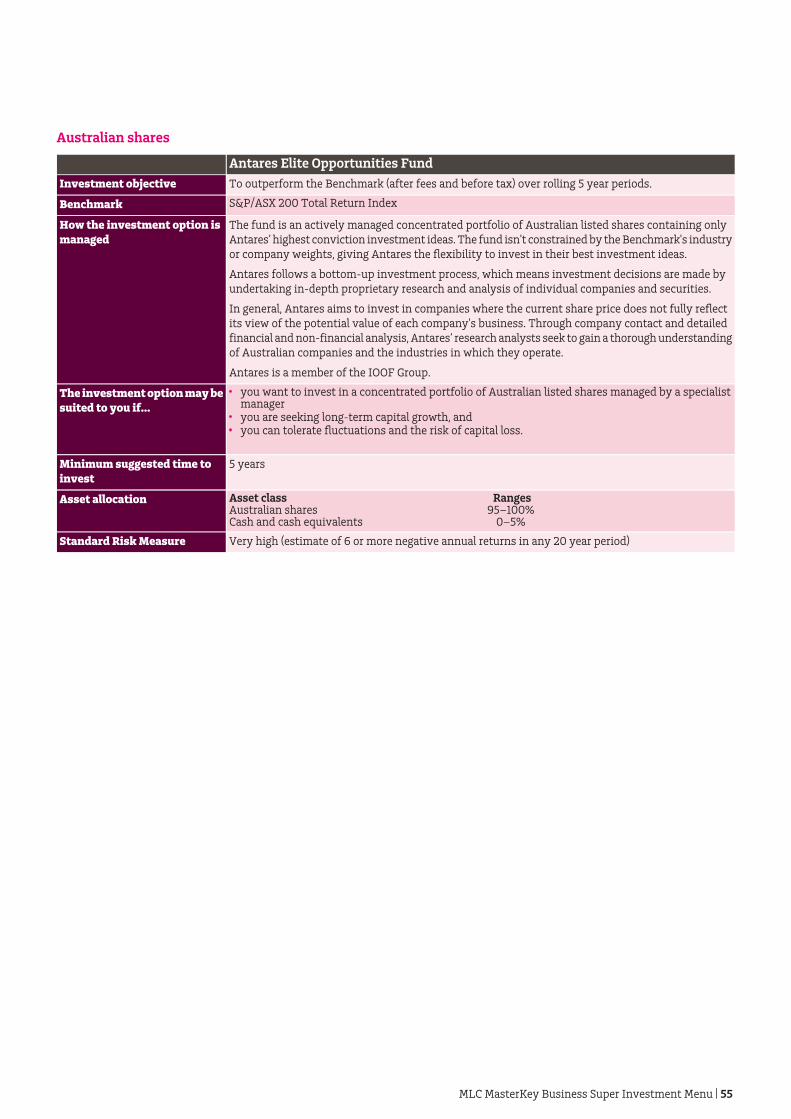
Australian shares
Antares Elite Opportunities FundTo outperform the Benchmark (after fees and before tax) over rolling 5 year periods.Investment objective
S&P/ASX 200 Total Return IndexBenchmark
The fund is an actively managed concentrated portfolio of Australian listed shares containing onlyAntares’ highest conviction investment ideas. The fund isn't constrained by the Benchmark's industryor company weights, giving Antares the flexibility to invest in their best investment ideas.
How the investment option ismanaged
Antares follows a bottom-up investment process, which means investment decisions are made byundertaking in-depth proprietary research and analysis of individual companies and securities.
In general, Antares aims to invest in companies where the current share price does not fully reflectits view of the potential value of each company's business. Through company contact and detailedfinancial and non-financial analysis, Antares’ research analysts seek to gain a thorough understandingof Australian companies and the industries in which they operate.
Antares is a member of the IOOF Group.
The investment option may besuited to you if...
you want to invest in a concentrated portfolio of Australian listed shares managed by a specialistmanageryou are seeking long-term capital growth, andyou can tolerate fluctuations and the risk of capital loss.
5 yearsMinimum suggested time toinvest
Asset allocation RangesAsset class95–100% Australian shares
0–5% Cash and cash equivalents
Very high (estimate of 6 or more negative annual returns in any 20 year period)Standard Risk Measure
MLC MasterKey Business Super Investment Menu | 55

Australian shares continued
Antares High Growth Shares FundTo outperform the Benchmark (after fees and before tax) over rolling 5 year periods.Investment objectiveS&P/ASX 200 Total Return IndexBenchmarkThe fund is an actively managed portfolio of Australian listed shares investing in both long and shortpositions, using active trading, along with the use of derivatives with the aim of enhancing returnsfor investors.
How the investment option ismanaged
Antares applies their investment expertise and stock selection capabilities to manage the fund. Antaresuses the following key strategies:
short selling – Antares generally aims to short sell a security with the expectation of buying it back,at a later time, at a lower price and therefore enhance the fund's returnenhanced long positions – Antares seeks to amplify the fund’s return relative to its benchmark byoverweighting those shares they believe to be undervaluedactive trading – trading in shares where the fund holds a range of different positions over a relativelyshort period of time, with a view to fully exploiting all available opportunities to add value as marketcircumstances change, andderivatives – the fund only deals in exchange traded derivatives listed with the Australian SecuritiesExchange (ASX). Antares can invest in derivatives to manage the fund in a more efficient manner,reduce risk, reduce transaction costs, enhance returns, increase market exposure, and reduce marketexposure (ie shorting).
The fund may become leveraged through borrowing, the use of derivatives and short selling. The netexposure of the fund cannot exceed 100% of the net asset value of the fund.
Antares is a member of the IOOF Group.
This fund is considered a hedge fund by the Australian Securities and Investments Commissionbecause it uses some sophisticated investment techniques. More information about this fund isavailable in the investment manager’s PDS available at mlc.com.au/findafund
The investment option may besuited to you if...
you want to invest in an actively managed, diversified portfolio of Australian listed shares managedby a specialist manageryou want the potential for long-term capital growth and the potential to add value from both risesand falls in individual share prices by taking long and short positionsyou understand the additional risks of taking long/short positions, andyou can tolerate fluctuations and the risk of capital loss.
5 years plusMinimum suggested time toinvestAsset allocation RangesAsset class
90–125%Australian shares (Long)0– -25%Australian shares (Short)0–10%Cash and cash equivalents
Very high (estimate of 6 or more negative annual returns in any 20 year period)Standard Risk Measure
56 | MLC MasterKey Business Super Investment Menu
Investment options otherthan MLC portfolios
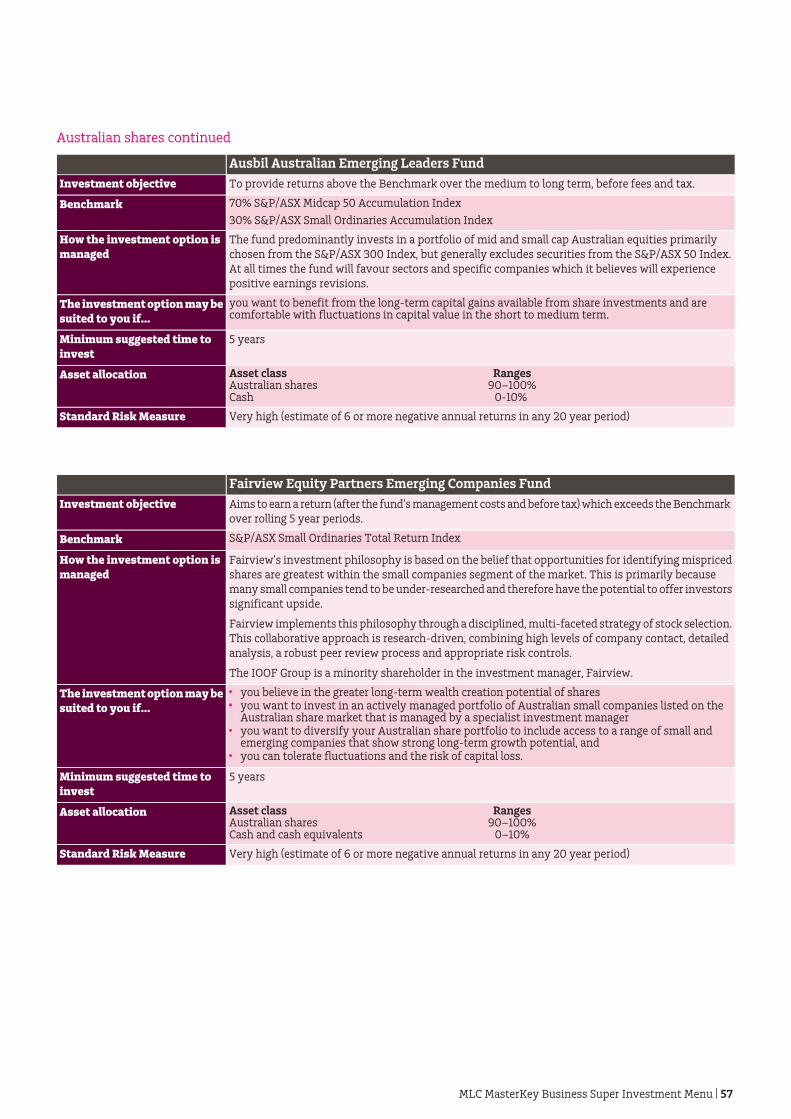
Australian shares continued
Ausbil Australian Emerging Leaders FundTo provide returns above the Benchmark over the medium to long term, before fees and tax.Investment objective
70% S&P/ASX Midcap 50 Accumulation IndexBenchmark30% S&P/ASX Small Ordinaries Accumulation Index
The fund predominantly invests in a portfolio of mid and small cap Australian equities primarilychosen from the S&P/ASX 300 Index, but generally excludes securities from the S&P/ASX 50 Index.At all times the fund will favour sectors and specific companies which it believes will experience
How the investment option ismanaged
positive earnings revisions.
you want to benefit from the long-term capital gains available from share investments and arecomfortable with fluctuations in capital value in the short to medium term.
The investment option may besuited to you if...
5 yearsMinimum suggested time toinvest
Asset allocation RangesAsset class90–100%Australian shares
0-10% Cash
Very high (estimate of 6 or more negative annual returns in any 20 year period)Standard Risk Measure
Fairview Equity Partners Emerging Companies FundAims to earn a return (after the fund’s management costs and before tax) which exceeds the Benchmark over rolling 5 year periods.
Investment objective
S&P/ASX Small Ordinaries Total Return IndexBenchmark
Fairview's investment philosophy is based on the belief that opportunities for identifying mispricedshares are greatest within the small companies segment of the market. This is primarily becausemany small companies tend to be under-researched and therefore have the potential to offer investors
How the investment option ismanaged
significant upside.
Fairview implements this philosophy through a disciplined, multi-faceted strategy of stock selection.This collaborative approach is research-driven, combining high levels of company contact, detailedanalysis, a robust peer review process and appropriate risk controls.
The IOOF Group is a minority shareholder in the investment manager, Fairview.
The investment option may besuited to you if...
you believe in the greater long-term wealth creation potential of sharesyou want to invest in an actively managed portfolio of Australian small companies listed on theAustralian share market that is managed by a specialist investment manageryou want to diversify your Australian share portfolio to include access to a range of small andemerging companies that show strong long-term growth potential, andyou can tolerate fluctuations and the risk of capital loss.
5 yearsMinimum suggested time toinvest
Asset allocation RangesAsset class90–100%Australian shares
0–10%Cash and cash equivalents
Very high (estimate of 6 or more negative annual returns in any 20 year period)Standard Risk Measure
MLC MasterKey Business Super Investment Menu | 57

Australian shares continued
Investors Mutual Australian Share FundTo provide a return (after fees and expenses and before taxes) which exceeds the Benchmark, overrolling four year periods.
Investment objective
S&P/ASX 300 Total Return Index Benchmark
The fund will invest in a diversified portfolio of quality Australian and New Zealand industrial andresource shares, where these shares are identified by our investment team as being undervalued.
How the investment option ismanaged
The fund will aim to provide investors with long-term capital growth and income through an activelymanaged portfolio of quality Australian Shares listed on the ASX.
The investment option may besuited to you if...
4 to 5 yearsMinimum suggested time toinvest
Asset allocation RangesAsset class90–100%Australian shares
0–10%Cash
Very high (estimate of 6 or more negative annual returns in any 20 year period)Standard Risk Measure
Perpetual Wholesale Australian Share FundAims to provide long-term capital growth and regular income through investment predominantly inquality Australian industrial and resource shares and outperform the Benchmark (before fees andtaxes) over rolling three-year periods.
Investment objective
S&P/ASX 300 Accumulation IndexBenchmark
Perpetual researches companies of all sizes using consistent share selection criteria. Perpetual’spriority is to select those companies that represent the best investment quality and are appropriatelypriced. In determining investment quality, investments are carefully selected on the basis of four key
How the investment option ismanaged
investment criteria:
conservative debt levelssound managementquality business, and recurring earnings.
The fund may have up to 20% exposure to investments in international shares. The fund investspredominantly in Australian shares listed on or proposed to be listed on any recognised Australianexchange, but may have up to 20% exposure to international shares listed on or proposed to be listedon any recognised global exchange. Currency hedges may be used from time to time.
Derivatives may be used in managing the fund.
you want to invest in an active Australian shares fund.The investment option may besuited to you if...
5 yearsMinimum suggested time toinvest
Asset allocation RangesAsset class90–100%Australian shares
0–10%Cash
Very high (estimate of 6 or more negative annual returns in any 20 year period)Standard Risk Measure
58 | MLC MasterKey Business Super Investment Menu
Investment options otherthan MLC portfolios

Australian shares continued
Perpetual Wholesale Ethical SRI FundAims to provide long-term capital growth and regular income through investment predominantly inquality shares of Australian ethical and socially responsible companies and outperform the Benchmark(before fees and taxes) over rolling three-year periods.
Investment objective
S&P/ASX 300 Accumulation IndexBenchmark
Perpetual researches companies of all sizes using consistent share selection criteria. Perpetual’spriority is to select those companies that represent the best investment quality and are appropriatelypriced. In determining investment quality, investments are carefully selected on the basis of four key
How the investment option ismanaged
investment criteria:
conservative debt levelssound managementquality business, and recurring earnings.
In addition to the above investment approach, Perpetual utilises a strategy for screening ethical andsocially responsible investments.
The fund may have up to 20% exposure to investments in international shares. The fund investspredominantly in Australian shares listed on or proposed to be listed on any recognised Australianexchange, but may have up to 20% exposure to international shares listed on or proposed to be listedon any recognised global exchange. Currency hedges may be used from time to time.
Derivatives may be used in managing the fund.
you want to invest in an Australian shares fund that invests in socially responsible companies.The investment option may besuited to you if...
5 yearsMinimum suggested time toinvest
Asset allocation RangesAsset class90-100%Australian Shares
0-10%Cash
Very high (estimate of 6 or more negative annual returns in any 20 year period)Standard Risk Measure
Perpetual Wholesale Smaller Companies Fund No.2Aims to provide long-term capital growth and income through investment in quality Australianindustrial and resource shares which, when first acquired, do not rank in the S&P/ASX 50 Index andoutperform the Benchmark (before fees and taxes) over rolling three-year periods.
Investment objective
S&P/ASX Small Ordinaires Accumulation IndexBenchmark
Perpetual researches companies of all sizes using consistent share selection criteria. Perpetual’spriority is to select those companies that represent the best investment quality and are appropriatelypriced. In determining investment quality, investments are carefully selected on the basis of four key
How the investment option ismanaged
investment criteria:
conservative debt levelssound managementquality business, and recurring earnings.
The fund may invest in shares listed on or proposed to be listed on any recognised Australian exchange.
Derivatives may be used in managing the fund.
you want to invest in a smaller companies Australian shares fund.The investment option may besuited to you if...
5 yearsMinimum suggested time toinvest
Asset allocation RangesAsset class80–100%Australian smaller companies shares
0–20%Cash
Very high (estimate of 6 or more negative annual returns in any 20 year period)Standard Risk Measure
MLC MasterKey Business Super Investment Menu | 59
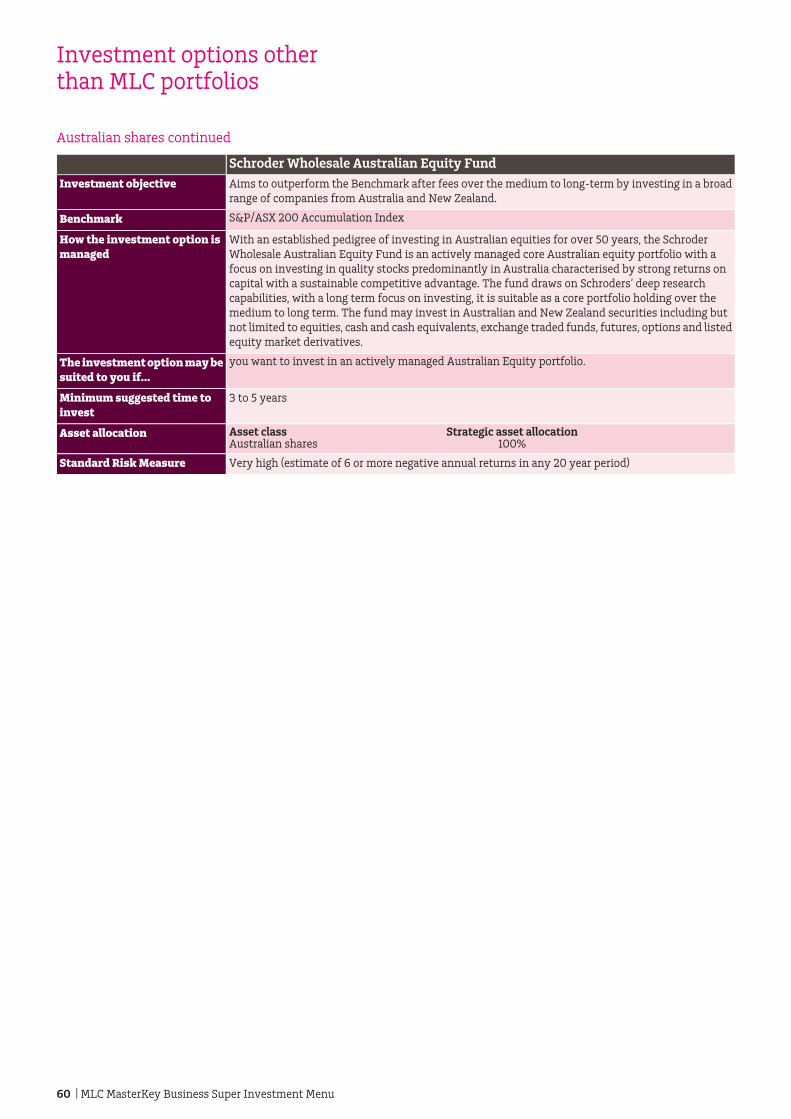
Australian shares continued
Schroder Wholesale Australian Equity Fund Aims to outperform the Benchmark after fees over the medium to long-term by investing in a broadrange of companies from Australia and New Zealand.
Investment objective
S&P/ASX 200 Accumulation Index Benchmark
With an established pedigree of investing in Australian equities for over 50 years, the SchroderWholesale Australian Equity Fund is an actively managed core Australian equity portfolio with afocus on investing in quality stocks predominantly in Australia characterised by strong returns on
How the investment option ismanaged
capital with a sustainable competitive advantage. The fund draws on Schroders’ deep researchcapabilities, with a long term focus on investing, it is suitable as a core portfolio holding over themedium to long term. The fund may invest in Australian and New Zealand securities including butnot limited to equities, cash and cash equivalents, exchange traded funds, futures, options and listedequity market derivatives.
you want to invest in an actively managed Australian Equity portfolio.The investment option may besuited to you if...
3 to 5 yearsMinimum suggested time toinvest
Asset allocation Strategic asset allocationAsset class100%Australian shares
Very high (estimate of 6 or more negative annual returns in any 20 year period)Standard Risk Measure
60 | MLC MasterKey Business Super Investment Menu
Investment options otherthan MLC portfolios
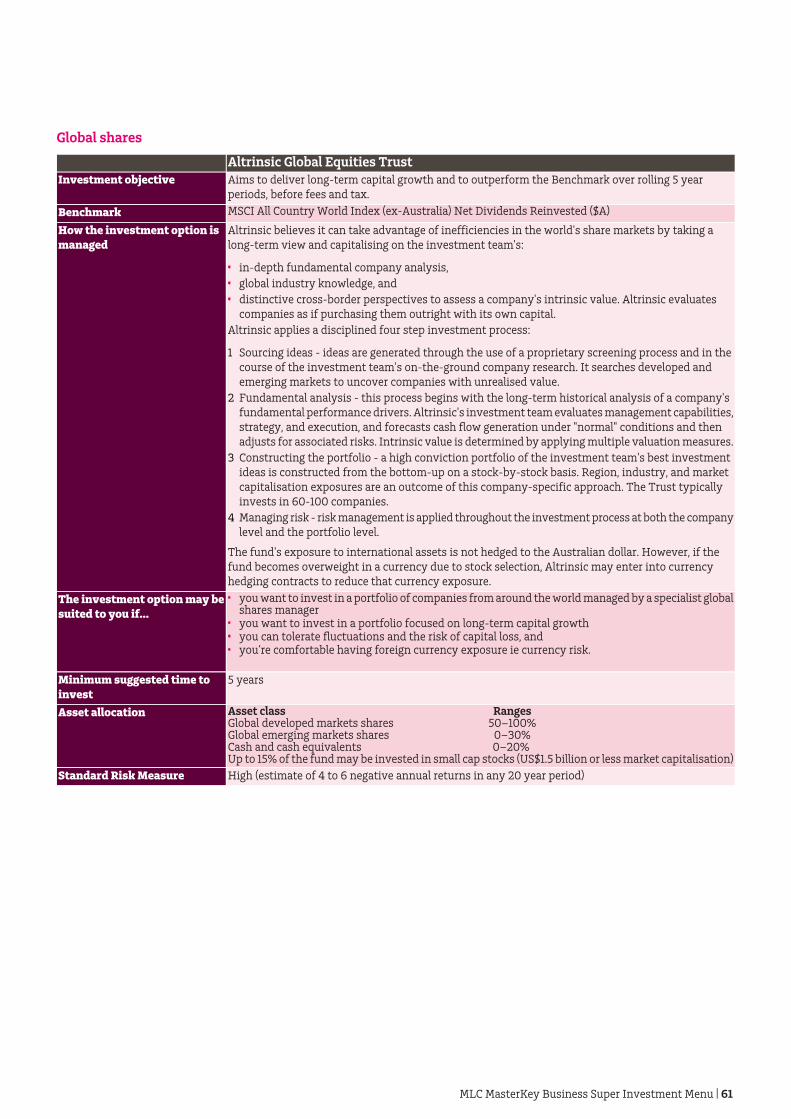
Global shares
Altrinsic Global Equities TrustAims to deliver long-term capital growth and to outperform the Benchmark over rolling 5 yearperiods, before fees and tax.
Investment objective
MSCI All Country World Index (ex-Australia) Net Dividends Reinvested ($A) BenchmarkAltrinsic believes it can take advantage of inefficiencies in the world's share markets by taking along-term view and capitalising on the investment team's:
How the investment option ismanaged
in-depth fundamental company analysis,global industry knowledge, anddistinctive cross-border perspectives to assess a company's intrinsic value. Altrinsic evaluatescompanies as if purchasing them outright with its own capital.
Altrinsic applies a disciplined four step investment process:
1 Sourcing ideas - ideas are generated through the use of a proprietary screening process and in thecourse of the investment team's on-the-ground company research. It searches developed andemerging markets to uncover companies with unrealised value.
2 Fundamental analysis - this process begins with the long-term historical analysis of a company'sfundamental performance drivers. Altrinsic's investment team evaluates management capabilities,strategy, and execution, and forecasts cash flow generation under "normal" conditions and thenadjusts for associated risks. Intrinsic value is determined by applying multiple valuation measures.
3 Constructing the portfolio - a high conviction portfolio of the investment team's best investmentideas is constructed from the bottom-up on a stock-by-stock basis. Region, industry, and marketcapitalisation exposures are an outcome of this company-specific approach. The Trust typicallyinvests in 60-100 companies.
4 Managing risk - risk management is applied throughout the investment process at both the companylevel and the portfolio level.
The fund's exposure to international assets is not hedged to the Australian dollar. However, if thefund becomes overweight in a currency due to stock selection, Altrinsic may enter into currencyhedging contracts to reduce that currency exposure.
The investment option may besuited to you if...
you want to invest in a portfolio of companies from around the world managed by a specialist globalshares manageryou want to invest in a portfolio focused on long-term capital growthyou can tolerate fluctuations and the risk of capital loss, andyou’re comfortable having foreign currency exposure ie currency risk.
5 yearsMinimum suggested time toinvestAsset allocation RangesAsset class
50–100%Global developed markets shares0–30%Global emerging markets shares0–20% Cash and cash equivalents
Up to 15% of the fund may be invested in small cap stocks (US$1.5 billion or less market capitalisation)High (estimate of 4 to 6 negative annual returns in any 20 year period)Standard Risk Measure
MLC MasterKey Business Super Investment Menu | 61

Global shares continued
Platinum Asia FundThe fund aims to provide capital growth over the long-term by investing in undervalued companiesin the Asian region excluding Japan.
Investment objective
MSCI All Country Asia ex Japan Net Index in $A (for performance comparison purposes only)Benchmark
The fund primarily invests in the listed securities of Asian companies. Asian companies may list theirsecurities on securities exchanges other than those in Asia and the fund may invest in those securities.The fund may invest in companies not listed in Asia but where their predominant business is
How the investment option ismanaged
conducted in Asia. The fund may invest in companies that benefit from exposure to the Asian economicregion.
Platinum defines “Asia” as all countries that occupy the eastern part of the Eurasian landmass andits adjacent islands and is separated from Europe by the Ural Mountains, and includes the RussianFar East and companies based in China, Hong Kong, Taiwan, Korea, Malaysia, Singapore, India, Thailand,Indonesia, Philippines, Sri Lanka, Pakistan and Vietnam.
The portfolio will ideally consist of 40 to 100 securities that Platinum believes to be undervalued bythe market. Cash may be held when undervalued securities cannot be found. Platinum may short sellsecurities that it considers overvalued. The portfolio will typically have 50% or more net equityexposure.
Platinum may use derivatives:
for risk management purposes to take opportunities to increase returns to create a short position in securities or indices to establish positions in securities that may otherwise not be readily available (eg to gain accessto particular stock markets where foreign investors face restrictions), and to aid in the management of fund cash flows (eg some stock markets require pre-funding of stockpurchases that may be avoided through the use of derivatives).
Platinum has set the following investment restrictions in respect of the fund:
the notional value# of derivatives may not exceed 100% of the Net Asset Value (NAV) of the fund,andthe value# of long stock positions and the notional value of derivatives positions together will notexceed 150% of the NAV of the fund.
#Where options are employed, the notional value will be the Delta adjusted exposure. "Delta" is thetheoretical measure of the sensitivity of the option price to a change in the price of the underlyingasset (usually expressed as a percentage).
Platinum manages risk associated with currency exposure through the use of hedging devices (egforeign exchange forwards, swaps, non-deliverable forwards and currency options) and cash foreignexchange trades.
This fund is considered a hedge fund by the Australian Securities and Investments Commissionbecause it uses some sophisticated investment techniques.
More information about this fund is available in the investment manager’s PDS available at mlc.com.au/findafund
Not applicableThe investment option may besuited to you if...
5 or more yearsMinimum suggested time toinvest
Asset allocation RangesAsset class 0–100%International Equities0-100%Cash and Cash Equivalents
Cash and cash equivalents typically represents less than 40% of a Fund’s NAV. The fund may investin bullion and other physical commodities, but the total value of such investments at the time ofacquisition will not exceed 20% of the NAV of the fund.
Very high (estimate of 6 or more negative annual returns in any 20 year period)Standard Risk Measure
62 | MLC MasterKey Business Super Investment Menu
Investment options otherthan MLC portfolios

Global shares continued
Platinum International Fund
The fund aims to provide capital growth over the long-term by investing in undervalued companiesaround the world.
Investment objective
MSCI All Country World Net Index in $A (for performance comparison purposes only)Benchmark
The fund primarily invests in listed securities. The portfolio will ideally consist of 70 to 140 securitiesthat Platinum believes to be undervalued by the market. Cash may be held when undervaluedsecurities cannot be found. Platinum may short sell securities that it considers overvalued. The
How the investment option ismanaged
portfolio will typically have 50% or more net equity exposure.
Platinum may use derivatives:
for risk management purposesto take opportunities to increase returnsto create a short position in securities or indicesto establish positions in securities that may otherwise not be readily available (eg to gain accessto particular stock markets where foreign investors face restrictions), and to aid in the management of fund cash flows (eg some stock markets require pre-funding of stockpurchases that may be avoided through the use of derivatives).
Platinum has set the following investment restrictions in respect of the fund:
the notional value# of derivatives may not exceed 100% of the Net Asset Value (NAV) of the fund,and the value# of long stock positions and the notional value of derivatives positions together will notexceed 150% of the NAV of the fund.
#Where options are employed, the notional value will be the Delta adjusted exposure. “Delta” is thetheoretical measure of the sensitivity of the option price to a change in the price of the underlyingasset (usually expressed as a percentage).
Platinum manages risk associated with currency exposure through the use of hedging devices (egforeign exchange forwards, swaps, non-deliverable forwards and currency options) and cash foreignexchange trades.
This fund is considered a hedge fund by the Australian Securities and Investments Commissionbecause it uses some sophisticated investment techniques.
More information about this fund is available in the investment manager’s PDS available at mlc.com.au/findafund
Not applicableThe investment option maybe suited to you if...
5 or more yearsMinimum suggested time toinvest
Asset allocation RangesAsset class0–100%International Equities0–100%Cash and Cash Equivalents
Cash and cash equivalents typically represents less than 40% of a Fund’s NAV. The fund may investin bullion and other physical commodities, but the total value of such investments at the time ofacquisition will not exceed 20% of the NAV of the fund.
Very high (estimate of 6 or more negative annual returns in any 20 year period)Standard Risk Measure
MLC MasterKey Business Super Investment Menu | 63

Global shares continued
PM CAPITAL Global Companies FundTo provide long term capital growth and outperform the greater of the MSCI World Net Total ReturnIndex (AUD) or RBA cash rate over rolling seven year periods. The fund is not intended to replicatethe index.
Investment objective
MSCI World Net Total Return Index (AUD)Benchmark
The Global Companies fund aims to create long term wealth through a concentrated portfolio of 25-45global securities and other instruments, interest bearing debt securities, managed investment schemes(MIS), derivatives (both exchange traded and over the counter), deposit products and cash. The fund
How the investment option ismanaged
falls under the hedge fund disclosure regime as defined by the Australian Securities and InvestmentsCommission because it uses some sophisticated investment techniques.
More information about this fund is available in the investment manager’s PDS available at mlc.com.au/findafund
The investment option may besuited to you if...
you seek a focused, patient and considered approach to finding simple investment ideas thatproduces the best environment for creating wealth over a long-term investment horizonyou want an increased exposure to global equities via access to a handpicked portfolio of globalsecuritiesyou want diversity of returns compared with those provided by more traditional global equityfunds
7 yearsMinimum suggested time toinvest
Net Asset allocation range % (incl. derivatives)Asset allocation0– 110% Global equities0–30% Debt securities0–10% Other (MIS, unlisted investments)0–100% CashThe fund may use derivatives, short selling, and leverage.
Very high (estimate of 6 or more negative annual returns in any 20 year period)Standard Risk Measure
Vanguard® International Shares Index Fund (Hedged)To track the return of the Benchmark, before taking into account fees, expenses and tax.Investment objective
MSCI World (ex-Australia) Index (net dividends reinvested), hedged into Australian dollarsBenchmark
The fund meets its investment strategy by investing in the Vanguard International Shares IndexFund, forward foreign exchange contracts and futures. Vanguard may, at its discretion, commenceinvesting directly in the securities that are, have been or are expected to be in the index. The fund is
How the investment option ismanaged
exposed to all of the securities in the index most of the time, allowing for individual security weightingsto vary marginally from the index from time to time. The fund may be exposed to securities that havebeen removed from or are expected to be included in the index.
you want exposure to a diversified portfolio of international shares that is relatively unaffected bycurrency fluctuations.
The investment option may besuited to you if...
7 yearsMinimum suggested time toinvest
Asset allocation Strategic asset allocationAsset class100%International shares (hedged to AUD)
Very high (estimate of 6 or more negative annual returns in any 20 year period)Standard Risk Measure
64 | MLC MasterKey Business Super Investment Menu
Investment options otherthan MLC portfolios
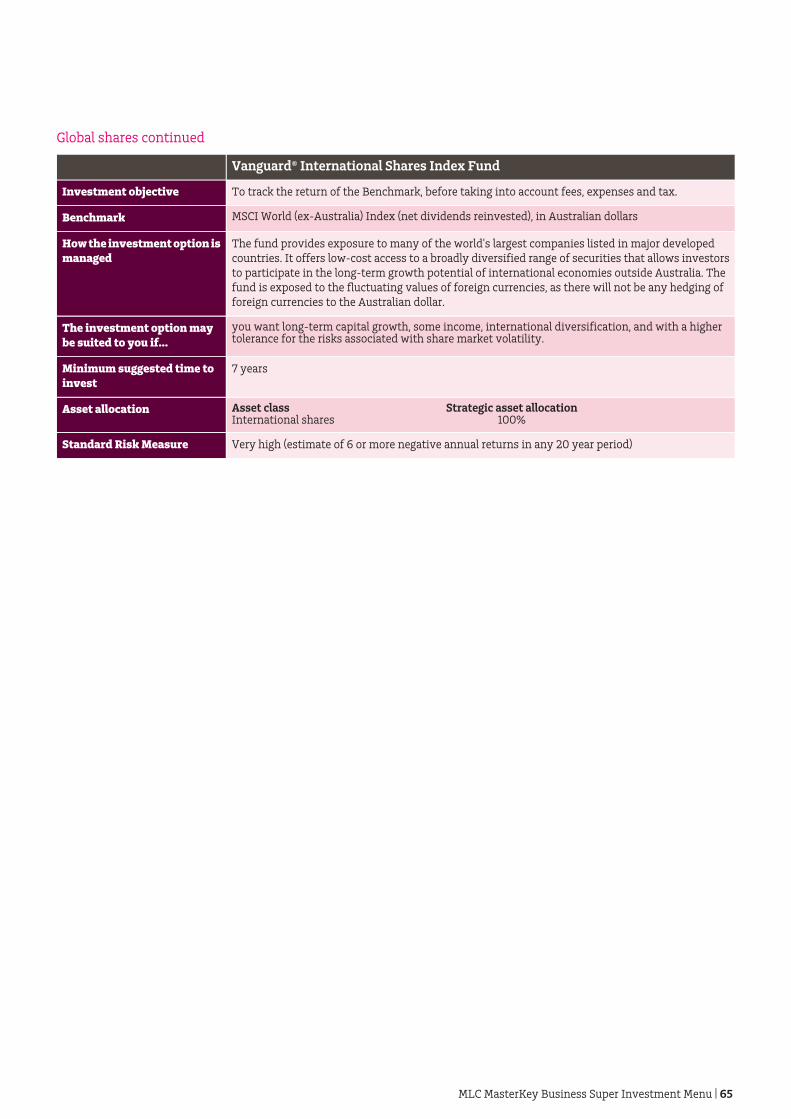
Global shares continued
Vanguard® International Shares Index Fund
To track the return of the Benchmark, before taking into account fees, expenses and tax.Investment objective
MSCI World (ex-Australia) Index (net dividends reinvested), in Australian dollarsBenchmark
The fund provides exposure to many of the world's largest companies listed in major developed countries. It offers low-cost access to a broadly diversified range of securities that allows investorsto participate in the long-term growth potential of international economies outside Australia. The
How the investment option ismanaged
fund is exposed to the fluctuating values of foreign currencies, as there will not be any hedging offoreign currencies to the Australian dollar.
you want long-term capital growth, some income, international diversification, and with a highertolerance for the risks associated with share market volatility.
The investment option maybe suited to you if...
7 yearsMinimum suggested time toinvest
Asset allocation Strategic asset allocationAsset class100%International shares
Very high (estimate of 6 or more negative annual returns in any 20 year period)Standard Risk Measure
MLC MasterKey Business Super Investment Menu | 65

Administration fees and costs apply in addition to the fees and costs shown in this table. Please refer to the PDS and Fee Brochure forfurther information about fees and costs, including how the figures shown below are calculated.
Transactioncosts (gross)1
Buy-sellspreads
Transactioncosts (net)
Equalsinvestment
fees and costs
The investment fees and costsare made up of
Plusother
investment feesand costs
Performancefee
% paEntry %/Exit %% pa% pa% pa
MySuper0.080.00 / 0.000.080.780.570.21Under age 550.080.00 / 0.000.080.780.570.21At age 550.080.00 / 0.000.080.780.570.21At age 560.080.00 / 0.000.080.780.570.21At age 570.080.00 / 0.000.080.780.570.21At age 580.080.00 / 0.000.080.780.570.21At age 590.080.00 / 0.000.080.780.570.21At age 600.080.00 / 0.000.080.780.570.21At age 610.080.00 / 0.000.080.780.570.21At age 620.080.00 / 0.000.080.760.560.20At age 630.070.00 / 0.000.070.750.560.19At age 640.070.00 / 0.000.070.750.560.19At age 65 and over0.080.00 / 0.000.080.780.570.21MySuper Growth Portfolio
0.070.00 / 0.000.070.740.550.19MySuper Conservative GrowthPortfolio
0.000.00 / 0.000.000.460.460.00MySuper Cash Plus PortfolioMLC multi-asset portfolios
0.080.10 / 0.100.030.920.770.15MLC Inflation Plus ConservativePortfolio
0.100.10 / 0.100.051.100.880.22MLC Inflation Plus ModeratePortfolio
0.140.15 / 0.100.091.310.970.34MLC Inflation Plus AssertivePortfolio
0.050.10 / 0.100.000.570.570.00MLC Horizon 1 Bond Portfolio
0.060.10 / 0.100.000.810.680.13MLC Horizon 2 Capital StablePortfolio
0.060.10 / 0.100.010.960.740.22MLC Horizon 3 ConservativeGrowth Portfolio
0.070.10 / 0.100.031.150.820.33MLC Horizon 4 BalancedPortfolio
0.070.10 / 0.100.041.160.830.33MLC Horizon 5 Growth Portfolio0.070.10 / 0.100.041.240.870.37MLC Horizon 6 Share Portfolio
0.080.15 / 0.150.021.481.090.39MLC Horizon 7 AcceleratedGrowth Portfolio
0.040.10 / 0.100.000.290.290.00MLC Index Plus ConservativeGrowth Portfolio
0.030.15 / 0.150.000.290.290.00MLC Index Plus BalancedPortfolio
0.030.15 / 0.150.000.290.290.00MLC Index Plus Growth PortfolioMLC asset class funds
0.050.15 / 0.150.000.510.510.00MLC Diversified Debt Fund0.050.25 / 0.250.000.620.620.00MLC Property Securities Fund0.120.15 / 0.100.060.770.770.00MLC Global Property Fund0.100.15 / 0.150.040.710.710.00MLC Australian Share Fund
0.000.05 / 0.050.000.220.220.00MLC Australian Share IndexFund
0.080.25 / 0.250.020.720.720.00MLC IncomeBuilder0.040.10 / 0.100.020.850.850.00MLC Global Share Fund0.070.15 / 0.100.000.900.900.00MLC Hedged Global Share Fund
66 | MLC MasterKey Business Super Investment Menu
Fees and costs foryour investment options

Transactioncosts (gross)1
Buy-sellspreads
Transactioncosts (net)
Equalsinvestment
fees and costs
The investment fees and costsare made up of
Plusother
investment feesand costs
Performancefee
% paEntry %/Exit %% pa% pa% pa
Cash0.000.00 / 0.000.000.130.130.00MLC Cash Fund
Investment options other than MLC portfolios
0.170.15 / 0.160.050.640.640.00Macquarie Income OpportunitiesFund
0.120.00 / 0.100.050.850.850.00PIMCO Diversified Fixed InterestFund - Wholesale Class2
0.140.00 / 0.100.080.950.950.00PIMCO Global Bond Fund -Wholesale Class2
0.030.08 / 0.080.000.390.390.00Vanguard® Australian FixedInterest Fund
0.040.08 / 0.080.000.430.430.00Vanguard® Australian PropertySecurities Index Fund
0.080.15 / 0.150.030.780.700.08Antares Elite Opportunities Fund
0.240.15 / 0.150.171.101.000.10Antares High Growth SharesFund
0.150.25 / 0.250.060.950.950.00Ausbil Australian EmergingLeaders Fund
0.350.25 / 0.250.181.541.200.34Fairview Equity PartnersEmerging Companies Fund
0.060.25 / 0.250.000.940.940.00Investors Mutual AustralianShare Fund
0.130.30 / 0.000.091.061.060.00Perpetual Wholesale AustralianShare Fund
0.090.15 / 0.150.041.001.000.00Perpetual Wholesale Ethical SRIFund
0.200.15 / 0.150.121.451.450.00Perpetual Wholesale SmallCompanies Fund No. 2
0.070.25 / 0.250.000.770.770.00Schroder Wholesale AustralianEquity Fund
0.030.15 / 0.100.000.990.990.00Altrinsic Global Equities Trust0.590.15 / 0.150.481.351.350.00Platinum Asia Fund0.120.15 / 0.150.071.351.350.00Platinum International Fund
0.210.25 / 0.250.023.051.291.76PM CAPITAL Global CompaniesFund
0.100.08 / 0.080.070.410.410.00Vanguard® International SharesIndex Fund (Hedged)
0.010.08 / 0.080.000.380.380.00Vanguard® International SharesIndex Fund1Transaction costs (gross) is a figure reflecting all transaction costs incurred by the investment option before taking into account buy-sellspreads recovered. It is transaction costs (net) rather than transaction costs (gross) which impact investment returns to a member. 2The investment fees and costs are estimates for the financial year to 30 June 2021 based on the actual costs incurred for the financialyear to 30 June 2020, given the actual costs for the financial year to 30 June 2021 were not available at the date of this Investment Menu.
MLC MasterKey Business Super Investment Menu | 67

Cost of product for 1 yearThe cost of product gives a summary calculation about how ongoing annual fees and costs can affect your superannuation investmentover a 1-year period for all superannuation products and investment options. It is calculated in the manner shown in the Example ofannual fees and costs.
The cost of product information assumes a balance of $50,000 at the beginning of the year. (Additional fees such as a buy–sell spreadmay apply: refer to the Fees and costs summary for the relevant superannuation product or investment option.) You should use thisfigure to help compare superannuation products and investment options.
Cost of Product $ pa(based on account balance of $50,000)
MySuper683.00Under age 55683.00At age 55683.00At age 56683.00At age 57683.00At age 58683.00At age 59683.00At age 60683.00At age 61683.00At age 62673.00At age 63663.00At age 64663.00Age 65 and over683.00MySuper Growth Portfolio658.00MySuper Conservative Growth Portfolio523.00MySuper Cash Plus Portfolio
MLC multi-asset portfolios828.00MLC Inflation Plus Conservative Portfolio928.00MLC Inflation Plus Moderate Portfolio
1,053.00MLC Inflation Plus Assertive Portfolio638.00MLC Horizon 1 Bond Portfolio758.00MLC Horizon 2 Capital Stable Portfolio838.00MLC Horizon 3 Conservative Growth Portfolio943.00MLC Horizon 4 Balanced Portfolio953.00MLC Horizon 5 Growth Portfolio993.00MLC Horizon 6 Share Portfolio
1,103.00MLC Horizon 7 Accelerated Growth Portfolio498.00MLC Index Plus Conservative Growth Portfolio498.00MLC Index Plus Balanced Portfolio498.00MLC Index Plus Growth Portfolio
MLC asset class funds508.00MLC Diversified Debt Fund563.00MLC Property Securities Fund668.00MLC Global Property Fund628.00MLC Australian Share Fund363.00MLC Australian Share Index Fund623.00MLC IncomeBuilder688.00MLC Global Share Fund703.00MLC Hedged Global Share Fund
Cash318.00MLC Cash Fund
68 | MLC MasterKey Business Super Investment Menu
Cost of product foryour investment options

Cost of Product $ pa(based on account balance of $50,000)
Investment options other than MLC portfolios698.00Macquarie Income Opportunities Fund803.00PIMCO Diversified Fixed Interest Fund - Wholesale Class868.00PIMCO Global Bond Fund - Wholesale Class548.00Vanguard® Australian Fixed Interest Fund568.00Vanguard® Australian Property Securities Index Fund758.00Antares Elite Opportunities Fund988.00Antares High Growth Shares Fund858.00Ausbil Australian Emerging Leaders Fund
1,213.00Fairview Equity Partners Emerging Companies Fund823.00Investors Mutual Australian Share Fund928.00Perpetual Wholesale Australian Share Fund873.00Perpetual Wholesale Ethical SRI Fund
1,138.00Perpetual Wholesale Small Companies Fund No. 2738.00Schroder Wholesale Australian Equity Fund848.00Altrinsic Global Equities Trust
1,268.00Platinum Asia Fund1,063.00Platinum International Fund1,888.00PM CAPITAL Global Companies Fund
593.00Vanguard® International Shares Index Fund (Hedged)543.00Vanguard® International Shares Index Fund
MLC MasterKey Business Super Investment Menu | 69

This page has been left blank intentionally.
70 | MLC MasterKey Business Super Investment Menu


For more information call us from anywhere in Australia on 132 652 or contact your financial adviser.
Postal addressPO Box 200North Sydney NSW 2059
mlc.com.au
OBJA126190-1021