ml7: driving change in communities by going...
TRANSCRIPT

ML7: Driving Change in Communities by going Upstream
The All Children Thrive Learning Network
Uma Kotagal
Cincinnati Children’s
December 11th , 2017

Cincinnati…
53 infants died by 12 month old
730 hospitalized for psychiatric conditions
450 hospitalized for asthma
1100 not ready to learn at kindergarten
698 not reading proficiently in 3rd grade
Cincinnati – current state of health


Morbidity and Mortality• Reduce annual infant deaths in Hamilton County by 33%• Reduce disparity in hospital bed days by 10%, focusing on 2 high risk
neighborhoods (Avondale and Price Hill)
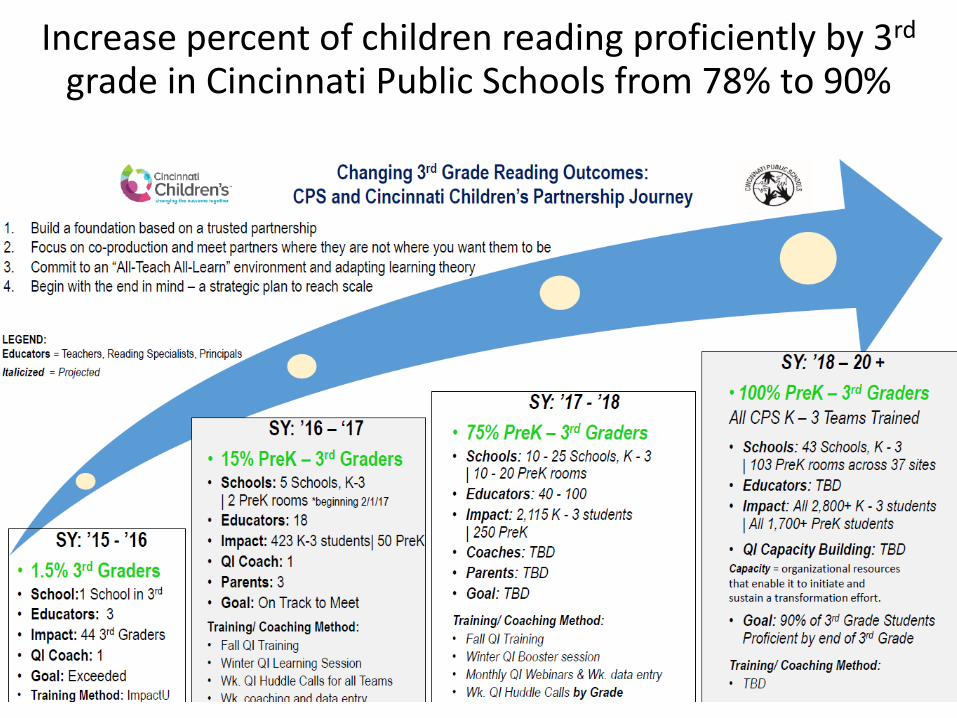
Thriving• Ensure 5 year olds have a ‘healthy mind and body’*• Increase percent of children reading proficiently by 3rd grade in
Cincinnati Public Schools from 78% to 90%
*Bundle measure: immunization, BMI, dental, behavior, vision, emergent literacy, speech, hearing
Help Cincinnati’s 66,000 kids be the healthiest in the nation through strong partnerships
All Children Thrive | Vision, Outcomes

All Children Thrive (ACT) |Mission, Principles
Help Cincinnati’s 66,000 children to be the healthiest in the nation through strong community partnerships.
Mission Bring community members - children, families, community& civic leaders, educators, social service providers, faith leaders, health care providers, researchers, and others - together to collaborate, learn from every interaction, formulate and answer questions, encourage discovery and implement findings to co-produce an environment where children thrive.
Network Principles The five principals were generated by ACT Vision Session participants in October, 2015:• Equity is foundational to improving children's health• Children are the center of our work• Relationships, trust, and working together are essential for sustainable solutions• We all teach and we all learn• Daily work is action oriented and results focused
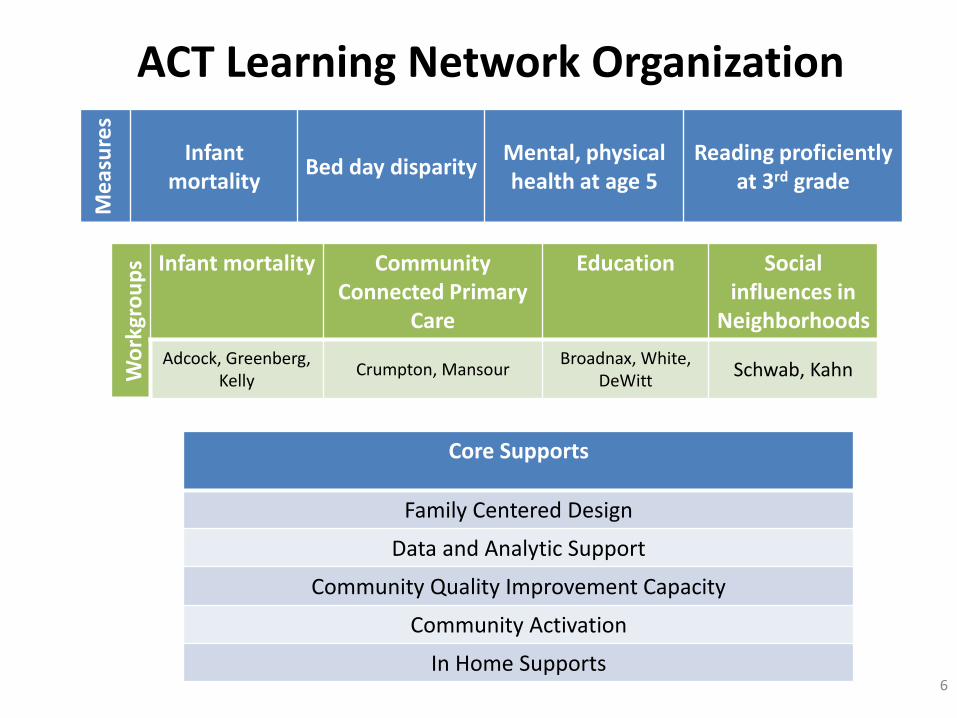
ACT Learning Network Organization
6
Me
asu
res
Infant mortality
Bed day disparityMental, physical health at age 5
Reading proficiently at 3rd grade
Wo
rkgr
ou
ps Infant mortality Community
Connected Primary Care
Education Socialinfluences in
Neighborhoods
Adcock, Greenberg, Kelly
Crumpton, MansourBroadnax, White,
DeWittSchwab, Kahn
Core Supports
Family Centered Design
Data and Analytic Support
Community Quality Improvement Capacity
Community Activation
In Home Supports

Families &
Children
3rd grade Reading
Social Influences
in N’hoods
Infant Mortality
CommunityConnected
Primary Care
Infant MortalityCradle Cincinnati
(Adcock/Kelly/Greenberg)18 Obstetric TeamsGood Samaritan HospitalUniversity of Cincinnati HospitalEvery Child SucceedsCommunity Health Workers
Neighborhood Social Influences(Schwab/Kahn)
Place Matters/LISCGreater Cincinnati Urban LeagueCincinnati WorksSanta Maria Community SvcsThe Community BuildersLegal Aid Society Greater CincinnatiUnited Way of Greater CincinnatiJob and Family Services>20 Families
3rd Grade Reading(Broadnax/4C/Tom DeWitt)
Cincinnati Public SchoolsStrive PartnershipSuccess by Six4C for ChildrenCommunity Action Agency/Head StartPediatric Clinics
Community Connected Primary Care
(Crumpton/Mansour)
Federally Qualified Health CtrsCincinnati Health DepartmentBehavioral Health Agencies
ACT Learning Network: WorkgroupsKotagal, Iyer, Kahn, many others
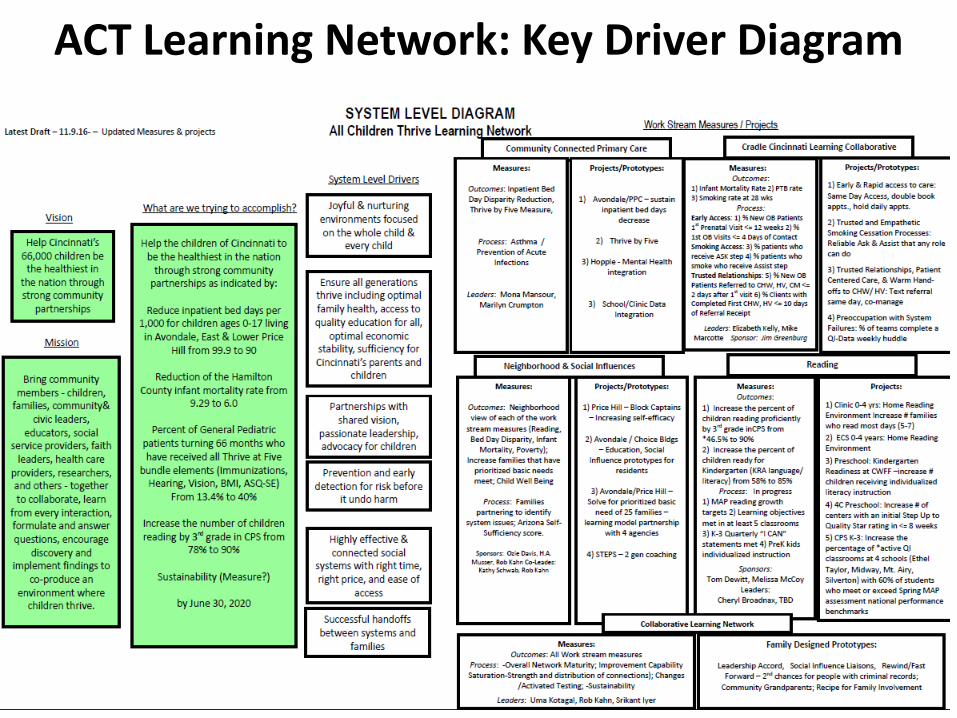
ACT Learning Network: Key Driver Diagram

All Children Thrive:Our Journey So Far - January 2017
OCT
2015
NOV –
MAR
2016
Vision Session
Family Centered Design
A FUTURE WHERE CINCINNATI’S
66,000 CHILDREN THRIVE!
APRIL
2016
Community QI TrainingIMPACT U
JUNE
2016
Learning Session # 1
DEC
2016
Community QI TrainingQI Bootcamp
JAN
2017
One Year of ActiveParent Partners
SEPT
2016
Community QI Training CPS & Menomonee Falls
ACT LN Cores
Family Centered Design
Community Activation
Community QI Capability Building

SP20: Changing the Outcome Together 11
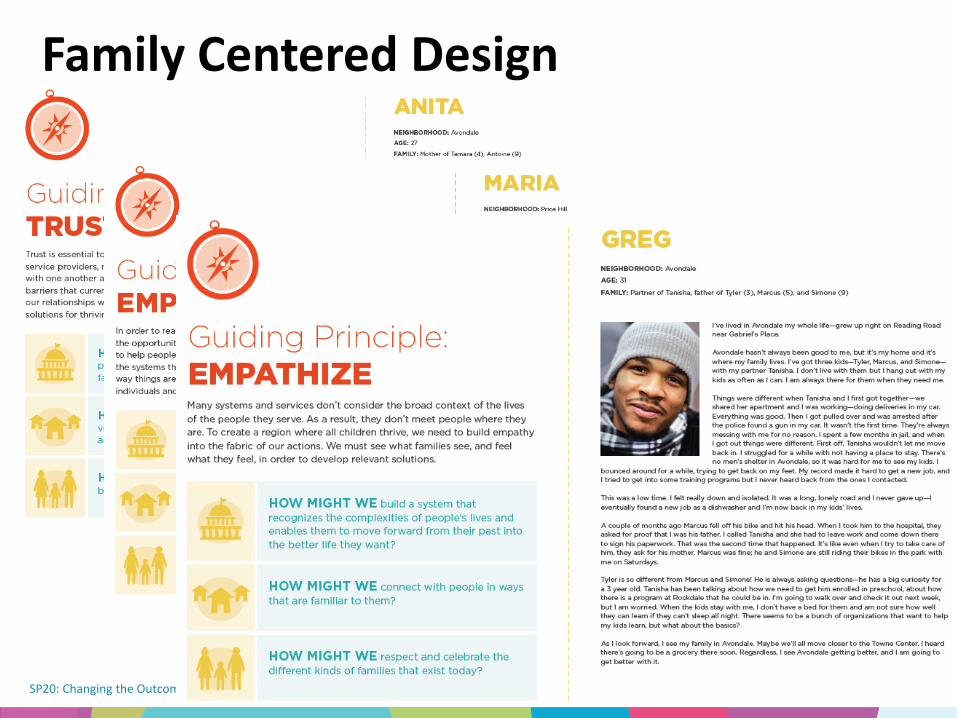
Family Centered Design
SP20: Changing the Outcome Together 12
Family Centered Design

All Children Thrive Learning Network - Community Activation – Neighborhood Level
Key Driver DiagramRevision Date:
12/14/16
Goals that work for everybody
Drivers
Leaders and future leaders from the community
CHILD HEALTH OUTCOMES
Help Cincinnati’s 66,000 children be the healthiest in the nation through strong community partnerships
GLOBAL AIM
• Decrease Inpatient bed days
• Reduce Infant Mortality
• Increase Thrive by 5• Increase Third Grade
Reading• Address Social
Determinants
All involved celebrate children and success
Mutual respect, trust, communication and relationships
SMART AIM
Increase the number of community members**
actively participating in, contributing to and owning to*** improve the health of children in their community of Avondale and Price Hill by 50% at 3 levels:
•Participation from 2980 to
4470•Contribution from 150 to 225•Ownership from 76 to 114
By June 2017. Understanding what is good and the needs of the community
Parents and residents improve and advocate for all children to be healthy
**parents/family, provider/organizational leaders, neighborhood/community
***active participation includes measuring participation, contribution, and ownership (does not include awareness)
Everyone feels included and like they belong
In Progress
Community protects, provides and values the potential that every child has to be thriving, healthy and successful*
*Parenting, Housing,
Safety, ECT.
VISION
Interventions
1
2
3
4
5
6
7
Recipe for family activation & inclusion
Family members attending IPBD/Community meetings
Prototype Development
Community Handwashing Campaign
Community Leadership Training
Avondale and Price Hill Community and Partnership Committee’s
Integrating Into Work Streams
Capacity Building Grants
Community Activation - Key Driver Diagram

Community activationLevel of
Activation
Definition Examples Baseline
FY16
FY17 Target
(50%
Increase)
Awarenesspassive receipt of
information
number of people who
receive flyers, brochures or
handouts; number
connected via social media,
email, website
Participationuse of existing
tools or events
number of people attending
community outreach events,
learning sessions, network
meetings, courses, number
of people adopting changes
2980 4470
Contribution
improving existing
tools, knowledge
or resources
presenting at events,
number of people involved
in quality improvement at
sites, number of people
posting to sites, number of
people serving on
committees
150 225
Ownership
creating new
resources / tools
or leading
initiatives
testing new ideas, co-
leaders of work streams,
parent leaders of activation
projects
76 114

PDSA RAMP
Family Invitation Process
Community activation

SMART AIMS
INTERVENTIONS
Meet prioritized basic needs*
for a total of 25 families from
Price Hill (10 ) and Avondale
(15) by June 2017.
Guiding Principle: These
families’ children are on a
trajectory to thrive.
Key
Gray shaded box = completed intervention
Green shaded box = what we’re working on right now
LOR # = Level of Reliability Number, e.g., LOR 1
ACT LN Social Influences and Self SufficiencyKey Driver Diagram (KDD)
Project Leader(s): Rob Kahn, Kathy Schwab QIC: Shari Wooton
Revision Date:
1/19/2017
Help Cincinnati’s 66,000
children be the healthiest in the
nation through strong
community partnerships
GLOBAL AIM
Invitation to families & build
relationshipsTrusted relationships
Agencies willing to partner, break
rules, & change systems
“Whatever It Takes” service
mentality
Sustainable Solutions
PRIMARY DRIVERS
Family identifying needs both
urgent and sustainable (long term)
Family & trusted partner prioritize
needs
Family & trusted partner identify
agency partnerships
Agency/Family huddle to solve for
families
Families learn contingency planning
skills
Identify common system issues
become new interventions
Families with advocacy skills
Identify and address a common
system issue by June 2017.
Well-being of children measure
YOUR IDEA HERE!!!!
Cincinnati: ~66,000 children in
Cincinnati
Project: ~50 children
POPULATION
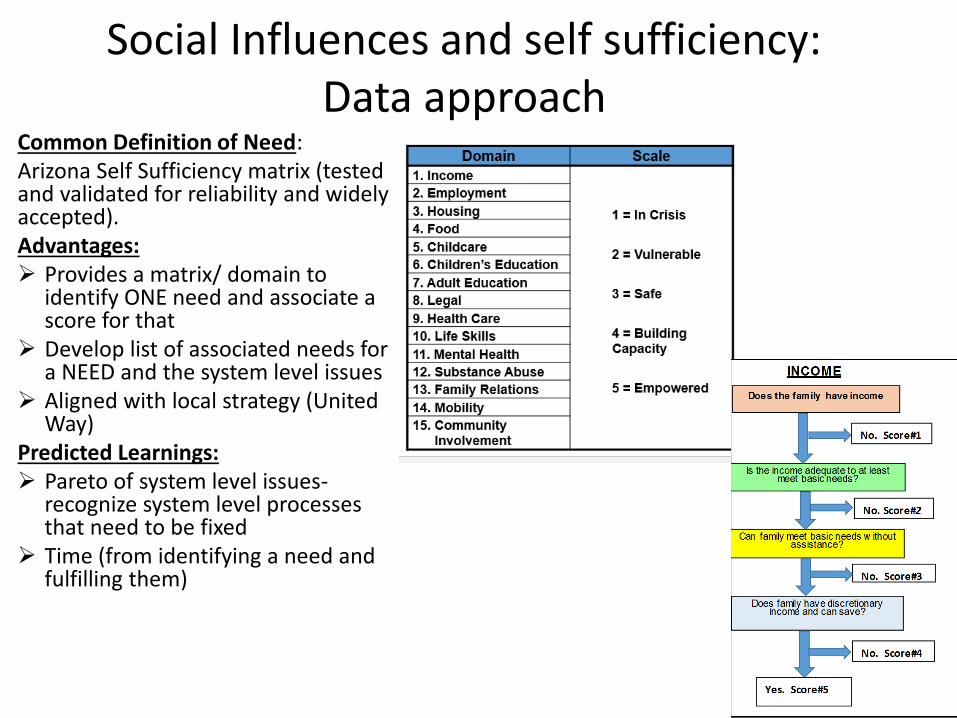
Common Definition of Need: Arizona Self Sufficiency matrix (tested and validated for reliability and widely accepted). Advantages: ➢ Provides a matrix/ domain to
identify ONE need and associate a score for that
➢ Develop list of associated needs for a NEED and the system level issues
➢ Aligned with local strategy (United Way)
Predicted Learnings: ➢ Pareto of system level issues-
recognize system level processes that need to be fixed
➢ Time (from identifying a need and fulfilling them)
Social Influences and self sufficiency: Data approach

Jobs and Family Services (JSF)
Legal Aid
YWCA
Free Store Food Bank
Cincinnati Works
Urban League
Others – TBD based on learnings
The Community Builders (TCB)
Healthy Homes (Block
by Block)
United Way -STEPS
Pediatric Primary
Care Center (PPC)
Social Influences and Self Sufficiency
Learning Structure
• Four frontline teams aim to
address individual families’
needs and also surface
key systems issues
• Systems issues, such as
insufficient bus routes,
burdensome processes,
accessing benefits will
then be shared with critical
local leadership to identify
areas for systems change
School system

Getting deposits, vouchers, safety outside, dishonest landlords
Social influences and self sufficiency

Legal Aid Housing Cases Mapped Against Neighborhood Asthma Hotspots: Shared Purpose
Avondale

FRONT LINE IMPROVERS/TEAMS
(RCIC, BootCamp, Menominee Falls, On-Line Modules)
Social Workers, Teachers, Nurses, Residents
MESO/MICRO System Leaders*
(Impact U)
Program Leaders, Reading Specialists,
Clinicians, Lawyers
MACRO SYSTEM
LEADERS
Executive Directors,
Principals, Medical
Directors,
Foundation Leaders,
Political Leaders
SYSTEMS
LEADERSHIP*
(Boards on Board
Training)
All Children Thrive
Network
Advanced
Improvement
Methods*
(AIM)
AIM
Faculty and
Researchers
COMMUNITY
Intermediate
Improvement
* All multi-sector
Community QI Capability Building
Held 1st Sessions, Planning 2nd

Neighborhood Government
Infrastructure
Obstetrics Clinics
Community Health
Home Visiting
Primary Care Clinics
Residents
Community Leaders
Social Service Organizations
Childcare Providers
Early Childhood Centers
Schools (K-3) 1
1
2
2
2
2
0
3
5 25
6
4
13
3
8
1
5
4
300
30
20
20
5
40
23
25
300k
60
39
25
20**
49
126
483
174
58
Community Capability Scale Plan
Scale - Children (0-9)39,203
2016 2017
2020
Scale Cincinnati
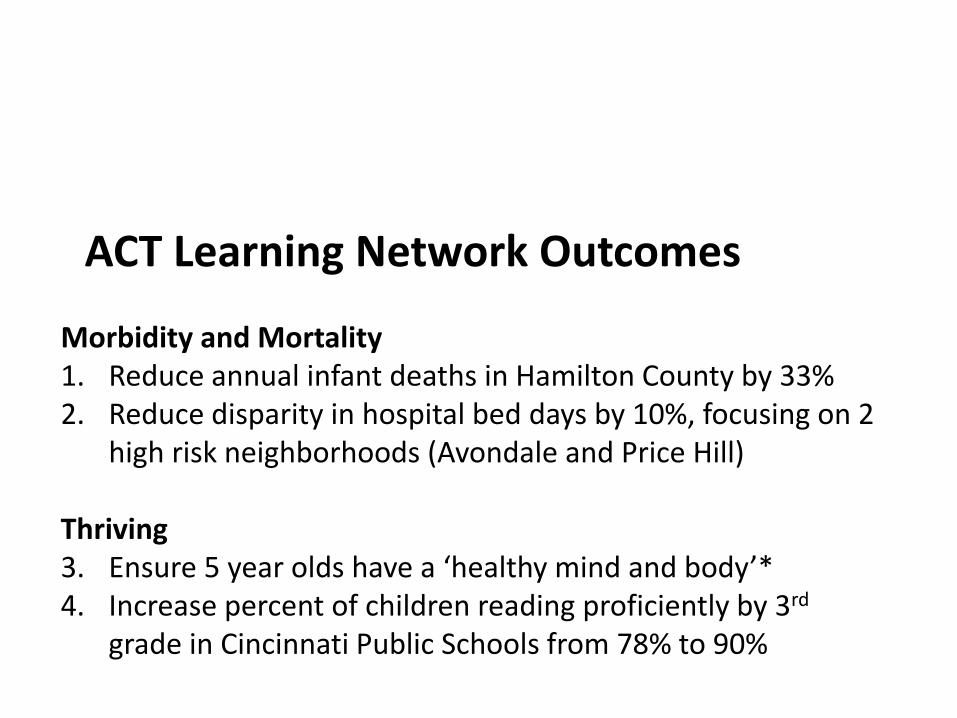
ACT Learning Network Outcomes
Morbidity and Mortality1. Reduce annual infant deaths in Hamilton County by 33%2. Reduce disparity in hospital bed days by 10%, focusing on 2
high risk neighborhoods (Avondale and Price Hill)
Thriving3. Ensure 5 year olds have a ‘healthy mind and body’*4. Increase percent of children reading proficiently by 3rd
grade in Cincinnati Public Schools from 78% to 90%

1. Reduce annual infant deaths in County by 33% to 5.98 death per 1000 live births
Cradle Cincinnati


Infant Mortality Learning Collaborative Measures
Measure Category
Infant Mortality Learning Collaborative Measures to Improve
(28 OB and CHW/HV teams)
OB Teams
Community Teams
Early Access Measures
% New OB Patients (non-transfer) First Prenatal Visit <= 12 weeks X
% First OB Visits <= 4 Days of Initial ContactX
Smoking Measures
% New OB Patients Received “ASK” Step at First OB Visit X
% Patients Received “ASSIST” Step at First OB VisitX
% Patients Smoking at 28 Week Visit (CRITICAL OUTCOME MEASURE) X
Trusted Relationships
Measures
% New OB Patients Referred to CHW, HV, CM <= 2 days After First OB Visit X
% Clients with Completed First CHW, HV, or CM visit <= 10 days of Receipt of Referral X

0
1
2
3
4
5
6
7
8
9
10
200
9-Q
1 (
n=
40)
2009-Q
2 (
n=
58)
200
9-Q
3 (
n=
58)
200
9-Q
4 (
n=
63)
201
0-Q
1 (
n=
37)
201
0-Q
2 (
n=
39)
2010-Q
3 (
n=
51)
201
0-Q
4 (
n=
45)
201
1-Q
1 (
n=
52)
201
1-Q
2 (
n=
54)
201
1-Q
3 (
n=
49)
201
1-Q
4 (
n=
53)
201
2-Q
1 (
n=
50)
201
2-Q
2 (
n=
46)
201
2-Q
3 (
n=
45)
201
2-Q
4 (
n=
48)
201
3-Q
1 (
n=
49)
201
3-Q
2 (
n=
55)
201
3-Q
3 (
n=
51)
201
3-Q
4 (
n=
62)
201
4-Q
1 (
n=
43)
201
4-Q
2 (
n=
45)
201
4-Q
3 (
n=
56)
201
4-Q
4 (
n=
58)
2015-Q
1 (
n=
55)
201
5-Q
2 (
n=
53)
201
5-Q
3 (
n=
42)
201
5-Q
4 (
n=
48)
201
6-Q
1 (
n=
51)
201
6-Q
2 (
n=
48)
201
6-Q
3 (
n=
55)
201
6-Q
4 (
n=
37)
Pe
rce
nt
bo
rn <
28
we
ek
sResident singleton births < 28 weeks gestation
ZIP Code 45229 (Avondale-North Avondale), by quarter, 2009-2016(Obstetric estimate of gestation )
Quarterly Percent Baseline Average Percent Control Limits
Source: Hamilton County Public Health. Updated by J. Besl 1/27/17
StartStrong Initiative7/2013 - StartStrong launch in Avondale.
12/2013 - Active QI testing at UCMC & GSH
1/2014 - StartStrong mom's group.
3/2014 - ECS home visits
6/2014 - CHW begins. Community Feast
Lau
nch

0
1
2
3
4
5
6
7
8
9
10
200
9-Q
1 (
n=
63
)
200
9-Q
2 (
n=
57
)
200
9-Q
3 (
n=
78
)
200
9-Q
4 (
n=
71
)
201
0-Q
1 (
n=
65
)
201
0-Q
2 (
n=
55
)
201
0-Q
3 (
n=
51
)
201
0-Q
4 (
n=
61
)
201
1-Q
1 (
n=
61
)
201
1-Q
2 (
n=
64
)
201
1-Q
3 (
n=
72
)
201
1-Q
4 (
n=
69
)
201
2-Q
1 (
n=
50
)
201
2-Q
2 (
n=
54
)
201
2-Q
3 (
n=
68
)
201
2-Q
4 (
n=
70
)
201
3-Q
1 (
n=
67
)
201
3-Q
2 (
n=
49
)
201
3-Q
3 (
n=
77
)
201
3-Q
4 (
n=
52
)
201
4-Q
1 (
n=
58
)
201
4-Q
2 (
n=
54
)
201
4-Q
3 (
n=
62
)
201
4-Q
4 (
n=
59
)
201
5-Q
1 (
n=
47
)
201
5-Q
2 (
n=
59
)
201
5-Q
3 (
n=
48
)
201
5-Q
4 (
n=
61
)
201
6-Q
1 (
n=
59
)
201
6-Q
2 (
n=
49
)
201
6-Q
3 (
n=
58
)
201
6-Q
4 (
n=
60
)
Pe
rce
nt
bo
rn <
28
we
ek
sResident singleton births <28 weeks gestation
ZIP Code 45206 & 45207 (Walnut Hills-Evanston), by quarter, 2009-2016(Obstetric estimate of gestation <28 weeks)
Comparison Neighborhoods
Quarterly Percent Baseline Average Percent Control Limits
Source: Hamilton County Public Health. Updated by J. Besl 1/27/17

0
20
40
60
80
100
120
July
n=1
54
7
Au
g n
=15
55
Sep
t n
=1
55
4
Oct
n=1
56
9
No
v n
=1
54
2
De
c n
=15
29
Jan
n=
Feb
n=
Mar
n=
Ap
r n
=
May
n=
Jun
n=
Be
d D
ays
pe
r 1
00
0 P
atie
nts
FY 17 Month and Population
CCHMC Inpatient Days-Excludes Mental HealthYTD Inpatient Days per 1000 Population
General Pediatric Patients Age 0 up to 18 Residing in AvondaleExcludes Patients with LOS > 14 Days
Green Threshold Yellow Threshold YTD Bed Days per 1000 Target Based on Sustaining 10% Reduction from FY 15
Month Bed Days Patients in a Bed
July 4.8 4
Aug 5.2 3
Sept 16.1 6
Oct 12.7 8
Nov 10.4 7
Dec 10.3 6
2. Reduce Inpatient Bed Days 10% in 2 N’borhoods
Expected annual inpatient bed-days
FY 17 inpatient bed-days goal

0
10
20
30
40
50
60
70
80
90
July
Au
g
Sep
t
Oct
No
v
De
c
Jan
Feb
Mar
Ap
r
May Jun
Be
d D
ays
pe
r 1
00
0 P
atie
nts
FY 17 Month
CCHMC Inpatient Days-Excludes Mental Health and LOS >14 DaysYTD Inpatient Days per 1000 Population
Patients Age 0 up to 18 Residing in Walnut Hills, Winton Hills, OTR, and Evanston
Green Threshold Yellow Threshold YTD Bed Days per 1000 Target Based on 11% Reduction from FY16 Baseline
Month Bed Days Patients in a Bed
201607 50.1 24
201608 30.3 23
201609 48.6 25
201610 73.6 36
201611 50.2 25
201612 47.0 28
Comparison Neighborhoods
#ACTNOWCINCY
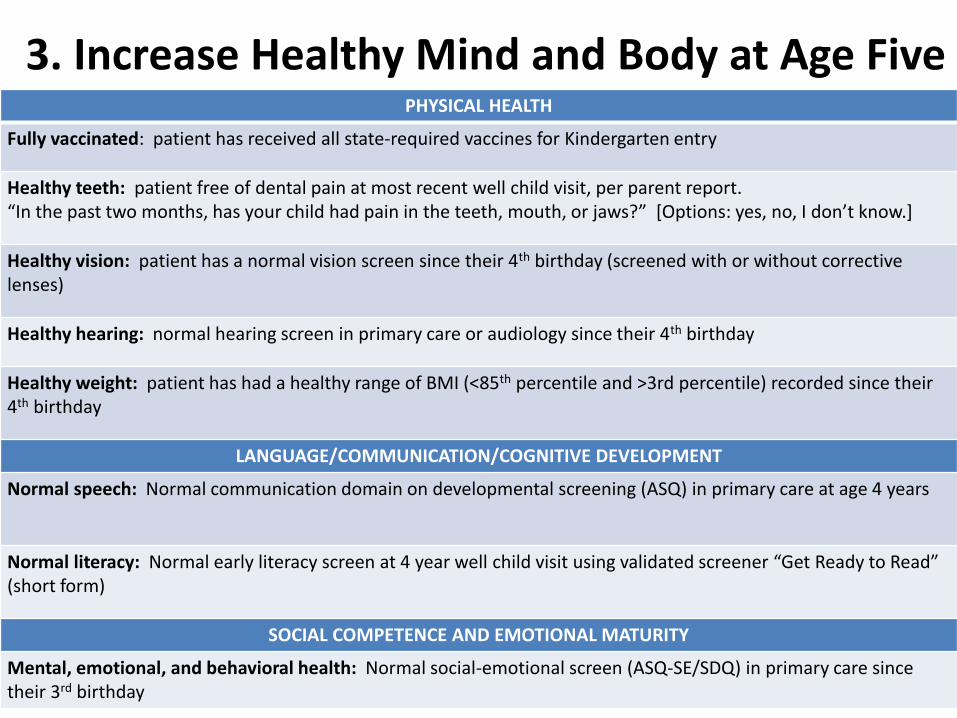
PHYSICAL HEALTH
Fully vaccinated: patient has received all state-required vaccines for Kindergarten entry
Healthy teeth: patient free of dental pain at most recent well child visit, per parent report. “In the past two months, has your child had pain in the teeth, mouth, or jaws?” [Options: yes, no, I don’t know.]
Healthy vision: patient has a normal vision screen since their 4th birthday (screened with or without corrective lenses)
Healthy hearing: normal hearing screen in primary care or audiology since their 4th birthday
Healthy weight: patient has had a healthy range of BMI (<85th percentile and >3rd percentile) recorded since their 4th birthday
LANGUAGE/COMMUNICATION/COGNITIVE DEVELOPMENT
Normal speech: Normal communication domain on developmental screening (ASQ) in primary care at age 4 years
Normal literacy: Normal early literacy screen at 4 year well child visit using validated screener “Get Ready to Read” (short form)
SOCIAL COMPETENCE AND EMOTIONAL MATURITY
Mental, emotional, and behavioral health: Normal social-emotional screen (ASQ-SE/SDQ) in primary care since their 3rd birthday
3. Increase Healthy Mind and Body at Age Five
0%
10%
20%
30%
40%
50%
60%
70%
80%
90%
100%1
2/2
01
4 (
n=1
85
)
1/2
01
5 (
n=1
90
)
2/2
01
5 (
n=1
97
)
3/2
01
5 (
n=1
87
)
4/2
01
5 (
n=1
95
)
5/2
01
5 (
n=2
30
)
6/2
01
5 (
n=2
31
)
7/2
01
5 (
n=1
83
)
8/2
01
5 (
n=2
04
)
9/2
01
5 (
n=2
15
)
10
/20
15
(n
=19
7)
11
/20
15
(n
=18
7)
12
/20
15
(n
=17
1)
1/2
01
6 (
n=1
96
)
2/2
01
6 (
n=2
43
)
3/2
01
6 (
n=2
30
)
4/2
01
6 (
n=2
03
)
5/2
01
6 (
n=2
17
)
6/2
01
6 (
n=2
44
)
7/2
01
6 (
n=2
25
)
8/2
01
6 (
n=1
79
)
9/2
01
6 (
n=2
19
)
10
/20
16
(n
=22
8)
11
/20
16
(n
=21
1)
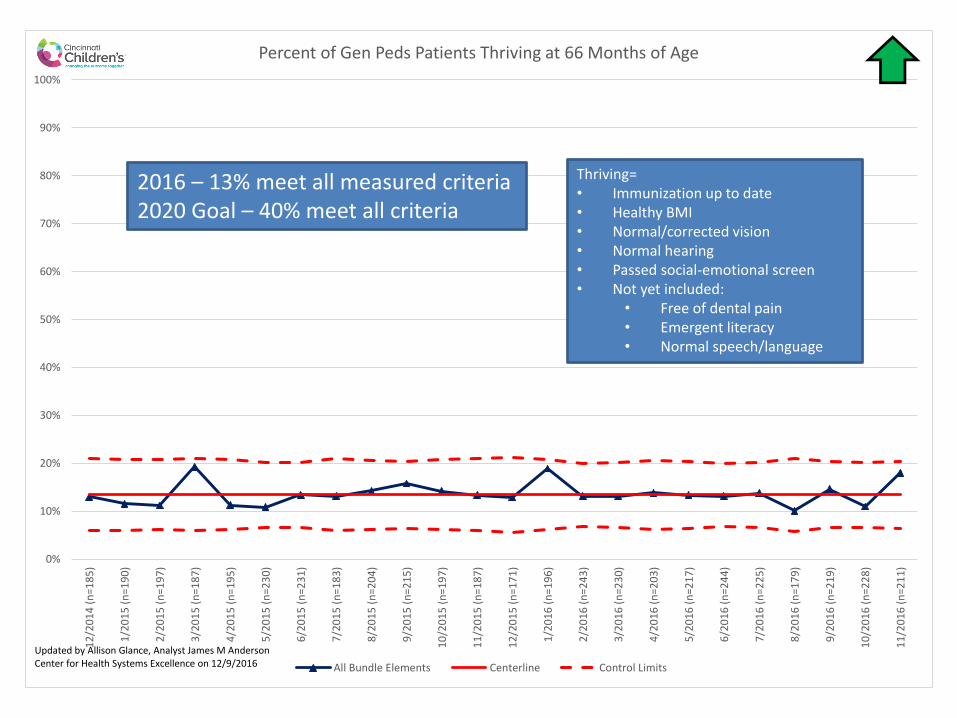
Percent of Gen Peds Patients Thriving at 66 Months of Age
All Bundle Elements Centerline Control Limits
Updated by Allison Glance, Analyst James M Anderson Center for Health Systems Excellence on 12/9/2016
Thriving=• Immunization up to date• Healthy BMI• Normal/corrected vision• Normal hearing• Passed social-emotional screen• Not yet included:
• Free of dental pain• Emergent literacy• Normal speech/language
2016 – 13% meet all measured criteria2020 Goal – 40% meet all criteria

74%
0
10
20
30
40
50
60
70
80
90
100
200
5-2
00
6 (
n=
233
4)
200
6-2
00
7 (
n=
232
9)
200
7-2
00
8 (
n=
231
4)
200
8-2
00
9 (
n=
227
2)
200
9-2
01
0 (
n=
223
1)
201
0-2
01
1 (
n=
225
4)
201
1-2
01
2 (
n=
218
7)
201
2-2
01
3 (
n=
220
7)
201
3-2
01
4 (
n=
234
7)
201
4-2
01
5 (
n=
262
4)
Perc
en
t
Reading 3rd Grade % at or above by school year Average Proportion of Defects Control Limits
4. Increase percent of children reading proficiently by 3rd grade in Cincinnati Public Schools from 78% to 90%
Source: Ohio Department of Education

Increase percent of children reading proficiently by 3rd
grade in Cincinnati Public Schools from 78% to 90%
Increase percent of children reading proficiently by 3rd
grade in Cincinnati Public Schools from 78% to 90%

Cincinnati Preschool Mississippi Map Estimated # of 3 & 4 Year Olds = 9,150
Center-based
Providers
174 Programs/7,215
Slots
ODJFS
Licensed
127 / 5,059
slots
CPS + Head
Start
47 / 2,156
slots
Not
Rated
95 /
3,217
1 – 2
Stars
17 /
727
3 – 5
Stars
15 /
1,115
1 Star
10 /
464
2
Stars
7 /
263
3
Stars
3 /
240
4
Stars
3 /
325
5
Stars
9 /
550
CPS
CAA
Head
Start
Population based on ACS 1-Year 2014 Estimates
Ratings and Capacity from November 2015 – 4C Database & Center Surveys
*
*
Family Child Care
483 Providers
Child Care Providers
in the CPS District
918 Programs
Not
Rated
459
1 – 2
Stars
23
3 – 5
Stars
1
1 Star
14
2
Stars
9
5
Stars
1
*
4C Two QI Boot Camp Teams:One Center identified in each of
these buckets to get to 1 Star

Infant
Mortality
3rd Grade
ReadingThriving at 5
Bed Day
Disparity
Social Influences in Neighborhood
Child Poverty Collaborative
Infant MortalityCommunity
Primary Care3rd Grade Reading
All Children Thrive and Mayor’s Child Poverty Collaborative
Outcomes
Workgroups
All C
hild
ren
Thrive
LN

Vision: No one in our community lives in poverty.
Purpose:
In collaboration with families and community partners, the
CPC seeks to ensure that people currently living in
poverty move toward achieving and maintaining self-
sufficiency. Our goal is to move 5,000 families and 10,000
children out of poverty in 5 years.
We will lead, partner and support system changes to
reduce poverty and improve children’s lives.
Called for by Mayor John Cranley
Cincinnati Child Poverty Collaborative: Vision + Purpose

#6. Cincinnati
39%children in
poverty
39% of children in
Cincinnati live in families
below 100% FPL. For a
family of 3, that is with
income of $19,078.
This is better than 2014 when that number was 44%.
Cincinnati ranks #6 in
child poverty
Poverty Rate for Children

SYSTEM OF POVERTY

CPC Commitments
1. Catalyze an effort called “One-To-One” which will partner families and coaches to build the capacity for individuals to overcome barriers getting in their way.
2. Convene an Employer Roundtable of Human Resource Professionals and other executives to share ideas and best practices for how companies can improve employment opportunities for entry-level employees.
3. Shine a light on and mobilize to change legislative policies and practices to empower more people to move from poverty to self-sufficiency.
4. Serve as an important convener in the community and will lead, partner, and/or support advocacy items
5. Support a New Direction for the United Way whose primary focus is expanding opportunity for families in poverty.