mk012 modelling purchase intention of …eprints.utar.edu.my/447/1/mk-2011-0906890.pdfimage...
TRANSCRIPT

Purchase Intention, Automobile, SEM
MK012
MODELLING PURCHASE INTENTION OF
TOYOTA AUTOMOBILE USING SEM TECHNIQUE
BY
CHIN YUK HOONG KHOO KIM JING LIEW ZHAO YAO
SHIM CHE WE
A research project submitted in partial fulfillment of the requirement for the degree of
BACHELOR OF MARKETING (HONS)
UNIVERSITI TUNKU ABDUL RAHMAN
FACULTY OF BUSINESS AND FINANCE
DEPARTMENT OF MARKETING
AUGUST 2011

Purchase Intention, Automobile, SEM
ii
Copyright © 2011
ALL RIGHTS RESERVED. No part of this paper may be reproduced, stored in a retrieval system, or transmitted in any form or by any means, graphic, electronic, mechanical, photocopying, recording, scanning, or otherwise, without the prior consent of the authors.

Purchase Intention, Automobile, SEM
iii
DECLARATION
We hereby declare that: (1) This undergraduate research project is the end result of our own work and that
due acknowledgement has been given in the references to ALL sources of information be they printed, electronic, or personal.
(2) No portion of this research project has been submitted in support of any
application for any other degree or qualification of this or any other university, or other institutes of learning.
(3) Equal contribution has been made by each group member in completing the
research project.
(4) The word count of this research report is 11583 . Name of Student: Student ID: Signature: 1. CHIN YUK HOONG 09ABB06890
3. LIEW ZHAO YAO 10ABB00382 ____________
Date: 26th August 2011
2. KHOO KIM JING 09ABB07842 ____________
4. SHIM CHE WE 09ABB07843 ____________

Purchase Intention, Automobile, SEM
iv
ACKNOWLEDGEMENT
We hereby, students of Faculty of Business and Finance (FBF) would like to
acknowledge the contribution of a number of people, who had brought enormous
caring and commitment by helping us throughout the duration of time until the
completion of this research study. This research study would not success without their
guidance, assistance and also cooperation of our group members.
First and foremost, we are deeply thankful to our research project's supervisor,
Mr Wong Lai Soon for helping and assisting us greatly throughout the way in
accomplishing this research study. We wish to express our truthful appreciation to
him for spending his valuable time, efforts and patience throughout the process. He
has given us his valuable point of view, opinions and even sharing of experiences and
knowledge along the way of completing the research study. Then, we would like to
show our appreciation to UniversitiTunku Abdul Rahman (UTAR), for giving us an
opportunity of doing this research study.
Thirdly, we would like to take this opportunity to express our appreciation to
all of the respondents who were willing to spare their time and efforts by participating
in our survey. Meanwhile, they also have given us some valuable opinions and
knowledge in improving our research study. Their assistance and supports are
important to the success of this research study.
Last but not least, we would also like to thank all of our group members in
contributing their ideas, time and effort, being co-operative, and worked hard to
accomplish this Final Year Research Project.
Thank you very much.

Purchase Intention, Automobile, SEM
v
DEDICATION
We would like to dedicate this study mainly to our supervisor, Mr. Wong Lai
Soon, who provides guidance, full motivation, assistance, kind understanding and
useful experience to us in completing this research project. We really appreciate his
hard work.
Moreover, we would like to dedicate this dissertation to our parents, friends,
classmates as well as course mates for their valuable supports and encouragements.
Thanks for their understanding and patience which has helped us a lot throughout the
process of doing this research project.
Last but not least, we would like to dedicate this to all of the respondents who
sparing their precious time and efforts to answer all of the questions in our
questionnaires. Their cooperation has led us to the success of this project.
Thank you.

Purchase Intention, Automobile, SEM
vi
TABLE OF CONTENTS
Page
Copyright Page......................................................................................................... ii
Declaration ............................................................................................................. iii
Acknowledgement .................................................................................................. iv
Dedication ................................................................................................................ v
Table of Content ................................................................................................ vi-ix
List of Tables ........................................................................................................... x
List of Figures ......................................................................................................... xi
List of Abbreviations ............................................................................................. xii
List of Appendices ............................................................................................... xiii
Preface................................................................................................................... xiv
Abstract .................................................................................................................. xv
CHAPTER 1 RESEARCH OVERVIEW ......................................................... 1
1.0 Introduction ................................................................................1
1.1 Research Background .................................................................1
1.2 Problem Statement .....................................................................2
1.3 Research Objective .....................................................................3
1.3.1 General Objective ......................................................... 3
1.3.2 Specific Objective ......................................................... 4
1.4 Research Question ......................................................................4
1.5 Significant of the Study ..............................................................4
1.6 Chapter Layout ...........................................................................5
Purchase Intention, Automobile, SEM
vii
1.7 Conclusion ..................................................................................6
CHAPTER 2 LITERATURE REVIEW ........................................................... 8
2.0 Introduction ................................................................................8
2.1 Review of the Literature .............................................................8
2.1.1 Perceived Service Quality ............................................. 8
2.1.2 Perceived Product Quality .......................................... 10
2.1.3 Perceived Price Fairness ............................................. 12
2.1.4 Trust ............................................................................ 14
2.1.5 Customer Satisfaction ................................................. 15
2.1.6 Purchase Intention ....................................................... 17
2.2 Review of Relevant Theoretical Model ....................................19
2.3 Hypothesis Development .........................................................23
2.4 Conclusion ................................................................................24
CHAPTER 3 METHODOLOGY ................................................................... 25
3.0 Introduction ..............................................................................25
3.1 Research Design .......................................................................25
3.2 Data Collection Methods ..........................................................26
3.2.1 Primary Data ............................................................... 27
3.2.2 Secondary Data ........................................................... 27
3.3 Sampling Design ......................................................................27
3.3.1 Target Population ........................................................ 27
3.3.2 Sampling Frame and Sampling Location .................... 28
3.3.3 Sampling Elements ..................................................... 28
3.3.4 Sampling Technique ................................................... 29
3.3.5 Sample Size ................................................................. 29

Purchase Intention, Automobile, SEM
viii
3.4 Research Instrument .................................................................29
3.4.1 Questionnaire Design .................................................. 30
3.4.2 Pilot Test ..................................................................... 30
3.5 Constructs Measurement………………………………… ......31
3.6 Data Processing ........................................................................33
3.6.1 Questionnaire Checking .............................................. 33
3.6.2 Data Editing ................................................................ 34
3.6.3 Data Coding ................................................................ 34
3.6.4 Data Cleaning.............................................................. 34
3.7 Data Analysis ...........................................................................35
3.7.1 Descriptive Analysis ................................................... 35
3.7.2 Scale Measurement (Reliability Test) ......................... 35
3.7.3 Data Analysis Tool SEM ............................................ 36
3.8 Conclusion ............................................................................... 36
CHAPTER 4 DATA ANALYSIS .................................................................. 37
4.0 Introduction ..............................................................................37
4.1 Descriptive Analysis .................................................................37
4.2 Scale Measurement ..................................................................39
4.3 Inferential Analysis .................................................................41
4.3.1 Structural Equation Modelling ...................................... 41
4.3.2 Hypothesis Testing........................................................ 44
4.4 Conclusion ................................................................................51
CHAPTER 5 DISCUSSION, CONCLUSION AND IMPLICATION .......... 52
5.0 Introduction ..............................................................................52
Purchase Intention, Automobile, SEM
ix
5.1 Summary of the important findings of this study and discussion
on the findings ...........................................................................53
5.2 Implication of the Study ...........................................................55
5.2.1 Managerial Implications .............................................. 56
5.3 Directions for Future Research and Limitations of the Study ...57
5.4 Conclusion .................................................................................57
References .............................................................................................................. 58
Appendices ............................................................................................................. 70

Purchase Intention, Automobile, SEM
x
LIST OF TABLES
Page
Table 3.1: Origins of Constructs…………………………………………………29 Table 3.2: Example of Modified Operational Definitions of Constructs………..29
Table 4.1: Demographic Characteristics of Survey Respondents………………..36 Table 4.2: Factor Loadings, Mean, Standard Deviation and Reliability
of the Study…………………………………………………………..37 Table 4.3: Measurements of Fit Indexes…………………………………………40 Table 4.4: The Model Fit Statistics of the Proposed Model……………………..41 Table 4.5: Path Estimates for the Proposed Model………………………………44 Table 4.6: Standardized Total Effects, Direct Effects, and Indirect Effects…….44 Table 4.7: Summary of Standardized Path Coefficients…………………………48 Table 5.1: Summary of the Hypothesized Findings……………………………..51

Purchase Intention, Automobile, SEM
xi
LIST OF FIGURES
Page
Figure 2.1: Review of Relevant Theoretical Model I…………………………...18 Figure 2.2: Review of Relevant Theoretical Model II…………………………..19 Figure 2.3: Review of Relevant Theoretical Model III………………………….20 Figure 2.4: Proposed Conceptual Framework…………………………………...21 Figure 4.1: Results of Structural Equation Modelling Analysis
(All group)……………………………………………………….45 Figure 4.2: Results of Structural Equation Modelling Analysis
(Aware crisis group)……………………………………………..46 Figure 4.3: Results of Structural Equation Modelling Analysis
(Unaware crisis group)…………………………………………..47

Purchase Intention, Automobile, SEM
xii
LIST OF ABBREVIATIONS
AMOS Analysis of Moment Structure CFI Comparative Fit Index C.R. Critical Ratio df Degree of Freedom S.E. Standard Error S.D. Standard Deviation SEM Structural Equation Modelling SPSS Statistic Package for the Social Sciences ML Maximum Likelihood NFI Normed Fit Index RMSEA Root Mean Square Error of Approximation

Purchase Intention, Automobile, SEM
xiii
LIST OF APPENDICES Page
Appendix 3.1: Map of Mukim Tupai, Taiping, Perak (1)…………………..66 Appendix 3.2: Map of Mukim Tupai, Taiping, Perak (2)…………………..67 Appendix 3.3: Map of Mukim Tupai, Taiping, Perak (3)…………………..68 Appendix 3.4: Map of Mukim Tupai, Taiping, Perak (4)…………………..69 Appendix 3.5: Number of Households in Mukim Tupai, Taiping, Perak…..70 Appendix 3.6: Certification Letter…………………………………...……...71
Appendix 3.7: Questionnaire………………………………………………...72 Appendix 4.1: Descriptive Analysis…………………………………………75 Appendix 4.2: Inferential Analysis…………………………………………..82
Purchase Intention, Automobile, SEM
xiv
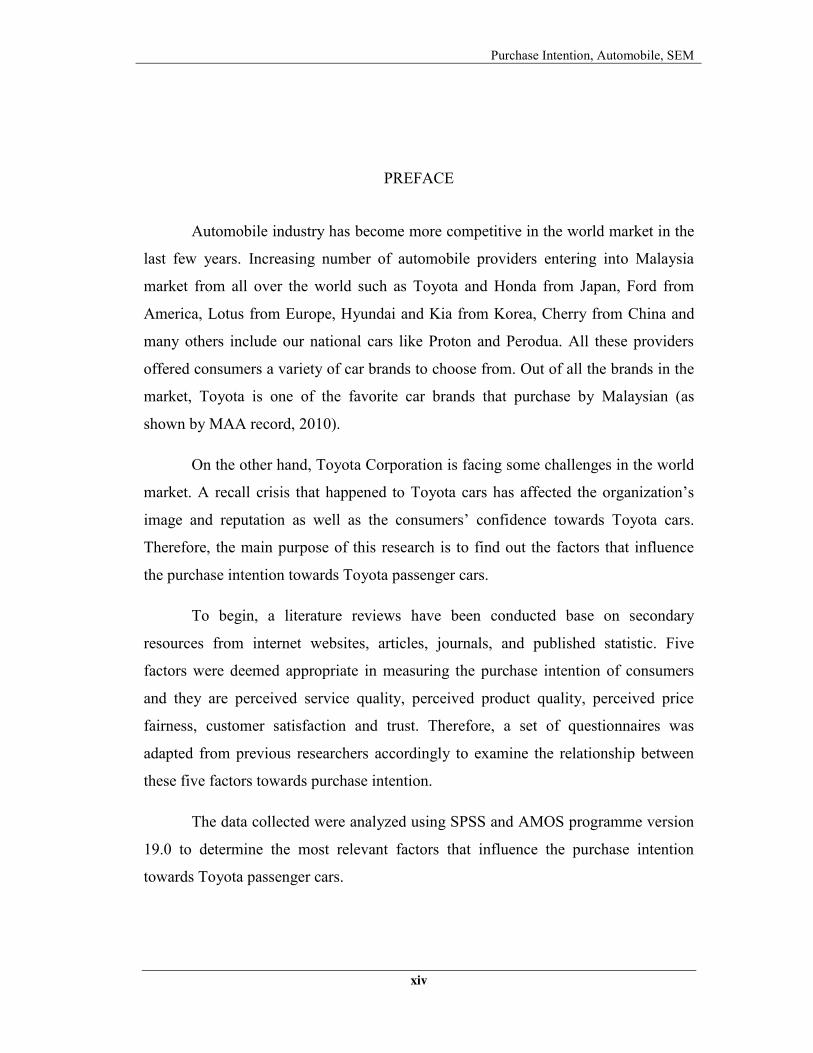
PREFACE
Automobile industry has become more competitive in the world market in the
last few years. Increasing number of automobile providers entering into Malaysia
market from all over the world such as Toyota and Honda from Japan, Ford from
America, Lotus from Europe, Hyundai and Kia from Korea, Cherry from China and
many others include our national cars like Proton and Perodua. All these providers
offered consumers a variety of car brands to choose from. Out of all the brands in the
market, Toyota is one of the favorite car brands that purchase by Malaysian (as
shown by MAA record, 2010).
On the other hand, Toyota Corporation is facing some challenges in the world
market. A recall crisis that happened to Toyota cars has affected the organization’s
image and reputation as well as the consumers’ confidence towards Toyota cars.
Therefore, the main purpose of this research is to find out the factors that influence
the purchase intention towards Toyota passenger cars.
To begin, a literature reviews have been conducted base on secondary
resources from internet websites, articles, journals, and published statistic. Five
factors were deemed appropriate in measuring the purchase intention of consumers
and they are perceived service quality, perceived product quality, perceived price
fairness, customer satisfaction and trust. Therefore, a set of questionnaires was
adapted from previous researchers accordingly to examine the relationship between
these five factors towards purchase intention.
The data collected were analyzed using SPSS and AMOS programme version
19.0 to determine the most relevant factors that influence the purchase intention
towards Toyota passenger cars.

Purchase Intention, Automobile, SEM
xv
ABSTRACT
Current automobile players are facing intense competition within the market
compared to previous time. This is because foreign and local car manufacturers are
progressively entering into Malaysia automobile market. Additionally, consumers
nowadays are striving for perfection; therefore a small issue may become a tipping
point to huge threat for a car manufacturer. This research provides new insights into
consumption factors that become antecedents of customers’ purchase intention
toward Toyota passenger car with the backlight of Toyota car recall crisis.
Through a thorough review of literatures, a conceptual framework has been
developed and factors that identified as predictors of customers’ purchase intention
are trust and customer satisfaction. Customer’s perceptions about service quality,
product quality and price fairness are the foundations to build up customer
satisfaction. Purchase intention model was then formulated using Structural Equation
Modeling (SEM). This research is very important because it not only contributes to
the knowledge in this field but also can serve as a reference material for Toyota
Corporation to rectify the problem that they are facing now.

Purchase Intention, Automobile, SEM
Page 1 of 92
CHAPTER 1: RESEARCH OVERVIEW
1.0 Introduction
The main objective of this research is to find out the factors that influence the
purchase intention towards Toyota passenger cars in Mukim Tupai, Taiping, Perak.
The result of this research could be applied by Toyota Motor Corporation to meet the
requirements of market demand.
There are a lot of competitor in the passenger car market which have advance
manufacturing facilities and technologies. To be successful, any automobile
companies have to strengthen the performance of their cars in order to remain
competitive in the automobile industry.
Automobile companies should not emphasize solely on the physical appearance of the
cars but also on the brand image of a car manufacturer, customer satisfaction, service
quality, customer perceived value and pricing of the cars.
1.1 Research Background
Toyota Industries Corporation was originally named as Toyoda Automatic Loom
Works, and was established in 1926 as a manufacturer of textile machinery. During
the 1930s, the company organized its automobile division. This division was later
separated from the main company and became Toyota Motor Corporation (TMC). In
September 1936, the company ran a public competition to design a new logo. Besides,
the automobile engine business was formed in the 1950s; and its Kyowa plant, which
produces automobile engines and assembles automobiles, began its operations in

Purchase Intention, Automobile, SEM
Page 2 of 92
1953. The newly-formed name was trademarked and the company was registered in
August 1937 as "Toyota Motor Company"(Davis, 1999; Dawson, 2004).
Toyota Motor Company received its first Japanese Quality Control Award at the start
of the 1980s and began participating in a wide variety of motorsports. In 1982,
Toyota Motor Company and Toyota Motor Sales merged to form one new company,
Toyota Motor Corporation. Toyota started to establish new brands at the end of the
1980s, with the launch of their luxury division, Lexus in 1989. Toyota also began
production of the world's best-selling hybrid car, the Prius, in 1997.
In 2001 the company changed its name to Toyota Industries Corporation (Toyota
Industries). Also, in 2003, the company established Actis Manufacturing, a
manufacturer of automotive air-conditioning compressors. In conjunction, Toyota
corporation was number one in global automobile sales for 2008 (US News, 2008).
The Toyota business philosophy (“The Toyota Way”) stresses teamwork, respect,
problem-solving, and mentoring of personnel (Liker, 2004).
1.2 Problem Statement
Over the past 30 years, Toyota Motor Corporation has not only been the envy of the
automotive industry but also been held in high regards as a symbol of manufacturing
and leadership excellence in the business world (Dyer, 1998; Iyer, Seshadri & Vasher,
2009; Spear, 2004).
Toyota‘s problem started from a fatal car crash in southern California in 28th August
2009 due to the failure of the brake, which in turn caused Lexus ES350 to hit another
car, and fell into an embankment and at last caught fire. The car involved was a 2009
Lexus ES350, and the whole family in the car was killed. After investigation, it was
revealed that the cause of the crash is due to the substandard size of floor mat that had
Purchase Intention, Automobile, SEM
Page 3 of 92
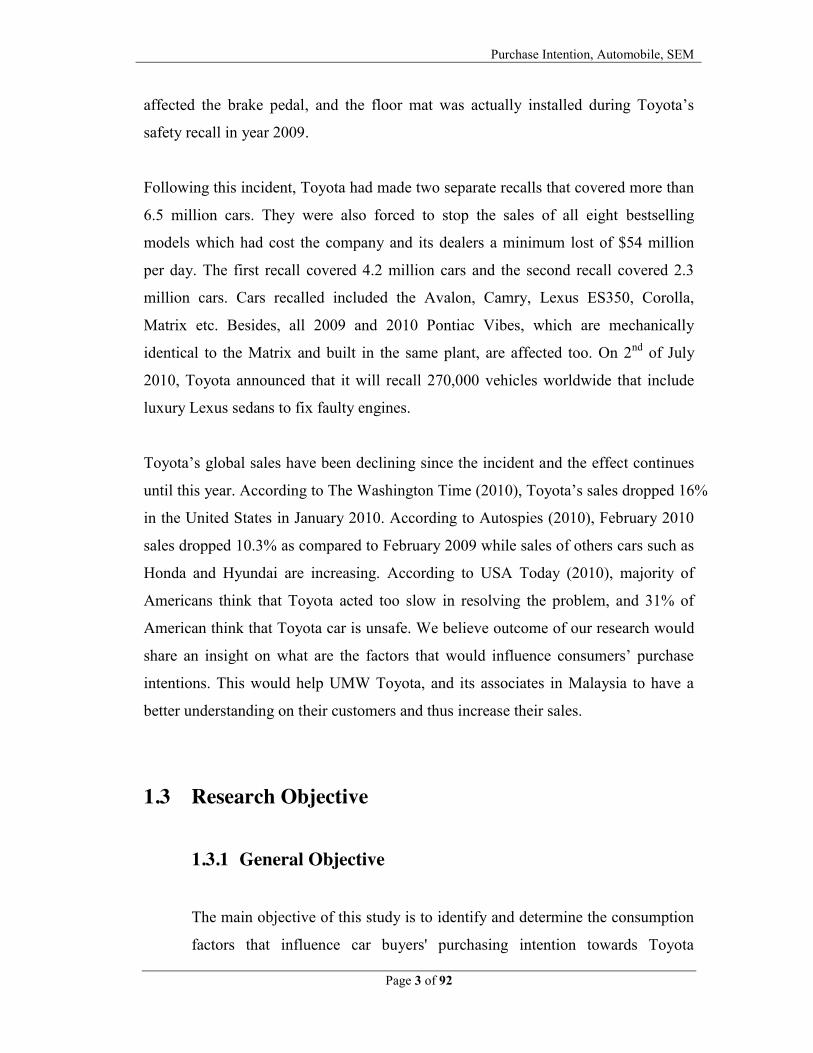
affected the brake pedal, and the floor mat was actually installed during Toyota’s
safety recall in year 2009.
Following this incident, Toyota had made two separate recalls that covered more than
6.5 million cars. They were also forced to stop the sales of all eight bestselling
models which had cost the company and its dealers a minimum lost of $54 million
per day. The first recall covered 4.2 million cars and the second recall covered 2.3
million cars. Cars recalled included the Avalon, Camry, Lexus ES350, Corolla,
Matrix etc. Besides, all 2009 and 2010 Pontiac Vibes, which are mechanically
identical to the Matrix and built in the same plant, are affected too. On 2nd of July
2010, Toyota announced that it will recall 270,000 vehicles worldwide that include
luxury Lexus sedans to fix faulty engines.
Toyota’s global sales have been declining since the incident and the effect continues
until this year. According to The Washington Time (2010), Toyota’s sales dropped 16%
in the United States in January 2010. According to Autospies (2010), February 2010
sales dropped 10.3% as compared to February 2009 while sales of others cars such as
Honda and Hyundai are increasing. According to USA Today (2010), majority of
Americans think that Toyota acted too slow in resolving the problem, and 31% of
American think that Toyota car is unsafe. We believe outcome of our research would
share an insight on what are the factors that would influence consumers’ purchase
intentions. This would help UMW Toyota, and its associates in Malaysia to have a
better understanding on their customers and thus increase their sales.
1.3 Research Objective
1.3.1 General Objective
The main objective of this study is to identify and determine the consumption
factors that influence car buyers' purchasing intention towards Toyota

Purchase Intention, Automobile, SEM
Page 4 of 92
passenger cars. It is also to model customer purchase intentions toward Toyota
passenger car in Malaysia.
1.3.2 Specific Objective
1.3.2.1 To investigate the relationship between perceived service
quality and perceive product quality.
1.3.2.2 To investigate the relationship between perceived service
quality and customer satisfaction.
1.3.2.3 To investigate the relationship between perceived product
quality and perceive price fairness. 1.3.2.4 To investigate the relationship between perceived product
quality and customer satisfaction.
1.3.2.5 To investigate the relationship between perceived price fairness
and customer satisfaction.
1.3.2.6 To investigate the relationship between customer satisfaction
and trust.
1.3.2.7 To investigate the relationship between trust and purchase
intention.
1.4 Research Question
1. Does perceived service quality influence the perceived product quality?
2. Does perceived service quality influence customer satisfaction?
3. Does perceived product quality influence perceived price fairness?
4. Does perceived product quality influence customer satisfaction?
5. Does perceived price fairness influence customer satisfaction?
6. Does customer satisfaction influence trust?
7. Does trust influence purchase intention?

Purchase Intention, Automobile, SEM
Page 5 of 92
1.5 Significant of the Study
The contribution of this study is to understand the factors that affect customer
satisfaction and trust thus increase customers’ purchase intentions toward the
automobile. The objective is to gain a thorough understanding on customers’
purchase intention in the automobile industry.
By understanding what drives customers to make a purchase, marketer can improve
and tailor their services and products to win consumer preferences, substantiate
customer base and maintaining sustainable competitive advantages.
Moreover, the result of this thesis is going to be a valuable material for students and
also professionals who wish to get involved in the automobile industry. The
information provided is to generate a conspicuous overview of the industry so that
they will be well prepared to face the challenges and obstacles in this new era of
automobile industry. These findings are definitely significant for academic and
research purposes.
1.6 Chapter Layout
The overall chapters of the research consist of 5 chapters which are:
Chapter 1: Research Overview
This chapter is the introductory which provides insight of the overall research context.
It includes research background, problem statement, research objectives, research
questions, hypotheses and significance of the study.
Chapter 2: Literature Review

Purchase Intention, Automobile, SEM
Page 6 of 92
This chapter consists of literature reviews gathered from journals and articles by other
researchers on the relevant research area. It also includes reviews of relevant
theoretical model, proposed research framework and hypotheses development.
Chapter 3: Methodology
This chapter is the overview of the research methodology. It describes how the
research has been carried out, which includes research design, data collection
methods, sampling design, operational definitions of constructs, measurement scales
and methods of data analysis.
Chapter 4: Data Analysis
This chapter touches on data analysis of the research. It gather all the collection data
and analyses it using descriptive analysis, scale measurement and inferential analysis. It also presents the results from Structural Equation Model (SEM) which are relevant
to the research questions and hypotheses.
Chapter 5: Discussions, Conclusion and Implications
This chapter presents the summary and conclusion of the whole research project. It
includes summary of statistical analyses, discussion of major findings, limitations and
recommendations for future research.
1.7 Conclusion
As a conclusion, this chapter laid out the problem that Toyota Motor Corporation
currently facing, so that we can identify the main cause of the problem. By doing so,
we can find out the solutions for the problem based on the issue being identified. It

Purchase Intention, Automobile, SEM
Page 7 of 92
also provides us an entire guideline about the whole research process on automobile
industry. Besides, the information found in this chapter serves as precedence for the
following chapters. Each of the variables will be discussed in detailed in the
following chapters.

Purchase Intention, Automobile, SEM
Page 8 of 92
CHAPTER 2: LITERATURE REVIEW
2.0 Introduction
In studying the factors that influence the buyers’ purchasing behavior toward Toyota
car in Malaysia, we found three independent variables and two mediators that might
affect car purchase via literature review. These independent variables are perceived
service quality, perceived product quality and perceive price fairness, the mediators
are trust and customer satisfaction, and the dependent variable that we have identified
is buyers’ purchase intention.
2.1 Review of the Literature
2.1.1 Perceived service quality
Service quality is defined as “the consequence of the contrast between
customer’s assumptions about a service and their perception toward the way
of the service has been delivered” (Lehtinen & Lehtinen, 1982; Lewis &
Booms, 1983; Gronroos, 1984; Parasuraman, Zeithaml & Berry, 1985, 1988;
Caruana, 2002).
In 1985, Parasuraman developed a well-known model called the SERVQUAL
model for testing and measuring service quality. The elements of the model
are: tangibles, reliability, responsiveness, competency, courtesy, assurance,
credibility, security, access and understanding. They found that there are
strong correlations among those dimensions in their research. Thus,
Parasuraman et al. (1988) reduced these 10 dimensions into more advanced

Purchase Intention, Automobile, SEM
Page 9 of 92
level called Five-Gap Model which consists of Reliability, Responsiveness,
Assurance, Empathy and Tangibles. Those five dimensions are explain below:
1. Reliability is the ability to perform the promised service dependably.
2. Responsiveness is the willingness to help the customers.
3. Assurance is the ability to inspire the customer’s confidence and trust.
4. Empathy is the caring that the companies provide to their customers.
5. Tangibles are the appearance of physical facilities, equipment and
personnel.
Research of Baker et al. (1991) find that service quality did not influence
customers’ perception of value directly rather it directly affects product
quality. Which means the higher the perceived service quality, the higher the
perceived product quality as well.
A lot of the researchers such as Parasuraman et al. (1985, 1988), state that the
higher the service quality, the higher the customer satisfaction. Bitner (1990)
also suggests that a good service quality will lead to a better satisfaction. After
service quality and perceived service are being differentiated it will increase
evaluation of service quality again. Thus, the path analysis of Bitner (1990)
comes out with the final results supporting that service quality influences
customer satisfaction and also impacts on the perceived service quality.
Moreover, Teas (1993) also states that perceived service quality is the
augmentation of the customer satisfaction.
However, from the customers’ point of view, it is hardly differentiable
between true service quality and perceived service quality. Therefore, there
are a lot of researchers measure perceived service quality only and come out
with the statements that higher perceived quality leads to a higher satisfaction
among customers. According to Cronin & Taylor’s (1992) research on the
banking, pest control, dry cleaning and fast food industries, they find that
service quality is one of the antecedents of customer satisfaction. There are

Purchase Intention, Automobile, SEM
Page 10 of 92
also same results find by others in their research area such as Anderson,
Fornell and Lehmann (1994), Athanassopoulos (2000) and others. These
studies suggest that there is positive relationship of perceived service quality
towards customer satisfaction. In conclusion, perceived service quality will be
one of the most important factors that determine customer satisfaction and
loyalty.
2.1.2 Perceived Product Quality
In this era, quality of products plays a major role in the market success and
profitability of firms. Dimension of product quality includes performance,
appearance, life/durability, and workmanship (Aaker & Jacobson, 1994). In
other words, in the marketplace, product quality plays a vital role on firm’s
competitiveness through affecting customers’ satisfaction. When a product
fulfills customer’s needs and wants, the customer will be pleased and consider
that the product is acceptable or is of high quality. On the other hand, price is
found related to perceived product quality and consumer’s product evaluations
(Rao & Monroe, 1989; Dodds, Monroe & Grewal, 1991). This phenomenon
leads to consumer perception that higher quality of products will lead to
higher price.
It is a must for a manufacturer or a supplier to consider product quality on the
list of priorities during manufacturing processes. The product quality
dimension includes product quality, packaging design, product features,
warranties, etc. (Abdul-Muhmin, 2002). Especially in business markets,
product quality and reliability is very important to the customers because
business buyers frequently select their supplier base on the basis of quality
and excellence of the products (Chumpitaz & Paparoidamis, 2004). In contrast,
if the supplier’s company fails to meet business buyer’s expectation and

Purchase Intention, Automobile, SEM
Page 11 of 92
requirements, the relationship between the two parties will dramatically
change and supplier may lose customers too.
The quality of the product has a direct impact on performance, and product
quality is one of the positioning tools of the marketers, hence, product quality
is closely linked to customer satisfaction (Kotler et al., 2005). Similarly,
Chumpitaz et al. (2004) provide strong empirical support that product quality
is an antecedent which has a positive relationship with overall customer
satisfaction and suggest that maintaining good product quality will provide
satisfaction to the customers. By providing high quality of product, it will help
managers to execute and develop better strategies in the business market.
Hence, product quality in this research is assumed as a factor which could
positively affects customer satisfaction.
Most of the previous marketing researches discussed the construction and
dimension of service quality, or its relation with customer satisfaction and
loyalty. In fact, most service industries provide both intangible and tangible
products. Nevertheless, few researchers touched upon the issue of tangible in
service industries. In Lehtinen and Lehtinen’s (1991) service quality
dimension, physical quality of service includes physical support-physical
environment and equipment, as well as physical products. The “physical
environment and equipment” was similar to the tangible dimension proposed
by Parasuraman et al. (1988). Physical product was considered but treated as
only part of the overall physical quality of service (Lehtinen et al., 1991).
After reviewing 32 studies about service industries, Cronin, Brady and Hult
(2000) suggest that tangible quality of service products should be included in
the satisfaction model in the future study. They also indicate the importance of
product quality on consumer decision making. Brucks, Zeithaml and Naylor’s
(2000) study on the perceived quality construct of consumer durable goods
finds that perceived product quality played a crucial role in affecting the

Purchase Intention, Automobile, SEM
Page 12 of 92
purchasing choices. In the satisfaction model proposed by Parasuraman,
Zeithaml and Berry (1994), product quality is equally importance in affecting
consumer satisfaction as service quality. As a result, this study shows that
product quality is positively correlated to consumer satisfaction.
2.1.3 Perceived Price Fairness
From the customer’s perspective, perceived price is described as what is given
up or sacrificed to acquire certain kinds of services or products
(Athanassopoulos, 2000; Cronin et al., 2000; Voss, Parasuraman & Grewal,
1998; Sirohi, McLaughlin & Wittink, 1998; Sweeney, Soutar, & Johnson,
1999; Zeithaml, 1988). In a customer’s mind, perceived price is more
important than monetary price that is the amount of money paid for service or
product (Zeithaml, 1988).
Perceived price fairness may be defined as a perception of the customer’s
subjective evaluation of whether the difference between a seller’s price and
the price of a comparative other party is reasonable, acceptable, or justifiable
(Bolton, Warlop & Alba, 2003; Kukar-Kinney, Xia & Monroe, 2007; Matzler,
Wurtele & Renzl, 2006; Xia, Monroe & Cox, 2004).
According to Thaler (1985), customers’ perceptions of price fairness derive
from buyers’ perceptions on the producer’s internal production costs.
However, customer usually have no knowledge about seller’s internal
production costs, therefore the price fairness may be justified by the
“normatively acceptable” price along with benefits received from the seller.
Customers will perceive a price as fair if there is no discrimination on price
and no abuse of market power in price setting (Matzler et al., 2006). Oliver
and Swan (1989a, b) find that customers’ fairness perceptions depend on a
supplier’s commitment and the quality of the goods and services relative to

Purchase Intention, Automobile, SEM
Page 13 of 92
the price paid. Finding from previous studies discover that customers are
likely to compare price they paid with others customers for the same products
and services (Bechwati, Sisodia & Sheth, 2009). Nevertheless, Beldona and
Namasivayam (2006) find that customers do not only make price comparison
with others but also take into consideration of situational circumstances.
According to Bolton et al. (2003), there are three “reference prices” that
consumers evoke when they assess price fairness, namely past prices,
competitors’ prices, and perceived costs of the provider. These researchers
propose that, when a customer recalls a reference point, his or her judgment is
guided by an evaluation of the gap between the reference price and the actual
price. This comparison forms a consumer’s perception of price fairness.
Fairness is more of a subjective than an objective judgment because it is what
consumers actually perceive regardless whether such perception is correct or
not. Thus, price fairness perceptions may not be critical until consumers
perceive a price is unfair (Xia et al., 2004).
Sinha and Batra (1999) defined perceived price unfairness as the consumer’s
subjective evaluation that they perceived themselves has been charged
premium than that called for by the costs incurred by the seller. Negative
customer reactions or emotions are likely to happen as a customer attitudinal
and behavioral outcome if customer perceived that they have unfair treatment
(Wirtz & Kimes, 2007). Consequently, the judgments of unfairness by the
customer will cause customer dissatisfaction (Oliver & Swan, 1989b). When
price differences are unfavorable to them, this will immediately lead the
customers’ reaction to result in more price consciousness (Sinha & Batra,
1999; Xia et al., 2004) and they will complain or ask for refund from seller
(Kalapurakal, Dickson, & Urbany, 1991; Xia et al., 2004), lowered purchase
intentions (Bougie et al., 2003; Campbell, 1999a, b) or will spread negative
word-of-mouth (Bougie et al., 2003) and will revenge against unfair pricing
(Kahneman, Knetsch & Thaler, 1986; Xia et al., 2004).

Purchase Intention, Automobile, SEM
Page 14 of 92
In an empirical study of automobile purchases from Herrmann, Lan, Monroe,
and Huber (2007), it was concluded that customer satisfaction is indirectly
influenced by the perceived price fairness. Several other recent literatures
indicate that perceived price fairness is positively correlated with customer
satisfaction. (Bei & Chiao, 2001; Parasuraman et al., 1994; Hanif, Hafeez &
Riaz, 2010; Herrmann et al., 2007; Huffman & Cain, 2001; Yieh, Chiao &
Chiu, 2007).
2.1.4 Trust
According to Ganesan (1994) and Kumar, Scheer, and Steenkamp (1995) in
marketing point of view, trust is defined as the “perceived credibility and
benevolence of a target of trust”. This definition of trust is link in an industrial
buying context. In purchase situation, a buying firm will face some degree of
risk that turns to a supplier or salesperson that the buyers believe is able to
perform effectively and reliably (credible) and act in the best interest of
customer (benevolence). In addition, relationships that have high level of trust
enable buyers and sellers to focus on the long-term benefits of the relationship
(Ganesan 1994). Meanwhile, trust exists between the buyers and sellers will
lower the cost of transaction and increase the competitiveness (Noordewier,
John, & Nevin, 1990).
According to Anderson, Fornell and Lehmann (1994), company reputation
does affect trust in a business-to-business context. Company image includes
stability of the firm, social contribution for society, concerns with customers,
reliability of what the firm says and does, innovative and forward looking.
Meanwhile, good company image helps to reduce the uncertainty of the
consumer and increases their purchase decision towards a product
(Hakannson, 1982).

Purchase Intention, Automobile, SEM
Page 15 of 92
Trusting parties must be exposed to some level of trust to become effective
which is the result must be uncertain and significant to the trustor (Deutsch
1962; Moorman, Zaltman, & Deshpande, 1992; Schlenker, Helm, & Tedeschi,
1973). In marketing, most researches believe that context of distribution
channels can help to build trust (e.g., Anderson & Narus, 1990; Anderson &
Weitz, 1989; Morgan & Hunt, 1994) that high degree of interdependence
creates vulnerability that usually found in channel relationships (Gundlach &
Cadotte, 1994; Kumar et al., 1995).
There are still lots of buyers that still preserve numerous sources of supply
even though there are some buying firms that trimmed down their supplier
base to run the progress of collaboration more smoothly meanwhile to
enhance the quality (Emshwiller, 1991). In an automobile industrial buying
context, risk occurs when purchase intention involves modified rebuys or new
tasks, as opposed to straight rebuys (Robinson, Faris, & Wind, 1967). In order,
to build-up current purchase intention and long-term relational commitments,
buyers will choose which suppliers or salespeople that they can trust.
In a summary, the basis of previous researches that stressed on the positive
influence of trust on purchase intentions (Garbarino & Johnson, 1999; Bart et
al., 2005; Gefen & Straub, 2003; Yoon, 2002), the above literatures show that
there is relationship between consumer trust and consumer intentions to
purchase automobile.
2.1.5 Customer Satisfaction
Oliver (1997) states that satisfaction is the “emotional response follow by a
disconfirmation experience”. Satisfaction generally valued on the basis of
customer’s pre-purchase expectations and differentiating it to the perceived
Purchase Intention, Automobile, SEM
Page 16 of 92
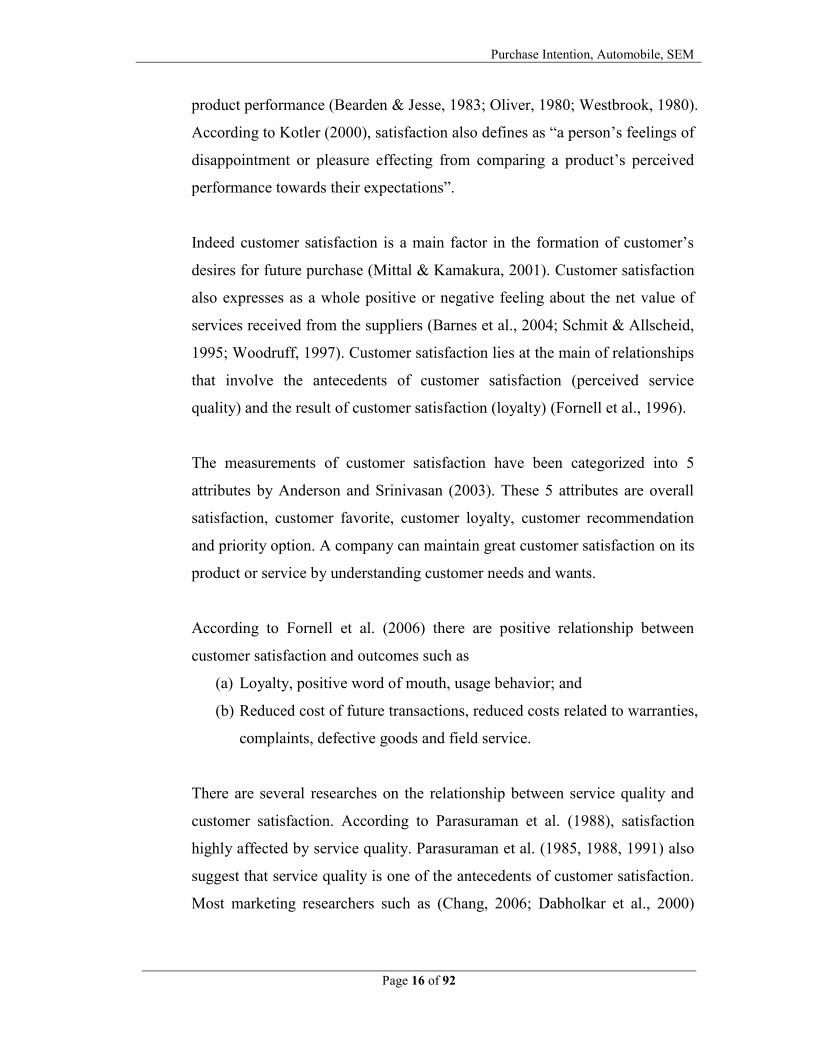
product performance (Bearden & Jesse, 1983; Oliver, 1980; Westbrook, 1980).
According to Kotler (2000), satisfaction also defines as “a person’s feelings of
disappointment or pleasure effecting from comparing a product’s perceived
performance towards their expectations”.
Indeed customer satisfaction is a main factor in the formation of customer’s
desires for future purchase (Mittal & Kamakura, 2001). Customer satisfaction
also expresses as a whole positive or negative feeling about the net value of
services received from the suppliers (Barnes et al., 2004; Schmit & Allscheid,
1995; Woodruff, 1997). Customer satisfaction lies at the main of relationships
that involve the antecedents of customer satisfaction (perceived service
quality) and the result of customer satisfaction (loyalty) (Fornell et al., 1996).
The measurements of customer satisfaction have been categorized into 5
attributes by Anderson and Srinivasan (2003). These 5 attributes are overall
satisfaction, customer favorite, customer loyalty, customer recommendation
and priority option. A company can maintain great customer satisfaction on its
product or service by understanding customer needs and wants.
According to Fornell et al. (2006) there are positive relationship between
customer satisfaction and outcomes such as
(a) Loyalty, positive word of mouth, usage behavior; and
(b) Reduced cost of future transactions, reduced costs related to warranties,
complaints, defective goods and field service.
There are several researches on the relationship between service quality and
customer satisfaction. According to Parasuraman et al. (1988), satisfaction
highly affected by service quality. Parasuraman et al. (1985, 1988, 1991) also
suggest that service quality is one of the antecedents of customer satisfaction.
Most marketing researchers such as (Chang, 2006; Dabholkar et al., 2000)

Purchase Intention, Automobile, SEM
Page 17 of 92
also agree with this framework which states that service quality leads to
customer satisfaction.
A high level of relationship is needed between service providers and customer
in the service industries. The higher the customer satisfaction with the service
experienced, the higher the level of trust that customers gain from the
organization itself and also the personnel that provide its service. Therefore,
Van Birgelen, Ruyter & Wetzels (2001) states that satisfied customers tend to
increase the use on short and in the long term by building trust with an
organization compared to unsatisfied customers. The research done by Hsieh
and Hiang’s (2004) also supports this statement.
2.1.6 Purchase intention
Purchase intention is defined as “a person’s degree who has formulated
conscious plans to not perform or to perform some specified future behavior”
(Warshaw & Davis, 1985). What the consumer think and will buy represents
purchase intention (Blackwell, Miniard & Engel, 2001). According to Shim
and Drake (1990), high level of purchase intention relates to positive belief as
compared to consumers with low level of purchase intention. In conjunction,
intention to purchase is often used as a metric in the prediction of purchasing
behavior (Morwitz & Schmittlein, 1992).
Intention to purchase is the consumers’ inclination to act toward an object and
is normally measured in terms of intention to buy (Kim, 2004). The findings
of Morwitz, Steckel and Gupta (2007) support that purchase intention is a
vital factor for an organization because manager often used it to make
strategic decisions relating to both new and existing products and the
marketing program that supports them.

Purchase Intention, Automobile, SEM
Page 18 of 92
Past researchers acknowledged the idea that intention to purchase a particular
products or services is the final cognitive step in the decision making process
of purchase intention (Agrawal & Teas, 2002; Erevelles, 1993; Fishbein, 1967;
Han, 1990; Pecotich, Pressley & Roth, 1996).
Plenty of studies have been carried out to explain the determinants of purchase
intentions. There are several gripping reasons that interest marketers on
purchase intention research such as: purchase intention help marketing
manager make a decision which geographic markets and segments the product
should be launch (Sewall, 1978; Silk & Urban, 1978). On the other hand, for
existing products, purchase intention is used to predict future demand
(Armstrong, Morwitz & Kumar, 2000).
Managers of different departments like sales department and marketing
department always evaluate the validity of proposed promotions for both new
and existing products by using purchase intentions (Morwitz et al., 2007).
Academic researchers used purchase intentions as proxy measures for
purchase behavior (Ajzen & Fishbein, 1980; Akaah, Korgaonkar & Lund,
1995; Akhter & Durvasula, 1991; Schlosser, 2003)
Ang, Lim, and Tambyah (2001) further noted that a positive attitude would
lead to a higher intention to perform the behavior. Besides that, consumer will
request or search for more information if they have intention to purchase. A
variable that will influence purchase intention through attitude as the
mediating variable is “useful” (past experience). Davis, Bagozzi, and
Warshaw (1989) defined “useful” as “a person believes that using this
automobile will get his or her request or need such as self-esteem”.

Purchase Intention, Automobile, SEM
Page 19 of 92
2.2 Review of Relevant Theoretical Model
Figure 2.1: A Theoretical Framework for Perceived Quality, Customer Satisfaction,
and Customer Loyalty: Customer Satisfaction Index (CSI) Model. Adopted from: Yu
et al. (2005).
The objective of this research is to explore overall customer satisfaction associated
with Toyota’s Lexus automobiles in Taiwan by applying customer satisfaction index
(CSI) model. Perceived quality found positively and directly influence overall
customer satisfaction, and has an indirect effect on customer complaint-levels and
customer loyalty.
Meanwhile, customer expectations do have positive impact on overall customer
satisfaction. However, they indirectly effect overall customer satisfaction through the
perception of quality. Not surprisingly, different levels of overall customer
satisfaction have significant negative direct influences on customer complaints and
significant positive direct impacts on customer loyalty. More importantly, the study
finds that the relationship of customer complaints with customer loyalty is not
negative.

Purchase Intention, Automobile, SEM
Page 20 of 92
Figure 2.2: A Theoretical Framework An Integrated Model for the Effects of
Perceived Product Quality, Perceived Service Quality, and Perceived Price Fairness
on Consumer Satisfaction and Consumer Loyalty. Adopted from: Bei and Chiao (2001).
The purposes of this study are to balance service quality and product quality into an
integrated model, and to investigate the effects of three consumer perceptions effects
(product quality, service quality, and price fairness) on satisfaction and loyal behavior.
Perceived service quality, product quality and price fairness find to have almost
equally important effect on satisfaction. Based upon the model, consumer satisfaction
is a mediator for perceived service quality, product quality and price fairness. Besides,
perceived service quality has only indirect effect on loyalty through satisfaction.
Nevertheless, perceived product quality and price fairness both have direct and
indirect effects on loyalty. The researcher find that both perceived product quality and
perceived price fairness have positive relationship with consumer satisfaction as well
as with perceived service quality. In conjunction, the study indicates that perceived
service quality, perceived product quality and perceived price fairness are positively
correlated.

Purchase Intention, Automobile, SEM
Page 21 of 92
Figure 2.3: A Theoretical Framework for Understanding the Antecedents to Customer
Loyalty by Applying Structural Equation Modelling. Adopted from: Yieh, Chiao and Chiu (2007).
This study provides an integrated framework of customer loyalty in automobile
industry. It analyses 495 car owners patronizing the automobile repair and service
centre of Nissan, Toyota, and Mitsubishi. Besides that, two-step SEM approach was
used in this study to confirm the construct and convergent validity of each latent
construct, and the discriminate validity of the full measurement model. Moreover, the
other objective of this study is to study the relationship between perceived product
quality, perceived service quality, and perceived price fairness on satisfaction, trust,
and customer loyalty.
Previous researcher exposed that customer satisfaction, perceived product quality,
perceived price fairness, and trust all play an important role in affecting customer
loyalty. The issues in the configuration of satisfaction are perceived product quality,
perceived price fairness, perceived service quality (employee-customer interaction),
however, the essential issue in the configuration of trust is perceived service quality
(e.g. employee empathy, tangibility and employee-customer interaction).

Purchase Intention, Automobile, SEM
Page 22 of 92
Customers’ level of trust is positively affected by the perceived service quality as
examined by the authors. There are three dimensions of perceived service quality
which is tangibility, employee–customer interaction, and employee empathy. In
conjunction, customer satisfaction and trust as well as customers’ perceptions of price
fairness and product quality are positively related to customer loyalty. Furthermore,
customer satisfaction can also affect customer loyalty by helping customers create
trust.
The limitations of the investigation are the samples come only from three ASRs
operated by best-selling brands, and all of which are located in the Greater Taipei
metropolitan area. Due to the limits of sample scope and location, the research result
is limited to the external validity. Furthermore, all the data collected by the researcher
comes from respondents’ self-managed questionnaire.
Figure 2.4: Toyota Passenger Car Purchase Intention Model
Source: Developed for the research
The conceptual model
Purchase Intention, Automobile, SEM
Page 23 of 92
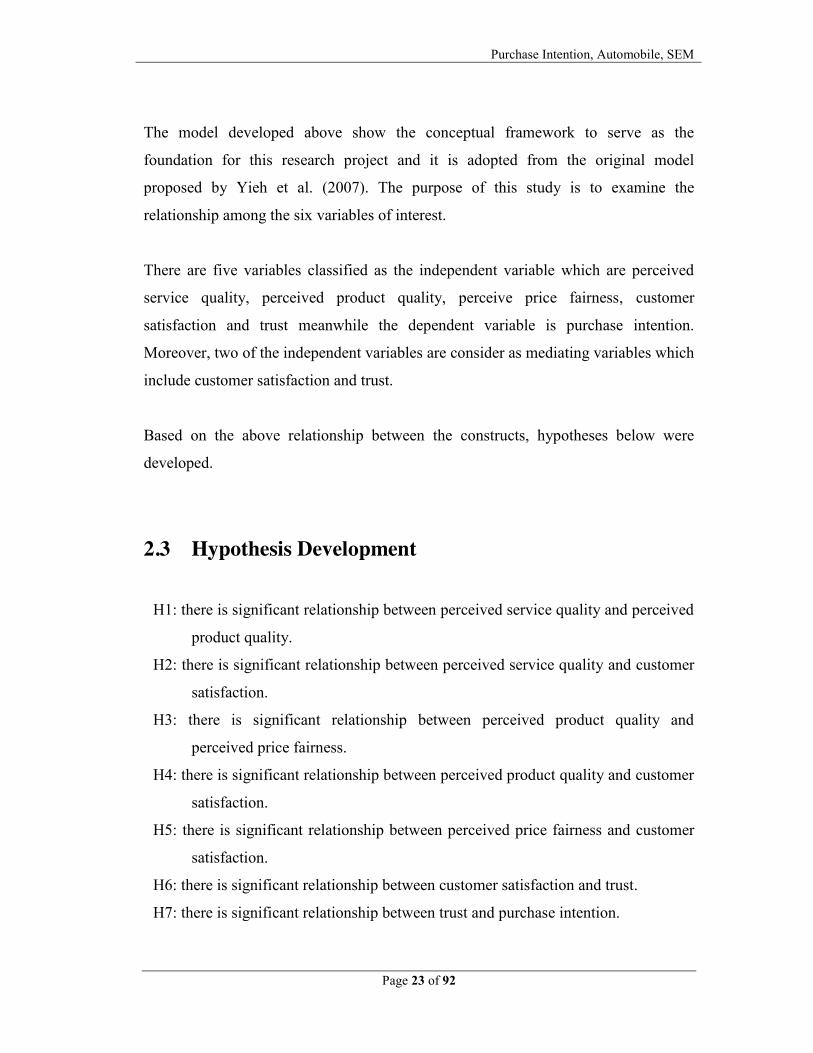
The model developed above show the conceptual framework to serve as the
foundation for this research project and it is adopted from the original model
proposed by Yieh et al. (2007). The purpose of this study is to examine the
relationship among the six variables of interest.
There are five variables classified as the independent variable which are perceived
service quality, perceived product quality, perceive price fairness, customer
satisfaction and trust meanwhile the dependent variable is purchase intention.
Moreover, two of the independent variables are consider as mediating variables which
include customer satisfaction and trust.
Based on the above relationship between the constructs, hypotheses below were
developed.
2.3 Hypothesis Development
H1: there is significant relationship between perceived service quality and perceived
product quality. H2: there is significant relationship between perceived service quality and customer
satisfaction.
H3: there is significant relationship between perceived product quality and
perceived price fairness.
H4: there is significant relationship between perceived product quality and customer
satisfaction.
H5: there is significant relationship between perceived price fairness and customer
satisfaction.
H6: there is significant relationship between customer satisfaction and trust.
H7: there is significant relationship between trust and purchase intention.

Purchase Intention, Automobile, SEM
Page 24 of 92
2.4 Conclusion
It is concluded that there are five consumption factors that might influence consumers’
purchase intentions on Toyota passenger car.

Purchase Intention, Automobile, SEM
Page 25 of 92
CHAPTER 3: METHODOLOGY
3.0 Introduction
This chapter discuss about the nature of the study, research design, data collection
methods, sampling process, sampling design, questionnaire design, pilot testing,
constructs measurement, data processing and methods of data analysis. After that, the
sources of both primary and secondary data were being identified.
Methodology is an overall approach to the process of the research from theoretical
underpinning to collection and data analysis. Instead, it defined as the degree of
correlation between the independent and dependent variables ("MBA Research
Methodology", 2005). The nature of our research is to find out factors that influence
purchase intention toward Toyota passenger cars in Mukim Tupai, Taiping, Perak. At
the same time, a consumer purchasing intention model was formulated from the data
collected.
3.1 Research Design
Our research is an exploratory research. Its aim is to find out factors that influence
purchase intention toward Toyota passenger cars in Mukim Tupai, Taiping, Perak. It
identified the influence of perceived service quality, perceived product quality,
perceived price fairness, customer satisfaction, and trust on purchase intention.
Hypotheses were set based on our research framework. The hypotheses are the main
ideas and propositions where our research intends to test by using SPSS 19.0
statistical software.

Purchase Intention, Automobile, SEM
Page 26 of 92
We decided to use questionnaire in our research because it is fast, inexpensive,
efficient, and effective method compared to others. Data collected from the
questionnaire was analyzed using SPSS 19.0 statistical software. Secondary data were
also collected to support this research, for example we collect the data from Majlis
Perbandaran Taiping.
3.2 Data Collection Methods
Primary data and secondary data were collected for this research project. Primary data
was collected through questionnaire designed referring to Teas, 1993 (perceived
service quality), Kennedy, Ferrell, & LeClair, 2001 (perceived product quality),
Andreas, Lan, Kent, & Frank, 2007 (perceived price fairness), Huang & Jing, 2007
(customer satisfaction) and Lin, Chen, Chiu, & Lee, 2011 (trust and purchase
intention) questionnaires. Secondary data was collected data from journal articles in
websites, document on the historical data and annual reports that provided by Toyota
automobile companies. To answer to our research problem, we collected primary data
from respondents through distribution of questionnaires.
We have distributed 450 set of questionnaires to the respondents in Mukim Tupai,
Taiping, Perak who are current Toyota car users. We used 2 weeks to conduct the
survey, 8 hours daily from Monday to Sunday. The survey was conducted daily from
9.00 a.m. until 5.00 p.m. The surveys were carried out from 9th May 2011 until 22nd
May 2011 during our semester break.
The questionnaires were distributed in the housing area in Mukim Tupai, Taiping,
Perak. Out of the 450 sets questionnaires distributed, only 300 sets are completed
without error and used in data analysis. The data collected was then transformed into
useful and valuable information using SPSS and AMOS 19.0 statistical software.

Purchase Intention, Automobile, SEM
Page 27 of 92
3.2.1 Primary Data
Primary data were collected through questionnaires for the purpose of
addressing the problems at hand. Questionnaires are designed in a semi-
structured form which includes open-ended questions and closed-ended
questions using five point Likert scale.
3.2.2 Secondary Data
The secondary data collected consist of the articles in journals, magazines,
newspapers, archives, published statistic, company' annual report and others.
The main aim is to provide information that is needed to describe and explain
our research. Our literature review is basically obtained from the Internet
websites, articles, journals, and published statistic, as well as the statistics and
documents provided by Majlis Perbandaran Taiping.
3.3 Sampling Design
3.3.1 Target Population
The population in our research is the consumers who have the intention to
purchase the Toyota passenger cars in Taiping, Perak and the target sample is
the current Toyota car users in Mukim Tupai, Taiping, Perak. The respondents
selected are all current Toyota car user, only user selected to gather accurate
information for the research. Location of the questionnaires survey is in the
housing area of Mukim Tupai, Taiping, Perak. The total target sample size is
450. Only 360 sets of usable questionnaire has been collected from this
exercise.

Purchase Intention, Automobile, SEM
Page 28 of 92
3.3.2 Sampling Frame and Sampling Location
Our data was collected in one part of Taiping area which is Mukim Tupai
(refer Appendix 3.1, 3.2, 3.3, 3.4). This study was conducted in the housing
area of Mukim Tupai which consists of 32 housing area which are Kawasan
Perusahaan Ringan Tupai, Taman Saga, Medan Koperasi, Taman Raja Idris,
Taman Sri Hijau, Rumah Hijau, Taman Sri Kota, Taman Pokok Assam,
Taman Assamara, Taman Assamara 2, Taman Assamara 3, Taman Mas
Kuning, Taman Kuning Sari, Taman Kuning Permai, Taman Assam Maju,
Taman Merati, Taman Semarak, Taman Semarak 2, Taman Anjung Semarak,
Taman Aun Say, Taman Sentosa, Taman Perak, Taman Eliatamby, Taman
Tupai Mas, Kampung Aman, Kampung Potong Pinang, Taman Tasik Permai,
Taman Tasik Jaya, Kampung Birch, Kampung Jambu, Taman Seri Kuning
and Pokok Assam Tambahan, and 2 more apartments which are Pearl
Apartment and Flat Jalan Porkeling with a total of 7569 houses (refer
Appendix 3.5).
3.3.3 Sampling Elements
The sampling elements used are the residents who drive Toyota cars in the
housing area of Mukim Tupai, Taiping, Perak. They are able to answer the
questionnaire since they are the current user of Toyota passenger car.
Generally, our respondents are all adults and above 18 years old who already
get the driving licence. The respondents consist of housewives, students,
retirees, professionals and unemployed person.

Purchase Intention, Automobile, SEM
Page 29 of 92
3.3.4 Sampling Technique
There are two types of sampling technique such as probability sampling and
non-probability sampling. We used cluster sampling and simple random
sampling technique in this research which are probability sampling techniques.
First of all, we surveyed the 12 Mukim in the whole Taiping which have
similar characteristics in terms of social background such as type of houses.
Through our observation, those Mukim have same type of houses such as
single-storey, double-storey and banglo. After that, we divide those Mukim
into 5 clusters, and we use computer to choose one cluster randomly using
computer and the area choosen was Mukim Tupai..
3.3.5 Sample Size
From the data of Majis Perdandaran Taiping, there are 7569 houses in Mukim
Tupai, we made a survey in that area and find that only 1759 houses owned at
least one Toyota passenger car. We used random sampling method to choose
450 houses as our sampling size for this research. After that, we distributed
the questionnaires to the residents listed. Out of the questionnaires distributed,
360 of them were complete and usable, 8 of them were incomplete and 82 of
them did not respond and being rejected. The data collected is acceptable
since a good marketing research need to have at least 300 respondents as
coined by Comrey and Lee (1992).
3.4 Research Instrument
We conduct our survey by using questionnaire because this is the most commonly
used method to obtain data from huge amount of respondents. The purpose of

Purchase Intention, Automobile, SEM
Page 30 of 92
questionnaire is to obtain and acquire useful data from the Toyota passenger cars
owners who live in housing area of Mukim Tupai. We used questionnaires in our
research because it is quick, inexpensive, efficient and accurate in assessing
information from the respondents.
3.4.1 Questionnaire Design
Questionnaire is a survey instrument that used to obtain the specific
information form target respondents. The purpose of questionnaire is to gather
information from the respondent. Our questionnaire is separated into two
sections which consisted of thirty-five questions. Section A questioned on
demographic profile to obtain the basic information about the target
respondents, section B examining the respondents’ agreement and
disagreement about factors that influence purchase intention model toward
Toyota passenger.
3.4.2 Pilot Test
After the early version of questionnaire design is completed, a pilot test was
carried to test on reliability and validity of the questionnaire. The pilot test
helped us to improve the early versions of questionnaire and prevent time
wasting where questions that are not related to our research were deleted. We
invited fifteen respondents from the target population to participate in our
pilot test. The pilot test questionnaire consists of four pages with forty
questions that the respondents need to answer. After the running of
Cronbach’s Alpha test on the data collected, some questions were taken out
from the questionnaire in order to improve on the reliability of this research.
As a result, the actual questionnaire consists of three pages with thirty-five

Purchase Intention, Automobile, SEM
Page 31 of 92
questions include seven questions on demographic. This pilot test allows us to
refine the questionnaire before we proceed to the actual data collection.
3.5 Constructs Measurement
Table 3.1: Origins of Constructs
Constructs Adopted from
Perceived Service Quality (Teas, 1993)
Perceived Product Quality (Kennedy, Ferrell, & LeClair, 2001)
Perceived Price Fairness (Andreas, Lan, Kent, & Frank, 2007)
Customer Satisfaction (Huang & Jing, 2007)
Trust (Lin, Chen, Chiu, & Lee, 2011)
Purchase Intention (Lin, Chen, Chiu, & Lee, 2011)
Source: Developed for the research
Table 3.2: Example of Modified Operational Definitions of Constructs
Constructs Sample Items
Perceived Service
Quality
1. Employees of Toyota Corporation always perform good
quality car services for their customers.
2. Employees of Toyota Corporation show high
responsiveness towards customers’ requests when
servicing their cars.

Purchase Intention, Automobile, SEM
Page 32 of 92
3. Customers are very confidence with the car service
provided by Toyota.
4. Employees of Toyota Corporation show their caring to
the customers when servicing their cars.
5. Employees of Toyota always find out the cars’ problems
and able to solve the problem in short time.
Perceived Product
Quality
1. Toyota car has the best performance on the road.
2. Toyota car has the best outlook.
3. Toyota car features fulfill all my expectation on product
quality.
4. Toyota car's part and accessories are very durable. (E.g.:
engine, headlights & more)
5. Toyota Corporation provides the trustable warranties to
the car owner.
Perceived Price
Fairness
1. The price of the new Toyota car is reasonable.
2. Every customer pays the same price when they buy car
from any Toyota car dealer. (no discrimination of price)
3. Toyota car is not overpriced.
4. The price of the Toyota car is acceptable compared to
other car brands.
5. There is no abuse of market power in Toyota cars price
setting.
Customer
Satisfaction
1. I am very satisfied with my Toyota car’s overall
performance.
2. I believe that I make a good decision in purchasing
Toyota car.
3. I will spread positive word of mouth about Toyota car to
my relatives and friends.
4. I will choose Toyota car when I want to buy car in the

Purchase Intention, Automobile, SEM
Page 33 of 92
future.
Trust 1. I believed that Toyota Corporation is competent at what
it is doing.
2. I believed that Toyota Corporation is trustworthy.
3. I believed that Toyota Corporation has very high
integrity.
4. I believed that Toyota Corporation is very responsible to
their customers.
Purchase Intention 1. I intend to purchase a Toyota car in the near future.
2. I search for information about Toyota car from time to
time.
3. I always talk about Toyota car with my friends.
4. I like to compare Toyota car to others car brands from
time to time.
5. I believed that Toyota car is the most suitable car for me
to buy.
Source: Developed for the research
3.6 Data Processing
According to Malhotra et al. (2002), before raw data can be use in questionnaire, they
must be converted into a proper form. In order to ensure that the data is in a standard
quality, the data in the current research must undergo a repetitive data preparation
process.
3.6.1 Questionnaire Checking
Purchase Intention, Automobile, SEM
Page 34 of 92
Data checking is the process of thoroughly checking the collected data to
ensure optimal quality levels. All the data that had been collected was double
checked in order to make sure that there is no mistake. The checking process
is made during and after fieldwork. Any problems that had been detected were
being corrected before the questionnaires were distributed to the respondents.
3.6.2 Data Editing
Before the data is being presented as information it must be edited first. This
is to ensure that the information provided is complete, consistent and accurate.
Unclear or complicated question makes respondent unsatisfied and impatient
to answer the questions and this will affect the overall result. So editing is
important because it helps to discard the unsatisfactory responses.
3.6.3 Data Coding
The data coding process is to categorize the numerical score or other character
symbol from previously edited data. The SPSS 19.0 statistical software is
chosen for data coding and analysis, for example the respondent were coded
as “1” for female and “2” for male. While part two were being coded as “1”
for strongly disagree, “2” for disagree, “3” for neutral, “4” for agree and “5”
for strongly agree.
3.6.4 Data Cleaning Data cleaning is the process of a raw data are verified and checked to certify
that the data have accurately input from the data collection form to the

Purchase Intention, Automobile, SEM
Page 35 of 92
computer software program, called SPSS by Burns and Bush (2006). The
checks using computer is more extensive and consistent compare to the
checks during the data editing process (Malhotra, 2002). The missing
responses in the questionnaire are value of variable with the unambiguous
answer. Hence, we use SPSS program is to review the respondent code and
also apply a consistency check to detect the out-of-range.
3.7 Data Analysis
Data analysis is the process of ordering, structuring and providing meaning to the
collected data. Qualitative data analysis is a search for general statements about the
relationships among categories of data where it builds grounded theory. Quantitative
data analysis generates statistics through the use of large-scale survey research
(Zikmund, 2003). We have used quantitative data analysis in our research.
3.7.1 Descriptive Analysis
Descriptive analysis is used to transform the raw data from the research into a
form that we can interpret and understand easily. Frequency and percentage
were used to describe the measurement of the data in Section A of the
questionnaires. This is a process to change raw data into a form that easier to
interpret and understand.
3.7.2 Scale Measurement (Reliability Test)
The reliability test under scale measurement plays an important role in
determining the validity and reliability of the survey forms. Coefficient Alpha

Purchase Intention, Automobile, SEM
Page 36 of 92
or Cronbach’s Alpha were used to measure the concept of consistency
reliability. The coefficient varies from 0 to 1. It is categorize under
unsatisfactory internal consistency reliability if the value is below 0.6. The
variables were only categorized under satisfactory internal consistency
reliability if the range is above 0.6 or almost 1.0. There are also few elements
included in reliability test such as factor loading, mean and standard deviation.
3.7.3 Data Analysis Tool SEM
AMOS program has been employed in this research to test goodness of fit of
the data, hypotheses development, and relationship among observed and latent
variables. AMOS gives researches the power to easily perform structural
equation modelling (SEM) to build models with more accuracy than with
standard multivariate statistics techniques. Fit Indices for SEM such as
RMSEA, CFI and Normed Chi-square establish to determine whether
proposed model is acceptance. Path relationships between the latent variables
were examined to determine whether significant relationships exist in the
proposed model (Bacon & Inc, 1997).
3.8 Conclusion
We've conducted an exploratory research to find out factors that influence purchase
intention toward Toyota passenger car in Mukim Tupai, Taiping, Perak. A set of
structured questionnaires was set and a pilot test of the questionnaire was carried
before actual data collection. Data obtained from our questionnaire were then
examined using SPSS and AMOS 19.0 statistical software. Descriptive analysis,
reliability test and inferential analysis were used to analyse the data collected.

Purchase Intention, Automobile, SEM
Page 37 of 92
CHAPTER 4: DATA ANALYSIS
4.0 Introduction
This chapter consists of descriptive analysis, scale measurement and inferential
analysis. The statistic results of respondents were compiled by using SPSS 19.0
statistical software. All the demographics information is described in pie charts and
bar charts (refer to Appendix 4.1).
Reliability is tested based on Cronbach’s alpha coefficient to ensure they are reliable
for further analysis. Inferential analysis using Structural Equation Model (SEM)
described the crucial test.
4.1 Descriptive Analysis
4.1.1 Respondents Demographic Characteristics and General Information
Table 4.1 presents the respondents’ demographic information for the 360
responses that were used in the analysis. Of the 360 responses, the majority of
the participants were male (70.3%). Marital status of respondents are 42.8%
single and 57.2% married.
Of all the respondents, 36.1% studied until secondary level and more than
21.7% of the respondents had a bachelor degree or professional qualification.
The majority of respondents (78.3%) were employed, and 11.1% of
respondents were retired.

Purchase Intention, Automobile, SEM
Page 38 of 92
About 33.3% of respondents had a monthly income between RM2001 and
RM3000, followed by those with a monthly income ranging between RM3001
and RM4000 (19.7%), and below RM1000 (18.9%). There are 65.6% of all
respondents knew about Toyota crisis.
Table 4.1: Demographic Characteristics of Survey Respondents
n=360
Category Frequency %
Gender Female 107 29.7% Male 253 70.3% Age 18-25 years old 29 8.1% 26-35 years old 63 17.5% 36-45 years old 97 26.9% 46-55 years old 125 34.7% 56 years old and above 46 12.8% Marital Status Single 154 42.8% Married 206 57.2% Highest Education Level Primary 50 13.9% Secondary 130 36.1% Diploma/Advanced Diploma 66 18.3% Bachelor Degree/Professional
Qualification 78 21.7%
Master Degree 29 8.1% PhD Degree 7 1.9% Employment Status Employed 282 78.3% Unemployed 17 4.7% Student 12 3.3% Retired 40 11.1% Other 9 2.5% Personal Income Below RM1000 68 18.9% RM1001-RM2000 57 15.8% RM2001-RM3000 120 33.3% RM3001-RM4000 71 19.7% RM4001-RM5000 33 9.2% More than RM5001 11 3.1% Knew About Toyota Yes 236 65.6% Crisis No 124 34.4% Source: Developed for the research

Purchase Intention, Automobile, SEM
Page 39 of 92
4.2 Scale Measurement
A scale reliability test using SPSS 19.0 was conducted to test the internal consistency
in measuring results using the coefficient alpha. Cronbach’s alpha coefficient is the
most general measure of reliability for a multi-item scale (Sekaran, 1992).
A minimum value of .70 was employed to assess the internal consistency of the
construct (Hair et al., 2005), and the Cronbach’s alpha coefficients for all constructs
were greater than .70. The coefficient alpha estimates for each of the six constructs
are listed as follows: perceived service quality (α = .923), perceived product quality
(α = .846), perceived price fairness (α = .904), customer satisfaction (α = .860), trust
(α = .926) and purchase intention (α = .885). Based on the suggested cut off points,
all measures appeared to be good indicators of each construct with multiple items.
The results of reliability tests including Cronbach’s Alpha, factor loadings, mean and
standard deviation (S.D.) are presented in Table 4.2.
Table 4.2: Factor Loadings, Mean, Standard Deviation and Reliability of the Study
Research construct and research items Factor
Loading Mean S.D. Cronbach’s Alpha
Perceived Service quality .923
SQ1 Employees of Toyota corporation always perform good quality car services to their customers.
.785 3.54 0.949
SQ2 Employees of Toyota corporation show their high responsiveness towards customers’ requests when servicing their cars.
.779 3.45 1.118
SQ3 Customers are very confidence with the car service provided by Toyota.
.725 3.48 1.102
SQ4 Employees of Toyota corporation .799 3.48 1.129

Purchase Intention, Automobile, SEM
Page 40 of 92
show their caring to the customers when servicing their cars.
SQ5 Employees of Toyota always understand the cars’ problems that their customers faced and able to solve the problem in short time.
.762 3.38 1.191
Perceived Product Quality .846
PQ1 Toyota car has the best performance on the road.
.793 3.61 0.937
PQ2 Toyota car has the best outlook. .731 3.76 1.065
PQ3 Toyota car features fulfill all my expectation on product quality.
.780 3.56 1.024
Perceived Price Fairness .904
PF1 The price of the new Toyota car is reasonable.
.693 3.41 0.994
PF2 Every customer pays the same price when they buy car from any Toyota car dealer.
.699 3.40 1.098
PF3 Toyota car is not over priced. .764 3.28 1.075
PF4 The price of the Toyota car is acceptable compared to other car brands.
.736 3.53 1.031
PF5 There is no abuse of market power in Toyota cars price setting.
.724 3.39 1.078
Customer Satisfaction .875
CS1 I am very satisfied with my Toyota car’s overall performance.
.804 3.59 0.906
CS2 I believe that I make a good decision in purchasing Toyota car.
.820 3.57 1.089
CS3 I will spread positive word of mouth about Toyota car to my relatives and friends.
.797 3.38 1.155

Purchase Intention, Automobile, SEM
Page 41 of 92
Trust .860
T1 I believed that Toyota corporation is competent at what it is doing.
.796 3.56 0.921
T3 I believed that Toyota corporation has very high integrity.
.775 3.55 1.006
T4 I believed that Toyota corporation is very responsible to customers.
.779 3.55 1.060
Purchase Intention .926
DV1 I intend to purchase a Toyota car in the near future.
.759 3.58 1.066
DV2 I search for information about Toyota car from time to time.
.758 3.23 1.208
DV3 I always talk about Toyota car with my friends.
.770 3.30 1.160
DV4 I like to compare Toyota car to others car brands from time to time.
.742 3.63 1.149
DV5 I believed that Toyota car is the most suitable car for me to buy.
.831 3.61 1.208
Source: Developed for the research
4.3 Inferential Analysis
4.3.1 Structural Equation Modelling
Following the evaluation of the measurement model in terms of reliability, a
Structural Equation Model (SEM) was formulated. A structural model is
different from a measurement model. While a measurement model accentuates
the relationships between latent constructs and measured items, a structural
model emphasizes the nature and degree of the relationships between

Purchase Intention, Automobile, SEM
Page 42 of 92
constructs (Hair et al., 2005). Therefore, SEM is used to test a hypothesized
theoretical model.
Six latent constructs (perceived service quality, perceived product quality,
perceived price fairness, customer satisfaction, trust and purchase intention)
and 24 observed items were included in testing of the structural model. The
Maximum Likelihood (ML) estimation method was applied to test the base
model using AMOS 19.0 based on no violation of the normality assumption.
The ML method provides unbiased, more consistent and more efficient
parameter estimates (Jaccard & Wan, 1996; Kmenta, 1971). According to
Browne and Cudeck (1993), RMSEA values less than or equal to .05 can be
considered as a good fit.
Table 4.3: Measurements of Fit Indexes
Fit Indexes
Descriptions
Normed
Chi-square
Known as relative chi-square. It equals the chi-square index divided by
degrees of freedom. According to Schumacker & Lomax (2004), this
index is less sensitive to sample size.
RMSEA Root Mean Square Error of Approximation. According to Steiger
(1990), RMSEA is a measure of approximate fit in the population and is
therefore concerned with the discrepancy due to approximation. Lower
RMSEA values indicate better fit. According to Browne & Cudeck
(1993), RMSEA values below .05 can be considered as a good fit,
values between .05 and .08 as an adequate fit.
NFI Normed Fit Index. NFI values range from 0 to 1, with higher values
indicating better fit. The rule of thumb for this index is that .90 is
indicative of acceptable fit relative to the baseline model (Schumacker

Purchase Intention, Automobile, SEM
Page 43 of 92
& Lomax, 2004).
CFI Comparative Fit Index. It compares the proposed model with the
independence model presuming there are no relationships between the
measures. It indicates how much better the model fits the data.
According to Byrne (2009), value of CFI should be greater than .90 for
a good fit model.
Factor
Loadings
Factor loadings are the correlation coefficients between the variables
and the factors. The variables with the highest correlations provide the
most meaning to the factor solution. (Hair et al., 2005).
As indicated in Table 4.4, the overall fit statistics for the proposed model was
acceptable (χ2 = 1321, df = 735, χ2/df = 1.80, Root Mean Square Error of
Approximation (RMSEA) = .033, Normed Fit Index (NFI) = .920, Comparative Fit
Index (CFI) = .963. These indices show that the proposed model fits the data at good
level.
Table 4.4: The Model Fit Statistics of the Proposed Model
Goodness-of-fit-Statistics
The proposed model
Desired values for Good Fit
χ2/df 1321 / 735 = 1.80 < 3.0
RMSEA .033 < .05
NFI .920 > .90
CFI .963 > .90
Source: Developed for the research
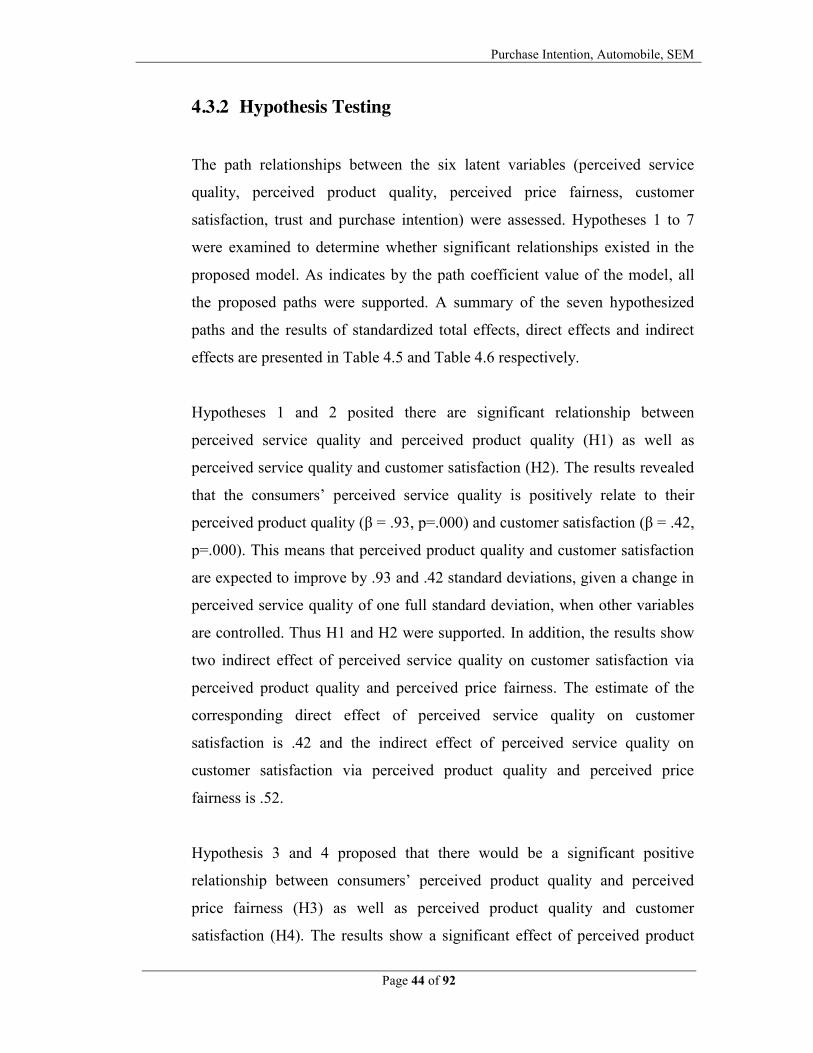
Purchase Intention, Automobile, SEM
Page 44 of 92
4.3.2 Hypothesis Testing
The path relationships between the six latent variables (perceived service
quality, perceived product quality, perceived price fairness, customer
satisfaction, trust and purchase intention) were assessed. Hypotheses 1 to 7
were examined to determine whether significant relationships existed in the
proposed model. As indicates by the path coefficient value of the model, all
the proposed paths were supported. A summary of the seven hypothesized
paths and the results of standardized total effects, direct effects and indirect
effects are presented in Table 4.5 and Table 4.6 respectively.
Hypotheses 1 and 2 posited there are significant relationship between
perceived service quality and perceived product quality (H1) as well as
perceived service quality and customer satisfaction (H2). The results revealed
that the consumers’ perceived service quality is positively relate to their
perceived product quality (β = .93, p=.000) and customer satisfaction (β = .42,
p=.000). This means that perceived product quality and customer satisfaction
are expected to improve by .93 and .42 standard deviations, given a change in
perceived service quality of one full standard deviation, when other variables
are controlled. Thus H1 and H2 were supported. In addition, the results show
two indirect effect of perceived service quality on customer satisfaction via
perceived product quality and perceived price fairness. The estimate of the
corresponding direct effect of perceived service quality on customer
satisfaction is .42 and the indirect effect of perceived service quality on
customer satisfaction via perceived product quality and perceived price
fairness is .52.
Hypothesis 3 and 4 proposed that there would be a significant positive
relationship between consumers’ perceived product quality and perceived
price fairness (H3) as well as perceived product quality and customer
satisfaction (H4). The results show a significant effect of perceived product

Purchase Intention, Automobile, SEM
Page 45 of 92
quality on perceived price fairness (β = .89, p = .000) and perceived product
quality on customer satisfaction (β = .32, p = .023). Thus, H3 and H4 are
supported. In addition, the indirect effect of perceived product quality on
customer satisfaction (β = .25, p = .049) through perceived price fairness was
found. This result indicates that there is 25% of the indirect effect of perceived
product quality on customer satisfaction through perceived price fairness.
Hypothesis 5 proposed that perceived price fairness positively and
significantly influences customer satisfaction. The result revealed that
perceived price fairness positively and significantly affected customer
satisfaction (β = .28, p = .000). Therefore, H5 is supported in that perceived
price fairness is an antecedent of customer satisfaction.
Hypothesis 6 posited the relationship between Toyota car owner’s customer
satisfaction and their trust toward Toyota Corporation. The result revealed that
trust was positively and significantly predicted by customer satisfaction (β
= .99, p = .000). Thus, H6 is supported.
Hypothesis 7 proposed that there would be a significant positive relationship
between customers’ trust and purchase intention. The results show a
significant effect of trust on purchase intention (β = .95, p = .000). Therefore,
H7 is supported.
A graphical representation of the proposed model is presented in Figure 4.1.
All hypotheses posited in this research are supported. Figure 4.2 and 4.3
presents the SEM model for both crisis aware group and unaware group.
There is no significant differentiation between these two groups.

Purchase Intention, Automobile, SEM
Page 46 of 92
Table 4.5: Path Estimates for the Proposed Model Path Est. S.
Est. S.E. C.R. P
H1 Perceived service quality → Perceived product quality
.721 .930 .041 17.390 ***
H2 Perceived service quality → Customer satisfaction
.316 .417 .075 4.191 ***
H3 Perceived product quality → Perceived price fairness
.992 .893 .064 15.455 ***
H4 Perceived product quality → Customer satisfaction
.309 .316 .136 2.271 .023*
H5 Perceived price fairness → Customer satisfaction
.243 .277 .064 3.819 ***
H6 Customer satisfaction → Trust 1.132 .991 .061 18.586 *** H7 Trust → Purchase intention 1.038 .948 .054 18.956 ***
a. ***. Significantly different from zero at the .001 level (two-tailed).
b. *. Significantly different from zero at the .05 level (two-tailed).
Source: Developed for the research

Purchase Intention, Automobile, SEM
Page 47 of 92
Table 4.6: Standardized Total Effects, Direct Effects, and Indirect Effects
Independent variables Dependent variables Total effect
Direct effect
Indirect effect
Perceived service quality Perceived product quality .930 .930 Perceived price fairness .831 .831 Customer Satisfaction .941 .417 .524 Trust .932 .932 Purchase Intention .884 .884 Perceived product quality Perceived price fairness .893 .893 Customer Satisfaction .563 .316 .247 Trust .558 .558 Purchase Intention .529 .529 Perceived price fairness Customer Satisfaction .277 .277 Trust .274 .274 Purchase Intention .260 .260 Customer Satisfaction Trust .991 .991 Purchase Intention .939 .939 Trust Purchase Intention .948 .948 Source: Developed for the research

Purchase Intention, Automobile, SEM
Page 48 of 92
Figure 4.1: Results of Structural Equation Modelling Analysis (All group)
Source: Developed for the research

Purchase Intention, Automobile, SEM
Page 49 of 92
Figure 4.2: Results of Structural Equation Modelling Analysis
(Crisis aware group)
Source: Developed for the research

Purchase Intention, Automobile, SEM
Page 50 of 92
Figure 4.3: Results of Structural Equation Modelling Analysis
(Crisis unaware group)
Source: Developed for the research

Purchase Intention, Automobile, SEM
Page 51 of 92
Table 4.7: Summary of Standardized Path Coefficients
Path All Group
Aware Group
Unaware Group
H1 Perceived service quality → Perceived product quality .93 .93 .92
H2 Perceived service quality → Customer satisfaction .42 .38 .47 H3 Perceived product quality → Perceived price
fairness .89 .89 .90
H4 Perceived product quality → Customer satisfaction .32 .36 .25
H5 Perceived price fairness → Customer satisfaction .28 .27 .30 H6 Customer satisfaction → Trust .99 .99 .99 H7 Trust → Purchase intention .95 .96 .93
Source: Developed for the research
4.4 Conclusion
As a result, we conclude that the proposed Toyota owner’s purchase intention
structural equation modelling (SEM) is applicable for both crisis aware group and
unaware group. The invariant test conducted indicates that the hypothesized model is
well fitted to both groups of customer.

Purchase Intention, Automobile, SEM
Page 52 of 92
CHAPTER 5: DISCUSSION, CONCLUSION AND IMPLICATION
5.0 Introduction
The purpose of this study is to examine the impact of customer satisfaction and trust
towards customer purchase intention by empirically testing a model. The subjects of
this study were 450 residents who stayed at Mukim Tupai. All subjects completed
through questionnaire survey instrument consisting of two sections that is
respondents' demographic data for the first section while Toyota car's buyer
characteristics for the second section. To answer the research questions, structural
equation modelling (SEM) was conducted to explore the relationships between
customer perceived service quality, perceive product quality, perceive price fairness,
customer satisfaction, trust and purchase intention. The Statistical Package for the
Social Science (SPSS) was also used for all descriptive analyses including the
frequency distributions.
This chapter consists of four sections: (1) summary of the important findings of this
study and discusses the findings; (2) the theoretical and practical implications of the
study are presented; (3) directions for future research and limitations of the study; and
(4) conclusion with final comments.

Purchase Intention, Automobile, SEM
Page 53 of 92
5.1 Summary of the important findings of this study and discussion on the findings There are 65.6% of all respondents knew about the Toyota car recall crisis. The
invariant test show that there is no effect on consumer purchase intention whether
they aware or unaware about the Toyota crisis.
We came out with an integrated Toyota passenger car purchase intention model in the
automobile industry (title of the model). There are five variables classified as
independent variable which are perceived service quality, perceived product quality,
perceived price fairness, customer satisfaction and trust meanwhile the dependent
variable is purchase intention. Table 5.1 summarizes the results of the hypotheses test.
Results of the study show that, perceived service quality has significant affect on
customer satisfaction and perceived product quality with the value of 0.42 and 0.93
respectively. A lot of researchers such as Parasuraman et al. (1985, 1988) state that
the higher the service quality, the higher the customer satisfaction. Besides that, Teas
(1993) also states that perceived service quality is the augmentation of the customer
satisfaction. The researcher of Baker et al. (1991) stated that service quality did not
influence customers’ perception of value directly. However, they found that service
quality directly affected product quality, which they found to be an interesting finding.
Meanwhile, perceived product quality significant affects customer satisfaction and
perceived price fairness with the value of 0.32 and 0.89 respectively. In the
satisfaction model proposed by Parasuraman et al. (1994), product quality is equally
importance in affecting consumer satisfaction as service quality. While, price has
found to be related to perceived product quality and consumer’s product evaluations
(Rao & Monroe 1989; Dodds, Monroe & Grewal 1991). This will affect the consumer
to perceive that higher quality of products will lead to higher price as compare to
other products.

Purchase Intention, Automobile, SEM
Page 54 of 92
Besides that, we also see that perceived price fairness significantly affect customer
satisfaction with the value of 0.28. In an empirical study of automobile purchases by
Herrmann et al. (2007), it was concluded that customer satisfaction indirectly
influenced by the perceived price fairness. Several other recent literatures also
indicate that perceived price fairness is positively correlated to customer satisfaction.
(Bei & Chiao, 2001; Parasuraman et al., 1994; Hanif, Hafeez & Riaz, 2010;
Herrmann et al., 2007; Huffman et al., 2001; Yieh et al., 2007).
In addition, customer satisfaction significantly affects trust with the value of 0.99.
The higher the customer satisfaction with the service experienced, the higher the level
of trust that customers gain from the organization itself and also the personnel that
provide its service. Therefore, Van Birgelen et al. (2001) state that satisfied customers
tend to increase the use in short and long term by building trust with an organization
compared to unsatisfied customers. The research done by Hsieh and Hiang (2004)
also supports this statement.
Lastly, trust has significant effect on purchase intention with the value of 0.95. On the
basis of previous research that has stressed the positive influence of trust on purchase
intentions (Garbarino & Johnson, 1999; Bart et al., 2005; Gefen & Straub, 2003;
Yoon, 2002). The above finding encapsulates the relationship between consumer trust
and consumer intentions to purchase Toyota cars.
Table 5.1: Summary of the Hypothesized Findings
Hypothesis Finding
1. There is significant relationship between perceived service
quality and perceived product quality. Supported
2. There is significant relationship between perceived service
quality and customer satisfaction. Supported
3. There is significant relationship between perceived product Supported

Purchase Intention, Automobile, SEM
Page 55 of 92
quality and perceived price fairness.
4. There is significant relationship between perceived product
quality and customer satisfaction. Supported
5. There is significant relationship between perceived price fairness
customer satisfaction. Supported
6. There is significant relationship between customer satisfaction
and trust. Supported
7. There is significant relationship between trust and purchase
intention. Supported
Source: Developed for the research
From the Structural Equation Model (SEM) in previous chapter, we found that there
are 5 factors that have significant influence on customer purchase intention towards
Toyota car. The factors are perceived service quality, perceived product quality,
perceived price fairness, customer satisfaction and trust. From the result, we can see
that the path relationships between the six latent variables (perceived service quality,
perceived product quality, perceived price fairness, customer satisfaction, trust and
purchase intention). Hypotheses 1 to 7 were examined to determine the relationships
exist in the proposed model. All the proposed paths were supported.
5.2 Implication of the Study
The conclusive finding of this study helps in understanding the factors that influence
the purchase intention towards Toyota passenger cars in Taiping, Perak. Therefore
this study is applicable in marketing the passenger cars and in improving
understanding of the customer purchase intention towards Toyota cars.

Purchase Intention, Automobile, SEM
Page 56 of 92
5.2.1 Managerial Implications
In this study, the concept of customer purchase intention was measured by 6
constructs. The relationships between these six constructs were also tested. By
identifying the consumers’ perception of purchase intention toward their
brand, managers need to improve in the aspect of perceive service quality,
perceived product quality and perceived price fairness in marketing of their
automobile in order to increase the purchase intention of the prospective
customer.
This study revealed that consumers who are aware or unaware of the issue that
faced by Toyota Corporation in 2009 are indifferent in term of their
perception toward Toyota car and the recall issue does not affect Malaysian
car buyer negatively. Rather the main antecedent of perceive service quality,
perceived product quality and along with perceived price fairness have an
indirect effect on trust and purchase intention through customer satisfaction;
therefore, companies should develop effective marketing plans that increase
customer satisfaction by improving perceive service quality, perceive product
quality and perceive price fairness.
Based on this research, it may be suggested that by adding value toward the
products and service along with the price setting that focuses on attracting
customer towards Toyota. Besides that, Toyota companies also develop a
good level of satisfaction, trust and loyalty. Meanwhile, this may help the
manager in improving business performance by utilizing this model in making
business decision. In others word, increase in purchase intention will helps to
increase the chance of selling car of Toyota (Agrawal & Teas, 2002; Erevelles,
1993; Fishbein, 1967; Han, 1990; Pecotich et al., 1996).

Purchase Intention, Automobile, SEM
Page 57 of 92
5.3 Directions for Future Research and Limitations of the Study
There are several limitations in this research, which is result may not be generalized
due to limitation on the samples collected are from one area in Malaysia. Meanwhile,
there are more factors that will influence customer satisfaction rather than those three
factors that are perceive product quality, perceive service quality and perceive price
fairness that we mentioned in our research.
Lastly, we would like to recommend those futures researchers to do research on this
which is to use the same model test in more places so that we can test the validity of
the model and create more reliability of the result in Malaysia rather than just in
Mukim Tupai, Taiping, Perak.
5.4 Conclusion In a nutshell, we have accomplished the objective of investigating the relevant factors
that influence the purchase intention toward Toyota car in Taiping, Perak in this
research. The factors are perceived service quality, perceived product quality,
perceived price fairness, trust, customer satisfaction and purchase intention The result
revealed that perceive service quality, perceive product quality and perceive price
fairness leads to customer satisfaction. Meanwhile customer satisfaction will lead to
trust, and trust influence the purchasing intention Lastly, the problem of this research
has been solved. The manager of the company can use the result of structural
equation modelling analysis to solve their problem due to the result of the model are
reliable and strong enough to prove that there are significant relationship between the
five factors. On the other hand, the result of this study is applicable to the customer of
Taiping area since we have a detail selection of respondents based on clustering and
single random techniques.

Purchase Intention, Automobile, SEM
Page 58 of 92
REFERENCES
Aaker, D. A., & Jacobson, R. (1994). The financial information content of perceived quality. Journal of Marketing Research, 191-201.
Abdul-Muhmin, A. G. (2002). Effects of suppliers’ marketing program variables on
industrial buyers’ relationship satisfaction and commitment. Journal of Business & Industrial Marketing, 17(7), 637-651.
Agarwal, S., & Teas, R. K. (2002). Cross-national applicability of a perceived quality
model. Journal of Product & Brand Management, 11(4), 213-236. Ajzen, I., & Fishbein, M. (1980). Understanding attitudes and predicting social
behavior: Prentice Hall. Akaah, I. P., Korgaonkar, P. K., & Lund, D. (1995). Direct marketing attitudes.
Journal of Business Research, 34(3), 211-219. Akhter, S. H., & Durvasula, S. (1991). Consumers' attitudes toward direct marketing
and purchase intentions:: An empirical investigation. Journal of Direct Marketing, 5(3), 48-56.
Anderson, E., & Weitz, B. (1989). Determinants of continuity in conventional
industrial channel dyads. Marketing science, 8(4), 310-323. Anderson, E. W., Fornell, C., & Lehmann, D. R. (1994). Customer satisfaction,
market share, and profitability: Findings from Sweden. The Journal of Marketing, 58(3), 53-66.
Anderson, J. C., & Narus, J. A. (1990). A model of distributor firm and manufacturer
firm working partnerships. The Journal of Marketing, 54(1), 42-58. Anderson, R. E., & Srinivasan, S. S. (2003). E-satisfaction and e-loyalty: A
contingency framework. Psychology and Marketing, 20(2), 123-138. Andreas, H., Lan, X., Kent, B. M., & Frank, H. (2007). The influence of price
fairness on customer satisfaction: an empirical test in the context of automobile purchases. [DOI: 10.1108/10610420710731151]. Journal of Product & Brand Management, 16(1), 49-58.
Ang, S. H., Cheng, P. S., Lim, E. A. C., & Tambyah, S. K. (2001). Spot the difference:
consumer responses towards counterfeits. Journal of Consumer Marketing, 18(3), 219-235.
Apologetic Toyota sales drop 10.9% in February - Lexus plows ahead up 5.2%. (2010,

Purchase Intention, Automobile, SEM
Page 59 of 92
February 3). Auto Spies. Retrieved April 12, 2011, from http://www.autospies.com/news/Apologetic-Toyota-Sales-Drop-10-9-In-February-Lexus-Plows-Ahead-Up-5-2 -52297/
Armstrong, J. S., Morwitz, V. G., & Kumar, V. (2000). Sales forecasts for existing
consumer products and services: Do purchase intentions contribute to accuracy? International Journal of Forecasting, 16(3), 383-397.
Athanassopoulos, A. D. (2000). Customer Satisfaction Cues To Support Market
Segmentation and Explain Switching Behavior. Journal of Business Research, 47(3), 191-207.
Bacon, L. D., & Inc, S. (1997). Using Amos for structural equation modeling in
market research: Lynd Bacon & Associates Ltd. and SPSS Inc. Baker, J. A., Parasuraman, A,, Grewal, D., & Burnett, J. J. (1991). The effects of store
environment on consumer perceptions of quality price and value. Working paper, University of Texas at Arlington.
Barnes, B. R., Fox, M. T., & Morris, D. (2004). Exploring the linkage between
internal marketing, relationship marketing and service quality: a case study of a consulting organization. Total Quality Management & Business Excellence, 15(5), 593-601.
Bart, Y., Shankar, V., Sultan, F., & Urban, G. L. (2005). Are the drivers and role of
online trust the same for all web sites and consumers? A large-scale exploratory empirical study. Journal of Marketing, 69(4), 133-152.
Bearden, W. O., & Teel, J. E. (1983). Selected determinants of consumer satisfaction
and complaint reports. Journal of Marketing Research, 20(1), 21-28. Bechwati, N. N., Sisodia, R. S., & Sheth, J. N. (2009). Developing a model of
antecedents to consumers' perceptions and evaluations of price unfairness. Journal of Business Research, 62(8), 761-767.
Bei, L. T., & Chiao, Y. C. (2001). An integrated model for the effects of perceived
product, perceived service quality, and perceived price fairness on consumer satisfaction and loyalty. Journal of Consumer Satisfaction Dissatisfaction and Complaining Behaviour, 14, 125-140.
Beldona, S., & Namasivayam, K. (2006). Gender and demand-based pricing:
Differences in perceived (un) fairness and repatronage intentions. Journal of Hospitality and Leisure Marketing, 14(4), 89.
Bitner, M. J. (1990). Evaluating Service Encounters: The effects of physical
surroundings and employee responses. The Journal of Marketing, 54(2), 69-82.

Purchase Intention, Automobile, SEM
Page 60 of 92
Blackwell, R. D., Miniard, P. W., & Engel, J. F. (2001). Consumer behavior 9th. Mason, OH, South-Western.
Bolton, L. E., Warlop, L., & Alba, J. W. (2003). Consumer Perceptions of Price (Un)
Fairness. The Journal of Consumer Research, 29(4), 474-491. Bougie, R., Pieters, R., & Zeelenberg, M. (2003). Angry customers don't come back,
they get back: The experience and behavioral implications of anger and dissatisfaction in services. Journal of the Academy of Marketing Science, 31(4), 377-393.
Browne, M. W., & Cudeck, R. (1993). Alternative ways of assessing model fit. In K.
A. Bollen & J. S. Long (Eds.), Testing structural equation models (pp. 136−162). Newbury Park, CA: Sage.
Brucks, M., Zeithaml, V. A., & Naylor, G. (2000). Price and brand name as indicators
of quality dimensions for consumer durables. Journal of the Academy of Marketing Science, 28(3), 359-374.
Burns, A. C., & Bush, R. F. (2006). Marketing research (5th edition). Prentice Hall. Byrne, B. M. (2009). Structural equation modeling with AMOS: Basic concepts,
applications, and programing, Second edition. New York: Routledge. Campbell, M. C. (1999a). Perceptions of price unfairness: antecedents and
consequences. Journal of Marketing Research, 36(2), 187-199. Campbell, M. C. (1999b). Pricing strategy & practice: Why did you do that? The
important role of inferred motive in perceptions of price fairness. Journal of Product & Brand Management, 8(2), 145-153.
Caruana, A. (2002). Service loyalty: The effects of service quality and the mediating
role of customer satisfaction. European Journal of Marketing, 36(7), 811-828. Chang, H. H. (2006). Technical and management perceptions of enterprise
information system importance, implementation and benefits. Information Systems Journal, 16(3), 263-292.
Chumpitaz, R., & Paparoidamis, N. G. (2004). Service quality and marketing
performance in business-to-business markets: exploring the mediating role of client satisfaction. Managing Service Quality, 14(2/3), 235-248.
Comrey, A.L. & Lee, H.B. (1992). A first course in factor analysis. Hillsdale, New
Jersey: Erlbaum.

Purchase Intention, Automobile, SEM
Page 61 of 92
Cronin, J. J., Brady, M. K., & Hult, G. T. M. (2000). Assessing the effects of quality, value, and customer satisfaction on consumer behavioral intentions in service environments. Journal of Retailing, 76(2), 193-218.
Cronin, J. J., & Taylor, S. A. (1992). Measuring Service Quality: A Reexamination
and Extension. The Journal of Marketing, 56(3), 55-68. Dabholkar, P. A., Shepherd, C. D., & Thorpe, D. I. (2000). A comprehensive
framework for service quality: an investigation of critical conceptual and measurement issues through a longitudinal study. Journal of Retailing, 76(2), 139-173.
Davis, F. D., Bagozzi, R. P., & Warshaw, P. R. (1989). User acceptance of computer
technology: a comparison of two theoretical models. Management science, 35(8), 982-1003.
Davis, P. (1999). The long run, Toyota: the first 40 years in Australia. Hurstville,
NSW: Type Forty Pty Ltd. Dawson, C. (2004). Lexus: the relentless pursuit. Singapore: John Wiley & Sons
(Asia) Pte Ltd. Deutsch, M. (1960). The effect of motivational orientation upon trust and suspicion.
Human Relations, 13(2), 123-139. Dodds, W. B., Monroe, K. B., & Grewal, D. (1991). Effects of price, brand, and store
information on buyers' product evaluations. Journal of Marketing Research, 307-319.
Dwyer, F. R., Schurr, P. H., & Oh, S. (1987). Developing buyer-seller relationships.
The Journal of Marketing, 51(2), 11-27. Dyer, J. (1998). Specialized supplier networks as a source of competitive advantage:
Evidence from the auto industry. Strategic Management Journal, 17(4), 271-291.
Emshwiller, J. R. (1991). Suppliers struggle to improve quality as big firms slash their
vendor rolls. Wall Street Journal, 1. Erevelles, S. (1993). The price-warranty contract and product attitudes. Journal of
Business Research, 27(2), 171-181. Fishbein, M. (1967). Attitude and the prediction of behavior. Readings in attitude
theory and measurement, 477-492. Fornell, C., Johnson, M. D., Anderson, E. W., Cha, J., & Bryant, B. E. (1996). The

Purchase Intention, Automobile, SEM
Page 62 of 92
American customer satisfaction index: nature, purpose, and findings. The Journal of Marketing, 60(4), 7-18.
Fornell, C., Mithas, S., Morgeson III, F. V., & Krishnan, M. S. (2006). Customer
satisfaction and stock prices: High returns, low risk. Journal of Marketing, 70(1), 3-14.
Ganesan, S. (1994). Determinants of long-term orientation in buyer-seller
relationships. The Journal of Marketing, 58(2), 1-19. Gallup poll: 55% say Toyota too slow to act. (2010, February 3). USA Today.
Retrieved April 2, 2011, from http://www.usatoday.com/money/autos/2010-03-02-toyotapoll02_ST_N.htm
Garbarino, E., & Johnson, M. S. (1999). The different roles of satisfaction, trust, and
commitment in customer relationships. The Journal of Marketing, 70-87. Gefen, D., & Straub, D. W. (2003). Managing user trust in B2C e-services. E-service
Journal, 2(2), 7-24. Gronroos, C. (1984). A service quality model and its marketing implications.
European Journal of Marketing, 18(4), 36-44. Gundlach, G. T., & Cadotte, E. R. (1994). Exchange interdependence and interfirm
interaction: research in a simulated channel setting. Journal of Marketing Research, 31(4), 516-532.
Hair. J.F., Black, W.C., Babin, B.J., Anderson, R.E., & Tatham, R.L. (2005).
Multivariate data analysis. Sixth Edition, Upper Saddle River, New Jersey: Prentice Hall.
Hakansson, H. (1982). International Marketing and Purchasing of Industrial Goods:
An Interaction Approach. New York: John Wiley and Sons. Han, C. M. (1990). Testing the role of country image in consumer choice behaviour.
European Journal of Marketing, 24(6), 24-40. Hanif, M., Hafeez, S., & Riaz, A. (2010). Factors affecting customer satisfaction.
International Research Journal of Finance and Economics, 60, 44-52. Herrmann, A., Xia, L., Monroe, K. B., & Huber, F. (2007). The influence of price
fairness on customer satisfaction: an empirical test in the context of automobile purchases. Journal of Product & Brand Management, 16(1), 49-58.
Hsieh, Y. C., & Hiang, S. T. (2004). A study of the impacts of service quality on

Purchase Intention, Automobile, SEM
Page 63 of 92
relationship quality in search-experience-credence services. Total Quality Management, 15(1), 43-58.
Huang, Y. F., & Jing, J. L. (2007). A study of the perceived value, customer
satisfaction and customer loyalty: Top five automobile manufacturer in Taiwan.
Huffman, C., & Cain, L. B. (2001). Adjustments in performance measures:
Distributive and procedural justice effects on outcome satisfaction. Psychology and Marketing, 18(6), 593-615.
Iyer, A., Seshadri, S., Vasher, R. (2009). Toyota supply chain management. New
York: McGraw Hill. Jaccard, J. & Wan, C. (1996). Lisrel approach to interaction effects in multiple
regression. Thousand Oaks, CA: Sage Publications, Inc. Johnston, W. J., & Lewin, J. E. (1996). Organizational buying behavior: Toward an
integrative framework. Journal of Business Research, 35(1), 1-15. Kahneman, D., Knetsch, J. L., & Thaler, R. H. (1986). Fairness and the Assumptions
of Economics. The Journal of Business, 59(4), 285-300. Kalapurakal, R., Dickson, P. R., & Urbany, J. E. (1991). Perceived price fairness and
dual entitlement. Advances in consumer research, 18(1), 788-793. Kennedy, M. S., Ferrell, L. K., & LeClair, D. T. (2001). Consumers' trust of
salesperson and manufacturer: an empirical study. Journal of Business Research, 51(1), 73-86.
Kim, E. Y., & Kim, Y. K. (2004). Predicting online purchase intentions for clothing
products. European Journal of Marketing, 38(7), 883-897. Kmenta, J. (1971). Elements of economics. New York, NY: McMillan Publishing
Company. Kotler, P. (2000). Marketing management: The millennium edition: Prentice Hall. Kotler, P., Armstrong, G., Saunders, J. & Wong, V. (2002). Principles of Marketing
Third European Edition. Prentice Hall Europe. Kukar-Kinney, M., Xia, L., & Monroe, K. B. (2007). Consumers' perceptions of the
fairness of price-matching refund policies. Journal of Retailing, 83(3), 325-337.
Kumar, N., Scheer, L. K., & Steenkamp, J. B. E. M. (1995). The effects of perceived

Purchase Intention, Automobile, SEM
Page 64 of 92
interdependence on dealer attitudes. Journal of Marketing Research, 32, 348-356.
Lehtinen, U., & Lehtinen, J. R. (1982). Service quality: a study of quality dimensions:
Service Management Institute. Lehtinen, U., & Lehtinen, J. R. (1991). Two approaches to service quality dimensions.
The Service Industries Journal, 11(3), 287-303. Lewis, J. D., & Weigert, A. (1985). Trust as a social reality. Social Forces, 63(4),
967-985. Lewis, R. C., & Booms, B. H. (1983). The marketing aspects of service quality.
Emerging perspectives on services marketing, 99-107. Liker, J. K. (2004). The Toyota way: 14 management principles from the world's
greatest manufacturer. New York: McGraw-Hill. Lin, C. P., Chen, S. C., Chiu, C. K., & Lee, W. Y. (2011). Understanding purchase
intention during Product-Harm crises: Moderating effects of perceived corporate ability and corporate social responsibility. Journal of Business Ethics, pages 1-17.
Lovato, J. (2010). Toyota Recall crisis. Retrieved March 28, 2011, from
http://ezinearticles.com/?Toyota-Recall-Crisis&id=3674020 MacKenzie, A., & Evans, S. (2010, January 1). The Toyota recall crisis. Motor Trend.
Retrieved February 23, 2011, from http://www.motortrend.com/features/auto_news/2010/112_1001_toyota_recall_crisis/index.html
Malhotra, N. K. (2002). Basic marketing research: Applications to contemporary
issue (International edition). New Jersey: Prentice Hall. Malhotra, N. K., Hall, J., Shaw, M., & Oppenheim, P. (2002). Marketing research:
An Applied Orientation (2nd edition). Frenchs Forest: Pearson Education. Martin-Consuegra, D., Molina, A., & Esteban, A. (2007). An integrated model of
price, satisfaction and loyalty: an empirical analysis in the service sector. Journal of Product & Brand Management, 16(7), 459-468.
Matzler, K., Wurtele, A., & Renzl, B. (2006). Dimensions of price satisfaction: a
study in the retail banking industry. International Journal of Bank Marketing, 24(4), 216-231.

Purchase Intention, Automobile, SEM
Page 65 of 92
MBA Research Methodology (2005). Retrieved July 2, 2010 from http://www2.le.ac.uk/Members/mh64/research-methods/DL-research-methodology-notes-introduction.pdf
Mittal, V., & Kamakura, W. A. (2001). Satisfaction, repurchase intent, and repurchase
behavior: Investigating the moderating effect of customer characteristics. Journal of Marketing Research, 38(1), 131-142.
Moorman, C., Deshpande, R., & Zaltman, G. (1993). Factors affecting trust in market
research relationships. The Journal of Marketing, 57(1), 81-101. Morgan, R. M., & Hunt, S. D. (1994). The commitment-trust theory of relationship
marketing. The Journal of Marketing, 58(3), 20-38. Morwitz, V. G., & Schmittlein, D. (1992). Using segmentation to improve sales
forecasts based on purchase intent: Which “intenders" actually buy?. Journal of Marketing Research, 29(4), 391-405.
Morwitz, V. G., Steckel, J. H., & Gupta, A. (2007). When do purchase intentions
predict sales? International Journal of Forecasting, 23(3), 347-364. Noordewier, T. G., John, G., & Nevin, J. R. (1990). Performance outcomes of
purchasing arrangements in industrial buyer-vendor relationships. The Journal of Marketing, 54, 80-93.
Nunnally, J. (1978). Psychometric Theory. New York, NY: McGraw Hill. Oliver, R. L. (1980). A cognitive model of the antecedents and consequences of
satisfaction decisions. Journal of Marketing Research, 17(4), 460-469. Oliver, R. L. (1997). Satisfaction: McGraw-Hill. Oliver, R. L., & Swan, J. E. (1989a). Equity and disconfirmation perceptions as
influences on merchant and product satisfaction. The Journal of Consumer Research, 16(3), 372-383.
Oliver, R. L., & Swan, J. E. (1989b). Consumer perceptions of interpersonal equity
and satisfaction in transactions: A Field Survey Approach. The Journal of Marketing, 53(2), 21-35.
Parasuraman, A., Berry, L. L., & Zeithaml, V. A. (1991). Refinement and
reassessment of the SERVQUAL scale. Journal of Retailing, 67(4), 420-450. Parasuraman, A., Zeithaml, V. A., & Berry, L. L. (1985). A conceptual model of
service quality and its implications for future research. The Journal of Marketing, 49(4), 41-50.

Purchase Intention, Automobile, SEM
Page 66 of 92
Parasuraman, A., Zeithaml, V. A., & Berry, L. L. (1988). SERVQUAL: A multiple-
item scale for measuring consumer perceptions of service quality. Journal of Retailing, 64(1), 12-40.
Parasuraman, A., Zeithaml, V. A., & Berry, L. L. (1994). Reassessment of
expectations as a comparison standard in measuring service quality: implications for further research. The Journal of Marketing, 58(1), 111-124.
Pecotich, A., Pressley, M., & Roth, D. (1996). The impact of ethnocentrism on the
origin effect in the service sector. Journal of Retailing and Consumer Services, 12(4), 213-224.
Prius sales up in spite of recall. (2010, March 2). PriusChat. Retrieved March 22,
2011, from http://priuschat.com/news/prius-sales-up-in-spite-recall Rao, A. R., & Monroe, K. B. (1989). The effect of price, brand name, and store name
on buyers' perceptions of product quality: An integrative review. Journal of Marketing Research, 351-357.
Rathmell, J. M. (1966). What is meant by services?. The Journal of Marketing, 30(4),
32-36. Robinson, P. J., Faris, C. W., & Wind, Y. (1967). Industrial buying and creative
marketing: Allyn & Bacon. Rotter, J. B. (1967). A new scale for the measurement of interpersonal trust. Journal
of personality, 35(4), 651. Rotter, J. B. (1980). Interpersonal trust, trustworthiness, and gullibility. American
Psychologist, 35(1), 1-7. Schellhase, R., Hardock, P., & Ohlwein, M. (2000). Customer satisfaction in
business-to-business marketing: the case of retail organizations and their suppliers. Journal of Business & Industrial Marketing, 15(2/3), 106-121.
Schlenker, B. R., Helm, B., & Tedeschi, J. T. (1973). The effects of personality and
situational variables on behavioral trust. Journal of Personality and Social Psychology, 25(3), 419-427.
Schlosser, A. E. (2003). Experiencing products in the virtual world: the role of goal
and imagery in influencing attitudes versus purchase intentions. Journal of Consumer Research, 30(2), 184-198.
Schmit, M. J., & Allscheid, S. P. (1995). Employee attitudes and customer
satisfaction: Making theoretical and empirical connections. Personnel

Purchase Intention, Automobile, SEM
Page 67 of 92
Psychology, 48(3), 521-536. Schumacker, R. E., & Lomax, R. G. (2004). A beginner's guide to structural equation
modeling, Second edition. Mahwah, NJ: Lawrence Erlbaum Associates. Sekaran, U. (1992). Research methods for business: a skill building approach. John
Wiley, New York. Sewall, M. A. (1978). Market segmentation based on consumer ratings of proposed
product designs. Journal of Marketing Research, 15(4), 557-564. Shim, S., & Drake, M. F. (1990). Consumer intention to purchase apparel by mail
order: beliefs, attitude, and decision process variables. Clothing and Textiles Research Journal, 9(1), 18-26. Shostack, G. L. (1977). Breaking free from product marketing. The Journal of Marketing, 41(2), 73-80.
Silk, A. J., & Urban, G. L. (1978). Pre-test-market evaluation of new packaged goods:
A model and measurement methodology. Journal of Marketing Research, 15(2), 171-191.
Sinha, I., & Batra, R. (1999). The effect of consumer price consciousness on private
label purchase. International Journal of Research in Marketing, 16(3), 237-251.
Sirohi, N., McLaughlin, E. W., & Wittink, D. R. (1998). A model of consumer
perceptions and store loyalty intentions for a supermarket retailer. Journal of Retailing, 74(2), 223-245.
Spear, S. (2004). Learning to lead at Toyota. Harvard Business Review, 82(5), 78-86. Steiger, J. H. (1990). Structural model evaluation and modification: An interval
estimation approach. Multivariate behavioral research, 25(2), 173-180. Sweeney, J. C., Soutar, G. N., & Johnson, L. W. (1999). The role of perceived risk in
the quality-value relationship: a study in a retail environment. Journal of Retailing, 75(1), 77-105.
Teas, R. K. (1993). Expectations, Performance Evaluation, and Consumers'
Perceptions of Quality. The Journal of Marketing, 57(4), 18-34. Thaler, R. (1985). Mental accounting and consumer choice. Marketing science, 4(3),
199-214. Toyota: a history of the first 50 years (1. ed.). (1988). Toyota City, Japan: Toyota
Motor Corporation.

Purchase Intention, Automobile, SEM
Page 68 of 92
Toyota claims world's best-selling automaker title. (2008, April 24). Automotive. Retrieved February 17, 2011, from http://usnews.rankingsandreviews.com/cars-trucks/daily-news/080424-Toyota-Claims-World-s-Best-Selling-Automaker-Title/
Toyota sales drop 16 percent in January. (2010, February 3). The Washington Times.
Retrieved March 15, 2011, from http://www.washingtontimes.com/news/2010/feb/03/toyota-sales-drop-16-percent-in-january/?page=1
Toyota to recall 270,000 cars worldwide. (2010, July 2). The Star online. Retrieved
March 27, 2011, from http://biz.thestar.com.my/news/story.asp?sec=business&file=/2010/7/2/business/20100702091159
Van Birgelen, M., De Ruyter, K., & Wetzels, M. (2001). What factors determine use
of quality-related marketing research information? An empirical investigation. Total Quality Management, 12(4), 521 - 534.
Voss, G. B., Parasuraman, A., & Grewal, D. (1998). The roles of price, performance,
and expectations in determining satisfaction in service exchanges. The Journal of Marketing, 62(4), 46-61.
Warshaw, P. R., & Davis, F. D. (1985). Disentangling behavioral intention and
behavioral expectation. Journal of Experimental Social Psychology, 21(3), 213-228.
Westbrook, R. A. (1980). Intrapersonal affective influences on consumer satisfaction
with products. The Journal of Consumer Research, 7(1), 49-54. Wirtz, J., & Kimes, S. E. (2007). The Moderating Role of Familiarity in Fairness
Perceptions of Revenue Management Pricing. Journal of Service Research, 9(3), 229-240.
Woodruff, R. B. (1997). Customer value: the next source for competitive advantage.
Journal of the Academy of Marketing Science, 25(2), 139-153. Xia, L., Monroe, K. B., & Cox, J. L. (2004). The price is unfair! A conceptual
framework of price fairness perceptions. The Journal of Marketing, 68(4), 1-15.
Yieh, K., Chiao, Y. C., & Chiu, Y. K. (2007). Understanding the antecedents to
customer loyalty by applying Structural Equation Modeling. Total Quality Management & Business Excellence, 18(3), 267-284.
Yoon, S. J. (2002). The antecedents and consequences of trust in online purchase

Purchase Intention, Automobile, SEM
Page 69 of 92
decisions. Journal of interactive marketing, 16(2), 47-63. Yu, C. J., Wu, L., Chiao, Y., & Tai, H. (2005). Perceived quality, customer
satisfaction, and customer loyalty: the case of lexus in Taiwan. Total Quality Management & Business Excellence, 16(6), 707-719.
Zeithaml, V. A. (1988). Consumer perceptions of price, quality, and value: a means-
end model and synthesis of evidence. The Journal of Marketing, 52(3), 2-22. Zikmund, W. G. (2003). Business Research Method (7th edition), Thomson
Publishing.

Purchase Intention, Automobile, SEM
Page 70 of 92
(Appendix 3.1)
Map of Mukim Tupai, Taiping, Perak (1)

Purchase Intention, Automobile, SEM
Page 71 of 92
(Appendix 3.2)
Map of Mukim Tupai, Taiping, Perak (2)

Purchase Intention, Automobile, SEM
Page 72 of 92
(Appendix 3.3)
Map of Mukim Tupai, Taiping, Perak (3)

Purchase Intention, Automobile, SEM
Page 73 of 92
(Appendix 3.4)
Map of Mukim Tupai, Taiping, Perak (4)

Purchase Intention, Automobile, SEM
Page 74 of 92
(Appendix 3.5)
Number of Households in Mukim Tupai, Taiping, Perak
Housing Area Number of Households
Flat Jalan Porkeling 24 Kampung Aman 119 Kampung Birch 85 Kampung Jambu 677 Kampung Potong Pinang 116 Kawasan Perusahaan Ringan Tupai 273 Medan Koperasi 23 Pearl Apartment 32 Pokok Assam Tambahan 91 Rumah Hijau 220 Taman Anjung Semarak 175 Taman Assam Maju 136 Taman Assamara 408 Taman Assamara 2 27 Taman Assamara 3 48 Taman Aun Say 154 Taman Eliatamby 26 Taman Kuning Permai 192 Taman Kuning Sari 492 Taman Mas Kuning 102 Taman Merati 66 Taman Perak 71 Taman Pokok Assam 1096 Taman Raja Idris 504 Taman Saga 54 Taman Semarak 379 Taman Semarak 2 205 Taman Sentosa 207 Taman Seri Kuning 18 Taman Sri Hijau 372 Taman Sri Kota 556 Taman Tasik Jaya 59 Taman Tasik Permai 440 Taman Tupai Mas 122 TOTAL 7569

Purchase Intention, Automobile, SEM
Page 75 of 92
(Appendix 3.6)
Certification Letter

Purchase Intention, Automobile, SEM
Page 76 of 92
(Appendix 3.7)
Factors that Influence Purchase Intention toward Toyota Car in Malaysia
Survey Questionnaire
The purpose of this survey is to understand the factors that influence the purchase intention toward Toyota car in Malaysia. Please answer all questions to the best of your knowledge. There are no wrong responses to any of these statements. All responses are completely confidential. Thank you for your participation. Instructions:
1) There are two (2) sections in this questionnaire. Please answer ALL questions in ALL sections.
2) Completion of this form will take you approximately 10 to 20 minutes. 3) The contents of this questionnaire will be kept strictly confidential.
Section A: Demographic Profile In this section, we are interested in your background in brief. Please tick your answer and your answers will be kept strictly confidential. QA1: Gender: Female Male QA2: Age: 18 - 25 years old 26 - 35 years old 36 - 45 years old 46 - 55 years old 56 years old and above QA3: Marital status: Single Married QA4: Highest level of academic qualification:
Primary Secondary Diploma/Advanced Diploma Bachelor Degree/Professional Qualification Master Degree PhD Degree
QA5: Employment status:
Employed Unemployed Student Retired Others, please specify __________
QA6: Personal Income:
Below RM1000 RM1001 – RM2000
RM2001 – RM3000 RM3001 – RM4000

Purchase Intention, Automobile, SEM
Page 77 of 92
RM4001 – RM5000 More than RM5001 QA7: Do you know about the Toyota car crisis that happened in year 2009? YES / NO Section B: Factors that influence you to purchase Toyota car This section is seeking your opinion regarding the factors that influence your purchase intention toward Toyota car. Please indicate the extent to which you agreed or disagreed with each statement using 5 points Likert scale [ (1) = strongly disagree; (2) = disagree; (3) = neutral; (4) = agree; (5) = strongly agree ] response framework. Please circle one number per line to indicate the extent to which you agree or disagree with the following statements.
No Questions
Stro
ngly
D
isagr
ee
Disa
gree
Neu
tral
Agr
ee
Stro
ngly
A
gree
IV1 Perceived Service Quality
SQ1 Employees of Toyota corporation always perform good quality car services for their customers.
1 2 3 4 5
SQ2 Employees of Toyota corporation show high responsiveness towards customers’ requests when servicing their cars.
1 2 3 4 5
SQ3 Customers are very confidence with the car service provided by Toyota. 1 2 3 4 5
SQ4 Employees of Toyota corporation show their caring to the customers when servicing their cars. 1 2 3 4 5
SQ5 Employees of Toyota always find out the cars’ problems and able to solve the problem in short time. 1 2 3 4 5
No Questions
Stro
ngly
D
isagr
ee
Disa
gree
Neu
tral
Agr
ee
Stro
ngly
A
gree
IV2 Perceived Product Quality
PQ1 Toyota car has the best performance on the road. 1 2 3 4 5
PQ2 Toyota car has the best outlook. 1 2 3 4 5
PQ3 Toyota car features fulfill all my expectation on product quality. 1 2 3 4 5
PQ4 Toyota car's part and accessories are very durable. (eg: engine, headlights & more) 1 2 3 4 5
PQ5 Toyota Corporation provides the trustable warranties to the car owner. 1 2 3 4 5

Purchase Intention, Automobile, SEM
Page 78 of 92
No Questions
Stro
ngly
D
isagr
ee
Disa
gree
Neu
tral
Agr
ee
Stro
ngly
A
gree
IV3 Perceived Price Fairness
PF1 The price of the new Toyota car is reasonable. 1 2 3 4 5
PF2 Every customer pays the same price when they buy car from any Toyota car dealer. (no discrimination of price) 1 2 3 4 5
PF3 Toyota car is not overpriced. 1 2 3 4 5
PF4 The price of the Toyota car is acceptable compared to other car brands. 1 2 3 4 5
PF5 There is no abuse of market power in Toyota cars price setting. 1 2 3 4 5
No Questions
Stro
ngly
D
isagr
ee
Disa
gree
Neu
tral
Agr
ee
Stro
ngly
A
gree
IV4 Customer Satisfaction
CS1 I am very satisfied with my Toyota car’s overall performance. 1 2 3 4 5
CS2 I believe that I make a good decision in purchasing Toyota car. 1 2 3 4 5
CS3 I will spread positive word of mouth about Toyota car to my relatives and friends. 1 2 3 4 5
CS4 I will choose Toyota car when I want to buy car in the future. 1 2 3 4 5
No Questions
Stro
ngly
D
isagr
ee
Disa
gree
Neu
tral
Agr
ee
Stro
ngly
A
gree
IV5 Trust
T1 I believed that Toyota Corporation is competent at what it is doing. 1 2 3 4 5
T2 I believed that Toyota Corporation is trustworthy. 1 2 3 4 5
T3 I believed that Toyota Corporation has very high integrity. 1 2 3 4 5
T4 I believed that Toyota Corporation is very responsible to customers. 1 2 3 4 5

Purchase Intention, Automobile, SEM
Page 79 of 92
No Questions
Stro
ngly
D
isagr
ee
Disa
gree
Neu
tral
Agr
ee
Stro
ngly
A
gree
DV Purchase Intention
DV1 I intend to purchase a Toyota car in the near future. 1 2 3 4 5
DV2 I search for information about Toyota car from time to time. 1 2 3 4 5
DV3 I always talk about Toyota car with my friends. 1 2 3 4 5
DV4 I like to compare Toyota car to others car brands from time to time. 1 2 3 4 5
DV5 I believed that Toyota car is the most suitable car for me to buy. 1 2 3 4 5

Purchase Intention, Automobile, SEM
Page 80 of 92
(Appendix 4.1)
4.1 Descriptive Analysis
4.1.1 Respondents Demographic Profile There are seven questions being asked to collect information on gender, age,
marital status, highest education level, employment status, income level and
awareness of Toyota crisis.
4.1.1.1 Gender Table 4.1 Frequency Table of Gender
Gender
Frequency Percent Valid Percent
Cumulative Percent
Valid Female 107 29.7 29.7 29.7
Male 253 70.3 70.3 100.0
Total 360 100.0 100.0
Source: Developed for the research
Figure 4.1 Percentage of Respondents Based on Gender
Source: Developed for the research
29.70%
70.30%
Gender
Female
Male

Purchase Intention, Automobile, SEM
Page 81 of 92
Based on the result, out of the total 360 respondents, it was reported that the
majority of the respondents for this research are males in which there is a total
of 253 respondents (70%). As for the remaining 30% are consists of 107
female respondents.
4.1.1.2 Age of Respondents
Table 4.2 Frequency Table of Age of Respondents
Age of respondents
Frequency Percent Valid Percent
Cumulative Percent
Valid 18 - 25 years old 29 8.1 8.1 8.1
26 - 35 years old 63 17.5 17.5 25.6
36 - 45 years old 97 26.9 26.9 52.5
46 - 55 years old 125 34.7 34.7 87.2
56 years old and above 46 12.8 12.8 100.0
Total 360 100.0 100.0
Source: Developed for the research
Figure 4.2 Percentage of Respondents Based on Age of Respondents
Source: Developed for the research
8.10%
17.50%
26.90%
34.70%
12.80%
0.00%
5.00%
10.00%
15.00%
20.00%
25.00%
30.00%
35.00%
40.00%
18 - 25 yearsold
26 - 35 yearsold
36 - 45 yearsold
46 - 55 yearsold
56 years oldand above
Age

Purchase Intention, Automobile, SEM
Page 82 of 92
From the result generated, most of the respondents are in the ages of 46 to 55
years old that consist of 34.7% (125 respondents). This following by ages 36
to 45 years (26.9%), 26 to 35 years old (17.5%), 50 years old and above
(12.6%) and 18 to 25 years old (8.1%).
4.1.1.3 Marital Status
Table 4.3 Frequency Table of Marital Status
Marital status
Frequency Percent Valid Percent
Cumulative Percent
Valid Single 154 42.8 42.8 42.8
Married 206 57.2 57.2 100.0
Total 360 100.0 100.0
Source: Developed for the research
Figure 4.3 Percentage of Respondents Based on Marital Status
Source: Developed for the research
42.80%
57.20%
Marital Status
Single
Married

Purchase Intention, Automobile, SEM
Page 83 of 92
Marital status is part of demography. Based on the result, 57.2% or 206 of the
respondents are married and 42.8% or 154 of the respondents are still single.
4.1.1.4 Education Level
Table 4.4 Frequency Table of Education Level
Education Level
Frequency Percent Valid Percent
Cumulative Percent
Valid Primary 50 13.9 13.9 13.9
Secondary 130 36.1 36.1 50.0
Diploma/Advanced Diploma
66 18.3 18.3 68.3
Bachelor Degree/Professional Qualification
78 21.7 21.7 90.0
Master Degree 29 8.1 8.1 98.1
PhD Degree 7 1.9 1.9 100.0
Total 360 100.0 100.0
Source: Developed for the research
Figure 4.4 Percentage of Respondents Based on Education Level
13.90%
36.10%
18.30%
21.70%
8.10%
1.90%
Education Level Primary
Secondary
Diploma/AdvancedDiploma
BachelorDegree/ProfessionalQualification

Purchase Intention, Automobile, SEM
Page 84 of 92
Source: Developed for the research
From the pie chart shown, most of the respondents are at the level of
secondary which registered 36.1% while only 1.9% are at Doctor of
Philosophy (PhD) degree holders. The second highest is Bachelor degree or
professional qualification holders which made up 21.7% of all the respondents.
Thirdly, 18.3% are from Diploma or Advanced Diploma holders and 13.9%
are from primary education level. Data is derived from 360 respondents of
Toyota owners.
4.1.1.5 Employment Status
Table 4.5 Frequency Table of Employment Status Employment Status
Frequency Percent Valid Percent
Cumulative Percent
Valid Employed 282 78.3 78.3 78.3
Unemployed 17 4.7 4.7 83.1
Student 12 3.3 3.3 86.4
Retired 40 11.1 11.1 97.5
Other 9 2.5 2.5 100.0
Total 360 100.0 100.0
Source: Developed for the research

Purchase Intention, Automobile, SEM
Page 85 of 92
Figure 4.5 Percentage of Respondents Based on Employment Status
Source: Developed for research
From the data we gathered, we have found out that there are 78.3% of the
respondents are employees and 11.1% are retired. Respondents that are
student and other status are relatively low, which consists of 3.3% and 2.5%.
4.1.1.6 Income Level
Table 4.6 Frequency Table of Income Level
Income Level
Frequency Percent Valid Percent
Cumulative Percent
Valid Below RM1000 68 18.9 18.9 18.9
RM1001 - RM2000 57 15.8 15.8 34.7
RM2001 - RM3000 120 33.3 33.3 68.1
RM3001 - RM4000 71 19.7 19.7 87.8
RM4001 - RM5000 33 9.2 9.2 96.9
More than RM5001 11 3.1 3.1 100.0
Total 360 100.0 100.0
Source: Developed for the research
78.30%
4.70% 3.30%
11.10%
2.50%
Employment Status
Employed
Unemployed
Student
Retired
Other

Purchase Intention, Automobile, SEM
Page 86 of 92
Figure 4.6 Percentages of Respondents Based on Income Level
Source: Developed for the research
The bar chart has showed that there are 120 out of 360 respondents are within
the range of RM2001 to RM3000. This group of people consists of highest
percentages. The second highest is RM3001 to RM4000 in which 71
respondents are within the range. Followed by 68 respondents are below
RM1000. The lowest percentages of respondents’ income level are more than
RM5001 which consist of only 3.1%.
4.1.1.7 Awareness of Toyota Crisis
Table 4.7: Frequency Table of Respondents Aware of Toyota Crisis
18.90% 15.80%
33.30%
19.70%
9.20%
3.10%
0.00%
5.00%
10.00%
15.00%
20.00%
25.00%
30.00%
35.00%
BelowRM1000
RM1001 -RM2000
RM2001 -RM3000
RM3001 -RM4000
RM4001 -RM5000
More thanRM5001
Income Level
Aware of Toyota Crisis
Frequency Percent Valid Percent
Cumulative Percent
Valid Yes 236 65.6 65.6 65.6
No 124 34.4 34.4 100.0
Total 360 100.0 100.0

Purchase Intention, Automobile, SEM
Page 87 of 92
Source: Developed for the research
Figure 4.7: Percentages of Respondents Aware of Toyota Crisis
Source: Developed for the research
From 360 respondents who responded to our survey, 65.6% respondents are
aware about Toyota crisis and 34.4% respondents are not.
65.60%
34.40%
Aware of Toyota Crisis
Yes
No

Purchase Intention, Automobile, SEM
Page 88 of 92
4.2 Inferential Analysis
4.2.1 Maximum Likelihood Estimates
Table 4.8: Regression Weights: (All Group - Default model)
Estimate S.E. C.R. P PPQ <--- PSQ .721 .041 17.390 *** PPF <--- PPQ .992 .064 15.455 *** Customer Satisfaction <--- PPQ .309 .136 2.271 .023 Customer Satisfaction <--- PSQ .316 .075 4.191 *** Customer Satisfaction <--- PPF .243 .064 3.819 *** Trust <--- Customer Satisfaction 1.132 .061 18.586 *** Purchase Intention <--- Trust 1.028 .054 18.956 *** SQ5 <--- PSQ 1.000 SQ4 <--- PSQ .987 .047 21.042 *** SQ3 <--- PSQ .897 .048 18.739 *** SQ2 <--- PSQ .961 .047 20.442 *** SQ1 <--- PSQ .811 .040 20.241 *** PF5 <--- PPF 1.000 PF4 <--- PPF .997 .057 17.635 *** PF3 <--- PPF 1.037 .059 17.594 *** PF2 <--- PPF 1.016 .061 16.653 *** PF1 <--- PPF .931 .055 16.893 *** DV1 <--- Purchase Intention 1.000 DV2 <--- Purchase Intention 1.044 .052 20.001 *** DV3 <--- Purchase Intention 1.012 .050 20.355 *** DV4 <--- Purchase Intention .991 .050 19.937 *** DV5 <--- Purchase Intention 1.175 .046 25.321 *** CS2 <--- Customer Satisfaction 1.222 .061 20.099 *** CS1 <--- Customer Satisfaction 1.000 CS3 <--- Customer Satisfaction 1.289 .065 19.943 *** T3 <--- Trust .922 .053 17.450 *** T4 <--- Trust 1.000 T1 <--- Trust .871 .048 18.275 *** PQ2 <--- PPQ 1.003 .065 15.484 *** PQ3 <--- PPQ 1.101 .059 18.669 *** PQ1 <--- PPQ 1.000
a. ***. Significantly different from zero at the .001 level (two-tailed).
b. *. Significantly different from zero at the .05 level (two-tailed).
Source: Developed for the research

Purchase Intention, Automobile, SEM
Page 89 of 92
Table 4.9: Standardized Regression Weights: (All Group - Default model)
Estimate PPQ <--- PSQ .930 PPF <--- PPQ .893 Customer Satisfaction <--- PPQ .316 Customer Satisfaction <--- PSQ .417 Customer Satisfaction <--- PPF .277 Trust <--- Customer Satisfaction .991 Purchase Intention <--- Trust .948 SQ5 <--- PSQ .836 SQ4 <--- PSQ .870 SQ3 <--- PSQ .810 SQ2 <--- PSQ .855 SQ1 <--- PSQ .850 PF5 <--- PPF .794 PF4 <--- PPF .828 PF3 <--- PPF .827 PF2 <--- PPF .793 PF1 <--- PPF .802 DV1 <--- Purchase Intention .876 DV2 <--- Purchase Intention .807 DV3 <--- Purchase Intention .815 DV4 <--- Purchase Intention .805 DV5 <--- Purchase Intention .908 CS2 <--- Customer Satisfaction .845 CS1 <--- Customer Satisfaction .832 CS3 <--- Customer Satisfaction .841 T3 <--- Trust .789 T4 <--- Trust .813 T1 <--- Trust .815 PQ2 <--- PPQ .726 PQ3 <--- PPQ .828 PQ1 <--- PPQ .823

Purchase Intention, Automobile, SEM
Page 90 of 92
Table 4.10: Standardized Total Effects (All Group - Default model)
PSQ PPQ PPF Customer Satisfaction Trust Purchase
Intention PPQ .930 .000 .000 .000 .000 .000 PPF .831 .893 .000 .000 .000 .000 Customer Satisfaction .941 .563 .277 .000 .000 .000 Trust .932 .558 .274 .991 .000 .000 Purchase Intention .884 .529 .260 .939 .948 .000 t4 .757 .453 .223 .805 .813 .000 t3 .735 .440 .216 .782 .789 .000 t1 .759 .454 .223 .807 .815 .000 cs2 .795 .476 .234 .845 .000 .000 cs1 .782 .468 .230 .832 .000 .000 cs3 .791 .473 .233 .841 .000 .000 dv5 .803 .480 .236 .853 .861 .908 dv4 .712 .426 .209 .756 .763 .805 dv3 .720 .431 .212 .765 .772 .815 dv2 .713 .426 .209 .758 .765 .807 dv1 .774 .463 .227 .823 .831 .876 pf1 .666 .716 .802 .000 .000 .000 pf2 .659 .708 .793 .000 .000 .000 pf3 .687 .738 .827 .000 .000 .000 pf4 .688 .739 .828 .000 .000 .000 pf5 .660 .709 .794 .000 .000 .000 pq1 .765 .823 .000 .000 .000 .000 pq2 .676 .726 .000 .000 .000 .000 pq3 .771 .828 .000 .000 .000 .000 sq1 .850 .000 .000 .000 .000 .000 sq2 .855 .000 .000 .000 .000 .000 sq3 .810 .000 .000 .000 .000 .000 sq4 .870 .000 .000 .000 .000 .000 sq5 .836 .000 .000 .000 .000 .000
PSQ= Perceived service quality PPQ=Perceived product quality; PPF=Perceived price fairness Items: DV1-DV5=Purchase intention, T1-T4=Trust, CS1-CS3=Customer satisfaction,
PF1-PF5=Perceived price fairness, PQ1-PQ3=Perceived product quality, SQ1-SQ5=Perceived service quality
Source: Developed for the research

Purchase Intention, Automobile, SEM
Page 91 of 92
Table 4.11: Standardized Direct Effects (All Group - Default model)
PSQ PPQ PPF Customer Satisfaction Trust Purchase
Intention PPQ .930 .000 .000 .000 .000 .000 PPF .000 .893 .000 .000 .000 .000 Customer Satisfaction .417 .316 .277 .000 .000 .000 Trust .000 .000 .000 .991 .000 .000 Purchase Intention .000 .000 .000 .000 .948 .000 t4 .000 .000 .000 .000 .813 .000 t3 .000 .000 .000 .000 .789 .000 t1 .000 .000 .000 .000 .815 .000 cs2 .000 .000 .000 .845 .000 .000 cs1 .000 .000 .000 .832 .000 .000 cs3 .000 .000 .000 .841 .000 .000 dv5 .000 .000 .000 .000 .000 .908 dv4 .000 .000 .000 .000 .000 .805 dv3 .000 .000 .000 .000 .000 .815 dv2 .000 .000 .000 .000 .000 .807 dv1 .000 .000 .000 .000 .000 .876 pf1 .000 .000 .802 .000 .000 .000 pf2 .000 .000 .793 .000 .000 .000 pf3 .000 .000 .827 .000 .000 .000 pf4 .000 .000 .828 .000 .000 .000 pf5 .000 .000 .794 .000 .000 .000 pq1 .000 .823 .000 .000 .000 .000 pq2 .000 .726 .000 .000 .000 .000 pq3 .000 .828 .000 .000 .000 .000 sq1 .850 .000 .000 .000 .000 .000 sq2 .855 .000 .000 .000 .000 .000 sq3 .810 .000 .000 .000 .000 .000 sq4 .870 .000 .000 .000 .000 .000 sq5 .836 .000 .000 .000 .000 .000
PSQ= Perceived service quality PPQ=Perceived product quality; PPF=Perceived price fairness Items: DV1-DV5=Purchase intention, T1-T4=Trust, CS1-CS3=Customer satisfaction,
PF1-PF5=Perceived price fairness, PQ1-PQ3=Perceived product quality, SQ1-SQ5=Perceived service quality
Source: Developed for the research

Purchase Intention, Automobile, SEM
Page 92 of 92
Table 4.12: Standardized Indirect Effects (All Group - Default model)
PSQ PPQ PPF Customer Satisfaction Trust Purchase
Intention PPQ .000 .000 .000 .000 .000 .000 PPF .831 .000 .000 .000 .000 .000 Customer Satisfaction .524 .247 .000 .000 .000 .000 Trust .932 .558 .274 .000 .000 .000 Purchase Intention .884 .529 .260 .939 .000 .000 t4 .757 .453 .223 .805 .000 .000 t3 .735 .440 .216 .782 .000 .000 t1 .759 .454 .223 .807 .000 .000 cs2 .795 .476 .234 .000 .000 .000 cs1 .782 .468 .230 .000 .000 .000 cs3 .791 .473 .233 .000 .000 .000 dv5 .803 .480 .236 .853 .861 .000 dv4 .712 .426 .209 .756 .763 .000 dv3 .720 .431 .212 .765 .772 .000 dv2 .713 .426 .209 .758 .765 .000 dv1 .774 .463 .227 .823 .831 .000 pf1 .666 .716 .000 .000 .000 .000 pf2 .659 .708 .000 .000 .000 .000 pf3 .687 .738 .000 .000 .000 .000 pf4 .688 .739 .000 .000 .000 .000 pf5 .660 .709 .000 .000 .000 .000 pq1 .765 .000 .000 .000 .000 .000 pq2 .676 .000 .000 .000 .000 .000 pq3 .771 .000 .000 .000 .000 .000 sq1 .000 .000 .000 .000 .000 .000 sq2 .000 .000 .000 .000 .000 .000 sq3 .000 .000 .000 .000 .000 .000 sq4 .000 .000 .000 .000 .000 .000 sq5 .000 .000 .000 .000 .000 .000
PSQ= Perceived service quality PPQ=Perceived product quality; PPF=Perceived price fairness Items: DV1-DV5=Purchase intention, T1-T4=Trust, CS1-CS3=Customer satisfaction,
PF1-PF5=Perceived price fairness, PQ1-PQ3=Perceived product quality, SQ1-SQ5=Perceived service quality
Source: Developed for the research