missouri’s agricultural use values — a review of …pprc.umsl.edu/pprc.umsl.edu/data/mo ag...
TRANSCRIPT
PUBLIC POLICY RESEARCH CENTER
UNIVERSITY OF MISSOURI - ST. LOUIS
Missouri’s Agricultural Use Values —A Review of Their History and Effects
Written by:Colleen Bradford and Steven M. Gardner
Report Prepared forMissouri Growth Association
Presented to The State Tax Commission of MissouriDecember 9, 2005
One University Boulevard . St. Louis. Missouri . 63121. Phone 314.516.5273. FAX 314.516.5268

Acknowledgements This report was prepared under contract between the Public Policy Research Center at the University of Missouri – St. Louis and the Missouri Growth Association. The financing of the contract came from the Missouri Growth Association and the Home Builders Association of St. Louis and Eastern Missouri. The contract included the clause:
“Independent Contractor. The parties intend Contractor to be an independent contractor in the performance of these services. Contractor shall have the sole right to determine and control the method and means of performing these services. Both the Contractor and Client shall have the right to retain any data or other materials obtained in the process of performing the contract and make use of the results.”
Updated April 2006

Public Policy Research Center Page 1 University of Missouri-St. Louis December 9, 2005
I. Introduction
The purpose of this report is to examine trends in agricultural use-values, assessments and tax burdens over the past 20 years. The report does not attempt to develop an alternate methodology for establishing use-values or to critique an existing one. The University of Missouri’s Department of Agricultural Economics (UMC) has provided expert advice to the State Tax Commission of Missouri (STC), since 1982. This report takes the calculations of UMC as one of several input sources.
Constitutional and statutory changes first required that use-values become the method for valuing agricultural property in Missouri, effective in 1985. The current statutory specification for how these values are determined appears in Section 137.021 RSMo. The statute provides that the STC will promulgate a value for each of the grades of agricultural and horticultural land that based on soil surveys, soil productivity indexes, production costs, crop yields, appropriate capitalization rates and other factors pertinent to productive capability. The legislature has thereby provided the STC with a ministerial, not policymaking task, though one requiring appropriate discretion. The statute specifically suggests that all pertinent data may come from UMC, though there is no requirement that the STC seek or comply with UMC’s advice. To what extent the STC uses other information pertinent to productive capability is unknown. Other input used in the past is not particularly relevant to our current purpose because our intent is to examine outcomes, not evaluate all inputs.
II. Research Questions This report addresses each of the following questions in its own section:
1. What changes has UMC applied to its methodology over the last 20 years and how do these alterations affect the subsequent UMC values?
2. How do adopted STC values compare to productivity values calculated by UMC? 3. How do the productivity values calculated by UMC and those adopted by the STC compare
to other pertinent indicators of productive capability? 4. What is the effect of adopted values on assessments? 5. What are the effects of resulting assessments on the tax burden for agricultural property and
the other subclasses of real property? III. Methodological History
Before 1985, assessments for agricultural real property were one-third of its market value, by law. However, the first statewide reassessment in 1985 required assessing agricultural property on its productive, or use, value rather than market value. The STC commissioned UMC to recommend an appropriate methodology and values. In late 1982, UMC (Ervin and Nolte 1982) provided a report recommending a method of complying with the new requirements and provided resulting use-values. The first reassessment in 1985 used these same values. Subsequently, UMC continued to provide recalculated values at the STC’s request.
The first change in UMC’s procedure reflected the growing significance of supported price levels in agricultural income. From 1987 through 1995, UMC reports supplied two values for each grade of agricultural property, one based on supported prices and another on unsupported prices. This provided the STC with a range of values to consider. In the 1990s, UMC began to express some concerns with the current approach in part due to the effects of not re-examining some of the initial assumptions of 1982. In 1996, Dr. Kevin Moore recommended a change in the procedure for calculating use-values, one that all subsequent UMC reports follow. The new approach uses the change in cash rental rates to signify the relative change in net revenue from period to period. This method required the adoption of values from a base year. Subsequent calculations use 1993’s figures
Public Policy Research Center Page 2 University of Missouri-St. Louis December 9, 2005
for net crop revenue based on unsupported prices (also referred to as normal net return per acre) as the base year. Adopting a base using only unsupported values, means that all subsequent values are lower than if using supported values or a mid-point. On the other hand, the movement of cash rents implicitly captures the effect of ongoing revenue and cost changes regardless of the source. For the data used throughout the report for STC adopted values, UMC recommended values and UMC recalculated values, see Table 1 in the Appendix. For a complete summary of the development of use-values since 1982, see Table 2 and the Summary of the History of Assessment of Agricultural Real Estate in Missouri (1982-2005) in the Appendix.
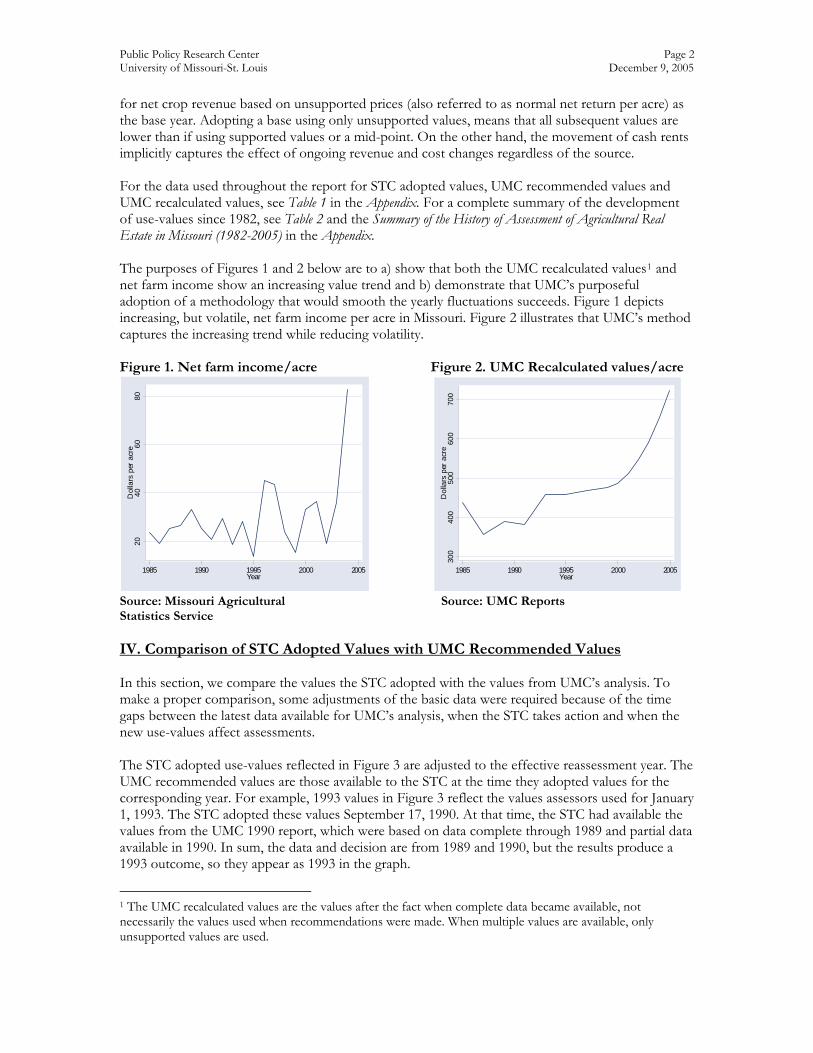
The purposes of Figures 1 and 2 below are to a) show that both the UMC recalculated values1 and net farm income show an increasing value trend and b) demonstrate that UMC’s purposeful adoption of a methodology that would smooth the yearly fluctuations succeeds. Figure 1 depicts increasing, but volatile, net farm income per acre in Missouri. Figure 2 illustrates that UMC’s method captures the increasing trend while reducing volatility. Figure 1. Net farm income/acre Figure 2. UMC Recalculated values/acre
2040
6080
Dol
lars
per
acr
e
1985 1990 1995 2000 2005Year
300
400
500
600
700
Dol
lars
per
acr
e
1985 1990 1995 2000 2005Year
Source: Missouri Agricultural Source: UMC Reports Statistics Service IV. Comparison of STC Adopted Values with UMC Recommended Values
In this section, we compare the values the STC adopted with the values from UMC’s analysis. To make a proper comparison, some adjustments of the basic data were required because of the time gaps between the latest data available for UMC’s analysis, when the STC takes action and when the new use-values affect assessments. The STC adopted use-values reflected in Figure 3 are adjusted to the effective reassessment year. The UMC recommended values are those available to the STC at the time they adopted values for the corresponding year. For example, 1993 values in Figure 3 reflect the values assessors used for January 1, 1993. The STC adopted these values September 17, 1990. At that time, the STC had available the values from the UMC 1990 report, which were based on data complete through 1989 and partial data available in 1990. In sum, the data and decision are from 1989 and 1990, but the results produce a 1993 outcome, so they appear as 1993 in the graph.
1 The UMC recalculated values are the values after the fact when complete data became available, not necessarily the values used when recommendations were made. When multiple values are available, only unsupported values are used.

Public Policy Research Center Page 3 University of Missouri-St. Louis December 9, 2005
For actions relevant to reassessment years 1989 through 1999, UMC values for soil grades 1-5 provided a range of values (based on supported and unsupported prices). We used a midpoint to reflect UMC values. The report excludes values for grade 8 land since UMC no longer provides these values. During our analysis, we compared results using medians with results using averages and found no difference in trends, so we use averages.
Figure 3. STC Use-Values (Average of Soil Grades 1-7) Compared to Average UMC Recommended Use-Values (Average of Soil Grades 1-7)
350
400
450
500
550
600
650
700
750
Dol
lars
1985 1987 1989 1991 1993 1995 1997 1999 2001 2003 2005 2007Year
STC Average Use-Values UMC Average Use-Values
There are several observations worthy of note from Figure 3. For the first two reassessment cycles, 1985 and 1987, the STC chose use-values equal to those recommended by UMC. For the reassessment years 1989 and 1991, the STC opted for no change, while UMC values called for modest decreases. 1989 and 1991 were among the years when UMC reports provided both unsupported and unsupported values. Therefore, while the values the STC adopted for 1989 and 1991 were somewhat above the UMC average values, most of the values adopted by the STC were within the overall range, or very close to it. By 1993, UMC’s values exceeded those adopted by the STC, a pattern that has continued since. In 1993 and 1995, the difference was only 2 to 3%. In 1995, the STC took action (effective for the 2007 reassessment) to raise their values, but did not bring values up to UMC’s calculated levels. Since the 1997 reassessment year, the STC has not changed use-values while UMC values continued to rise, creating a generally widening gap between UMC and STC values. In 2001, UMC’s values were 14% higher than the STC’s values; in 2003 they were 11% higher; and in 2005 UMC’s values were 25% higher. The values from the new 2005 UMC report are 58% greater than values used in the 2005 reassessment, easily the largest gap in Missouri’s history of assessment by use-value.

Public Policy Research Center Page 4 University of Missouri-St. Louis December 9, 2005
V. Comparing STC’s values and UMC’s calculations with other indicators of value
The USDA supplies separate market values for cropland and pastureland for each state since 1997. Market values are not the equivalent of use-values. They respond to factors other than agricultural costs and revenues and are more volatile (UMC 2005). However, the same report suggests that changes in market value are a very useful comparison because changes in market value can confirm other indicators of use value change. In this section, we first compare UMC’s values since 1997 with the corresponding USDA values to confirm the correlation suggested by UMC, then make the same comparison to STC values.
A. Comparison to UMC Recalculated Values: Figures 4 and 5 examine the trends of farmland
values since 1997 by comparing UMC’s final values with USDA market values.2
Figure 4. UMC Recalculated Use-Values for Cropland (Average of soil grades 1- 4) compared to USDA Cropland Values (1997-2005)*
500
1000
1500
2000
Dol
lars
per
acr
e
1997 1998 1999 2000 2001 2002 2003 2004 2005Year
U SDA cropland UM C average c ropland
Figure 5. UMC Recalculated Use-Values for Pastureland Average of soil grades (5-7) compared to USDA Pastureland Values 1997-2005)*
020
040
060
080
010
0012
00D
olla
rs p
er a
cre
1997 1998 1999 2000 2001 2002 2003 2004 2005Year
U SDA p as ture UMC average pasture
2 The UMC recalculated values, rather than the original recommended values, are used because these graphs are intended to evaluate actual outcomes. They differ from recommended UMC values because they incorporate more complete data. The graphs begin in the year 1997 because data isolating cropland from pastureland values from USDA began in 1997.

Public Policy Research Center Page 5 University of Missouri-St. Louis December 9, 2005
As expected, UMC’s use-values are lower than USDA’s market values over this period. Additionally, as expected, the trend of UMC values correlates to those of the USDA, though UMC’s values trail the USDA’s, which do not use multiple years of historic data. This delay is inherent in the UMC methodology that incorporates multiple years of historical data. The gap between USDA values and values reported by UMC has grown – whether this entire gap is due to the mentioned delay is not determined. Somewhat unexpectedly, the market values reported by the USDA do not show the expected volatility. However, had the data been available for a longer period (especially if it included the period between 1982 and 1989) we might have seen more dramatic fluctuations. Finally, both indicators of value show that farmland values have constantly increased in this period. While USDA figures for cropland values increased by 82% and pastureland values increased by 91% from 1997-2005, UMC recalculated values for cropland increased by 55% and UMC figures for pastureland increased by 58%.
B. Comparison to STC adopted values
In this subsection, we examine the trend of USDA values to STC adopted values for cropland and pastureland compared to USDA figures since 1997.
Figure 6. STC Use-Values for Cropland (average of soil grades 1-4) Compared to USDA
Cropland Values (1997-2005)*
500
1000
1500
2000
Dol
lars
per
acr
e
1997 1998 1999 2000 2001 2002 2003 2004 2005Year
STC average crop la nd USDA cropland
Figure 7. STC Use-Values for Pastureland (average of soil grades 5-7) compared to USDA Pastureland Values (1997-2005)*
020
040
060
080
010
0012
00D
olla
rs p
er a
cre
1997 1998 1999 2000 2001 2002 2003 2004 2005Year
STC average pasture USD A pasture
*Sources for Figures 4,5,6 and 7: State Tax Commission Annual Reports (1984-2003) and USDA National Agricultural Statistics Service (2005)
Since STC values have not changed during a period when USDA calculated values have constantly increased, the result is an ever-widening gap.

Public Policy Research Center Page 6 University of Missouri-St. Louis December 9, 2005
VI. Assessed Value of Agricultural Land compared to USDA Land Values We now begin examining outcomes of the STC adopted use-values – in this section, the resulting assessments. First, we examine whether the quantity of farmland has an appreciable effect on total assessments. The following graph (Figure 8) demonstrates that the quantity of farmland in Missouri has decreased only by only 3.5% since 1985.
Figure 8. Millions of acres of farmland in Missouri
2527
2931
3335
Milli
ons
of A
cres
1985 1987 1989 1991 1993 1995 1997 1999 2001 2003 2005Year
Source: Missouri Agricultural Statistics Service (2005)
The total farmland has decreased in some periods and increased in others. Therefore, we can assume that assessment changes are primarily the result of the STC’s use-values, changes in improvements and adjustments by assessors.
Figure 9 compares the total assessed value of the agricultural subclass of real property in Missouri (which includes land and improvements, but not the dwelling, which is classified as residential property) to USDA figures for the value of land and buildings (including the dwelling).3
Figure 9. Comparing Missouri Assessments to a Comparable USDA Value:
1000
2000
3000
4000
5000
Mill
ions
of d
olla
rs
1985 1987 1989 1991 1993 1995 1997 1999 2001 2003 2005Year
Total Assessed Value USDA Comparison Value
Sources: Missouri Agricultural Statistics Service and STC Annual Reports
3This value is also known by USDA as the farm real estate value, defined as, "the value at which all
land and buildings, including dwelling, could be sold under current market conditions.” This total real estate value (real estate value/acre multiplied by number of acres of farmland) is multiplied 12 percent to provide a USDA Comparison Value.

Public Policy Research Center Page 7 University of Missouri-St. Louis December 9, 2005
When viewing Figure 9, one expects the USDA line to be higher because it reflects market value (not use-value) and it includes dwellings. However, the expectation is that both lines would move in similar, though not exact, patterns. Taking into consideration time lags, the expected correlation appears only through 1987. Subsequently, Missouri’s assessments, while growing slowly, show an expanding gap between actual assessments and the comparison indicator of value. Since 1987, the comparison value has risen by 139%, while assessed values have increased by only 18%. Another means of portraying the same outcome is demonstrated in Figure 10, which portrays the percent that assessed value was of the comparison value over the evaluation period.
Figure 10. Assessed Value of Agriculture Subclass as a percent of the USDA Comparison Value (1985-2005)
3040
5060
70P
erce
nt
1985 1987 1989 1991 1993 1995 1997 1999 2001 2003 2005Year
Sources: Missouri Agricultural Statistics Service and Missouri State Tax Commission
The graph above paints a rather dramatic picture over the past 20 years. From a high of 72 percent in 1987 to a low of 27 percent in 2004, Missouri’s assessments are less and less comparable to this USDA indicator of value. VII. Effect on Tax Burden in Missouri
The ultimate outcome for examination is the relative tax burden borne by each subclasses of real property: agriculture, commercial and residential. We examined these outcomes using a variety of approaches. 4
4 Data concerning assessed values for the years 1984-2004 comes from the State Tax Commission. Necessary totals and percentages are calculations by the PPRC.

Public Policy Research Center Page 8 University of Missouri-St. Louis December 9, 2005
The following graph (Figure 11) shows the changing percent of the real property tax burden borne by Missouri’s agricultural real property.
Figure 11. Agriculture as a percent of Total Assessed Value of real property.
05
1015
Per
cent
of t
ax b
urde
n
1984 1988 1992 1996 2000 2004Year
Source: PPRC calculations based on STC assessment data.
In Figure 11, we observe three main points of interest. First, the impact of the 1985 reassessment combined with a new policy that valued farm real property based on use-valuation resulted in a substantial reduction in the tax burden on agricultural real property, from 13.6% to 7.66%. Second, another large reduction in agriculture’s share of the tax burden occurred between 1985 and 1987, from 7.66% to 5.3%. All sources of data indicate that agricultural values were dropping then, so the reduction from 1985 to 1987 conforms to other indicators. Of particular note is that the STC adopted three sets of values before applying a final set to the 1987 reassessment in an effort to maintain pace with this downtrend, hence not imposing the burden of old data on the agricultural sector. Third, the period from 1987 through 2003 shows that agriculture faces an ever-decreasing share of Missouri’s tax burden, now only 2.88% of all real property as of 2003, a drop of 46% in its relative share since 1987.

Public Policy Research Center Page 9 University of Missouri-St. Louis December 9, 2005
Another approach to examining the change in tax burden is to look at all three subclasses at once and measure the change in their burden from the base year of 1984 as seen in Figure 12.5
Figure 12. Illustration of Tax Burden Change: Percent Difference from base year 1984
in Total Assessed Value of Agricultural, Residential and Commercial Real Property.
-10
-50
510
Per
cent
Diff
eren
ce
1985 1989 1993 1997 2001 20051984 1987 1991 1995 1999 2003Year
Agricultural ResidentialCommercial
Source: STC Annual Reports (1984-2004)
Examine this graph within distinct periods. First, note the immediate impact of reassessment and policy change on the tax burdens from 1984 to 1985. The residential burden remained approximately constant. The agricultural burden fell dramatically, and that burden shifted to the commercial subclass to compensate. As noted previously, the agricultural burden fell significantly again in 1987 and the residential burden compensated. After 1987, the clearest trends are that agriculture continues to fall, while residential burdens continue to rise. Examining the commercial subclass burden is more complex. Overall, its share of the tax burden is now slightly less than in 1984, but considerably (about 6-7%) less than in 1985. However, the classification of some properties has changed during this period. In 1985, multi-family property and mobile home property were classified commercial; however, all multi-family and some mobile home property are now residential. Data to separate the effects is not available because the changes occurred over several years. Overall, the small reduction 5 For example, the year 1991’s percent value would equal the subclass’s 1991 percentage minus its 1984 percentage. A change of zero percent would indicate no change in the subclass’s value as a percent of the total assessed value of real property since 1984.
Public Policy Research Center Page 10 University of Missouri-St. Louis December 9, 2005
in the commercial burden, together with the large reduction in the agricultural burden is borne by an increase in the tax burden of the residential subclass. By the year 2004, the percent that the subclass of agriculture contributes to the total assessed vale of real property dropped by from 13.6% to 2.88% (almost 11%), meanwhile commercial dropped by 1.4% and residential rose by 12.2%, since the base year of 1984. VIII. Final Observations Ideally, the STC would set values for use in 2007 based on nearly complete 2006 information. However, Missouri statutes require setting values more than a year in advance of their application. The result is that use-values, regardless of the method used, can never be completely current. One question that occurred to us is whether it might be appropriate to use alternate approaches depending on the consistency of recent trends. For example, in the most recent years, all pertinent evidence shows a consistently rising trend in values. Perhaps in such a circumstance, the length of historical data could be reduced, so that the trend could be captured more readily and fully. This approach would have had the opposite effect in early years; that is the UMC recommended values would have declined faster. On the other hand, when there is volatility taking a longer set of data into account seems to provide more of a safety net. Even though by necessity UMC’s recommended values are made well in advance and are based on historical data, their calculated values generally track well with other value indicators. A review of actual value data, as opposed to the data available when decisions were made, suggests that agricultural assessments during the first two or three reassessments (1985-1989) may have been high. Similarly, the use of old data in the UMC method in recent years results in lower calculated values than final data indicates. One benefit of a consistent approach, though, is that values suggested by the UMC method will almost eventually even out. While they will trail an upward trend, they will also trail a downward trend. Of course, to the extent that the long-term trend is unidirectional, they will never fully catch up. A large, and rapidly growing, gap has formed between various indications of value and the STC’s current use-values. It seems reasonable to ask that the STC make a clear record of what information it uses and what method it applies to reach its conclusions. If the compilations of UMC are no longer considered as valuable as in the past, documentation of the STC’s new approach is desirable. Finally, in Missouri, the revenue that taxing jurisdictions may capture subsequent to each reassessment is limited. If any segment of taxable property achieves a reduced burden, other segments of the property tax base must compensate.
Public Policy Research Center Page 11 University of Missouri-St. Louis December 9, 2005
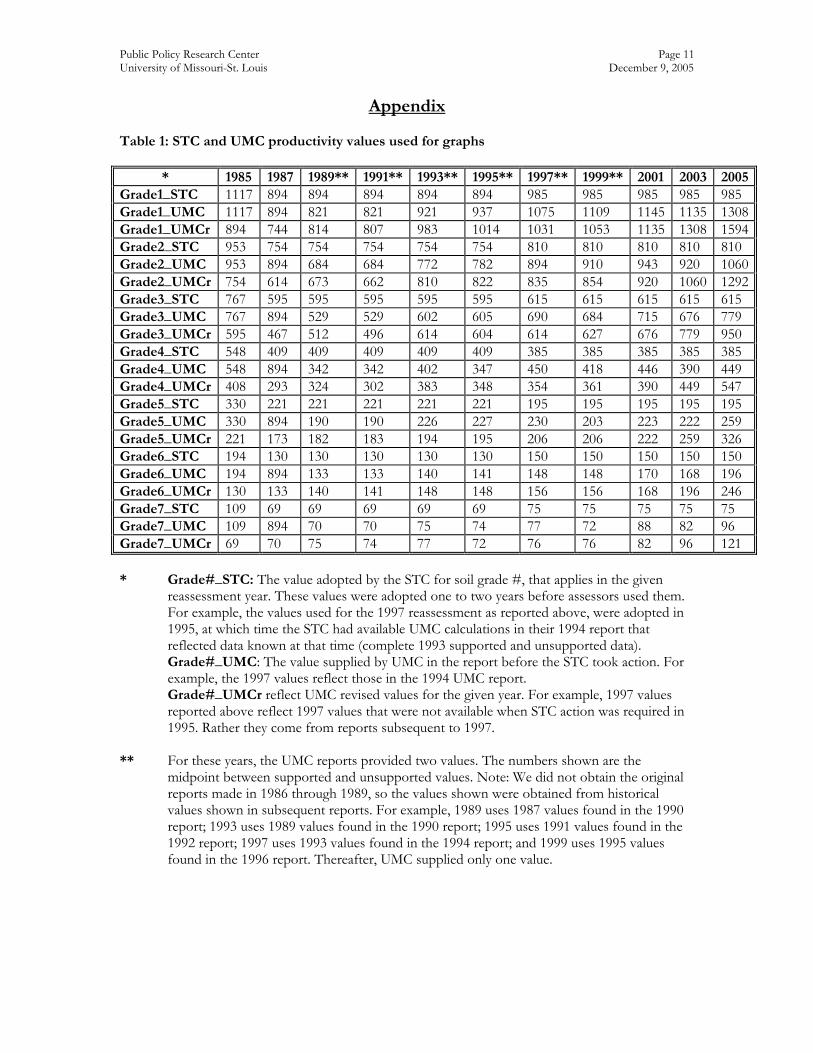
Appendix Table 1: STC and UMC productivity values used for graphs
* 1985 1987 1989** 1991** 1993** 1995** 1997** 1999** 2001 2003 2005Grade1_STC 1117 894 894 894 894 894 985 985 985 985 985 Grade1_UMC 1117 894 821 821 921 937 1075 1109 1145 1135 1308Grade1_UMCr 894 744 814 807 983 1014 1031 1053 1135 1308 1594Grade2_STC 953 754 754 754 754 754 810 810 810 810 810 Grade2_UMC 953 894 684 684 772 782 894 910 943 920 1060Grade2_UMCr 754 614 673 662 810 822 835 854 920 1060 1292Grade3_STC 767 595 595 595 595 595 615 615 615 615 615 Grade3_UMC 767 894 529 529 602 605 690 684 715 676 779 Grade3_UMCr 595 467 512 496 614 604 614 627 676 779 950 Grade4_STC 548 409 409 409 409 409 385 385 385 385 385 Grade4_UMC 548 894 342 342 402 347 450 418 446 390 449 Grade4_UMCr 408 293 324 302 383 348 354 361 390 449 547 Grade5_STC 330 221 221 221 221 221 195 195 195 195 195 Grade5_UMC 330 894 190 190 226 227 230 203 223 222 259 Grade5_UMCr 221 173 182 183 194 195 206 206 222 259 326 Grade6_STC 194 130 130 130 130 130 150 150 150 150 150 Grade6_UMC 194 894 133 133 140 141 148 148 170 168 196 Grade6_UMCr 130 133 140 141 148 148 156 156 168 196 246 Grade7_STC 109 69 69 69 69 69 75 75 75 75 75 Grade7_UMC 109 894 70 70 75 74 77 72 88 82 96 Grade7_UMCr 69 70 75 74 77 72 76 76 82 96 121 * Grade#_STC: The value adopted by the STC for soil grade #, that applies in the given
reassessment year. These values were adopted one to two years before assessors used them. For example, the values used for the 1997 reassessment as reported above, were adopted in 1995, at which time the STC had available UMC calculations in their 1994 report that reflected data known at that time (complete 1993 supported and unsupported data). Grade#_UMC: The value supplied by UMC in the report before the STC took action. For example, the 1997 values reflect those in the 1994 UMC report. Grade#_UMCr reflect UMC revised values for the given year. For example, 1997 values reported above reflect 1997 values that were not available when STC action was required in 1995. Rather they come from reports subsequent to 1997.
** For these years, the UMC reports provided two values. The numbers shown are the midpoint between supported and unsupported values. Note: We did not obtain the original reports made in 1986 through 1989, so the values shown were obtained from historical values shown in subsequent reports. For example, 1989 uses 1987 values found in the 1990 report; 1993 uses 1989 values found in the 1990 report; 1995 uses 1991 values found in the 1992 report; 1997 uses 1993 values found in the 1994 report; and 1999 uses 1995 values found in the 1996 report. Thereafter, UMC supplied only one value.

Public Policy Research Center Page 12 University of Missouri-St. Louis December 9, 2005
Table 2. History of STC rulings: Chapter 137 Sec. 137.021 ACTION DATE
12/13/83 10/17/84 11/15/85 9/31/86 11/8/88 9/17/90 10/13/92
Effective Date
3/12/84 4/11/85 5/11/86 12/1/86 12/31/88 2/14/91 6/7/93
Reassessment Application
1985 1987 1987 1987 1989 1993 1995
Annual Report
1983 1984 1985 1986 1988 1990 1992
UMC report 1982 * * * * 1990 1992 Most recent year of data
1982 1989 1991
ACTION DATE 9/15/94 11/15/96 12/28/99 12/31/01** 12/31/03** 12/05Effective Date 3/30/95 6/30/97 7/30/00 2003 2005 N/a Reassessment Application 1997 1999 2001 2003 2005 2007 Annual Report 1994 1996 1999 2001 2003 UMC report 1994 1996 1999 2001 2003 2005 Most recent year of data 1993 1995 1999 2001 2003 2005 *We did not obtain the original UMC reports from 1983 through 1989. Historical values from the 1990 report provided the values for the years between 1983 and 1989. **No amended regulation was adopted in 2001 or 2003 so previous use-values continued. Summary of the History of Assessment of Agricultural Real Property (1982-2005) Before 1985: Missouri law required the assessment of all agricultural real property at one-third of its market value. The law required the same of residential and commercial real property. However, poor assessment practices throughout Missouri led to the need for the general statewide reassessment of 1985 to reestablish a relationship between statutory requirements and actual assessments. Preparing for 1985: Missouri changed the statutory method for assessing agricultural property from a market value standard to a productive capability standard, to be effective as of January 1, 1985. To provide a basis for the new use values, the STC commissioned a report from UMC, delivered at the end of 1982. The methodology and values recommended were adopted in December 1983 and applied during the reassessment of 1985. UMC presented a study, which suggested implementation of a new methodology for these tax calculations. According to this study, market data for agricultural land was subject to a number of limitations when it was used to derive a taxable value, including the fact that farmland parcels vary in value based on size, proximity to services, and variation in improvements. Additionally, the farmland market has few and a mixture of sales per period. These authors opted to utilize an income capitalization approach to produce productive use-values. Net returns to agricultural land were found using crop yield data averaged over 20 years to remove weather influences and a modified six-year average of crop prices. The procedure also reflects input requirements. Soil in Missouri was divided in 8 grades based upon the Land Capability Classification system (LCC). Finally, a capitalization rate was calculated using a five-year average of the Federal Land Bank average farmland loan rate and applied to the net returns to suggest a range of use-values for each of the eight grades of soil found in Missouri agricultural land (Ervin and Nolte 1982).

Public Policy Research Center Page 13 University of Missouri-St. Louis December 9, 2005
1983: The original rule required by statute concerning the assessment of agricultural land based on
its productive or “use-value” is adopted with values that would apply on January 1, 1985. The values adopted reflect the midpoint of the range of values recommended by UMC’s 1982 report
1984: The STC begins the process of establishing values for implementation in 1987. Action is
taken to adopt new values to be effective in 1987, but these values would later be repealed and supplanted by lower ones.
1985: Values adopted in 1983 based on the 1982 UMC report become effective.
The STC repeals the values or 1987 it adopted in 1984 and sets new values as farm values decline.
1986: Values adopted for use in 1987 are repealed for the second time and a third set of values
adopted as farmland values continue to slide. These values do go into effect for the 1987 reassessment. This is the only time the STC adopts multiple values for one reassessment period.
1987: The second reassessment using use-values occurs using values lower than in 1985.
This is the first year that UMC reports provide alternative values based on supported and unsupported prices.
1988: In November, an emergency amendment is adopted to set the values for 1989.
At the same time the STC adopts values for 1991 that are the same as for 1989 and 1987. 1989: The third reassessment uses the same values as 1987. 1990: An amendment is adopted to set use-values for the reassessment in 1993. The STC again
chooses to keep the values the same. 1991: The fourth reassessment uses the same use-values as in 1987 and 1989. 1992: Use-values for 1995 are adopted, without change from previous values. 1993: The fifth reassessment uses the same productivity values as 1987, 1989, and 1991. 1994: Use values for 1997’s reassessment are adopted. The values are greater than those applied to
the five reassessments from 1987 through 1995. 1995: The sixth reassessment uses the same values as in 1987, 1989, 1991, and 1993.
According to the 1996 UMC report, this is the last year of data that reports both supported and unsupported prices. After this year, only unsupported values are reported.
1996: Dr. Moore of UMC proposes new methodology for calculating use-values. This method
utilizes 1983 values using unsupported prices as its baseline. A six-year average of the crop rental rates, taking out the highest and lowest values, is used to calculate the percent change in soil grades 1-4 and a five year-average is used to calculate the percent change for soil grades 5-8 to determine the percent changed for net revenue from the previous base. A five-year average capitalization rate is then applied to calculate the use-value. The benefits of this approach, cited by Moore, are that it lessens the necessary calculations, mitigates the effects of old technology, arrives at more uniform percent changes across soil grades, and finds

Public Policy Research Center Page 14 University of Missouri-St. Louis December 9, 2005
values more consistent with the United States Department of Agriculture (USDA) figures for farm real estate value changes. The STC apparently accepts the new methodology because all future UMC reports use it.
Values for the 1999 reassessment are adopted, leaving use values unchanged from those in effect initially adopted for use in 1997
1997: The seventh reassessment uses values set in 1994 that are different from the previous five
reassessments. 1999: The eighth reassessment uses the same values as 1997. 2001: The ninth reassessment uses the same values as 1997 and 1999. 2003: The tenth reassessment uses the same values as in 1997, 1999 and 2001 2005: The eleventh reassessment uses the same values as in 1997, 1999, 2001 and 2003.
Use values for the 2007 reassessment will be adopted or continued by December 31.

Public Policy Research Center Page 15 University of Missouri-St. Louis December 9, 2005
References
National Agricultural Statistics Service. (2005) “Land Values and Cash Rents 2005 Summary.” Sp Sy 3 (05). United States Department of Agriculture. National Agricultural Statistics Service. (2005) “Agricultural Land Values.” Sp Sy 3 (00)a. United States Department of Agriculture. Missouri Agricultural Statistics Service. (2005) “Missouri: Selected statistics on farm real estate and income, 1950-2005.” United States Department of Agriculture. State Tax Commission of Missouri (STC). “Annual Report (39-57) of the Proceedings and Decisions of the State Tax Commission of Missouri.” Reports for the years ending: 1984,1985, 1986,1987, 1988,1989,1990,1991,1992,1993,1995,1996,1997,1998,1999, 2000,2001,2002,2003 Erwin, David and Nolte, Paul. (December 1982) “Estimating Use-Values of Missouri Agricultural Land.” University of Missouri-Columbia: Department of Agricultural Economics. UMC Reports. Moore, Kevin C. “Updating Use-Values of Missouri Agricultural Land.” University of Missouri-Columbia: Department of Agricultural Economics. Reports from: July 1990, July, 1992, September 1994, October 1996, September 1997, October 1998, September 1999, September 2000, September 2001, October 2003, September 2004, and October 2005.