south dakota agricultural land values and cash rental
TRANSCRIPT

South Dakota State UniversityOpen PRAIRIE: Open Public Research Access InstitutionalRepository and Information Exchange
Agricultural Experiment Station Circulars SDSU Agricultural Experiment Station
7-1994
South Dakota Agricultural Land Values and CashRental Rates: 1994Larry JanssenSouth Dakota State University, [email protected]
Karen BrovoldSouth Dakota State University
Burton PfluegerSouth Dakota State University, [email protected]
Follow this and additional works at: http://openprairie.sdstate.edu/agexperimentsta_circ
This Circular is brought to you for free and open access by the SDSU Agricultural Experiment Station at Open PRAIRIE: Open Public Research AccessInstitutional Repository and Information Exchange. It has been accepted for inclusion in Agricultural Experiment Station Circulars by an authorizedadministrator of Open PRAIRIE: Open Public Research Access Institutional Repository and Information Exchange. For more information, pleasecontact [email protected].
Recommended CitationJanssen, Larry; Brovold, Karen; and Pflueger, Burton, "South Dakota Agricultural Land Values and Cash Rental Rates: 1994" (1994).Agricultural Experiment Station Circulars. Paper 313.http://openprairie.sdstate.edu/agexperimentsta_circ/313

\
C 257
South Dakota Agricultural Land Values
and Cash Rental Rates: 1994
Results from the 1994 SDSU South Dakota Farm Real Estate Market Survey
Agricultural Experiment Station • U.S. Department of Agriculture • South Dakota State University

South Dakota Agricultural Land Values and Cash Rental Rates: 1994
Results from 1994 SDSU South Dakota Farm Real Estate Survey
Contents
Summary .................................................................................................................................. 1
Introduction .............................................................................................................................. 2
South Dakota Farmland Value Trends, 1970-1994 ................................................................. .3
1994 South Dakota Agricultural Land Values and Value Changes ......................................... 3
Land Values and Value Changes by Type of Land and Region .............................................. 6
Cropland Values ................................................................................................................ 6
Hayland Values ................................................................................................................. 7
Native Rangeland and Tame (Improved) Pastureland Values ........................................... 7
Irrigated Land Values ........................................................................................................ 8
Regional Land Values by Agricultural Land Use and Land Productivity ............................... 8
Agricultural Land Values by Region and County Clusters ...................................................... 8
Major Reasons for Purchase and Sale of Farmland ............................................................... 11
1994 Cash Rental Rates of South Dakota's Agricultural Land .............................................. 13
Cash Rental Rates, Cropland Hayland, and Irrigated Land ............................................. 13
Cash Rental Rates, Rangeland and Pasture land .............................................................. 16
County Average Cash Rental Rates, Cropland and Pasture/Rangeland .......................... 17
Rates of Return to South Dakota's Agricultural Land ........................................................... 18
Respondents' Assessment of Changing Farmland Market Conditions .................................. 20
Agricultural Land Value Expectations for 1994 .................................................................... 20
References .............................................................................................................................. 20
Appendix I. Survey Methods and Respondent Characteristics ............................................. 21 Appendix II. South Dakota 1994 County Level Land Rents and Values .............................. 23
Figures
1 South Dakota farm real estate values 1970-1994 .............................................................................. 3 2 Agricultural regions of South Dakota ............................................................................................... 4 3 Average value of agricultural land, 1994 and 1993, percent change from one year ago .................. 4 4 Average value of cropland, irrigated land, and hayland, by region, 1994, dollars per acre .............. 7 5 Average value of rangeland and tame pasture, by region, 1994, dollars per acre ............................. 7 6 Reasons for buying farmland .......................................................................................................... 12 7 Reasons for selling farmland ........................................................................................................... 12 8 Average cash rental rate of nonirrigated cropland and hayland, by region, 1994, dollars per acre 13 9 Average cash rental rate of rangeland and pastureland, by region,
1994, dollars per acre and dollars per AUM ................................................................................... 13 10 Average cropland cash rent by county, 1994, dollars per acre ........................................................ 17 11 Average pasture/rangeland cash rent by county, 1994, dollars per acre ......................................... 17 12 Estimated rates of return to agricultural land, state and region, 1994 ............................................ .18
Tables
Average reported value and annual percentage change in value by type of land by region, 1991-1994 ............................................................................................... 5
2 Average reported value per acre by region, by type of land and land productivity, February 1, 1994 .................................................................. 9
2A Average reported value per acre by region and county clusters, by type of land and land productivity, February 1, 1994 ................................................................ 10
3 Cash rental rates by type of land by region, 1991-1994 .................................................................. 14 3A Cash rental rates by type of land by region and county clusters, 1993-1994 .................................. 15 4 Estimated rates of return by type of land and by region, 1991-1994 .............................................. 19
South Dakota
Agricultural Land Values
and Cash Rental Rates: 1994
Results from the 1994 SDSU
South Dakota Farm Real Estate Market Survey
Dr. Larry Janssen, Ms. Karen Brovold, and Dr. Burton Pflueger

FOREWORD
Agricultural land values and cash rental rates in South Dakota are the primary topics of
this report. This report is written for farmers and ranchers, landowners, agricultural profes
sionals (lenders, rural appraisers, professional farm managers, Extension agents, and educa
tors), and policymakers interested in agricultural land market trends. The report contains the
results of the 1994 SDSU South Dakota Farm Real Estate Market Survey, the fourth annual
SDSU survey developed to estimate agricultural land values and cash rental rates by land
use in different regions of South Dakota.
We wish to thank our reviewers for their constructive comments on an earlier draft of this
report. The reviewers are Dr. Richard Shane and Dr. Dillon Feuz of the SDSU Economics
Department and Mary Brashier, Agricultural Communications Department, SDSU.
Karen Brovold, undergraduate assistant and co-author, conducted the many tasks associ
ated with survey development, data entry and processing, and preparation of tables. We
wish to thank Economics secretarial staff for developing and maintaining mailing lists and
for developing most of the figures and charts included in this report.
General funding for this project is from the SDSU Agricultural Experiment Station. The
John F. Kelley Fund provides student labor funds for this annual project.
Finally, we wish to thank all of the 228 respondents (lenders, appraisers, and Extension
agents) who participated in the 1994 South Dakota Farm Real Estate Market Survey.
Without their responses this report would not be possible.

South Dakota Agricultural Land Values
and Cash Rental Rates: 1994
Results from the 1994 SDSU South Dakota Farm Real Estate Market Survey
Dr. Larry Janssen, Ms. Karen Brovold, and Dr. Burton Pflueger•
SUMMARY
South Dakota's agricultural land values increased 3.5%
in 1993, paced by strong increases in the central and north
central regions. Slight declines in agricultural land values
were reported in the northeast and south-central regions,
and no change was reported in the east-central region. The
average value of agricultural land (as of February 1, 1994)
varies from $581 per acre in the southeast to $100 per acre
in the northwest. These are key findings from the SDSU
1994 South Dakota Farm Real Estate Market Survey.
In each region, per-acre values are highest for irrigated
land, followed in descending order by nonirrigated crop
land, hayland or tame pasture, and native rangeland. For
each land use, per-acre land values are highest in the south
east region and lowest in western South Dakota.
Average nonirrigated cropland values vary from $661
per acre in the southeast to $331 per acre in the central
region and $169 per acre in the northwest. Average crop
land values exceed $840 per acre in some eastern counties.
Average rangeland values vary from $319 per acre in the
southeast to about $80-$85 per acre in western South
Dakota. Within each region, there are substantial differ
ences in per acre values by land use and land productivity.
Average cash rental rates per acre differ greatly by
region and land use. For example, nonirrigated cropland
1 Professor, undergraduate assistant, and associate professor of economics, South Dakota State University. Dr. Janssen has teaching and research responsibilities in agricultural policy, agricultural finance, and farmland markets. Dr. Pflueger is Extension farm financial management specialist.
average cash rental rates are between $63 and $73 per acre
in a few counties of eastern South Dakota and are $14.90 to
$17. 90 per acre in western South Dakota. Average range
land cash rental rates vary from $20.30-$20.90 per acre in
the east-central and southeast region to $5.40-$5.60 per acre
in western South Dakota.
From 1993 to 1994, cash rental rates for cropland
decreased slightly in the east-central and south-central
regions. Cropland cash rental rates were steady to $1.00
higher in most other regions and increased an average of
$3.20 per acre in the north-central region. Hayland cash
rental rates increased in all regions except the south-central
and east-central regions. Rangeland rental rates increased in
most regions from $0.50 to $1.50 per acre and held steady
in the southeast and southwest.
Average cash rental rates per AUM (Animal Unit
Month) for grazing land are fairly uniform across South
Dakota, ranging from $14.80 to $17.00 per AUM. In most
regions, this represents a rate increase of $2.50-$5.50 per
AUM from 1988 to 1994.
The ratio of gross cash rent to reported land value is a
measure of the gross rate of return to land before deduction
of property taxes and other landlord expenses. This estimat
ed gross rate of return is 7.5% for all agricultural land, 8.0%
for nonirrigated cropland, and 7 .0% for rangeland. From
1991 to 1994, there were minimal changes in estimated
gross rate of return by region or by land use.
Respondents were asked to estimate net rates of return to
agricultural land ownership, given current real estate values.

Estimated net rate of return is 5.5% on all agricultural land,
5.8% on nonirrigated cropland, and 5.1 % on rangeland.
From 1992 to 1994, there were minimal changes in esti
mated gross rates of return and net rates of return to agricul
tural land by region or land use. During this same period,
the difference between gross and net rates of return to agri
cultural land ownership has been 1.8-2.1 percentage points.
Most of the difference between gross returns and net returns
are property tax payments.
According to respondents, farm expansion is the major
reason to purchase farm real estate. Investment potential of
farmland and low interest rates were the second and third
most popular reasons. The major reasons that landowners
are selling are retirement, estate settlement, financial and
cash flow pressures, and favorable market conditions for
selling. The major reasons for buying and selling have
remained the same over the past 4 years of this survey.
Respondents indicated favorable commodity prices,
lower interest rates, farm expansion pressures, competitive
bidding, and buyer perception that farmland is a good
investment as the major reasons for steady to increasing
land values and rental rates. Lower interest rates and
reduced debt servicing costs are major positive factors sup
porting increased land values. Livestock prices and grain
prices, combined with federal farm program and disaster
assistance payments, have helped maintain net farm income
levels and land values.
In 1993, weather conditions in South Dakota were
unusually wet in most areas of the state. The 1993 crop year
was often cited as a major reason for increased land prices
in the central and north-central regions where yields were
excellent. However, production shortfalls due to prevented
plantings, flooded fields, and poor yields in many localities
of eastern South Dakota contributed to a steady land market
in most areas and a "soft market" in some localities. Many
renters attempted to renegotiate cash rental rates downward
but experienced considerable resistance as landowners
encountered increased ownership expenses, especially
increased property taxes.
Most respondents projected stable to slightly increasing
agricultural land values in 1994, with an average projected
increase of 1.5%. Overall, projections of farmland value
changes in 1994 are similar to those reported in 1993.
2
INTRODUCTION
Agricultural land values and cash rental rates in South
Dakota are the primary topics of this publication. The 1994
estimates are based on reports from 228 respondents to the
SDSU 1994 South Dakota Farm Real Estate Market Survey.
Respondents are agricultural lenders, rural appraisers, real
tors, professional farm managers, and Extension agricultural
agents who know agricultural land market trends in their
localities.
The 1994 SDSU Farm Real Estate Market Survey is the
fourth annual survey developed to estimate agricultural land
values and cash rental rates by land use ( cropland, range
land, tame pastureland, hayland, and irrigated land) in dif
ferent regions of this diverse state. This publication is a
response to numerous requests by farmland owners, renters,
appraisers, lenders, and others for more detailed information
on agricultural land markets in South Dakota.
Copies of the SDSU Farm Real Estate Market Survey
were mailed to potential respondents in February and March
1994 requesting information on 1994 cash rental rates and
agricultural land values as of February 1, 1994. A short dis
cussion of response rates and respondent characteristics and
of the estimation procedures is available in Appendix I of
this report.
This report has a similar format to previous annual
reports (Janssen and Pflueger, 1993, 1992, and 1991). New
features are county level information on whole farm, crop
land, and pasture land rents and values provided by the
South Dakota Agricultural Statistics Service (SDASS) in a
new report: South Dakota 1994 county level land rents and
values. The SDASS report is based on telephone survey
responses from 2,350 farm operators and is the first time
that county level data on cash rental rates and values of
rented land have been collected and reported.
The information provides an overview of agricultural
land values and cash rental rates across South Dakota. It
may or may not reflect actual land values or cash rental
rates in specific localities or for specific properties. We cau
tion the reader to use this information as a general refer
ence, while relying on local sources for more specific
details.
SOUTH DAKOTA FARMLAND VALUE TRENDS, 1970-1994
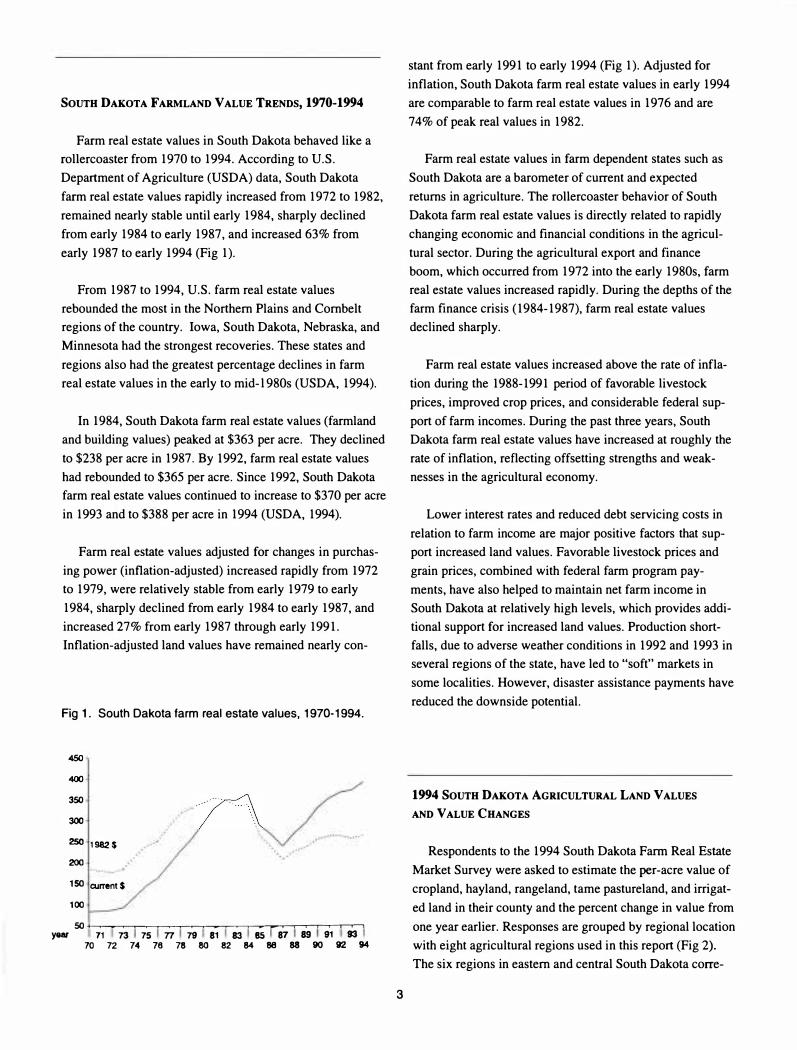
Farm real estate values in South Dakota behaved like a
rollercoaster from 1970 to 1994. According to U.S.
Department of Agriculture (USDA) data, South Dakota
farm real estate values rapidly increased from 1972 to 1982,
remained nearly stable until early 1984, sharply declined
from early 1984 to early 1987, and increased 63% from
early 1987 to early 1994 (Fig 1).
From 1987 to 1994, U.S. farm real estate values
rebounded the most in the Northern Plains and Cornbelt
regions of the country. Iowa, South Dakota, Nebraska, and
Minnesota had the strongest recoveries. These states and
regions also had the greatest percentage declines in farm
real estate values in the early to mid-l 980s (USDA, 1994).
In 1984, South Dakota farm real estate values (farmland
and building values) peaked at $363 per acre. They declined
to $238 per acre in 1987. By 1992, farm real estate values
had rebounded to $365 per acre. Since 1992, South Dakota
farm real estate values continued to increase to $370 per acre
in 1993 and to $388 per acre in 1994 (USDA, 1994).
Farm real estate values adjusted for changes in purchas
ing power (inflation-adjusted) increased rapidly from 1972
to 1979, were relatively stable from early 1979 to early
1984, sharply declined from early 1984 to early 1987, and
increased 27% from early 1987 through early 1991.
Inflation-adjusted land values have remained nearly con-
Fig 1. South Dakota farm real estate values, 1970-1994.
450
400
350
300
250 1982 $
200
150 current $
100
50+-,-----,.----,-,-�-,--......----..---r---,----,--.....------T---,--r---.--.---r-.---......----�-, year 11 73 75 n 79 81 83 85 87 89 91 93
ro n N n n � � M � � � � M
3
stant from early 1991 to early 1994 (Fig 1). Adjusted for
inflation, South Dakota farm real estate values in early 1994
are comparable to farm real estate values in 1976 and are
74% of peak real values in 1982.
Farm real estate values in farm dependent states such as
South Dakota are a barometer of current and expected
returns in agriculture. The rollercoaster behavior of South
Dakota farm real estate values is directly related to rapidly
changing economic and financial conditions in the agricul
tural sector. During the agricultural export and finance
boom, which occurred from 1972 into the early 1980s, farm
real estate values increased rapidly. During the depths of the
farm finance crisis ( 1984-1987), farm real estate values
declined sharply.
Farm real estate values increased above the rate of infla
tion during the 1988-1991 period of favorable livestock
prices, improved crop prices, and considerable federal sup
port of farm incomes. During the past three years, South
Dakota farm real estate values have increased at roughly the
rate of inflation, reflecting offsetting strengths and weak
nesses in the agricultural economy.
Lower interest rates and reduced debt servicing costs in
relation to farm income are major positive factors that sup
port increased land values. Favorable livestock prices and
grain prices, combined with federal farm program pay
ments, have also helped to maintain net farm income in
South Dakota at relatively high levels, which provides addi
tional support for increased land values. Production short
falls, due to adverse weather conditions in 1992 and 1993 in
several regions of the state, have led to "soft" markets in
some localities. However, disaster assistance payments have
reduced the downside potential.
1994 SOUTH DAKOTA AGRICULTURAL LAND VALUES
AND VALUE CHANGES
Respondents to the 1994 South Dakota Farm Real Estate
Market Survey were asked to estimate the per-acre value of
cropland, hayland, rangeland, tame pastureland, and irrigat
ed land in their county and the percent change in value from
one year earlier. Responses are grouped by regional location
with eight agricultural regions used in this report (Fig 2).
The six regions in eastern and central South Dakota corre-

spond with USDA Crop Reporting Districts. In western
South Dakota, farmland values and cash rental rates are
reported for the northwest and southwest regions.
The average value per acre and percent change in value
were obtained for each agricultural land use in each region.
Regional and statewide all-land value estimates are weight
ed averages based on the relative amount and value of each
land use in each region of South Dakota (Appendix I).
As of February 1994, the South Dakota all-land average
value was $265 per acre, an estimated 3.5% increase in
value from one year earlier (Fig 3, Table 1). Respondents'
estimated increase in land value of 3.5% is below the 5%
increase reported by USDA, and the average per acre value
in the SDSU survey is considerably lower.2
Regional differences in all-agricultural land values are
primarily related to major differences in: ( 1) agricultural
land productivity among regions, (2) per-acre values of
cropland and rangeland in each region, and (3) the propor
tion of cropland vs. rangeland in each region. 3
The all-land average values are highest in eastern South
Dakota, with per-acre values ranging from $581 in the
southeast to $498 in the east-central and $396 in the north-
2 The estimated value of South Dakota's agricultural land ($265
per acre) obtained from the SDSU survey is considerably lower
than the USDA reported value of $388 per acre. One major reason
for this difference is that the USDA figures included the estimated
value of all agricultural land and farm buildings. According to
published USDA statistics, farm building values contributed 15%
($55 per acre) of the total value of farm real estate in South Dakota
in 1992. The other major reasons for different per-acre values are:
(1) USDA reporters were asked to estimate the value of all agricul
tural land in their localities, while (2) SDSU survey respondents
were asked to estimate the value of different types of agricultural
land (cropland, hayland, rangeland, etc.) but were not asked to esti
mate the value of "all agricultural land" in their localities.
3 Most agricultural land in each region (78-86% of agricultural
acres) is native rangeland or nonirrigated cropland, but the propor
tion in each use varies greatly by region. For example, native
rangeland is the dominant land use in western South Dakota, while
most agricultural land in eastern South Dakota is nonirrigated
cropland. Most of the remaining agricultural land (14-22%) in
each region is tame (improved) pasture or hay (alfalfa hay, other
tame hay, or native hay). Irrigated land is primarily used to pro
duce corn or alfalfa hay and is concentrated in the southeast region,
near the Black Hi�ls, or along the Missouri River.
Statewide, the estimated proportions of privately owned farmland
by land use are: nonirrigated cropland, 39%; hayland, 9%; irrigated
land, 1 %; tame pastureland, 7%; and rangeland, 44%.
4
Fig 2. Agricultural regions of South Dakota.
NORTHWEST
SOUTHWEST SOUTH
CENTRAL
NORTH CENTRAL NORTH
EAST
EAST
CENTRAL
east region. These three eastern regions contain the most
productive land in South Dakota. Cropland and hayland are
the dominant uses, 70%-74% of farmland acres depending
on the region.
Agricultural land values in the three regions of central
South Dakota are much lower than in eastern South Dakota.
The average value per acre ranges from $195 in the south
central region to $257 in the central region and $297 in the
north-central region. Cropland and hayland are a majority of
farmland acres in the central and north-central regions,
while pasture and rangeland are 62% of agricultural land
acres in the south-central region.
Fig 3. Average value of South Dakota agricultural land,
February 1, 1994 and 1993, and percent change from one year ago.a
NORTHWEST
$100/acre NORTH CENTRAL NORTH
$297/acre EAST
$ 97/acre +3.0%
SOUTHWEST
$123/acre $121/acre +1.6%
SOUTH
CENTRAL
$195/acre $203/acre -3.9%
State: $265/acre $256/acre +3.5
$258/acre +15.1%
$396/acre $401/acre
..__ __ ...,-1.3% 1-------E AST CENTRAL
$499/acre $499/acre 0.0%
a Regional and statewide average values of agricultural land are the weighted averages of dollar value per acre and percent change by proportion of acres of each land use by region.
b Top: Average per-acre value-February 1, 1994 Middle: Average per-acre value-February 1, 1993
Bottom: Annual percent change in per-acre land value
Source: 1994 South Dakota Farm Real Estate Market Survey, SDSU.
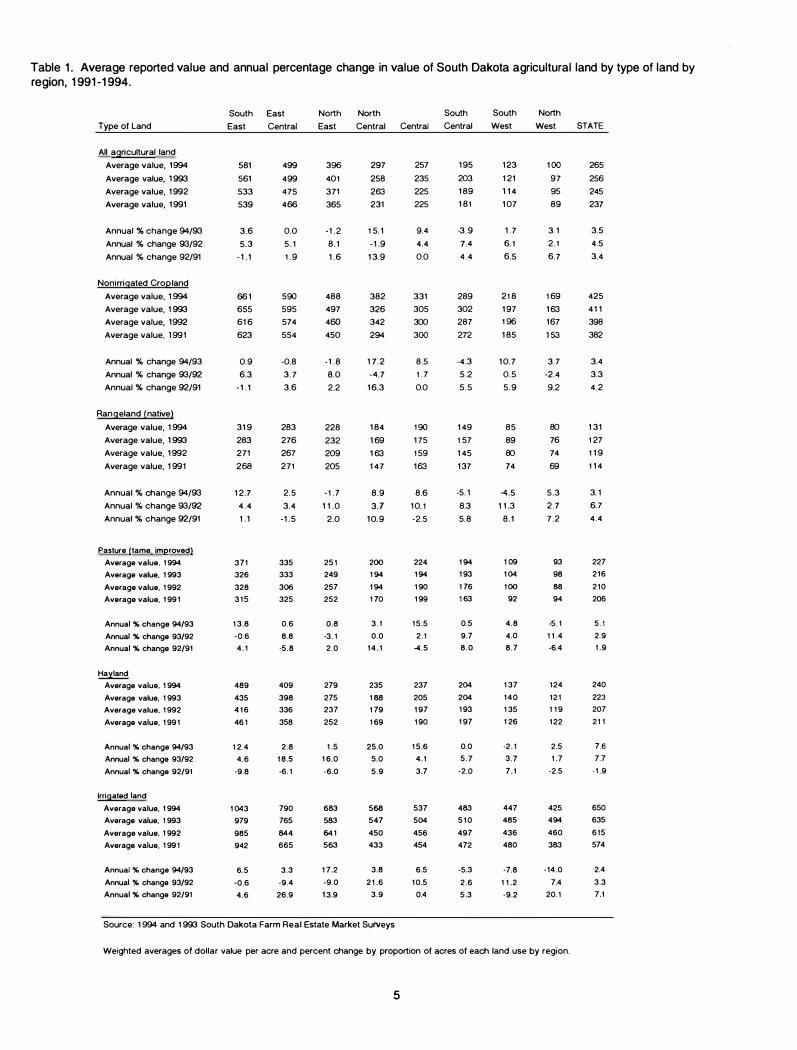
Table 1. Average reported value and annual percentage change in value of South Dakota agricultural land by type of land by region, 1991-1994.
Type of Land
All agricultural land Average value, 1994 Average value, 1 993 Average value, 1992 Average value, 1991
Annual % change 94/93 Annual % change 93/92 Annual % change 92/91
Nonirrigated Cropland Average value, 1994 Average value, 1993 Average value, 1992 Average value, 1 991
Annual % change 94/93 Annual % change 93/92 Annual % change 92/91
Rangeland (native) Average value, 1994 Average value, 1 993 Average value, 1992 Average value, 1991
Annual % change 94/93 Annual % change 93/92 Annual % change 92/91
Pasture (tame imeroved} Average value, 1 994 Average value. 1 993 Average value, 1 992 Average value. 1 991
Annual % change 94/93 Annual % change 93/92 Annual % change 92/91
Hayland Average value, 1 994 Average value, 1 993 Average value, 1 992 Average value, 1 991
Annual % change 94/93 Annual % change 93i92 Annual % change 92/91
Irrigated land Average value, 1 994 Average value, 1 993 Average value. 1 992 Average value. 1 991
Annual % change 94/93 Annual % change 93/92 Annual % change 92/91
South East
581 561 533 539
3.6 5.3
- 1 . 1
66 1 655 616 623
0.9 6.3
- 1 . 1
319 283 271 268
12.7 4 . 4 1 . 1
371 326 328 3 1 5
1 3.8 -0.6 4 . 1
489 435 4 1 6 46 1
1 2.4 4.6
-9.8
1 043 979 985 942
6.5 -0.6 4.6
East North North Central East Central
499 396 297 499 401 258 475 371 263 466 365 231
0.0 -1 .2 1 5. 1 5 . 1 8. 1 -1 .9 1 .9 1 .6 13.9
590 488 382 595 497 326 574 460 342 554 450 294
-0.8 -1 .8 17 .2 3 .7 8.0 -4.7 3.6 2.2 16.3
283 228 184 276 232 1 69 267 209 163 271 205 147
2.5 - 1 . 7 8.9 3.4 1 1 .0 3.7
-1 .5 2.0 1 0.9
335 25 1 200 333 249 1 94 306 257 1 94 325 252 1 70
0.6 0.8 3 . 1 8.8 -3. 1 0.0
-5.8 2.0 1 4 . 1
409 279 235 398 275 1 88 336 237 1 79 358 252 1 69
2.8 1 .5 25.0 1 8.5 1 6.0 5.0 -6. 1 -6.0 5 .9
790 663 568 765 563 547 844 64 1 450 665 563 433
3.3 1 7.2 3.8 -9.4 -9.0 2 1 .6 26.9 13.9 3.9
Source: 1994 and 1993 South Dakota Farm Real Estate Market Surveys
South South North Central Central West West
257 195 123 100 235 203 121 97 225 189 1 14 95 225 181 107 89
9.4 -3 .9 1 .7 3. 1 4.4 7.4 6. 1 2. 1 0.0 4 .4 6.5 6.7
331 289 21 8 1 69 305 302 197 163 300 287 1 96 167 300 272 185 1 53
8.5 -4.3 10.7 3.7 1 . 7 5.2 0.5 -2.4 0.0 5 .5 5 .9 9.2
1 90 149 85 80 175 1 57 89 76 1 59 145 80 74 163 137 74 69
8.6 -5. 1 -4.5 5.3 10. 1 8.3 1 1 .3 2 .7 -2.5 5.8 8 .1 7 .2
224 1 94 1 09 93
1 94 1 93 1 04 98 1 90 1 76 1 00 88
1 99 1 63 92 94
1 5 .5 0.5 4.8 -5 . 1 2 . 1 9.7 4.0 1 1 .4
-4.5 8 .0 8 .7 -6.4
237 204 1 37 1 24 205 204 140 12 1 1 97 1 93 1 35 1 1 9 1 90 1 97 1 26 1 22
1 5.6 0.0 -2 . 1 2.5 4 . 1 5 .7 3 .7 1 .7 3.7 ·2.0 7 . 1 -2.5
537 463 447 425 504 5 1 0 485 494 456 497 436 460 454 472 480 363
6.5 -5.3 -7.8 -14.0 1 0.5 2 .6 1 1 .2 7.4
0.4 5 .3 -9.2 20. 1
Weighted averages of dollar value per acre and percent change by proportion of acres of each land use by region.
5
STATE
265 256 245 237
3.5 4.5 3.4
425 4 1 1 398 382
3.4 3.3 4 .2
131 1 27 1 19 1 14
3. 1 6.7 4 .4
227 216 210 206
5 . 1 2.9 1 .9
240 223 207 21 1
7.6 7.7
· 1 .9
650 635 615 574
2.4 3.3 7.1

The lowest average land values are found in the north
west ($100 per acre) and southwest regions ($123 per acre).
More than 70% of agricultural acres in these western
regions are in native rangeland and pasture.
Regional changes in agricultural land values this past
year (early 1993 to early 1994) were related to the impact of
weather conditions. Record precipitation occurred in 1993,
resulting in excellent crop and range conditions in many
counties of central and western South Dakota and extensive
flooding, prevented planting, or inability to harvest crops in
many counties of eastern South Dakota.
According to survey reports, agricultural land values
sharply increased in the north-central region (+15.1 %) and
in the central region (+9.3%) (Fig 3, Table 1). Substantial
increases in cropland, rangeland, and haylano values were
indicated. Reporter comments indicated that weather condi
tions were "ideal" or "excellent," crop prices (especially
wheat and sunflower prices) were favorable, and rental rates
were increasing in many localities.
In eastern South Dakota, survey reports indicated slight
declines in agricultural land values in the northeast (-1.3% ),
no change in the east-central region, and a 3.5% increase in
the southeast. Some weakness in reported cropland values
was the principal contributor to land value changes.
Comments by many reporters indicated losses from difficult
production conditions were partly offset by disaster pay
ments, while reduced interest expense and favorable crop
prices helped those producers who were able to plant and
harvest their crops. Reporters from the southeast region
indicated investor interest in cropland and hayland helped
maintain or increase land values. Several reporters from
Charles Mix and Douglas counties indicated minimal
impact from flooding and very favorable crop production.
In western South Dakota, survey reports showed slight
increases in agricultural land values in the northwest
(+3.0%) and southwest (+l .6%) and slight declines in the
south-central (-3.9%) region. Changes in these three regions
are based on fewer survey reports. Comments from
reporters in the northwest region indicated continuing
strong demand for rangeland, while reporters from the
southwest region commented on increased cropland values.
A comparison of 1994 agricultural land values with those
reported in 1991 indicates land values increased in all
regions of South Dakota over the past 3 years. Overall, the
6
largest percentage increases in land values occurred in the
north-central, northwest, southwest, and central regions of
South Dakota, where wheat and cattle are the most impor
tant agricultural enterprises (Table 1).
LAND VALVES AND VALUE CHANGES
BY TYPE OF LAND AND REGION
Major differences in value changes by agricultural land
use across regions also occurred. In each region, per-acre
values are highest for irrigated land, followed by nonirrigat
ed cropland, hayland or tame pasture, and native rangeland.
For each land use, per-acre land values are highest in the
southeast, followed by land values in the east-central
region. The lowest average land values are found in the
northwest and southwest regions (Figs 4, 5, Table 1).
Cropland Values
The weighted average value of South Dakota's nonirri
gated cropland (as of February 1994) is $425, a 3.4%
increase from 1993. There was considerable regional varia
tion in value changes. For example, substantial increases in
cropland values are reported in the north-central, central,
and southwest regions, while slight declines are reported in
the northeast, east-central, and south-central regions.
The southeast region has the highest average cropland
values ($661 per acre), followed by cropland in the east
central and northeast regions (Fig 4, Table 1). These three
eastern regions contain nearly 45% of South Dakota's crop
land, and the major crops are com, soybeans, wheat, and
other small grains.
Wheat and other small grains are the predominant crop
land uses in central South Dakota. Average cropland values
in the north-central region are higher ($382 per acre) than
in central and south-central regions and over the past 3
years have increased more than in all other regions of the
state. Average cropland values are somewhat lower in the
central region ($331 per acre) and south-central region
($289 per acre).
The lowest average cropland values ($169 to $218 per
acre) are found in the northwest and southwest regions. The
dominant cropland uses are spring wheat in the northwest

and winter wheat in southwest South Dakota. Average per
acre values of cropland in the northwest region are one
fourth of average cropland values in southeastern South
Dakota (Table 1).
Hayland Values
South Dakota hayland values averaged $240 per acre as
of February 1994, a 7 .6% increase from one year earlier.
Hayland values increased more than 10% from 1993 in the
north-central, central, and southeast regions. Minor changes
in hayland values were reported in the east-central, south
west, and northwest regions (Table 1, Fig 4).
Fig 4. Average value of South Dakota cropland, irrigated land, and hayland, by region , February 1 994, dollars per acre.
NORTHWEST Crop $169 Irr. $425 Hay $124
SOUTHWEST Crop $218 Irr. $447 Hay $137
NORTH CENTRAL NORTH Crop $382 EAST Irr. $568 Crop $488
,____H_a....,
$235 Irr. $683 L----"'"1 ay $279
EAST CENTRAL
Crop $590 SOUTH Irr. $790 CENTRAL Hay $409
Crop $289 Irr. $483 SOUTH EAST Hay $204 Crop $661
... ••••••••••••• .... Irr. $1034 Hay_ $489
Crop = Irr.=
Hay =
Nonirrigated cropland Irrigated land Hayland
Source: 1994 South Dakota Farm Real Estate Market Survey, SDSU.
Fig 5. Average value of South Dakota rangeland and tame pasture, by region, February 1 994, dollars per acre.
NORTHWEST Range $80 Pasture $93
SOUTHW EST Range $85 Pasture $109
SOUTH CENTRAL
NORTH CENTRAL NORTH Range $184 �!;;e $228 Pasture $200 Pasture $251
CENTRAL Range $190 Pasture $224
EAST CENTRAL
Range $283 Pasture $335
Range $149 Pasture $194
Source: 1994 South Dakota Farm Real Estate Market Survey, SDSU.
7
Per-acre hayland values follow the same regional pat
terns as cropland values, with the highest values in the
southeast ($489 per acre) and lowest values in the northwest
($124 per acre). Alfalfa and other tame hay is the most
common hay harvested in eastern South Dakota, while
native hay is more common in central and western South
Dakota. Respondents from the southeast and east-central
regions primarily reported alfalfa hayland values, while
respondents in all other regions primarily reported all hay
land values.
Since alfalfa hay commands a price premium over other
hay, alfalfa hayland also commands a price premium over
all hayland or native hayland.
Native Rangeland and Tame (Improved)
Pastureland Values
In February 1994, the weighted average value of South
Dakota native rangeland was $131 per acre, while the aver
age value of tame pasture was $227 per acre (Table 1, Fig
5) . Native rangeland is much more concentrated in the west
ern and central regions of South Dakota, while tame pasture
is concentrated in the eastern regions.
The statewide average change in value was +3.1 % for
rangeland and +5.1 % for tame pastureland. Rangeland val
ues increased above 8% in the southeast, central, and north
central regions and declined slightly in the northeast, south
central, and southwest regions. Reported values of tame
pastureland increased in all regions except the northwest.
Rangeland average values are highest in the southeast
and east-central regions ($329 and $283 per acre respective
ly) and lowest in the northwest and southwest regions ($80
and $85 per acre respectively). In the central regions of
South Dakota, average rangeland values vary from $149 to
$190 per acre, compared to $228 per acre in the northeast
region (Table 1, Fig 5). In each region, the average value of
native rangeland was lower than the reported value of tame
pastureland.
Within most regions, the average per-acre value of nonir
rigated cropland is 1.8-2.4 times the average value of native
rangeland. In all regions, per-acre average hayland and tame
pasture values are considerably lower than nonirrigated
cropland values and somewhat higher than native rangeland
values. Hayland values are considerably higher than tame

pastureland values in the southeast and east-central regions,
where alfalfa hay is the most common hay harvested.
Irrigated Land Values
Statewide average irrigated land values are $650 per acre,
a 2.4% increase from one year earlier. Average irrigated
land values are above the statewide average in the southeast
($1043 per acre), east-central ($790 per acre), and northeast
region ($683 per acre). In all other regions, irrigated land
values average $425 to $568 per acre (Table 1, Fig 4).
Reported values of irrigated land in the northwest and
southwest regions were primarily for gravity irrigation. In
all other regions, the value of irrigated land was reported for
center pivot irrigation systems, excluding the value of the
center pivot.
Reported values of irrigated land declined in the three
regions (south-central, southwest, and northwest) west of
the Missouri River. Increased values of irrigated land are
reported in all other regions.
We caution the reader that data (especially percentage
changes) on irrigated land values are less reliable than land
value data on other agricultural land uses. Irrigated land is
not common (less than 1 % of land acreage) in most regions,
and there are few sales of irrigated land tracts. Only 30% of
all respondents were familiar with and able to provide infor
mation on irrigated land values.
REGIONAL LAND VALUES BY AGRICULTURAL LAND USE
AND LAND PRODUCTIVITY
To this point, we have provided a statewide and regional
summary of respondents' estimated value of average quality
land in each agricultural land use. Respondents also estimat
ed by land use the average value of both high productivity
and low productivity land in their locality.
The 1994 average reported values by land use and pro
ductivity are summarized by region in Table 2. For exam
ple, cropland values in the southeast region range from an
average of $477 per acre for low productivity cropland to
$944 per acre for high productivity cropland. In the north
west region, cropland values range from an average of $131
8
per acre for lower productivity cropland to $208 per acre for
higher productivity cropland.
Rangeland values in the southeast region vary from $246
per acre for lower productivity rangeland to $384 per acre
for higher productivity rangeland. In the northwest region,
the average value of low (high) productivity rangeland is
$54 ($102) per acre. The regional differences in per-acre
rangeland values reflect differences in livestock carrying
capacity.
Within each region, substantial variation in land values
exists for each land use. The greatest relative variation
occurs for cropland in eastern South Dakota and for native
rangeland in regions west of the Missouri River. In eastern
South Dakota and in the north-central region, the average
value of higher productivity cropland was 65% to 98%
above the average value of lower productivity cropland. In
all other regions the value of higher productivity cropland is
45% to 74% above the average value of lower productivity
cropland. For rangeland, the average value of high produc
tivity rangeland is 47% to 61 % above the average value of
low productivity rangeland in all regions east of the
Missouri River and 75% to 87% above the value of low pro
ductivity rangeland in regions west of the Missouri River.
AGRICULTURAL LAND VALUES BY
REGION AND COUNTY CLUSTERS
Overall, considerable variation in agricultural land val
ues occurs within each region. In this section, we report
February 1994 per-acre values of average quality, high pro
ductivity, and low productivity land by agricultural land use
by region and county clusters within several regions (Table
2A). A county cluster is a group of counties within the same
region that have similar agricultural land use and land value
characteristics.
Three county clusters were identified in each of the fol
lowing regions: southeast, east-central, northeast, north-cen
tral, and central. The greatest variation in land values
occurs among county clusters in the southeast and east-cen
tral regions.
Average per-acre land values are similar within three
pairs of county clusters in the two eastern regions: (1)
Clay-Lincoln-Turner-Union and Minnehaha-Moody county

clusters; (2) Bon Homme-Hutchinson-Yankton and
Brookings-Lake-McCook county clusters; and (3) Charles
Mix-Douglas and Sanborn-Davison-Hanson-Kingsbury
Miner county clusters. For example, the per,..acre value of
average quality nonirrigated cropland is: ( 1) $848 to $893
per acre, respectively, in the Minnehaha-Moody and Clay-
Lincoln-Turner-Union county clusters, (2) $594-$61 1 per
acre in the Brookings-Lake-McCook and Bon Homme
Hutchinson-Yankton county clusters, and only (3) $4 12-
$414 per acre in the western county clusters of these two
regions (Table 2A).
Compared to 1993, reported values of average quality
cropland held steady or slightly increased in all county clus
ters of the southeast and east-central regions. Rangeland and
hayland values increased in all county clusters.
In the northeast region, average cropland values are simi
lar in the Codington-Deuel-Hamlin and Grant-Roberts
county clusters and considerably lower in the Clark-Day
Marshall county cluster. However, rangeland and hayland
values are similar in the Grant-Roberts and Clark-Day
Marshall county clusters and considerably higher in the
Codington-Deuel-Hamlin county cluster. In Grant and
Roberts counties, most cropland is located in the central and
eastern sections where the elevation is lower and soils are
more productive, while rangeland and hayland are generally
located in the western upland (prairie coteau) sections.
Compared to 1993, reported values of agricultural land
declined in the Grant-Roberts county cluster. Reported land
value changes were mixed in the Codington-Deuel-Hamlin
and Clark-Day-Marshall county clusters with modest
increases in reported cropland and hayland values and
decreases reported for rangeland and pasture.
Strong increases in agricultural land values were report
ed in all county clusters in the north-central region. Average
Table 2. Average reported value per acre of agricultural land by South Dakota region, by type of land and land productivity, February 1, 1994.
Agricultural Land South East North North South South North
Type and Productivity East Central East Central Central Central West West -----------------------------------------dol lars per acre-------------------------
Nonirrigated Croeland
Average
High Productivity
Low Productivity
Rangeland {native}
Average
High Productivity
Low Productivity
Pastureland {tame1imeroved}
Average
High Productivity
Low Productivity
Hayland
Average
High Productivity
Low Productivity
Irrigated Land
Average
High Productivity
Low Productivity
661
944
477
31 9
384
246
371
446
301
489
577
374
1 043
1 200
882
590 488
730 635
442 351
283 228
329 266
224 1 81
335 251
386 281
266 202
409 279
460 330
321 21 0
790 683
990 727
655 570
Source: 1994 South Dakota Farm Real Estate Market Survey, SDSU
9
382 331 289 21 8 1 69
494 381 362 268 208
264 261 228 1 54 131
1 84 1 90 1 49 85 80
228 229 1 93 1 1 2 1 02
1 41 1 45 1 04 64 54
200 224 1 94 1 09 93
248 260 244 1 46 1 1 8
1 55 1 78 1 48 87 72
235 237 204 1 37 1 24
275 266 252 1 78 147
1 67 1 72 1 55 1 04 89
568 537 483 447 425
650 592 566 548 666
441 458 383 360 241

land values reported in Brown and Spink counties were
much higher than average land values reported in the
Edmund-Faulk-McPherson and Campbell-Potter-Walworth
county clusters. Most land in Brown and Spink counties is
located in the James River valley and is more productive
than most other agricultural land in the north-central region.
In the central region, the per-acre value of rangeland,
pastureland, and hayland are highest in the Aurora-Beadle
Jerauld county cluster. Cropland values are highest in the
Hughes-Sully county cluster. Increased land values were
reported in all county clusters of the central region, with the
greatest increases occurring in the James River valley
(Beadle and Aurora counties).
Agricultural land values are not reported·by county clus
ters in the northwest, southwest, and south-central regions.
The primary reasons are: (1) too few reports from any spe
cific county groupings, or (2) average land values were not
greatly different across county groupings. This survey is not
designed to reflect the substantially higher nonirrigated
fann/ranch land values adjacent to and in the Black Hills,
compared to the plains areas of western South Dakota. Most
of the irrigated land value reports from western South
Dakota are from locations close to the Black Hills.
Overall examination of average land values by county
clusters reveals the combined impacts of climatic factors
(precipitation, growing degree days), soil associations, and
land use on relative values of agricultural land across South
Dakota. Federal agricultural programs also have a signifi
cant direct impact on cropland values via commodity pro
gram benefits. Federal disaster assistance payments also
contributed to land market stability in eastern South Dakota.
Table 2A. Average reported value per acre of agricultural land by South Dakota region and county clusters, by type of land and land productivity, February 1 , 1 994.
Southeast East Central
Sanborn
Clay Davison
Lincoln Bon Homme Brookings Hanson
Agricultural Land Turner Hutchinson Charles Mix Minnehaha Lake Kingsbury
Type and ProductMty All Union Yankton Douglas All Moody McCook Miner
ollara per acre
Nonlrrigated Croeland
Average 661 848 61 1 4 1 2 590 893 594 414
High Productivity 944 1 055 827 502 730 1 1 23 759 480
Low Productivity 4n 61 1 442 320 442 642 420 330
Rangeland (native}
Average 3 1 9 362 305 263 283 348 276 253
High Productivity 384 424 385 31 1 329 425 309 298
Low Productivity 246 286 239 1 95 224 257 2 1 4 2 1 2
Pastureland (tame1lmeroved}
Average 371 449 380 286 335 432 300 300
High Productivity 446 534 458 334 386 500 343 345
Low Productivity 301 361 308 2 1 7 266 296 228 258
Hayland
Average 489 646 485 322 409 621 372 313
High Productivity 5n 808 566 360 460 737 406 342
Low Productivity 374 523 348 225 321 471 281 255
1 0

The Conservation Reserve program (CRP) also has some ·
impact on agricultural land values as it affects the availabili
ty of land used for agricultural production. South Dakota
has nearly 2 million acres of cropland enrolled in this 10-
year land retirement program. Unless the program is
renewed, CRP contracts in the first two signup periods will
expire in 1996, and most CRP contracts in South Dakota
will expire in 1997, 1998, and 1999. CRP contract holders,
primarily farmers and ranchers, will then have to make
some major land use decisions for their CRP tracts.
MAJOR REASONS FOR PuRCHASE AND SALE OF FARMLAND
Respondents were asked to provide major reasons why
buyers were purchasing and sellers were selling farmland in
their localities. The most frequently cited reasons for pur
chase or sale have not changed during the 4 years that the
SDSU Farm Real Estate Market Survey has been conducted.
Farm expansion was the major reason (48% of responses
to this question) that buyers were purchasing farmland.
Investment potential of farmland and low interest rates were
second and third most popular reasons. Additional reasons
include entry into farming, tract location, favorable crop/
livestock prices, renters purchasing land from the landlord,
or buying land for use as a hunting or wildlife area (Fig 6).
Retirement from farming was most often cited ( 44% of
responses to this question) as the primary reason that
landowners were selling farmland (Fig 7). Only 3% indicat
ed farmland was sold because the landowner was exiting
from production agriculture for different reasons. Com
bined, these two categories constitute 47% of all responses.
Additional major reasons for selling farmland include estate
settlement, financial and cash flow pressures, and favorable
market conditions for selling agricultural land.
Overall, farm expansion is the major reason for purchas
ing farmland while farm retirement or estate settlement are
the major reasons for selling. These motives are consistent
with the major reasons for agricultural land market transac
tions since the mid-1950s. Financial position remains an
important, though secondary, motivational factor for many
buyers and sellers in the South Dakota farmland market.
Other motivations for purchasing and selling farmland may
change the relative importance of various reasons over time.
Table 2A. Average reported value per acre of agricultural land by South Dakota region and county clusters, by type of land and land productivity, February 1, 1994, continued.
Northeast North Central
Codington Clark Edmund Campbell
Agricultural Land Deuel Grant Day Brown Faulk Potter
Type and Productivity All Hamlin Roberts Marshall All Spink McPherson Walworth
--------------··-···-···-·········-·······dollars per acre-------····---······------··························-··
Nonirrigated Croeland
Average 488 522 534 434 382 5 1 6 242 325
High Productivity 635 65 1 688 553 494 686 305 400
Low Productivity 35 1 375 361 325 264 313 1 99 243
Rangeland {native}
Average 228 249 204 202 1 84 233 1 61 1 53
High Productivity 266 283 236 242 228 308 1 80 1 75
Low Productivity 1 81 1 97 1 67 1 47 1 41 1 61 1 4 1 1 1 6
Pastureland {tame1imeroved}
Average 25 1 284 205 221 200 245 1 76 1 78
High Productivity 281 3 1 0 23 1 252 248 333 201 207
Low Productivity 202 2 1 0 1 87 1 97 1 55 1 70 1 53 1 39
Hayland
Average 279 3 1 8 243 261 235 305 1 91 1 97
High Productivity 330 372 291 298 275 367 2 1 7 220
Low Productivity 2 1 0 232 209 201 1 67 1 89 1 57 1 40
11

Fig 6. Reasons for buying farmland.
::e
::;:.::
�
s (8.6
�
%) .·
Ent,y to Fa,m;ng (4.5%) �, .•
Renter Option (3.0%) � •
Hunting Use (3.6%) �
Good 1 993 Prices (3.9%)
� Location (4.5%)
Investment ( 18. 1 %)
Fig 7. Reasons for sel ling farmland.
Expansion (48. 1 %)
Source: 1 994 Farm Real Estate Market Survey, SDSU Source : 1 994 Farm Real Estate Market Survey, SDSU
Table 2A. Average reported value per acre of agricultural land by South Dakota region and county clusters, by type of land and land productivity, February 1, 1994, continued.
South South North
CentraJ CentraJ West West
BuffaJo
Aurora Brule
AgriculturaJ Land Beadle Hand Hughes
Type and Productivity All Jerauld Hyde Sully Al l All All
---------------------------dol lars per acre--
Nonirrigated Cro12land
Average 331 345 288 373 289 21 8 1 69
High Productivity 381 392 340 432 362 268 208
Low Productivity 261 285 228 275 228 1 54 1 31
Rangeland {native}
Average 1 90 247 1 65 1 41 1 49 85 80
High Productivity 229 278 230 1 61 1 93 1 1 2 1 02
Low Productivity 1 45 200 1 1 9 1 09 1 04 64 54
Pastureland {tame1im12roved}
Average 224 266 1 80 1 72 1 94 1 09 93
High Productivity 260 290 220 225 244 1 46 1 1 8
Low Productivity 1 78 21 4 1 43 1 50 1 48 87 72
Hayland
Average 237 279 203 228 204 1 37 1 24
High Productivity 266 303 251 236 252 1 78 1 47
Low Productivity 1 72 223 1 54 1 24 1 55 1 04 89
Source: 1994 South Dakota Farm Real Estate Market Survey, SDSU.
Irrigation land values are not reported In this table, due to insufficient number of reports in moat county clusters.
1 2

1994 CASH RENTAL RATES OF
SOUTH DAKOTA'S AGRICULTURAL LAND
The cash rental market provides important information
on returns to agricultural land. Nearly three fourths of South
Dakota's farmland renters and three fifths of agricultural
landlords are involved in one or more cash leases for agri
cultural land. A majority of cash leases are annual renew
able agreements (Peterson and Janssen, 1988).
Respondents to the 1994 SDSU Farm Real Estate Market
Survey were asked about average cash rental rates per acre
for nonirrigated cropland, irrigated land, and hayland in
their localities. Cash rental rates for pasture/rangeland were
provided on a per-acre basis and, if possible, on a per-A UM
(Animal Unit Month) basis. Cash rental rates by land use by
region are summarized in Figs 8, 9, and Table 3. The same
information is summarized by region and county cluster in
Table 3A.
Cash rental rates differ greatly by region and land use.
For each land use, cash rental rates per acre are highest in
the southeast and east-central regions and lowest in north
west and southwest South Dakota. In each region, cash
rental rates are highest for cropland and lowest for pasture
and rangeland (Table 3, Figs 8, 9).
Cash Rental Rates,
Cropland, Hayland, and Irrigated Land
Average cash rental rates for nonirrigated cropland range
from $14.90 to $17.90 per acre in western South Dakota to
$45.10 per acre in the east-central region and $51 .90 per
acre in southeastern South Dakota (Fig 8, Table 3).
Average cash rental rates are highest ($67. 70 to $68.40 per
acre) in the Minnehaha-Moody and Clay-Lincoln-Turner
Union county clusters (Table 3A).
Cash rental rates for center pivot irrigated land in regions
east of the Missouri River vary from an average of $48.50
per acre in the central region to $91.90 per acre in south
eastern South Dakota. Many reporters indicated few irrigat
ed tracts in their locality were cash leased and that their
reports were based on few actual irrigated . land leases. Due
to insufficient number of reports, irrigation cash rental rates
for 1994 are not reported in the south-central, southwest,
and northwest regions of South Dakota.
13
Fig 8. Average cash rental rate of South Dakota nonirrigated cropland and hayland, by region, 1 994, dollars per acre.
NORTHWEST Crop $14.90 Hay $11.30
SO UTHW EST
Crop $17.60 Hay $11.90
Crop = Hay =
Cropland Hayland
SOUTH CENTRAL
NORTH CENTRAL NORTH Crop $29.80 EAST Hay $17.00 Crop $40.30
Hay $23.60
CENTRAL Crop $25.00 Hay $17.80
EAST CENTRAL
Crop $45.10 Hay $31.40
Crop $22.10 Hay $15.50
Source: 1994 South Dakota Farm Real Estate Market Survey, SDSU.
Fig 9. Average cash rental rate of South Dakota rangeland and pastureland by region, 1 994, dollars per acre and dollars per AUM.
NORTHWEST NORTH CENTRAL NORTH $5.60/acre $13.40/acre EAST $16.50/AUM $14.80/AUM $18.60/acre
$15.60/AUM
CENTRAL EAST $16.30/acre CENTRAL $16.50/AUM $20.90/acre
SOUTHWEST SOUTH $15.00/AUM CENTRAL
$5.40/acre 11.20/acre $15.60/AUM $17.00/AUM
Source: 1994 South Dakota Farm Real Estate Market Survey, SDSU.

Table 3. Reported cash rental rates of South Dakota agricultural land by type of land by region , 1994, 1993, 1992, and 1991 rates.
Type of land
Nonirrigated Croeland
Average 1 994 rate
Range of 1 994 ratea
Average 1 993 rate
Average 1 992 rate
Average 1 99 1 rate
I rrigated land
Average 1 994 rate
Range of 1 994 ratea
Average 1 993 rate
Average 1 992 rate
Average 1 99 1 rate
Hayland
Average 1 994 rate
Range of 1 994 ratea
Average 1 993 rate
Average 1 992 rate
Average 1 99 1 rate
P asture£Rangeland
Average 1 994 rate
Range of 1 994 rates
Average 1 993 rate
Average 1 992 rate
Average 1 99 1 rate
Average 1 994 rate
Range of 1 994 ratea
Average 1 993 rate
Average 1 992 rate
Average 1 99 1 rate
** Insufficient number of reports
South East
East Central
5 1 .90 45. 1 0
20-85 20-90
5 1 . 80 47. 1 0
48. 00 45.70
49.30 43 .20
9 1 .90 71 .70
60-1 25 50-90
87.20 68.60
85 .20 70.00
82 .70 69.00
39.50 3 1 .40
1 5-90 1 5-90
35 .60 32. 1 0
33.30 25.90
38.50 30.90
20.30 20.90
1 0-30 1 4-30
20.30 20. 1 0
1 8.00 1 9.60
1 9 .20 1 8.60
1 5 .40 1 5 .00
1 5-1 7 1 2-1 8
1 5 .60 1 3.90
1 5 .40 1 4.50
1 3 .70 1 5 .90
North North South
East Central Central Central
ollara per acr
40.30 29. 80 25.00 22. 1 0
28-55 1 8-52 1 7-35 1 4-30
40.30 26.60 24 .20 22.80
39.70 25.50 22.70 21 .40
38.50 24.50 23.20 22.20
66.00 53 .80 48.50 **
45-1 00 38-75 35-80 **
60.00 57 .80 52 .50 53 .80 69 .20 58.50 48.30 50.40
59.00 ** 41 .70 **
23.60 1 7.00 1 7.80 1 5 .50
1 0-45 1 0-30 7-32 8-20
22.00 1 4 .70 1 6.40 1 6.00
20.00 1 4 .20 1 5 .60 1 5 .80 22.30 1 4.20 1 5.70 1 4 .80
1 8.60 1 3 .40 1 6.30 1 1 .20
1 2-25 8-20 1 0-25 5-1 5
1 7.00 1 2. 70 1 5 .20 1 0. 1 0
1 6.50 1 2 .00 1 3 .50 9.50
1 6.30 1 2.50 1 3 .80 9.90
ollara per Animal Unit Month
1 5 .60 1 4. 80 1 6.50 1 7.00
1 2-1 8 1 2-20 1 2 -20 1 4-20
1 4 .25 1 3.25 1 4 .90 1 6.40
1 2.50 1 3. 1 0 1 5 .50 1 5.90
1 5 .50 1 2.80 1 4 .80 1 5 .20
Source: South Dakota Farm Real Estate Market Surveys, SOSU, 1 994 , 1 993 , 1 992 and 1 99 1
14
South North
West West
1 7.60 1 4 .90
1 2-24 1 1 -1 8
1 6.60 1 4 .60
1 7.70 1 5. 1 0
1 5.90 1 3.50
** **
** ••
49.40 40.80
46.50 48. 1 0
35. 1 0 39 .00
1 1 .90 1 1 .30
4-22 5-1 6
1 1 .30 9.50
1 1 .40 1 2. 1 0
1 2. 1 0 1 0.40
5.40 5 .60
2.5-8 4-8.5
5 .60 5 . 1 0
5.30 4.90
5.30 4 .40
1 5.80 1 6.50
1 2-1 9 1 2-20
1 5 .40 1 4 .50
1 4.00 1 5.00
1 4.30 1 3.00

Table 3A. Reported cash rental rates of South Dakota agricultural land by region and county clusters, 1 994 and 1 993 rates.
Southeast East Central
Sanborn
Clay Davison
Lincoln Bon Homme Brookings Hanson
Turner Hutchinson Charles Mix Minnehaha Lake Kingsbury
All Union Yankton Douglas All Moody McCook Miner
---------------------------------dollars per acre -----------------·---------
Nonirrigated Croeland
Average 1 994 rate 5 1 .90 68.40 46.90 32.30 45. 1 0 67.70 42.60 31 .30
Range of 1 994 rates 30-85 30-85 35-85 30-40 20-90 50-90 30-60 20-50
Average 1 993 rate 5 1 .80 68.00 45 .30 3 1 .50 47. 1 0 66.20 47 .40 31 .60
Hayland
Average 1 994 rate 39.50 55 .50 33.30 22.50 3 1 .40 5 1 . 1 0 29.40 25 .00
Range of 1 994 rates 1 5-90 1 8-90 20-90 1 5-32 1 5-90 20-90 20-40 1 5-40
Average 1 993 rate 35 .60 46.50 33 .70 20.00 32. 1 0 44 .90 30.70 22.90
Pasture £Rangeland
Average 1 994 rate 20.30 24.30 20.00 1 7.70 20.90 23.20 1 9 .30 20.50
Range of 1 994 rates 1 0-30 1 5-30 1 8-25 1 0-20 1 4-30 20-30 1 4-25 1 5-27.5
Average 1 993 rate 20.30 23.80 1 9.70 1 7.40 20. 1 0 22.30 1 8.80 1 9.70
Table 3A. Reported cash rental rates of South Dakota agricultural land by region and county clusters, 1 994 and 1 993 rates, continued.
Northeast North Central
Codington Clark Edmund Campbell
Deuel Grant Day Brown Faulk Potter
All Hamlin Roberts Marshall All seink McPherson Walworth
---------------------------------------------dollars per acre- --------------------Nonirrigated Croeland
Average 1 994 rate 40.30 42.00 45.50 36.20 29.80 37.70 2 1 .40
Range of 1 994 rates 28-55 35-55 30-55 28-48 1 8-52 25-52 1 8-27
Average 1 993 rate 40.30 4 1 .90 45.00 34 .70 26 .60 34 .20 20.00
Hayland
Average 1 994 rate 23.60 25 .40 24 .70 2 1 .00 1 7.00 1 8.90 1 5 .60
Range of 1 994 rates 1 0-45 1 2 .5-45 1 8-35 1 0-25 1 0-30 1 0-30 1 0-22
Average 1 993 rate 22.00 2 1 .80 26.00 1 8. 1 0 1 4 .70 1 6.60 1 3 . r n
Pasture£Rangeland
Average 1 994 rate 1 8.60 1 9.40 1 6.'40 1 8.30 1 3.40 1 6.00 1 2 .60
Range of 1 994 rates 1 2-25 1 3.5-25 1 3-22.5 1 2-25 8-20 1 3-20 1 1 -1 5
Average 1 993 rate 1 7.00 1 8. 1 0 1 6.30 1 6.30 1 2.70 1 4.80 1 2.00
Source: South Dakota Farm Real Estate Market Surveys, SOSU, 1 994 and 1 993.
I rrigated cropland rental rates per acre and rangeland rental rates per Aum are not reported In this table, due to insufficient
number of reports In most county clusters.
1 5
24 .50
20-30
21 .50
1 5.60
1 0-25
1 2 .90
1 1 . 1 0
8-1 2
9.90
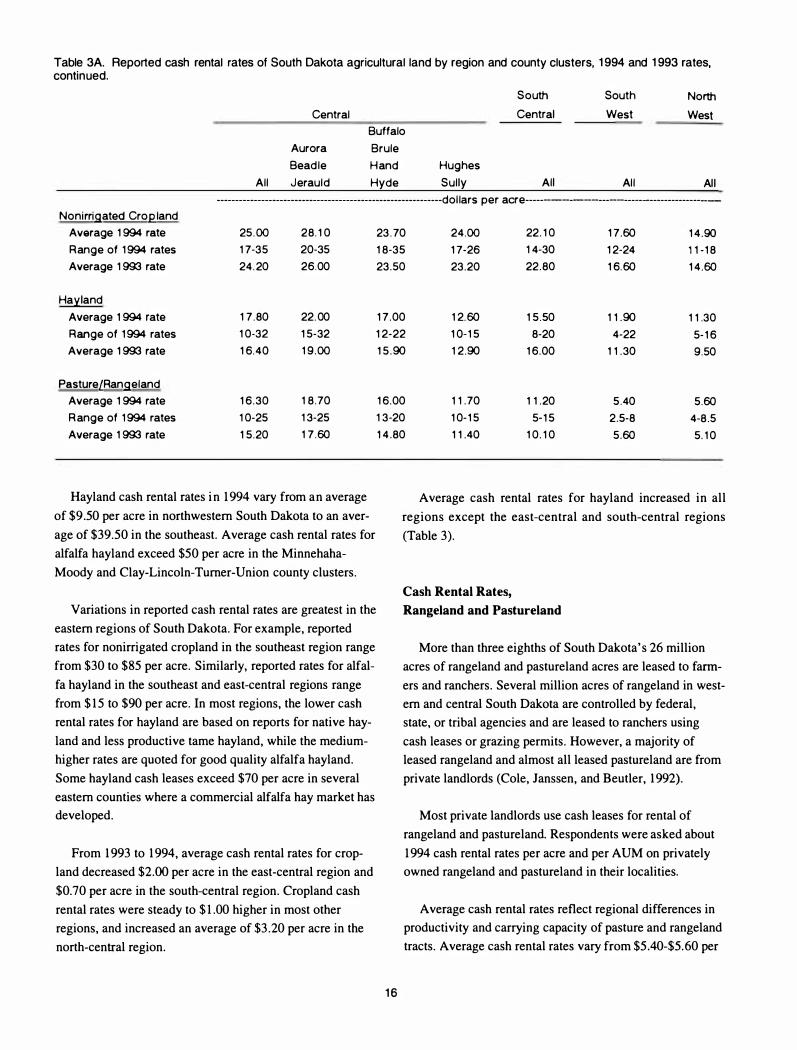
Table 3A. Reported cash rental rates of South Dakota agricultural land by region and county clusters, 1 994 and 1 993 rates, continued.
South South North
Central Central West West
Buffalo
Aurora Brule
Bead le Hand Hughes
All Jerauld Hyde Sully All Al l Al l -------------------------------------------------------------dol lars per acre---------------------------------------
Nonirrigated Cro�land
Average 1994 rate 25.00 28.10 Range of 1994 rates 17-35 20-35 Average 1993 rate 24. 20 26.00
Hayland
Average 1994 rate 17.80 22. 00 Range of 1994 rates 10-32 15-32 Average 1993 rate 16.40 19.00
PastureLRangeland
Average 1994 rate 16.30 18 .70 Range of 1994 rates 10-25 13-25 Average 1993 rate 15.20 17.60
Hayland cash rental rates in 1994 vary from an average
of $9.50 per acre in northwestern South Dakota to an aver
age of $39 .50 in the southeast. Average cash rental rates for
alfalfa hayland exceed $50 per acre in the Minnehaha
Moody and Clay-Lincoln-Turner-Union county clusters.
Variations in reported cash rental rates are greatest in the
eastern regions of South Dakota. For example, reported
rates for nonirrigated cropland in the southeast region range
from $30 to $85 per acre. Similarly, reported rates for alfal
fa hayland in the southeast and east-central regions range
from $15 to $90 per acre. In most regions, the lower cash
rental rates for hayland are based on reports for native hay
land and less productive tame hayland, while the medium
higher rates are quoted for good quality alfalfa hayland.
Some hayland cash leases exceed $70 per acre in several
eastern counties where a commercial alfalfa hay market has
developed.
From 1993 to 1994, average cash rental rates for crop
land decreased $2.00 per acre in the east-central region and
$0.70 per acre in the south-central region. Cropland cash
rental rates were steady to $1.00 higher in most other
regions, and increased an average of $3.20 per acre in the
north-central region.
23 . 70 24.00 22.10 17.60 14.90 18-35 17-26 14-30 12-24 1 1-18 23.50 23.20 22.80 16.60 14.60
17.00 12.60 15.50 11.90 11 .30 12-22 10-15 8-20 4-22 5-16 15.90 12.90 16.00 11.30 9.50
16.00 11.70 11.20 5 .40 5.60 13-20 10-15 5-15 2.5-8 4-8.5 14.80 11.40 10.10 5.60 5.10
16
Average cash rental rates for hayland increased in all
regions except the east-central and south-central regions
(Table 3).
Cash Rental Rates,
Rangeland and Pastureland
More than three eighths of South Dakota's 26 million
acres of rangeland and pastureland acres are leased to fann
ers and ranchers. Several million acres of rangeland in west
ern and central South Dakota are controlled by federal,
state, or tribal agencies and are leased to ranchers using
cash leases or grazing permits. However, a majority of
leased rangeland and almost all leased pastureland are from
private landlords (Cole, Janssen, and Beutler, 1992).
Most private landlords use cash leases for rental of
rangeland and pastureland. Respondents were asked about
1994 cash rental rates per acre and per AUM on privately
owned rangeland and pastureland in their localities.
Average cash rental rates reflect regional differences in
productivity and carrying capacity of pasture and rangeland
tracts. Average cash rental rates vary from $5.40-$5.60 per

acre in western South Dakota to $20.30-$20.90 in east-cen
tral and southeast South Dakota. The ranges of per-acre
cash rental rates are $2.50-$8.50 per acre in western South
Dakota and $ 14-$30 per acre in the east-central region (Fig
9, Table 3).
Animal Unit Month (AUM) is defined here as the
amount of forage required to maintain a mature cow with
calf for 30 days. An AUM is somewhat of a "generic" value
and should be about equal across regions. Therefore, private
cash lease rates quoted on a per-AUM basis should be
roughly equivalent in different areas of the state unless there
are major regional differences in forage availability, forage
quality, and demand for leased rangeland. Rangeland rates
per AUM in 1994 are fairly uniform across South Dakota,
averaging $ 14.80 per AUM in the north-central region to
$ 17 .00 per AUM in the south-central region. Statewide,
cash rental rates vary from $ 12 to $20 per AUM.
From 1991 to 1994, average cash rental rates per acre or
per AUM for rangeland have increased in all regions of
South Dakota. Cow-calf enterprises have generally been
profitable in this time period, and this is a major reason for
increased rental rates.
County Average Cash Rental Rates,
Cropland and Pasture / Rangeland
Fig 1 0. Average cropland cash rent by county, South Dakota, 1 994, dollars per acre.
$1 8.50 $1 5.90
-.,n,
$37. 10
-IIC( $15.40 $24.50
$23.70 $1 8. 1 0 $15.60
..-..u ..... "
$33.00
Fig 1 1 . Average pasture/rangeland cash rent by county,
... -$1 1 .90 $16.90
$5.30 $7.40
$5.00
$6.70 $7.70
A new feature in this report is county level information $6.60
on whole farm, cropland, and pasture land rents and values
provided by the South Dakota Agricultural Statistics
Service (SDASS) in a new report: South Dakota 1994
County Leve( Land Rents and Values (Appendix II). The
SDASS report is based on telephone survey responses from
2350 farm operators.
Based on SDASS data, 1994 county average cash rental
rates for cropland and pasture/rangeland are shown in Figs
10 and 1 1. Overall, the county average rental rates reported
in the SDASS survey are similar to the average cash rental
rates reported by county cluster (Table 3A, SDSU Farm
Real Estate Market Survey).
One major difference is that cropland cash rental rates
reported in the SDASS survey include nonirrigated and irri
gated cropland. This explains the relatively high cash rental
rates reported in Butte County, where a considerable
amount of cropland is irrigated.
1 7
$7.1 0 $5.50 $6.60
Average cash rental rates for cropland are between $63
and $73 per acre in Union, Lincoln, Clay, Minnehaha, and
Moody counties. Average cash rental rates are between $38
and $54 per acre in Yankton, Bon Homme, Hutchinson,
Turner, McCook, Lake, Brookings, Deuel, Hamlin,
Codington, Grant and Roberts counties. In other counties
east of the Missouri River, average cash rental rates are
between $18.80 and $36.20 per acre. Average cash rental
rates in most counties west of the Missouri River are
between $ 13.70 and $25.90 per acre (Fig 10).
Average cash rental rates for pasture/rangeland are
between $20 and $32 per acre in 12 eastern South Dakota
counties, and between $15 and $19.90 per acre in another 17

counties of eastern, central, and north-central South Dakota.
In most counties west of the Missouri River, average cash
rental rates are between $4 and $10 per acre (Fig 11 ).
RATES OF RETURN TO SOUTH DAKOTA'S
AGRICULTURAL LAND
Two approaches are used in the South Dakota Farm Real
Estate Market Survey to obtain information on current rates
of return to agricultural land.
First, respondents were asked to estimate the current net
rate of return (percent) that landowners in their localities
could expect, given current land values. Appraisers refer to
the current annual net rate of return as the market-derived
capitalization rate, which is widely used in the income
approach to farmland appraisal. The net rate of return is a
return to agricultural land ownership after deducting prop
erty taxes, maintenance, and other ownership expenses.
Most respondents reported net rates of return to cropland,
rangeland, or hayland ranging from 2.5% to 8.5%.
The statewide average estimated net rate of return on all
agricultural land declined from 6.6% in 1991 to 5.8% in
1992 and to 5.5% in 1993 and 1994. From 1991 to 1993, net
rates of return to agricultural land declined in all regions of
the state and for all land uses. Net rates of return were rela
tively stable from 1993 to 1994 (Fig 12, Table 4).
Average 1994 net rates of return were highest ( 5. 8 % ) for
nonirrigated cropland and lowest ( 5 .1 % ) for rangeland.
Average net rates of return to agricultural land varied from
4.9% in the southwest and south-central region to 5.9% in
the northeast region.
Second, respondents reported cash rental rates and esti
mated the value of leased land by land use. From this infor
mation, we calculated the rent-to-value ratio for each
response. This is a measure of the gross rate of return
obtained by landlords, before real estate expenses (property
taxes, insurance, maintenance, and related expenses) are
deducted. For most respondents, the calculated rent-to-value
ratio (gross rate of return) varied from 6.0% to 10.0% for
1 8
cropland, from 5.0% to 10.0% for rangeland, and from
5.5% to 10.5% for hayland.4
The statewide gro�s rate of return (rent-to-value ratio) to
nonirrigated cropland and hayland is 8.0%, while the range
land rent-to-value ratio is 7.0%. From 1992 to 1994, there
were minimal changes in regional rent-to-value ratios for
agricultural land. During this same period, the difference
between GROSS and NET rates of return to agricultural
land ownership has been 1.8-2. 1 percentage points (Table 4,
Fig 12). Most of the difference between gross returns and
net returns is caused by property tax levies.
The current average net rate of return of 5.5% is consid
erably lower than farmland mortgage interest rates of 7 .5%
to 9.0%. This implies that relatively large downpayment
requirements are necessary before farmland purchases can
be expected to cashflow from net returns. Fortunately, a
high percentage of current farmland purchases is financed
with equity capital and most debt financed purchases have
high downpayments. This cautious approach to debt financ
ing will help most farmland buyers avoid another financial
crisis.
4 The range of reported net rates of return and calculated rent-to
value ratios are shown for the middle 90% of responses for each
land use. This represents the practical range of reported net and
gross rates of return.
Fig 1 2. Estimated rates of return to agricultural land, state and region, 1 994.
NORTHWEST
5.8
7.2
SOUTHWEST
4.9 6.8
SOUTH CENTRAL
4.9 7.3
NORTH CENTRAL NORTH
5.6 EAST
7.7 5.9
CENTRAL
5.0
8.2
8.0
EAST CENTRAL
5.4
7.5
StateC : Net rate of return (percent) a = 5.5
Gross rate of return (percent) b = 7.6 a The net rate of return is the reporter's estimate of the percent rate of return to ownership (after payment of property taxes) given current land values. Appraisers often refer to it as the market capitalization rate. b The gross rate of return is calculated by dividing reporter's average gross cash rental rate by their reported land values and converting it to a percentage measure. c See table 4 for further details on estimated rates of return by region and type of agricultural land. Source: 1994 South Dakota Farm Real Estate Market Survey, SDSU.

Table 4. Estimated rates of return to South Dakota agricultural land by type of land and by region , 1 994, 1 993, 1 992, and 1 991 .
1 994 1 993 1 992 1 991 1 994 1 993 1 992 1 991
Type of Land-Statewidec GROSS rate of return (%)a NET rate of return (%)b
All agricultural land 7.5 7.6 7.6 7.7 5.5 5.5 5.8 6.6
Nonirrigated cropland 8.0 8. 1 8 . 1 8.2 5.8 5.9 6.3 6.8
Rangeland and
pasture land 7.0 7 . 1 7.0 7.2 5. 1 5 . 1 5 .3 6.3
Hayland 8.0 7.9 8.4 8.6 5.5 5 .4 5.8 6.8
Regiond GROSS rate of return (%) NET rate of return (%)
Southeast 7.5 7.7 7.7 7.9 5.8 5 .7 6.2 6.9
East Central 7.5 7.8 7.7 7.7 5.4 5.3 5 .8 6.4
Northeast 8 .0 7.9 8.7 8.4 5.9 5.9 6.8 7.1
North Central 7.7 8.0 8.2 8.4 5.6 6.3 6.1 7.3
Central 8.2 8. 1 7.8 8. 1 5 .0 5.5 5.3 6.4
South Central 7.3 7 . 1 7.2 7.3 4.9 5.0 5.8 7.5
Southwest 6.8 7.0 7.2 7.6 4.9 5 .0 4.8 5.2
Northwest 7.2 7.4 7.2 7.1 5.8 5.3 5.7 6.3
Source: 1 994 South Dakota Farm Real Estate Survey, SDSU
aGROSS rate of return (percent) is calculated by d ivid ing the average gross cash rental rate by their reported value of rental land .
bNET rate of return is the reporters estimate of the percentage rate of return to ownership given current land values. Appraisers often refer to this measure as the market capitalization rate.
estate level GROSS and NET rate of return estimates are calculated by weighting regional estimates by proportion of acres of each land use by region.
dRegional level GROSS and NET rate of return estimates are calculated by weighting rate of return estimates for each land use by proportion of the region agricultural acres in each land user.
The 1 994 regional and statewide GROSS and NET rates of return to all agricultural land are also reported in Figure 1 2 .
1 9

RESPONDENTS' ASSESSMENT OF
CHANGING FARMLAND MARKET CONDITIONS
In 1993, weather conditions in South Dakota were
unusually wet in most areas. Respondents to the 1994 sur
vey were asked open-ended questions about the impact of
the unusual weather conditions on agricultural land values,
rental rates, and rental practices in their localities.
Most comments from eastern South Dakota respondents
indicated cash rents and land values were marginally affect
ed by adverse production conditions. Some rental payments
were adjusted due to prevented plantings. Many renters
attempted to renegotiate cash rents downward but experi
enced considerable resistance from most landlords.
Landowner resistance to decreased rents is partly based on
rising property tax payments and ability to secure other
renters. Several survey reporters indicated some cash rental
rates were lowered or switched to share rental agreements in
flooded lowland areas and on some other marginal crop
land. However, more reporters indicated rental rates are
increasing (especially for good quality cropland that did not
flood) due to aggressive bidding by local renters.
Several respondents indicated good crop prices and low
interest rates continue to make cropland an attractive invest
ment, despite production losses on some cropland in 1992
and 1993. Federal disaster payments reduced losses of farm
operators and provided support for maintaining cropland
values. Furthermore, there is continuing investor interest in
cropland in southeastern and east-central South Dakota.
Respondent comments from the north-central and central
regions usually indicated land values and cash rents were
increasing, due to optimism from excellent yields, reason
ably good prices, and lower interest rates. Comments from
several western South Dakota respondents were about
increased rental rates for rangeland and concern that this
trend could not continue.
Comments on upward revaluation of agricultural land for
tax assessments came from respondents in most areas of
South Dakota. The increase in property taxes paid per acre
of agricultural land has been a major concern and factor in
the farm real estate market in the past 2-3 years.
AGRICULTURAL LAND VALUE EXPECTATIONS FOR 1994
Respondents were asked about their expectation of
changes in agricultural land values in 1994. Five eighths
(63%) of respondents expected NO CHANGE in land val
ues during 1994, and another 4% of respondents expected
decreases in agricultural land values. A fourth of all respon
dents expected agricultural land values to increase from 1 %
to 5%. A twelfth of all respondents expected more substan
tial increases in land values of +6% to +10%. The average
expected change in agricultural land values is +1.4%.
20
Many respondents commented that lower long-term
interest rates, reduced yields on other investments, and
favorable cropnivestock prices should stabilize or increase
agricultural land values in the next 12 months. Many
respondents from eastern South Dakota indicated another
poor crop year could lead to downward pressure on land
sale prices in their localities due to increased farm sales.
Overall, respondents' land market expectations for 1994
are similar to their expectations for last year. If respondents'
expectations for 1994 are realized, we will see another year
of stable to slight increases in agricultural land values and
probable declines in inflation-adjusted farmland values.
References
Cole, J . , L. Janssen, and M. Beutler. 1992. Rangeland leasing mar
kets in South Dakota. AES Bull 7 16. Brookings: SDSU.
Janssen, L. and B. Pflueger. 199 1 . South Dakota farm real estate
values and rental rates: 199 1 . Economics Research Report 9 1 -3.
Brookings: SDSU.
Janssen, L. and B. Pflueger. 1992. South Dakota agricultural land
values and rental rates: 1992. Economics Research Report 92- 1 .
Brookings: SDSU.
Janssen, L. and B. Pflueger. 1993. South Dakota agricultural land
values, cash rental rates, and cropshare rental practices: 1 993.
AES C 256. Brookings: SDSU.
Peterson, S.R. and L. Janssen. 1 988. Farmland leasing in South
Dakota. AES Bull 704. Brookings: SDSU.
South Dakota Agricultural Statistics Service. 1 994. South Dakota
1994 county level land rents and values. Sioux Falls, S.D.
U.S. Department of Agriculture. 1994 RID updates: agricultural
land values, no 2. Washington, D.C.
U.S. Department of Agriculture. 1993. Agricultural resources:
agricultural land values, situation and outlook summary. AR-30
and earlier issues. Washington, D.C.
Appendix I
Survey Methods and Respondent Characteristics
The primary purposes of the 1994 South Dakota Farm
Real Estate Market Survey were to obtain regional and
statewide information on: (1) 1994 per-acre agricultural
land values by land use and land productivity, and (2) 1994
cash rental rates by agricultural land use.
Copies of this survey were mailed to potential respon
dents about February 15 with a followup mailing on March
10. Potential respondents were persons employed in one of
the following occupations: (1) agricultural lenders (senior
agricultural loan officers of commercial banks, Farmers
Home Administration, or Farm Credit Banks), (2)
Cooperative Extension Service agricultural agents and farm
management field staff, and (3) licensed appraisers (includ
ing members of professional rural appraisal and farm man
agement societies). Some appraisers were primarily realtors,
auctioneers, or professional farm managers.
The useable survey response rate was 38% of 605 per
sons contacted. The distribution of 228 respondents by
reported occupation is shown in Appendix Table 1. Nearly
65% of Extension agents, 41 % of agricultural lenders, and
25% of licensed appraisers contacted provided usable
responses. The usable response rate of licensed appraisers
was considerably lower because many appraisers are pri
marily involved with residential and commercial real estate.
Fifty-three percent of respondents were from the eastern
regions of South Dakota, 28% were from the three regions
of central South Dakota, and 18% were from western South
Dakota. Most respondents were able to supply land value
and cash rental rate information for nonirrigated cropland,
rangeland, and hayland in their localities. However, only
30% of respondents provided data on irrigated land values
and 25% provided data on irrigated land cash rental rates.
Regional average land values by land use are simple
average (mean) values of usable responses. All-agricultural
21
land values, statewide and regional, and statewide average
land values by land use are weighted by the relative number
of acres in each agricultural land use. This approach has
important implications in the derivation of statewide aver
age land values and regional all-land values. For example,
the three eastern regions of South Dakota with the highest
average land values have nearly 45% of the state' s cropland
acres, 27% of all-agricultural land acres, and only 10% of
rangeland acres. Consequently, the relative importance of
various regions on statewide cropland, rangeland, and all
land values varies greatly by land use.
We believe this weighted average approach to statewide
land values is preferable to a simple average (mean) of all
responses. Our approach increases the relative importance
of western South Dakota land values in the final computa
tions and results in lower statewide average land values.
The weighting factors used to develop statewide average
land values are based on estimates of agricultural land use
for privately owned farmland in South _Dakota. It excludes
agricultural land (mostly rangeland) leased from tribal or
federal agencies, which primarily occurs in the western and
central regions of the state. The weighting factors were
developed from county-level data on taxable agricultural
acres, farmland use data from the 1987 South Dakota
Census of Agriculture, and other sources.
Comparisons between land values from 1991 to 1994 (by
land use and region) are based on summary statistics (mean,
range, etc.) from each annual survey. Consequently, the per
centage changes in land values reported in this publication
are based on "actual" dollar values reported in each survey.
This reported percentage change often differs from the per
centage change estimated by each respondent. However, the
respondents' perceptions of changes are a useful cross
check to their reports of specific dollar amounts.

Appendix Table 1 . Selected characteristics of respondents.
Numbe r of re spondent s = 228
Responden t s :
Reporting locat i on N % Primary Occupat i on N %
Southeas t 4 6 20 . 2 Banker/ loan off i ce r 127 5 5 . 7 Ea s t Cent ral 44 19 .3 Northe a s t 3 1 1 3 . 6 Appra i s e r / real tor 57 2 5 . 0 North Cent ra l 2 3 10 . 1 Cent ra l 2 6 1 1 . 4 Extens ion Agents 44 19 . 3 South Cen t ra l 16 7 . 0 Southwe s t 20 8 . 8 228 100 . 0 Northwes t 2 2 9 . 6
228 100 . 0
Re sponse rates :
Cash Land values _lL % Rental Rates _lL %
Dryland c ropland 2 18 9 5 . 6 Dryland c ropland 2 17 9.5 . 2
Irriga t ed l and 68 2 9 . 8 Irrigated land 5 7 2 5 . 0 Hayland 1 7 7 7 7 . 6 Hayland 183 80 . 3 Range land ( na t i ve ) 202 88 . 6 Range l and Pas ture ( tame ) 148 64 . 9 pe r a c re 1 8 1 7 9 . 4
per AUM 74 32 . 4
Source : 1 994 South Dakota Farm Rea l Es tate Market Survey .
22

Appendix II
1994 County Level Land Rents and Values
SOUTH DAKOTA
1994 COUNTY LEVEL
LAND RENTS AND VALVES
INTRODUCTION
The N ation a l Agr icu ltura l Statistics Serv ice ( N ASS) o f USDA
cond ucts an annua l survey of farmers and ranchers to o bta in
va lue o f l and and renta l rates i n their loca l it ies . The survey is
des igned to provide state level l and values and cash rents .
Th is year the South D akota o ffice of NASS has conducted an
expanded survey to p rovid e county level stat ist ics o n cash rents
and l and va lues . This additiona l d ata was funded by the South
D akota Leg is l ature .
Apprec iat ion is expressed to a l l survey partic ip ants who
provided the d ata o n which th is repo rt is based .
THE 1 994 SURVEY
In South D akota a sample o f 450 o perato rs was used to o bta in
d ata for state leve l rents and va lues . To p rovide co unty leve l i nform atio n , an additi ona l samp le o f 3 , 300 farm operators was
d rawn .
The survey was conducted by te lephone d ur ing February a n d e a r l y M arch . There were 2 , 3 5 0 repo rts tabu l ated . The d ata
publ ished here are rounded averages of the rep o rted va lues.
They are not o ffic i a l estimates .
THE DATA I n formation shown in th is report inc ludes n umber of repo rts,
m in imum and maximum renta l rates, average renta l rates, and
average va lue o f rented land. A lso shown is the rat io o f rent to rental property va lue (expressed in percent ) .
The m in imum and m ax imum show t h e r a n g e in each county .
Th is r a n g e i s affected by t h e d ivers ity o f l an d in t h e cou nty, such as amou nt o f t i l l ab le l a n d , avai lab i l ity of rental l and ,
average s ize o f fa rms , amount o f i r r igated l a n d , etc . T h e rental
rate as a percentage o f the average value o f the l and i s g iven to
show the re lat ion between the rents and the va lue o f rented
l a n d .
OTHER AGRICULTURAL
LAND VALUE REPORTS The Economic Research Serv ice (ERS) of the U SDA publ i shes state l evel estimates for l a n d va lues , renta l rates and rent to va lue percents. These d ata .are not part of th is county leve l report but are ava i l ab le upon request.
23
Apri l 1 994
1 994 CROPLAND AVERAGE RENTS
Dol l ars Per Acre
D s1 0.oo to s1 9.99 � $20.00 to $24.99
§ $25.00 to $39.99 ffl $40.00 to $75.00
1 994 PASTURELAND AVERAGE RENTS
Dollars Per Acre
D $4.oo to ss.49 � $6.50 to $9.99 Q $1 0.00 to $1 4.99
1§ $1 5.00 to $1 9.99 I $20.00 to $32.00

COUNTY
BU TIE CORSON DEWEY HARD ING PERKINS Z IEBACH
BROWN CAMPBELL EDMUNDS FAULK MCPH ERSON POTIER SPINK WALWORTH
CLARK COD INGTON DAY DEUEL GRANT HAMLIN MARSHALL ROBERTS
HAAKON JACKSON LAWRENCE MEADE PENNIN GTON STAN LEY
AURORA BEAD LE BRU LE BUFFALO HAND HUGHES HYDE JERAULD SULLY
BROOKINGS DAVISON HANSON KINGSBURY LAKE MCCOOK MINER MINNEHAHA MOODY SANBORN
BENNETI CUSTER FALL RIVER SHANNON
GREGORY JONES LYMAN MELLETIE TODD TRI PP
BON HOMME CHARLES M IX CLAY DOUGLAS H UTCH INSON LINCOLN TURNER UNION YANKTON
1 / INS UFFICIENT D ATA.
Page 2
WHOLE FARM CASH RENT AVERAGE CASH RENT AND AVERAGE VALUE PER ACRE,
BY COUNTY, SOUTH DAKOTA, 1994 N UMBER MINIMUM MAXIMUM AVERAGE
AVERAGE
OF RENT RENT RENTAL VALUE
REPORTS REPORTED REPORTED RATE OF RENTED LAND
N UMBER - - - - - - - - - - - - - - - DOLLARS PER ACRE - - - - - - - - - - - - - - -
9 3 . 50 80 . 00 29 .50 331 . 00 1 3 6 .00 25.00 1 2 . 20 1 72 . 00
5 6 .00 20.00 1 1 . 60 1 27 . 00 7 3 . 00 20.00 8 .90 1 03.00
1 6 6 .00 20 .00 1 1 . 60 1 5 1 . 00 1 0 4 .50 1 5 . 00 .8 .70 1 22 .00 1 9 20. 00 45.00 31 . 30 446.00 1 8 1 0. 00 30.00 1 8. 50 232 .00 1 4 1 2 . 00 40.00 1 9 . 80 25 2 . 00 1 6 1 1 . 00 30 . 00 1 9 . 60 242.00 1 6 1 4 .00 25 .00 1 8. 50 226 .00 1 7 1 5 . 00 4 2 . 50 24. 30 326.00 1 6 1 8. 00 37 . 50 2 7 . 00 366 .00 1 2 1 1 . 00 37.50 20.00 298.00 1 3 20.00 40.00 2 7 . 20 353.00 1 9 22 . 00 45 . 00 33. 30 420 . 00 1 5 20.00 40. 00 28. 1 0 337 . 00 2 1 25 .00 70. 00 43. 80 505 . 00 1 2 33.00 60. 00 44. 60 556.00 1 6 30 . 00 60.00 44 . 40 556.00 1 7 1 0 . 00 45 . 00 2 7 . 70 358 . 00 1 7 30 . 00 6 2 . 50 43.40 483.00
5 7 . 00 1 5 . 00 1 1 . 1 0 1 67 . 00 7 4 . 50 1 8 . 50 9 . 60 1 58 . 00
1 0 8 .00 40. 00 1 9 . 1 0 357 .00 9 4 . 00 40 . 00 1 3. 30 229 .00
1 / 1 / 1 / 1 / 1 / 8 6 .00 20.00 1 3. 90 1 7 2. 00
1 6 1 5 . 00 40.00 24. 80 3 1 3 . 00 26 1 5 . 50 40.00 25 .90 324.00 22 1 5 . 00 32 .00 2 1 . 00 2 9 7 . 00 1 7 9 . 00 35 . 00 1 7 . 30 2 1 2 . 00 2 1 1 2 . 00 25 .00 1 8 . 80 237.00 20 1 4 . 00 3 2 . 50 1 8 . 70 262 . 00 1 6 1 0 . 00 1 8. 00 1 4 .50 1 98.00 29 1 3 . 00 25 .00 1 9 . 40 260 . 00 1 1 1 6 . 50 30. 00 2 2 . 00 348 .00 1 9 33.00 65 . 00 46.00 586 . 00 1 4 22 .00 35.00 29 . 1 0 438 . 00 1 3 2 2 . 50 40.00 33. 80 472 . 00 2 1 2 2 . 00 50.00 33. 70 450.00 1 5 32 .50 60. 00 45 . 00 604. 00 1 4 25 .00 60.00 40. 90 599 .00 25 1 7 . 50 40.00 2 8 . 30 365 .00 1 9 30 . 00 90.00 58 .90 8 1 2 . 00 1 5 36.00 90.00 6 2 . 70 881 . 00 1 7 1 3. 50 3 2 . 50 24 . 60 328.00
5 7 . 00 25 .00 1 2 . 90 1 67 . 00 6 5 . 00 20.00 1 0. 20 1 57 . 00 6 3 .00 50.00 1 4. 30 1 65 . 00 4 1 0 . 00 2 1 . 00 1 6. 50 1 84 . 00
1 2 20 . 00 35.00 24.60 350 . 00 9 6 .00 1 8. 00 1 1 . 50 226.00
1 0 1 0.00 25 . 00 1 7. 60 264.00 1 1 5 . 00 20.00 1 1 . 1 0 1 44 . 00
9 1 0. 00 1 5 . 00 1 2 . 1 0 206. 00 1 5 1 5 . 00 25.00 1 8. 30 263.00
23 25.00 5 7 . 50 3 7 . 30 530 . 00 25 1 5 . 00 50.00 30. 90 420.00 26 50.00 1 00 . 00 68 .90 865. 00 2 1 25 .00 40.00 3 1 . 1 0 4 1 7 . 00 1 6 28.00 80.00 38 .60 528.00 20 50.00 1 00 . 00 74. 40 989 . 00 20 35 .00 75 .00 54. 20 743.00 24 60. 00 90.00 7 1 . 90 906 . 00 1 9 1 7 . 00 75 .00 45 . 50 668.00
RENT AS PERCENT
O F VALUE
PERCENT
8 . 9 7 . 1 9 . 1 8 . 7 7 . 7 7 . 1 7 . 0 8 . 0 7 . 9 8. 1 8 . 2 7 . 5 7 . 4 6 . 7 7 . 7 7 . 9 8 . 3 8 . 7 8. 0 8 . 0 7 . 8 9 . 0 6 . 6 6 . 1 5 . 4 5 . 8 1 /
8 . 1 7 . 9 8 . 0 7 . 1 8 . 2 7 . 9 7 . 2 7 . 3 7 . 5 6 . 3 7 . 9 6 . 7 7 . 2 7 . 5 7 . 4 6 . 8 7 . 7 7 . 3 7 . 1 7 . 5 7 . 7 6 .5 8 .6 9 .0 7 .0 5 . 1 6 . 6 7 . 7 5 . 9 6 . 9 7 . 0 7 . 4 8 . 0 7 . 5 7 . 3 7 . 5 7 . 3 7 . 9 6 . 8
COUNTY RENTS, Apri l 1 994 SOUTH DAKOTA AGRICULTURAL STATISTICS SERVICE

COUNTY
BU TIE CORSON DEWEY HARDING PERKINS Z IEBACH
BROWN CAMPBELL EDMUNDS FAULK MCPHERSON POTIER SPINK WALWORTH
CLARK CODINGTON DAY DE.UEL GRAN, HAMLIN MARSHALL ROBERTS
HAAKON JACKSON LAWRENCE MEADE PENNIN GTON STAN LEY
AURORA BEADLE BRULE BUFFALO HAND HUGHES HYDE JERAULD S ULL'<
BROOKINGS DAVISON HANSON KINGSBURY LAKE MCCOOK M INER MINNEHAHA MOODY SANBORN
BENNETI CUSTER FALL RIVER SHANNON
GREuORY JONES LYMAN MELLETIE TODD TRIPP
BON H O M ME CHARLES MIX CLAY DOUGLAS H UTCH INSON LINCOLN TURNER UN ION YANKTON
CROPLAND CASH RENT AVERAGE CASH RENT AND AVERAGE VALUE PER ACRE,
BY COUNTY, SOUTH DAKOTA, 1994
N UMBER MIN IMUM MAXIMUM AVERAGE AVERAGE
OF RENT RENT RENTAL VALUE
REPORTS RE PORTED REPORTED RATE OF RENTED LAND
N UMBER - - - - - - - - - - - - - - - DOLLARS PER ACRE - - - · · - - - · · · · - - - -
7 1 5 . 00 55 .00 37 . 1 0 452.00 25 9 .00 25 .00 1 6 . 30 1 64 . 00 1 8 1 1 .00 20. 00 1 5 . 30 1 73.00 1 3 1 0. 00 30 . 00 1 8. 50 1 57 . 00 20 8 . 00 25.00 1 5 . 90 1 77 . 00 23 6 .00 20.00 1 3. 70 1 73.00 40 1 8. 75 50.00 34 . 40 478.00 37 1 3.00 30.00 2 1 . 80 265 .00 37 1 3.00 35 . 00 21 . 00 266 .00 36 1 0.00 35.00 21 . 20 25 1 00 36 1 4.00 32 .50 1 9 . 30 220.00 38 1 5 .00 35 . 00 25 . 00 348.00 39 20.00 40.00 30 . 60 376.00 44 1 7 . 50 35 .00 24.00 3 1 0 . 00 3 1 20.00 50.00 30. 30 35 2 . 00 35 25 .00 57 .50 38.00 455 . 00 34 22 .50 45.00 31 . 90 340.00 38 32 .50 60.00 46. 40 5 2 1 . 00 34 30.00 65.00 46.90 630 .00 35 30.00 50.00 4 2 . 00 531 . 00 36 2 2 . 00 60.00 33. 60 401 . 00 37 20.00 67 .50 44. 1 0 565 .00 1 9 9 . 00 25.00 1 5 . 40 2 1 7 . 00 20 8 .00 2 2 . 00 1 5 . 40 1 75 . 00 1 3 1 0 .00 50. 00 24. 50 331 . 00
8 1 0. 00 32 .50 1 5 . 40 2 1 8.00 6 8 . 50 25 .00 1 7. 30 273.00
1 4 1 0.00 35.00 1 8 . 60 2 7 1 .00 25 1 6.00 38.00 2 5 . 80 309 . 00 4 1 20.00 50.00 29 .50 360.00 33 1 6. 00 32 .00 24.70 337 . 00 24 8.00 27 .00 1 8. 80 234 . 00 29 1 6. 50 2 7 . 50 2 1 . 90 262.00 30 1 5 .00 30.00 24. 20 325.00 26 1 5 .00 25 . 00 1 9 . 90 234 .00 36 1 5 . 00 30.00 2 2 . 30 276.00 3 7 1 6. 50 35 .00 26. 1 0 367 . 00 3 1 30. 00 70.00 48. ,?0 595 .00 30 25 .00 40.00 3 1 . 50 41 8 .00 28 2 2 . 50 45.00 36. 20 460.00 33 25 .00 50.00 36.90 478.00 32 30.00 80.00 47 . 90 600.00 3 2 25 .00 65.00 40. 80 569 .00 35 20.00 45.00 30. 90 376.00 32 40.00 1 00.00 63. 50 878.00 34 45. 90 90.00 67. 20 883.00 25 1 7.50 40.00 28. 20 352 . 00 2 6 1 5 .00 22 . 50 1 8. 1 0 243.00
5 1 0.00 50.00 24. 20 274.00 6 8.00 50.00 23 . 70 1 83 .00
1 7 1 5.00 25.00 1 9 . 1 0 2 1 2.00 24 · 1 7.50 37 . 50 25 .90 344.00 2 3 9 . 00 40. 00 20. 80 302 .00 3 2 1 0.00 27 .50 20. 90 34 1 .00 2 7 1 0.00 26.00 1 4 . 60 1 88.00 24 1 0.00 25.00 1 5 . 60 220.00 23 1 0:00 27.50 20. 70 300.00 4 1 30.00 45.00 39 . 60 550.00 37 25 .00 l5.00 33 .30 408.00 36 45 .00 1 00.00 69.70 887 .00 38 2 2 . 50 4 2 . 50 3 2 . 00 394.00 4 1 28 .00 55.00 40.30 543.00 40 5 7 . 50 97 .50 7 2 . 80 976.00 40 37.50 70.00 54. 00 750.00 3 3 45.00 90.00 7 2 . 80 9 1 5 . 00 37 30.00 90.00 49.40 752.00
RENT AS PERCENT
OF VALUE
PERCENT
8. 2 9 . 9 8 . 8
1 1 . 8 9 . 0 7 . 9 7 . 2 8 . 2 7 . 9 8 . 5 8 . 8 7 2 8. 1 7 . 8 8 . 6 8 . 4
9 . 4 8. 9 7 . 5 7 . 9 8 . 4 7 . 8 7 . 1 8 . 8 7 . 4 7 . 0 6 . 4 6 . 9 8 . 3 8 . 2 7 . 3 8 .0 8 . 3 7 . 4 8 . 5 8 . 1 7 . 1 8 . 1 7 . 5 7 . 9 7 . 7 8 . 0 7 . 2 8 . 2 7 . 2 7 . 6 8 .0 7 .4 8 .8
1 2 . 9 9 . 0 7 . 5 6 .9 6 . 1 7 . 8 7 . 1 6 . 9 7 . 2 8 . 2 7 . 9 8 . 1 7 . 4 7 . 5 7 .- 2 7 . 9 6 . 6
SOUTH DAKOTA AGRICULTURAL STATISTICS SERVICE Page 3
COU NTY RENTS , Apri l 1 9 94

COUNTY
BUTTE CORSON DEWEY HARDING PERKINS ZIEBACH
BROWN CAMPBELL EDMUNDS FAULK MCPHERSON POTTER SPINK . WALWORTH
CLARK COD INGTON DAY DEUEL GRANT HAMLIN MARSHALL ROBERTS
HAAKON JACKSON LAWRENCE MEADE PENNINGTON STANLEY
AURORA BEADLE BRULE BUFFALO HAND H UGHES HYDE .JERAULD SULLY
BROOKINGS DAVISON HANSON KINGSBURY LAKE MCCOOK MINER MINNEHAHA MOODY SANBORN
BENNETT CUSTER FALL RIVER SHANNON
GREGORY JONES LYMAN MELLETTE TODD TRIPP
BON" HOMME CHARLES MIX CLAY DOUGLAS H UTCHINSON LINCOL� TURNER UNION YANKTON
Page 4
PASTURELAND CASH RENT AVERAGE CASH RENT AND AVERAGE VALUE PER ACRE,
BY COUNTY, SOUTH DAKOTA, 1994 NUMBER MIN IMUM MAXIMUM AVERAGE AVERAGE
OF RENT RENT RENTAL VALUE
REPORTS REPORTED REPORTED RATE OF RENTED LAND
NUMBER - - - - - - - - - - - - - - - DOLLARS PER ACRE - - - - - - - - - - - - - - -
1 4 1 .00 1 0. 00 5.00 1 1 0. 00 23 4.00 1 3.00 6 . 80 1 02 . 00 20 3 . 00 8 . 00 5 . 30 97 .00 22 1 . 50 1 5 . 00 5 . 30 76.00 21 3 .00 1 3. 50 7 .40 87.00 27 2 . 69 1 7 .00 5 . 60 84. 00 30 1 0. 00 2 7 . 50 1 6. 20 234.00 33 7 . 35 1 5 .00 1 0. 90 1 32 .00 34 9 . 00 2 1 .00 1 3. 30 1 94 .00 37 3 . 50 22 .00 1 2 . 90 1 78 . 00 36 3 . 50 1 9 . 00 1 1 . 90 1 66 . 00 33 8 . 00 1 9 .50 1 1 . 60 1 80.00 34 9 . 50 2 7 . 50 1 7 . 1 0 2 2 1 . 00 35 4 .00 1 6. 00 1 0. 90 1 49 .00 33 1 3 . 50 2 7 . 50 1 8. 5 0 2 1 8 .00 33 1 0.00 25.00 1 8.70 245 . 00 33 8 . 50 25 .00 1 5 . 60 2 1 5 . 00 35 1 3. 00 35 .00 20. 20 276.00 2 1 1 2 .00 2 2.50 1 7. 70 250.00 34 1 5 . 00 40.00 2 1 . 30 286.00 30 1 0. 00 30 . 00 1 6. 90 2 1 3 .00 25 1 0 . 00 30.00 1 6. 30 2 2 9 . 00 2 1 2 .00 1 5 .00 7 . 00 1 24 .00 23 3 . 00 8. 50 5 . 20 96.00 1 7 4 . 00 1 2 . 50 7 . 70 223 .00 24 3 . 00 2 2 . 50 6 . 70 1 1 7 .00 1 6 3 .00 1 2 . 00 6 . 80 1 3 1 .00 1 6 1 .00 1 0.00 6 . 30 1 09.00 27 1 0. 00 2 1 . 50 1 6. 50 240,00 43 1 5 . 00 25.00 1 9 . 30 266.00 30 7 .00 2 1 . 00 1 5 ,00 236.00 26 5 . 00 1 5 . 00 1 0. 70 1 40.00 31 1 0. 00 20.00 1 4. 70 1 84.00 31 5 . 00 1 7 . 00 1 1 . 40 1 79.00 2 9 5 . 00 20.00 1 2 . 1 0 1 47 . 00 40 1 0. 00 20.00 1 5. 60 205. 00 3 1 5 . 50 20.00 1 1 .40 1 93 .00 26 1 0. 00 45.00 2 3 . 80 323.00 29 1 1 . 25 25 .00 1 9. 1 0 279 .00 25 1 0. 00 35.00 2 1 . 20 324.00 32 1 3. 5 0 35 .00 2 2.40 331 . 00 28 1 5 .00 35 .00 2 2. 1 0 347.00 27 8 . 00 35.00 2 1 . 1 0 339.00 36 1 5 . 00 25 . 50 20.80 292 .00 28 1 1 . 00 40.00 2 6 . 20 4 1 7.00 26 1 2.50 40.00 2 5 . 90 387.00 28 1 3. 50 25.00 1 7.70 273.00 2 1 3 . 00 1 0.00 5 . 50 1 1 8.00 1 4 2 . 50 1 5 . 00 6 . 60 1 61 . 00 1 3 3 . 00 25 .00 7 . 1 0 94.00 1 4 3 .00 8 . 50 4 . 90 86.00 23 8 . 00 20.00 1 3. 30 1 90.00 26 4 .00 1 5 .00 8. 1 0 1 47 . 00 27 3 . 00 1 5 .00 9 . 90 1 63 .00 28 4 .00 1 5 . 00 6 . 20 1 09 .00 30 3 . 00 1 5.00 6·. 60 1 47.00 2 7 6 .75 20.00 1 2 . 60 204.00 31 9 .00 30.00 2 1 . 40 334.00 31 8 . 00 28.00 1 8. 90 2 6 1 .00 1 7 1 1 . 50 45.00 2 3. 1 0 3i4.00
32 1 2. 50 30.00 1 9.90 273.00 34 1 5. 00 35.00 2 2 .50 308.00 1 8 1 4.00 55.00 32.00 492.00 28 1 0. 00 35 .00 2 3 . 80 374.00 1 9 1 0.00 40.00 28.00 407.00 30 1 0.00 40.00 1 9. 1 0 3 2 3.00
RENT AS PERCENT
OF VALUE
PERCENT
4.5 6. 7 5 . 5 7.0 8 . 5 6 . 7 6 . 9 8. 2 6 . 9 7 . 2 7 . 2 6.4 7.7 7.3 8.5 7.6 7 . 3 7 . 3 7 . 1 7.4 7 . 9 7. 1 5 . 6 5 . 4 3 . 4 5 . 8 5. 1 5 . 8 6 . 9 7 . 3 6 . 3 7 : 6 8.0 6.3 8.2 7.6 5 . 9 7 . 4 6 . 9 6 . 5 6 . 8 6 .4 6 .2 7 . 1 6 . 3 6 . 7 6 .5 4.6 4. 1 7 . 6 5 . 7 7 . 0 5 . 5 6 . 0 5 . 7 4.5 6 . 2 6.4 7 . 2 7 . 1 7 . 3 7 . 3 6.5 6.4 6.9 5 . 9
COUNTY RENTS, April 1 994 SOUTH DAKOTA AGRICULTURAL STATISTICS SERVICE

Published in accordance with an act passed in 1 881 by the 1 4th Legislative Assembly, Dakota Territory, establishing the Dakota Agricultural College and with the act of re-organization passed in 1 887 by the 1 7th Legislative Assembly, which established the Agricultural Experiment Station at South Dakota State University. South Dakota State University is an Affirmative Action/Equal Opportunity Employer (Male/Female) and offers all benefits, services, education and employment opportunities without regard for .ancestry, age, race, citizenship, color, creed, religion, gender, disability, national origin, sexual preference, or Vietnam Era veteran status.
1 ,000 copies printed by the Agriwture Experiment Station, at a cost of $1 . 16 each. AX129 7-94